Establishing Molecular Methods to Quantitatively Profile Gastric Diet Items of Fish-Application to the Invasive Blue Catfish (Ictalurus furcatus) ...
←
→
Page content transcription
If your browser does not render page correctly, please read the page content below
Establishing Molecular Methods to Quantitatively Profile
Gastric Diet Items of Fish—Application to the Invasive Blue
Catfish (Ictalurus furcatus)

Open-File Report 2019–1021

U.S. Department of the Interior
U.S. Geological Survey
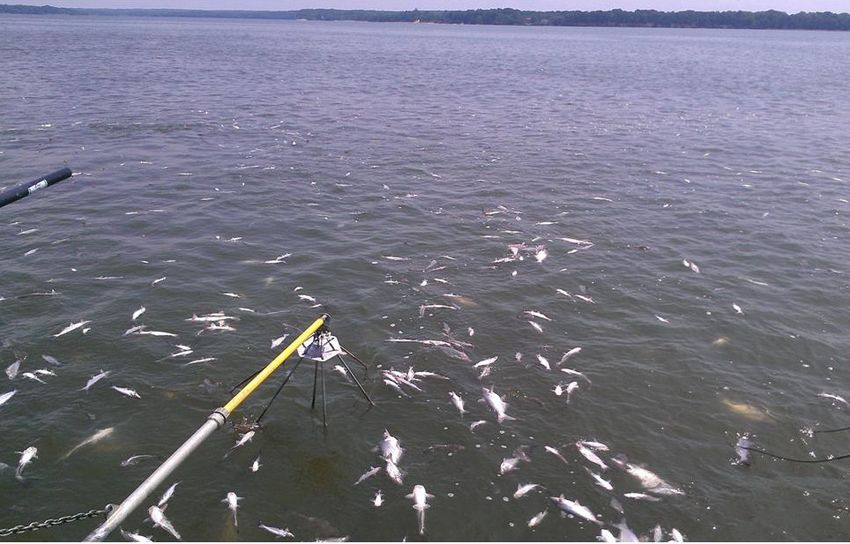
Cover. Photo of result of low-frequency electrofishing on the tidal Potomac River near Washington D.C. This
photograph was taken using a GoPro camera mounted on a 20 foot staff, photograph by Maryland Department
of Natural Resources, Fisheries Service.
Establishing Molecular Methods to
Quantitatively Profile Gastric Diet Items
of Fish—Application to the Invasive Blue
Catfish (Ictalurus furcatus)

By Deborah D. Iwanowicz, William B. Schill, Lakyn R. Sanders, Tim Groves, and
Mary C. Groves

Open-File Report 2019–1021

U.S. Department of the Interior
U.S. Geological Survey
U.S. Department of the Interior
DAVID BERNHARDT, Acting Secretary
U.S. Geological Survey
James F. Reilly II, Director

U.S. Geological Survey, Reston, Virginia: 2019

For more information on the USGS—the Federal source for science about the Earth, its natural and living
resources, natural hazards, and the environment—visit https://www.usgs.gov or call 1–888–ASK–USGS.
For an overview of USGS information products, including maps, imagery, and publications,
visit https://store.usgs.gov.

Any use of trade, firm, or product names is for descriptive purposes only and does not imply endorsement by the
U.S. Government.

Although this information product, for the most part, is in the public domain, it also may contain copyrighted materials
as noted in the text. Permission to reproduce copyrighted items must be secured from the copyright owner.

Suggested citation:
Iwanowicz, D.D., Schill, W.B., Sanders, L.R., Groves, T., and Groves, M.C., 2019, Establishing molecular methods to
quantitatively profile gastric diet items of fish—Application to the invasive blue catfish (Ictalurus furcatus): U.S. Geo-
logical Survey Open-File Report 2019–1021, 15 p., https://doi.org/10.3133/ofr20191021.

ISSN 2331-1258 (online)
iii

Acknowledgments
The authors would like to thank John Young for his creation of the map and the Maryland
Department of Natural Resources (MD DNR) for collecting all fish samples. Fish collections,
protocols, and permits were authorized by the MD DNR.
v

Contents
Abstract............................................................................................................................................................1
Introduction.....................................................................................................................................................1
Methods...........................................................................................................................................................2
     Field Collections.....................................................................................................................................2
     DNA Extraction.......................................................................................................................................3
     Targeted Amplification of Mitochondrial Regions............................................................................3
     Generation of Mock Library Samples.................................................................................................4
     Sequencing Library Preparation and Quality Assessment.............................................................5
     Read Filtering, Trimming, and RNAseq Metabarcoding Assembly................................................5
     Reference Database and Taxonomic Analysis.................................................................................5
     Primers and Real-Time PCR (Control Gene qPCR) ..........................................................................6
Results ..............................................................................................................................................................6
     Sequencing Output................................................................................................................................6
     Mock Stomach Samples.......................................................................................................................7
     Blue Catfish Stomach Samples...........................................................................................................7
     qPCR Assay Optimization.....................................................................................................................7
Discussion......................................................................................................................................................10
References Cited..........................................................................................................................................12
Appendix 1. Species with Accession Number and Sequence..........................................................15
        Available online as PDF file at https://doi.org/10.3133/ofr20191021
vi
Figures
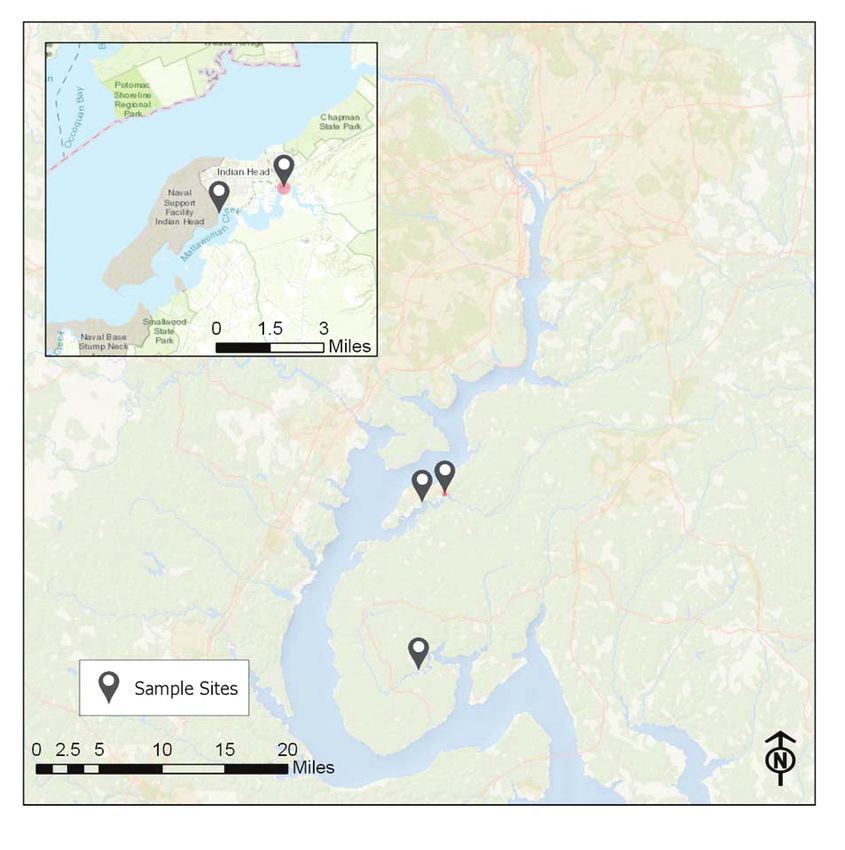
1. Map showing three sites where Ictalurus furcatus (blue catfish) were
collected from major tributaries of the Potomac River...........................................................3
2. Graphs showing average proportion of mapped reads and number of stomach
samples in which prey species were detected in Ictalurus furcatus (blue
catfish) with the mt12S primer set, by recovered A, fish species and B, fish
genera..............................................................................................................................................8
3. Graphs showing average proportion of mapped reads and number of stomach
samples in which prey species were detected in Ictalurus furcatus (blue
catfish) with the mt16S primer set, by recovered A, fish species and B, fish
genera..............................................................................................................................................9
4. Graph showing threshold values in relation to counts generated by assaying
fish samples with the Perca flavescens (yellow perch) real-time polymerase
chain reaction assay...................................................................................................................10
Tables
1. Length, weight, and collection date for 12 Ictalurus furcatus collected from
the site at either Mattawoman Creek or Nanjemoy Creek in Maryland...............................4
2. Data on seven field-collected fish species archived at the laboratory and used
for the mock library.......................................................................................................................4
3. Fish species whose genomic DNA was used to verify the specificity of the
real-time polymerase chain reaction for Perca flavescens...................................................6
4. Seven fish species included in mock samples along with the percent
contribution they were found in the DNA assemblage...........................................................7
5. Concentration of primers and probe used for the detection of Perca
flavescens (yellow perch) in real-time polymerase chain reaction assay........................10vii
Conversion Factors
U.S. customary units to International System of Units
International System of Units to U.S. customary units
Multiply By To obtain
Length
millimeter (mm) 0.03937 inch (in.)
Volume
liter (L) 33.81402 ounce, fluid (fl. oz)
liter (L) 2.113 pint (pt)
liter (L) 1.057 quart (qt)
liter (L) 0.2642 gallon (gal)
Mass
gram (g) 0.03527 acre-foot per day (acre-ft/d)
Temperature in degrees Celsius (°C) may be converted to degrees Fahrenheit (°F) as follows:
°F = (1.8 × °C) + 32.
Temperature in degrees Fahrenheit (°F) may be converted to degrees Celsius (°C) as follows:
°C = (°F – 32) / 1.8.
Abbreviations
A adenine
BLAST Basic Local Alignment Sequence Tool
bp base pairs
C cytosine
COX1 cytochrome c oxidase 1
G guanine
MD DNR Maryland Department of Natural Resources
mt mitochondrial
NCBI National Center for Biotechnology Information
PBS phosphate-buffered saline
PCR polymerase chain reaction
T thymine
USGS U.S. Geological SurveyEstablishing Molecular Methods to Quantitatively Profile
Gastric Diet Items of Fish—Application to the Invasive
Blue Catfish (Ictalurus furcatus)
By Deborah D. Iwanowicz1, William B. Schill1, Lakyn R. Sanders2, Tim Groves3, and Mary C. Groves3
potentially negatively affect young-of-year recruitment of this
Abstract native sportfish. Analyses of two gene regions helped confirm
the major prey of the fish sampled and allowed identification
Understanding the diet of invasive species helps research-
of fish species as prey that were not included in a database for
ers to more accurately assess the health, survivorship, growth,
the two gene regions. We concluded that the mitochondrial
and stability of an invasive fish species, as well as their effects
ribosomal-marker-based next-generation sequencing method is
on native populations. Techniques capable of identifying mul-
useful in determining the prey of fish species.
tiple prey species from fish stomach contents have been devel-
oped. In this study, a multi-locus metabarcoding approach was
used to identify fish and invertebrate prey in stomach samples
of Ictalurus furcatus (blue catfish), which were collected from Introduction
two sites on the Mattawomen Creek and Nanjemoy Creek in
Maryland. Ictalurus furcatus (blue catfish) is the largest of the fresh-
The mitochondrial 12S (mt12S) and mitochondrial 16S water catfish species in the United States and is native to the
(mt16S) gene regions were sequenced and compared. First, a Mississippi, Missouri, and Ohio River Basins (Graham 1999).
mock sample for each gene region was created with the pooled Although the blue catfish primarily inhabits freshwater, they
polymerase chain reaction product of known fish species, are known to tolerate and occupy estuarine habitats (Perry,
and quantities of the sample were used to determine efficacy 1969). During the last 50 years (1969–2018), blue catfish have
of the amplicon. Results varied between gene regions ana- been stocked across the United States (Graham, 1999) because
lyzed. Then, when using the mt12S primers, next-generation of their value to sport and commercial fisheries (Michaeletz
sequencing determined that nine fish species were found at and Dillard, 1999). The popularity of blue catfish in the Mid-
levels greater than 1 percent of the diet of blue catfish. The west prompted stocking and introductions of these fish outside
most common species were Perca flavescens (yellow perch) of their native range (Schloesser et al., 2011). Blue catfish
and Cyprinus carpio (common carp). The mt16S gene region were introduced into the James, Rappahannock, and York Riv-
analyses found 10 fish species at greater than 1 percent ers in Virginia during the 1970s. Subsequently, they have been
of the diet, which primarily included Orconectes limosus observed in several rivers and tributaries in Maryland and
(spinycheek crayfish), Alosa pseudoharengus (alewife), and the Chesapeake Bay from near the coast to the mouth of the
yellow perch. Partially digested eggs were identified using Susquehanna River (Schloesser and others, 2011). They also
next-generation sequencing of yellow perch in two of the have been reported in the Virginia Chesapeake Bay drainages
stomach samples, and a TaqMan® quantitative polymerase in 1974 and the Potomac River in Maryland between 1898 and
chain reaction (qPCR) assay was developed to more economi- 1905 (Graham, 1999). This species has become established
cally identify egg species in the future. in some rivers in Virginia and is rapidly expanding its range.
The yellow-perch-specific TaqMan® qPCR assay was There is concern that this expansion increases the potential for
tested using primers that were developed to detect a 154-base- the blue catfish to negatively affect native species and their
pair amplicon in the mitochondrial control region. Consump- complex ecological roles in the Chesapeake Bay (Schloesser
tion of yellow perch eggs indicates that blue catfish could and others, 2011). Invasive species are known to negatively
affect established fish populations where they have been intro-
duced. This occurs through competition with native species for
1
U.S. Geological Survey, National Fish Health Research Laboratory.
food sources, predation, and habitat alteration (Sakai and oth-
Natural Systems Analyst, Inc., contracted to the U.S. Geological Survey,
2
ers, 2001). Introduced blue catfish populations are suspected
National Fish Health Research Laboratory. of adversely affecting native fish assemblages (Tuckey and
3
Maryland Department of Natural Resources, Inland Fisheries, Cedarville Fabrizio, 2010). The increase of predatory invasive species,
Fish Hatchery. such as blue catfish, in the Chesapeake Bay and its tributaries2 Molecular Methods to Quantitatively Profile Gastric Diet Items of Fish—Invasive Blue Catfish (Ictalurus furcatus)
could have an effect on the ecology of estuarine (Schloesser bass; Jo and others, 2014), and blue catfish (Aguilar and oth-
and others, 2011) and freshwater communities. Blue catfish ers, 2017). Although cytochrome c oxidase 1 (COX1) is often
are opportunistic omnivores that eat plant matter, insects, crus- used to speciate fishes, there are several markers available
taceans, worms, and other fishes. Growing numbers and rapid for DNA metabarcoding, including but not limited to mt16S,
expansion of blue catfish in the Chesapeake Bay have raised mt18S, maturase K (matK), and ribulose biphosphate carbox-
concerns about their potential negative effects on Brevoortia ylase large (rbcL) (Weigt and others, 2012). Species identifica-
tyrannus (menhaden), Callinectes sapidus (blue crab), and tions are determined by comparison with reference sequences,
other native species that play an important role in the ecosys- which are sequences stored in databases such as GenBank
tem and economy (Schloesser and others, 2011; Garman and (maintained by the National Center for Biotechnology Infor-
others, 2013). mation [NCBI]) and using a sequence alignment tool such as
The overall effect of an invasive species on an ecosystem BLAST (Basic Local Alignment Sequence Tool) (Altschul and
is complex to quantify (Pimentel and others, 2005). Invasive others, 1990). This strategy allows for high taxonomic resolu-
species may affect not only an ecosystem’s trophic structure, tion from minimal starting material; however, it is expensive,
but also the region’s socioeconomic assets (Januchowski- and time consuming to clone and sequence many independent
Hartley and others, 2017), although not all the effects are DNA fragments using traditional means (Iwanowicz and oth-
necessarily negative. For instance, an aquatic invasive species ers, 2016). The development of next-generation sequencing
may precipitate a decline or extirpation of a native species increases speed and accuracy of genetic dietary analysis and
or decline of ecosystem services but may also add value to a may be particularly useful in relatively complex mixtures such
region’s sport fishery (Pimentel and others, 2005; Schloesser as feces (Iwanowicz and others, 2016).
and others, 2011). This report describes a multi-locus metabarcoding
The potential effect of blue catfish on fishery resources is approach for the analysis of blue catfish diet using paired-end
of significant interest to fisheries managers along the Atlantic reads (reads from two ends of the same DNA molecule) of the
coast. In 2012, fisheries managers from the State of Maryland, mitochondrial 12S (mt12S) and mitochondrial 16S (mt16S)
Commonwealth of Virginia, District of Columbia, Potomac gene regions. Potential error was assessed by analyzing mock
River Fisheries Commission, and Atlantic States Marine fish samples of known composition for both gene regions. In
Fisheries Commission adopted an invasive catfish policy this study, a prey list was determined for 12 blue catfish caught
(Chesapeake Bay Program, 2012). This policy states that the in Mattawoman Creek and Nanjemoy Creek in Maryland dur-
potential risk posed by blue catfish on native species warrants ing March 2017. The development of a TaqMan® quantitative
action to examine potential measures to reduce densities and polymerase chain reaction (qPCR) assay that accurately and
limit range expansion, as well as the need to evaluate potential sensitively identified Perca flavescens (yellow perch) eggs in
negative ecological effects. Specifically, there was an interest blue catfish stomach samples is discussed.
in improving the understanding of the blue catfish biology and
population dynamics. One way to determine the biological
effect of an invasive species is through its diet.
Diet is an important factor underlying health, and Methods
survivorship, population growth, and stability among fishes.
Diet analysis can provide crucial information for monitoring Field Collections
and restoration efforts for rare and endangered species, track
consumption of native fishes by invasive species, and monitor Eleven blue catfish were captured from Mattawoman
changes in available prey of important sport fisheries. One of Creek and one blue catfish was collected from Nanjemoy
the most common methods for determining the diet of spe- Creek (both major tributaries to the Potomac River) during
cies of interest is macroscopic or microscopic examination. March 2017 (figure 1). Fish were collected using a Smith-Root
Although these methods provide beneficial information, there SR18 Electrofishing boat outfitted with a 9.0 GPP generator.
are limiting factors, such as labor, expert knowledge, time, Blue catfish were collected from shallow water (< 6 feet) and
and cost (Iwanowicz and others, 2016). Often, we find that galvanonarcosis was reached with the use of high frequency
microscopy can underestimate prey species consumed because pulsed DC current. All fish were euthanized with blunt force
of differences in digestibility or decomposition rates (Barker, trauma followed by cervical dislocation. Total body weight
1986). Recent studies have used multiple DNA strategies that and length of the fish were recorded, and stomach samples
allow high taxonomic resolution with minimal starting mate- were individually preserved in 97 percent ethanol for molecu-
rial (King and others, 2008; McClenaghan and others, 2015; lar identification (table 1). In addition to DNA from blue cat-
Iwanowicz and others, 2016; Aguilar and others, 2017). DNA fish stomach samples, DNA was obtained for seven additional
barcoding is a common technique that has been used to deter- fish species (table 2) for inclusion in mock samples (mt12S
mine the diets of multiple species, such as deep-water sharks mock and mt16S mock) for use in determining (or confirming)
(Dunn and others, 2010), Micropterus salmoides (largemouth species specificity of the MiSeq primers.Methods 3
1
2
2 1
EXPLANATION
11
Mattawoman
= blue catfish site 3: Creek
1, 2, 4, 5, 8, 9, 12, 29,
22 and 37
Potomac R
= blue catfish site 2: 6 3
3
= blue catfish site 3: 3
Nanjemoy
Creek
iver
Figure 1. Three sites where Ictalurus furcatus (blue catfish) were collected from major tributaries of the Potomac River. Sites 1 and
2 were in Mattawoman Creek. Site 1 was where most fish were collected; the red dot at the bottom shows the 240-meter sampling
area where the fish were collected. Site 3 was in Nanjemoy Creek. (Sources: Esri, HERE< Garmin, Intermap, increment P Corp., GEBCO,
USGS, FAO, NPS, NRCAN,GeoBase, IGN, Kadaster NL, Ordinance Survey, Esri Japan, METI, Esri China (Hong Kong), swisstopo, ©
OpenStreetMap contributors, and the GIS User Community, Esri, Garmin, GEBCO, NOAA NGDC, and other contributors)
DNA Extraction used to analyze the mt16S rRNA gene region are described by
Deagle and others (2007); these primers produce an approxi-
Genomic DNA (gDNA) extraction was completed fol- mately 270-bp amplicon. Amplicons for both primer sets
lowing the methods of the Soil Microbe DNA Miniprep™ Kit, were developed in two steps. Target DNA was first amplified
Zymo Research (Irvine, California). Two samples contain- using primers (either mt12S or mt16S) to generate a higher
ing eggs were first washed in phosphate-buffered saline to concentration of input template for the library. Then fusion
minimize contamination from other stomach contents and then primers were developed that included Illumina “overhang”
extracted following the same methods as the other stomach sequence adapters (70 bp) attached to the original primers for
samples. All DNA was eluted in 30 microliter (µL) of sterile, a second round of PCR and library construction. The prim-
nuclease-free water. All samples were stored at -20 degrees ers used for the mt12S gene region were 12SF/12SR (Melton
Celsius (°C) until polymerase chain reaction (PCR) was and Holland, 2007): 12SF (5’ – ACT GGG ATT AGA TAC
performed. CCC ACT ATG – 3’) (A, adenine; C, cytosine; G, guanine;
T, thymine) and 12SR (5’ – ATC GAT TAT AGA ACA GGC
TCC TC – 3’). The primers used for the mt16S gene region
Targeted Amplification of Mitochondrial were 16S1F/16S1R (Deagle and others, 2007): 16S1F (5’ –
Regions GAC GAK AAG ACC CTA – 3’) and 16S1R (5’ – CGC TGT
TAT CCC TAD RGT AAC T – 3’). The initial thermocycling
The mt12S and mt16S ribosomal RNA (rRNA) gene conditions for the primary PCR using standard primers con-
regions were targeted owing to their common use in species sisted of an initial denaturation step of 94 °C for 10 minutes,
identification in fishes and other vertebrates because of the followed by 35 cycles of 45 seconds at 94 °C, 45 seconds at
highly conserved regions (Pascoal and others, 2008; Gharrett 53 °C (mt12S)/54 °C (mt16S), and 1.5 minutes at 72 °C; the
and others, 2001; Bock and others, 2016; Yang and others, final extension was 72 °C for 7 minutes. An appropriately
2014). The primers used for the mt12S rRNA gene region, sized amplification product was confirmed for each reaction
which are described by Melton and Holland (2007), produced by electrophoresis of 5 µL of the reaction product through
an approximately 250-base-pair (bp) amplicon. The primers a 1.5 percent Agarose LE gel (Phenix Research, Chandler,4 Molecular Methods to Quantitatively Profile Gastric Diet Items of Fish—Invasive Blue Catfish (Ictalurus furcatus)
Table 1. Length, weight, and collection date for 12 Ictalurus furcatus (blue catfish) collected from the site at either Mattawoman Creek
or Nanjemoy Creek in Maryland.
[mm, millimeter; g, gram]
Fish number Length (mm) Weight (g) Date collected Site number, creek name
1 703 4,632 3/30/2017 1, Mattawoman Creek
2 651 2,965 3/30/2017 1, Mattawoman Creek
3 755 5,710 3/13/2017 3, Nanjemoy Creek
4 695 3,430 3/30/2017 1, Mattawoman Creek
5 680 3,784 3/30/2017 1, Mattawoman Creek
6 576 2,091 3/9/2017 2, Mattawoman Creek
7 754 5,627 3/30/2017 1, Mattawoman Creek
8 846 7,627 3/30/2017 1, Mattawoman Creek
9 632 2,944 3/30/2017 1, Mattawoman Creek
12 587 2,149 3/30/2017 1, Mattawoman Creek
29 520 1,456 3/30/2017 1, Mattawoman Creek
37 420 549 3/30/2017 1, Mattawoman Creek
Table 2. Data on seven field-collected fish species archived at the laboratory and used for the mock library. DNA was extracted, and
sequences were obtained. All samples were originally keyed to genus or species on the basis of morphological characteristics.
GenBank accession number GenBank accession number
Family Genus species
mt12S mt16S
Percidae Perca flavescens NC019572 AY520099
Centrarchidae Lepomis macrochirus MF621713 JX536256
Salmonidae Coregonus hoyi KT375339 MK291229
Cyprinidae Semotilus atromaculatus AF023199 AP012107
Cyprinidae Macrhybopsis hyostoma NC030610 NC030610
Cyprinidae Hypophthalmichthys molitrix MF180230 MF180232
Channidae Channa argus KC823605 KT358472
North Carolina) at 100 volts for 45 minutes. PCR products Generation of Mock Library Samples
were cleaned with the PCR Purification Kit (Qiagen, Valencia,
Calif.) and quantified using the Qubit dsDNA HS Assay Kit To better understand sources of error or bias in taxo-
(ThermoFisher Scientific, Grand Island, New York). Samples nomic assignment, we created two mock fish DNA assem-
were diluted in 10 millimolar Tris buffer (pH 8.5) to a final blages by mixing purified DNA sequences from known fish
concentration of 5 nanograms per microliter. This analysis was species at defined concentrations (table 2). For each fish,
also performed on the fish eggs found in two of the samples. 25 milligrams (mg) of fish tissue was extracted using the
Because the eggs had been ingested, along with multiple fish DNeasy blood and tissue kit (Qiagen, Valencia, Calif.), fol-
species, unambiguous Sanger sequencing was not possible. lowing the manufacturer’s protocol. The mt12S and mt16SMethods 5
sequence was then amplified using the same targeted ampli- sequence adaptors and poor-quality base calls. Adaptors were
fication of mitochondrial region as described in the previous matched by scanning for regions of similarity to the full-length
section under targeted amplification of mitochondrial regions. adaptor reference using a +2/-3 scoring scheme for a match/
Because an earlier MiSeq run had identified 7–8 fish spe- mismatch and a minimum quality score of 10. Degenerate
cies in the stomachs of blue catfish at a given time, a total of positions in the primer sequences were accommodated by
7 PCR products were mixed to form 2 mock libraries (table 2). providing multiple explicit variants as search motifs. A maxi-
In both the mt12S mock library and the mt16S mock library, mum error probability of 0.01 was allowed, and a minimum
all seven PCR products were mixed in equal concentrations read length of 150 bases was required after all trimming steps.
(mass/volume). Machine-processed sequencing output was deposited under
To confirm the identities of fishes used in these mock BioProject PRJNA509916, SRA accession SUB4912843 for
libraries, the mt16S amplicon was Sanger-sequenced from both mt12S reads and mt16S reads. The trimmed overlapping
both ends on an ABI3130xl sequencer using Big Dye Termina- paired-end reads were assembled using the CLC RNAseq
tor Cycle Sequencing chemistry (Applied Biosystems, Foster Analyses assembly module with a minimum score of 10, a
City, Calif.). Forward and reverse sequences were overlapped mismatch cost of 2, and an insertion cost of 3. To ensure that
and manually edited with Geneious v10.0 (Gene Codes Corpo- all mock fish were identified, length fraction and similarity
ration, Ann Arbor, Michigan). fraction were altered between the mt12S and mt16S libraries.
For mt12S analyses, length fraction and similarity fraction
were conservatively set at 0.98. However, read efficiency was
Sequencing Library Preparation and Quality lower with the mt16S primers, and therefore less-conservative
Assessment analyses were set at 0.90 for length fraction and 0.97 for
similarity fraction. Reads were annotated using a reference
Next-generation sequencing was performed on the Illu- library that contained one reference sequence for each species
mina MiSeq platform to observe species-specific sequences included.
and determine the diet of the blue catfish using mt12S and
mt16S primers modified with the sequencing adaptors speci-
fied in the Illumina 16S Metagenomic Sequencing Library Reference Database and Taxonomic Analysis
Preparation protocol (CT #: 15044223 Rev. B; https://
support.illumina.com/documents/documentation/chemis- We developed separate mt12S and mt16S reference
try_documentation/16s/16s-metagenomic-library-prep-guide- databases for analysis. First mt12S mock and mt16S mock
15044223-b.pdf). Amplicon libraries were prepared following were compared against either the mt12S/mt16S (respectively)
the same manufacturer’s protocol. These adapters allowed sequences generated with Sanger sequencing from our input
us to pool samples from multiple catfish, sequence them cost fish material or those from GenBank. If longer sequences were
effectively, and later sort the data bioinformatically using the available in GenBank, they were used because a shorter read
Illumina Nextera XT multiplex library indices; read (nucleo- can introduce a bias to the read score (Iwanowicz and others,
tide sequence) pairs are automatically assigned to samples 2016). A reference database was compiled that represented
based on these index reads by the MiSeq software. DNA read 203 fish and amphibian species commonly found in Matta-
size spectra were determined with the Agilent 2100 Bioana- woman Creek and 12 common invertebrates that previously
lyzer using the Agilent DNA 1000 Kit (Santa Clara, Calif.). had been identified microscopically in the stomachs of blue
Libraries were quantified with the Qubit dsDNA HS Assay Kit catfish collected in Virginia and Maryland (Appendix 1).
(ThermoFisher Scientific, Grand Island, N.Y.) and normalized All mt12S teleost sequences were downloaded on May 2,
to 4 nanomolar (nM) using 10 millimolar (mM) Tris (hydroxy- 2018, whereas all mt16S teleost sequences were downloaded
methyl) aminomethane buffer pH 8.5. A final concentration of on June 6, 2017, from the NCBI archive. This mt16S data-
10 picomolar library with a 15-percent PhiX control spike was base was modified by removing all duplicates and sequences
created with the combined pool of all indexed libraries. All less than 150 bp in length, resulting in 219 sequences. Eleven
bioinformatic operations were completed on CLC Genomic species were present in the study area (fig. 1) that could not
Workbench v10 (Qiagen, Valencia, Calif.). be included within the mt12S database because they were not
found in GenBank. Those species included Enneacanthus
chaetodon (blackbanded sunfish), Enneacanthus gloriosus
Read Filtering, Trimming, and RNAseq (bluespotted sunfish), Hybognathus hankinsoni (brassy min-
Metabarcoding Assembly now), Hiodon tergisus (mooneye), Lampetra planeri (brook
lamprey), Acantharchus pomotis (mud sunfish), Lepomis
The mt12S and mt16S libraries were analyzed similarly microlophus (redear sunfish), Etheostoma maculatum (spotted
but separately. In general, machine-processed FASTQ files darter), Etheostoma fusiforme (swamp darter), and Pomoxis
were imported into CLC Genomics v10 (Qiagen Bioinformat- annularis (white crappie). Counts of reads assigned to taxa
ics, Redwood City, Calif.) for initial filtering of exogenous were normalized as counts per million mapped reads.6 Molecular Methods to Quantitatively Profile Gastric Diet Items of Fish—Invasive Blue Catfish (Ictalurus furcatus)
Primers and Real-Time PCR (Control Gene qPCR) Table 3. Fish species whose genomic DNA was used to verify
the specificity of the real-time polymerase chain reaction for
During necropsy, two fish stomachs were observed to Perca flavescens (yellow perch).
contain primarily eggs of one or more unknown fish spe-
Species common name Order
cies. Preliminary DNA sequencing data identified the eggs
as yellow perch. Since yellow perch have been managed Yellow perch Perciformes
extensively in the Chesapeake Bay (Fisheries Service Yellow
PerchWorkgroup, 2002), we developed a faster, more eco- White sturgeon Acipenseriformes
nomical method for egg identification by developing yellow
perch primers and a probe for a TaqMan® qPCR assay. We Bloater Salmoniformes
began by developing two sets of yellow perch specific primers
and a TaqMan probe. Primer set 1 consisted of YP154Fwd Blacknose dace Cypriniformes
(5’ – ATA AGG TTG AAC ATT TCC TCT GCC T – 3’) and
YP154Rev (5’ – AAA AAC GTA ATA AAT CCC AGA GGG Creek chub Cypriniformes
G – 3’), whereas primer set 2 consisted of YP195F (5’ – CAT
TTC CTC TGC CTG CAA GAT ATA G – 3’) and YP195Rev Atlantic salmon Salmoniforrmes
(5’ – CAG GAG TGT TAA CTA TCT CAG GAG T – 3’).
Primer set 1 was developed to detect a 154-bp amplicon in the Silver carp Cypriniformes
control region of yellow perch mitochondrial DNA (mtDNA),
Shoal chub Cypriniformes
whereas primer set 2 detected a 195-bp amplicon in the mito-
chondrial control region. The yellow perch specific 6-FAM/ Channel catfish Siluriformes
Zen-labeled Prime Time probe (IDTdna, Coralville, Iowa)
YP Zen (5’ – 6FAM/TGC TCT TGA/ZEN/TAT CCT AAG Northern snakehead Perciformes
ATG TGG TTC/31ABkFQ/ - 3’) and the primers based on the
mitochondrial control region of yellow perch were developed
using PRIMER QUEST (IDTdna, Coralville, Iowa). The DNA samples with those of a standard dilution series (101 to
specificity of primers and probes were checked with BLASTn 108 copies/µL). Calculations of standard measures of real-time
(Basic Local Alignment Sequence Tool for nucleotides) analy- analysis quality were calculated using ABI viiA™7 ver-
sis against the NCBI database to ensure that amplification of sion 1.2.1 (Life Technologies, Carlsbad, Calif.) and included
genes from other organisms or species was unlikely. determination of linear regression coefficient (r2), slope, and
The yellow perch qPCR assay was optimized as a Taq- reaction efficiency calculations. Samples containing one or
Man® assay. Primer and probe sets were optimized on the more copies per microliter were scored as positive.
basis of the checkerboard system. All primer optimization
assays were performed on the ABI viiA™7 qPCR system
using a 20 µL reaction containing 1µL DNA template, 1X Life
Technologies TaqMan® Environmental Master Mix 2.0 Results
(Applied Biosystems®, Carlsbad, Calif.), primer set 1 or 2,
and 0.25 micromolar (µM) of the probe. Amplification condi- Sequencing Output
tions for the optimization assay consisted of heating at 50 °C
for 2 minutes, followed by 40 cycles of 95 °C for 15 seconds We developed DNA metabarcoding methods to quan-
and an annealing/extension cycle of 60 °C for 1 minute. The tify the species composition of stomach contents of fish. We
probe concentrations were optimized with the previously demonstrated the methods using the diet of invasive blue
determined optimal primer concentrations and were run with catfish collected from two rivers in Maryland. Total samples
four replicates at each 50 nM interval from 50 to 250 nM. in the analysis consisted of 1 mock sample and the stom-
Thermocycling conditions for probe optimization were the ach samples from 12 blue catfish, which were sequenced
same as the primer optimization described above. Optimal to target the mt12S and mt16S gene regions. The total read
probe concentration was determined by choosing the minimum output for these samples with the mt12S gene region was
probe concentration that yielded the minimum cycle thresh- 15,473,679 million read pairs. The total read output for these
old. The specificity of the assay was evaluated in triplicate by samples with the mt12S mock library was 1,950,848 million
assaying genomic DNA extracts of target positive controls, a read pairs. The total read output for these samples with mt16S
wide range of sample collection negative controls (table 3), was 1,395,480 million read pairs. The total read output for
environmental positive controls, and a non-template control. these samples with the mt16S mock library was 953,640 read
Standards were designed to determine copy number. Dilutions pairs. Initial trimming with the mt12S target region resulted
of genomic DNA were used to determine the number of copies in a mean read length of 151 bases. Initial trimming with the
of the yellow perch mitochondrial control region sequence in mt16S target region resulted in a mean read length of approxi-
all DNA samples by comparison of the qPCR response of fish mately 234 bases for each primer pair.Results 7
Mock Stomach Samples of at least 0.02 percent of the diet. When aggregated at the
genus level with mt12S, 12 genera were recovered at propor-
A total of 732,634 mt12S and 158,034 mt16S reads from tions of at least 0.02 percent of diet (fig. 2B). Nine species
the mock libraries were categorized by matching sequences to were found in proportions greater than 1 percent of the diet:
those included in the respective databases. All fish species in yellow perch, Cyprinus carpio (common carp), blue catfish,
the mt12S and mt16S mock libraries were detected; however, Ameiurus nebulosus (brown bullhead), Alosa sapidissima
we had to take a less conservative approach with the mt16S (American shad), Alosa pseudoharengus (alewife), Lepomis
libraries by utilizing only 0.90 length fraction and 0.97 simi- macrochirus (bluegill), Micropterus salmoides (largemouth
larity fraction, instead of 0.98 for both as for the mt12S library bass) and menhaden. With the mt16S primers, 16 species
(table 4). from 13 different genera were assigned reads at proportions
In the mock samples, the mt16S primers had lower of at least 0.02 percent of the diet (fig. 3 A, B); 10 species
efficiency in reading sequences from Semotilus atromacu- were found in proportions greater than 1 percent of the diet.
latus (creek chub), Macrhybopsis hyostoma (shoal chub), These species included the Orconectes limosus (spineycheek
and Hypophthalmichthys molitrix (silver carp). Upon closer crayfish), yellow perch, American shad, alewife, bluegill,
inspection, the primer set also had difficulties in reading Dorosoma cepedianum (American gizzard shad), menhaden,
sequences that matched to Ictalurids (catfish) and Micropterus blue catfish, Micropterus dolomieu (smallmouth bass), and
sp. (such as black bass). The error was identified on the last Cyprinus carpio (common carp).The efficiency of the mt16S
base at the 3’ end of the reverse primer. Modification of the primer set in directing amplification of some targets was
last 3’ base from an “A” to a “W” would make this primer set much lower than that of the mt12S primer set. Even with the
work more efficiently for our reference database. lower efficiency, combining the two primer sets indicates that
Perca sp., Orconectes sp., Cyprinus sp., and Alosa sp. were
the most abundant genera found in the blue catfish stomachs.
Blue Catfish Stomach Samples
A total of 10,347,229 mt12S (with a mean ± stan- qPCR Assay Optimization
dard deviation [SD] per sample of 795,941 ± 255,929)
and 855,444 mt16S (with a mean ± SD per sample of Primer and probe concentrations were optimized for this
77,776 ± 23,937) reads from the blue catfish stomachs were qPCR assay by determining the minimum concentrations nec-
mapped to the respective database. In total, 16 species were essary to give the maximum normalized reporter value (ΔRn).
assigned reads (fig. 2A) with the mt12S libraries at proportions The ΔRn reliably calculates the magnitude of the specific sig-
nal generated from a given set of PCR conditions. For primer
set 1, this was a 20-µL PCR reaction that was composed of
Table 4. Seven fish species included in mock samples along with 10 µL of Power Sybr® Green PCR Master Mix (Applied Bio-
the percent contribution they were found in the DNA assemblage. systems, Foster City, Calif.), 0.1-µL forward primer at a con-
All fish were identified to species based on morphological centration of 0.03 µM, 1.8-µL reverse primer at a concentra-
characteristics. tion of 0.09 µM, 0.5-µL probe at a concentration of 250 nM,
and 6.6 µL of nuclease-free water. This resulted in the same
[Percentages do not sum to 100 because of rounding]
20-µL reaction described in the methods, including multiple
mt12S Mock mt16S Mock primer concentrations (table 5). Assay conditions remained the
Species same. Non-template controls and collection negative controls
(percent) (percent)
did not generate a peak with primer set 1 (YP154F/R), indicat-
Perca flavescens 16 31 ing that no nonspecific binding of the primers occurred. How-
ever, with primer set 2 (YP195F/R), melt curve analyses had
peaks indicating nonspecific binding of the primers occurred.
Lepomis macrochirus 13 14
In fact, primer set 2 (YP195F/R) directed nonspecific amplifi-
cation of three fish species, including creek chub, shoal chub,
Coregonus hoyi 13 28 and Salmo salar (Atlantic salmon).
The stomach samples did test positive for yellow perch.
Semotilus atromaculatus 14 4 All positive control samples were sequenced successfully
using Sanger cycle sequencing, confirming the species of issue
is yellow perch.
Macrhybopsis hyostoma 8 2
Assay performance and precision were evaluated with
the described standards of yellow perch. Linear correlation
Hypophthalmichthys molitrix 10 2 (r2 > 0.98) and amplification efficiency (102.5 percent) values
for yellow perch demonstrate that the developed assay has
Channa argus 25 20 good performance over the tested quantification range, with
highly reproducible results (fig. 4).A. Fish species mt 12S primer set B. Genera
Orconectes limosus KT959482 Orconectes sp.
Perca flavescens AY520099
Perca sp.
Alosa sapidissima HQ331537
Alosa pseudoharengus NC009576 Alosa sp.
Lepomis macrochirus JX536256
Dorosoma sp.
Dorosoma cepedianum DQ912062
Brevoortia tyrannus AP009618 Lepomis sp.
Ictalurus furcatus NC028151
Brevoortia sp.
Micropterus dolomieu HQ731429
Ictalurus sp.
Cyprinus carpio FJ655281
Enneacanthus gloriosus AY742519 Micropterus sp.
Pomoxis nigromaculatus NC028298
Cyprinus sp.
Channa argus KC823605.1
Percopsis omiscomaycus AF049741 Enneacanthus sp.
Lepomis gibbosus KY231828
Pomoxis sp.
Alosa chrysochloris DQ912081
Channa sp.
0 5 10 15 20 25 30 35 40
Percopsis sp.
0 5 10 15 20 25 30 35 40
EXPLANATION
Number of stomach samples
Average proportion of mapped reads
8 Molecular Methods to Quantitatively Profile Gastric Diet Items of Fish—Invasive Blue Catfish (Ictalurus furcatus)
Figure 2. Average proportion of mapped reads and number of stomach samples in which prey species were detected in Ictalurus furcatus (blue catfish) with the mt12S primer
set, by recovered A, fish species and B, fish genera.A. Fish species mt 16S primer set B. Genera
Perca flavescens NC019572.1 Perca sp.
Cyprinus carpio KF856965.1 Cyprinus sp.
Ictalurus sp.
Ictalurus furcatus GU329038.1
Alosa sp.
Ameiurus nebulosus MF621731.1
Ameiurus sp.
Alosa sapidissima DQ912045.1
Micropterus sp.
Alosa pseudoharengus DQ912044.1
Lepomis sp.
Lepomis macrochirus MF621713.1
Brevoortia sp.
Micropterus salmoides DQ536425.1
Dorosoma sp.
Brevoortia tyrannus KX686086.1
Channa sp.
Dorosoma cepedianum MG570429.1 Pomoxis sp.
Channa argus KC823605.1 Hybognathus sp.
Ictalurus punctatus JN015531.1 0 5 10 15 20 25 30 35 40
Pomoxis nigromaculatus MF621719.1
Ameiurus natalis MG570406.1
Ameiurus catus NC037012.1
Hybognathus regius HY216538.1
0 5 10 15 20 25 30 35 40
EXPLANATION
Number of stomach samples
Average proportion of mapped reads
Figure 3. Average proportion of mapped reads and number of stomach samples in which prey species were detected in Ictalurus furcatus (blue catfish) with the mt16S primer
Results 9
set, by recovered A, fish species and B, fish genera.10 Molecular Methods to Quantitatively Profile Gastric Diet Items of Fish—Invasive Blue Catfish (Ictalurus furcatus)
Table 5. Concentration of primers and probe used for the detection of Perca flavescens (yellow perch) in real-time polymerase chain
reaction assay.
[µM, micromolar]
Primer (probe) Concentration (µM)
YP154F 0.3
YP154R 0.9
YP195F 0.3
YP195R 0.3
YP Zen (probe) 0.25
Standard curve
40.0
37.5
35.0
32.5
30.0
27.5
Threshold
25.0
22.5
20.0
17.5
15.0
12.5
10.0
0.1 0.2 1 2 3 4 10 20 100 200 1000 10000 100000 100000010000000 100000000 1000000000
Counts
Figure 4. Threshold values in relation to counts generated by assaying fish samples with the Perca flavescens (yellow perch) real-time
polymerase chain reaction assay. An overview of all assayed fish samples is presented in table 2. (Assay efficiency = 102.5, r2 = 0.99 and
a slope of -3.262).
(Yang and others, 2014). The two ribosomal RNAs encoded in
Discussion the mitochondrial genome (mt12S and mt16S) have numer-
ous substitutions among species, which is advantageous for
This study investigated the use of mt12S and mt16S gene
species identification including identification of an inverte-
regions to quantify the diet of blue catfish and the use of the brate species (Orconectes limosus, spinycheek crayfish). We
mitochondrial control region to identify samples as yellow found in this study that, in combination, sequence analysis for
perch. Owing to an accelerated evolutionary rate of animal ribosomal RNAs yielded a comprehensive list of prey species
mtDNA, significant degrees of sequence variation can be for the 12 blue catfish captured.
observed in closely related species (Yang and others, 2014). Owing to differences between sites, collection dates, and
In animals, there are many copies of mtDNA per cell, which molecular methods, only general comparisons can be made
makes mtDNA advantageous for identification of species between this study and the study described by Aguilar and oth-
using degraded or low-quality DNA found in stomach samples ers (2017). However, many similarities can be found betweenDiscussion 11
the two studies in the diet of blue catfish. Species such as commonly seen in the study area that are not in GenBank
Alosa aestivalis (blueback herring), alewife, American shad, are currently being collected and sequenced to add to the
menhaden, American gizzard shad, Ameiurus catus (white reference library database. There are advantages to having
bullhead), brown bullhead, Ictalurus punctatus (channel cat- a customized library database for blue catfish. Because the
fish), Lepomis gibbosus (pumpkinseed), bluegill, and large- library database can be used for multiple States, the data can
mouth bass were found in at least one sample in this study and be analyzed according to the species that are available and
the study by Aguilar and others (2017). Interestingly, only the ecologically meaningful, which allows for more accurate taxo-
mt16S primer set identified blueback herring, whereas only nomic assignment (Pompanon and others, 2012).
the mt12S primer set identified the bullheads, channel catfish, Mitochondrial DNA is commonly used to identify ani-
and largemouth bass. All other species were found using both mals. Mitochondrial DNA (mtDNA) is found in all animal tis-
primer sets. sues; has a simple structured genome; and, because of its rapid
Bioinformatic analysis indicated either a mismatch or rate of evolution that differentiates among species, it is useful
errors in amplification efficiency between the mt16S primers for solving phylogenetic questions on different taxonomical
and multiple genera within the stomach samples (Ameiurus levels (Zhang and Hewitt, 1996; Pompanon and others, 2012).
sp., Ictalurus sp., Micropterus sp., Semotilus sp., Macrhy- Thus, mtDNA was used in our next-generation sequencing
bopsis sp., and Hypophthalmichthys sp.). However, on closer (mt12S and mt16S) and in the mitochondrial control region for
inspection using BLASTn, the mt16S primer did match well the identification of yellow perch.
for many fish and invertebrate species (Perca sp., Channa sp., Regarding our TaqMan® qPCR assay, primer set 2
Coregonus sp., and Lepomis sp.). The results from combined (YP195F/R) directed nonspecific amplification of three
mt12S and mt16S inferred diets were very similar; both fish species, including creek chub, shoal chub, and Atlantic
primer sets identified yellow perch, common carp, blue catfish, salmon. Primer set 1 targeted the control region of yellow
bluegill, alewife, American shad, menhaden, American gizzard perch and successfully amplified yellow perch in positive con-
shad, and Channa argus (northern snakehead). The mt12S and trols and stomach samples. No negative control or non-tem-
mt16S primer set libraries identified alewife, yellow perch, plate control was amplified during TaqMan® qPCR. Primer
and common carp as a main part of the diet of the 12 blue set 1 (YP154F/YP154R) consistently identified only yellow
catfish collected. However, mt16S was the only primer set to perch and could be used for the stomach samples. Using prim-
identify the spinycheek crayfish. ers targeted for the mitochondrial control region, other work
Estimated species composition in sampled stomachs was has been successful studying population-specific genetic varia-
inferred using mock genetic libraries. Mock genetic libraries tion within vertebrate species such as red deer, brown bear,
were not as statistically proportional as expected. Erroneous wolf, roe deer, wild boar and Iberian lynx (Paden and others,
reads are one of the challenges that constantly needs to be 2009; Palomares and others, 2002). Similar protocols could be
addressed with next-generation sequencing (Pompanon and developed for any fish species that resource managers need to
others, 2012). For example, errors occurring in the amplicon quickly identify. In the future, these primers will allow us to
sequence may lead to taxon misidentification (Pompanon and quickly and economically identify whether eggs found in the
others, 2012). The amplification efficiency of a DNA barcod- stomach contents of blue catfish (or other species) are yellow
ing primer is important; correct amplification allows most perch.
dietary samples analyzed to produce sequences (Pompanon Because prey items as digesta are often highly degraded,
and others, 2012). Although both the mt12S and mt16S prim- barcoding primers might not be able to consistently amplify
ers could amplify and sequence the mock samples in isolation, prey species (Deagle and others, 2006; Pompanon and others,
amplification can be highly skewed within an environmental 2012). The egg masses found in the stomachs of the two fish
or multi-template PCR when some species are preferentially from this study exhibited varying degrees of degradation.
amplified (Pompanon and others, 2012; Deagle and others, Using two molecular targets (mt12S and mt16S), we verified
2007). Although changing the last base on the 3’-end of the the identification of species from the egg mass. Sampling from
reverse primer from “A” to the degenerate base “W” may fix the center of the egg mass improved DNA integrity relative
many of these problems, upon further investigation it was to eggs on the outer edge, which were more degraded. Egg
determined that there may be multiple ways to minimize degradation can cause errors when using DNA barcoding.
errors. For example, blue catfish stomachs are large. Extrac- For example, Aguilar and others (2017) used DNA barcoding
tion of multiple samples from each stomach ideally would be to identify eggs from blue catfish stomachs; however, only
performed to more accurately detect all species present in the 50 percent of those egg samples could be identified to species.
stomach because the stomach contents are not evenly distrib- With this method, both the Illumina MiSeq platform and the
uted. In addition, PCR could be conducted in triplicate for TaqMan® qPCR assay produced robust data.
each sample to decrease the occurrence of erroneous sequenc- A more thorough study must be conducted to determine
ing (Pompanon and others, 2012). Finally, sequences within whether yellow perch eggs are commonly consumed by the
the mt12S and mt16S gene regions of some potential food blue catfish. Yellow perch inhabiting the Chesapeake Bay
species were not publicly available in GenBank and therefore drainage area are unique in that they are migratory brackish-
could not be included in our reference library. Fish species water fish that spawn in freshwater rivers (Mansueti, 1964).12 Molecular Methods to Quantitatively Profile Gastric Diet Items of Fish—Invasive Blue Catfish (Ictalurus furcatus)
Spawning yellow perch have historically been found in all
the major river systems of Maryland (Muncy, 1962). Yellow
References Cited
perch are important as a game fish and as prey fish for other
game fish, such as Sander vitreus (walleye), smallmouth bass, Aguilar, R., Ogburn, M.B., Driskell, A.C., Weigt, L.A.,
and largemouth bass (Fetzer and others, 2016; Staples and Groves, M.C., and Hines, A.H., 2017, Gutsy genetics:
others, 2017). As an integral part of the ecosystem that they identification of digested piscine prey items in the stomach
inhabit, yellow perch have long been studied in top-down ocntents of sympatric native and introduced warmwater
predator control (Thorpe, 1977; Hartman and Margraf, 1993) catfishes via DNA barcoding: Environmental Fish Biology,
and bottom-up food web influences (Hayes and others, 1992; v. 100, no. 4, p. 325–336, accessed December 8, 2017,
Horppila and others, 2010; Aguilar and others, 2017). A sur- at https://link.springer.com/article/10.1007/s10641-016-
vey of anadromous fish spawning conducted by the Maryland 0523-8.
Department of Natural Resources (MD DNR) between July Altschul, S.F., Gish, W., Miller, W., Myers, E.W., and Lip-
1970 and January 1975 found yellow perch in 50 percent of man, D.J., 1990, Basic local alignment search tool: Jour-
the sampled watercourses (O’Dell and others, 1975). Yellow nal of Molecular Biology, v. 215, p. 403–410, accessed
perch was the second most abundant species documented, February 3, 2014, at https://publications.mpi-cbg.de/
following white perch. However, by 1988 the MD DNR had Altschul_1990_5424.pdf.
to restart the hatchery program of 1890–1955 to supplement
natural populations in various tributaries (Fisheries Service Bock, S.L., Malley, M.M., and Lema, S.C., 2016, Complete
Yellow Perch Workgroup, 2002). By 2008, the yellow perch mitochondrial genomie of the speckled dace Rhinichthys
spawning survey did not include historical sites as a result of osculus, a widely distributed cyrpinrid minnow of western
changes in habitat that precluded future spawning. Also, rain North America: Mictochondrial DNA Part A, DNA map-
events (such as flooding) decimated the egg masses on the ping, sequencing, and analyses, v. 27, no. 6, p. 4416–4418,
western shore of the Chesapeake Bay. The addition of large accessed December 8, 2017, at https://www.tandfonline.
invasive fish predators can negatively affect a population of com/doi/abs/10.3109/19401736.2015.1089551.
fish, such as the yellow perch, that is already subject to con-
siderable environmental pressure from habitat degradation and Deagle, B., Gales, N., Evans, K., Jarman, S., Robinson, S.,
changing weather patterns. Therefore, the ability to detect key Trebilco, R., and Hindell, M., 2007, Studying seabird diet
prey species consumed by invasive species may prove useful through genetic analysis of faeces: a case study on macaroni
in assessing the effects of these non-native predators. penguins (Eudyptes chrysolophus): PLoS One, v. 2, no. 9,
Identifying potential prey species of blue catfish using p. e831, accessed June 17, 2014, at https://journals.plos.org/
both the mt12S and mt16S gene region was effective. This plosone/article?id=10.1371/journal.pone.0000831.
preliminary data indicate that nine species of fish were found Deagle, B.E., Eveson, J.P., and Jarman, S.N., 2006, Quantifi-
using the mt12S primer set to compose more than 1 percent of cation of damage in DNA recovered from highly degraded
the diet (yellow perch, common carp, blue catfish, brown bull- samples—a case study on the faeces: Frontiers in Zoology,
head, American shad, alewife, and bluegill). The mt16S primer v. 3, p. 11, accessed December 8, 2017, at https://www.ncbi.
set identified similar species, including spinycheek crayfish, nlm.nih.gov/pmc/articles/PMC1564134/.
yellow perch, American shad, alewife, bluegill, American
gizzard shad, menhaden, blue catfish, smallmouth bass, and Dunn, M.R., Szabo, A., McVeagh, M.S., and P.J., S., 2010,
common carp, in amounts greater than or equal to 1 percent of The diet of deep water sharks and the benefits of using
the diet. Although the two lists are similar, the small sample DNA identification of prey: Deep-Sea Research Part
size does not accurately characterize the breadth of diet of A Oceanographic Research Papers, v. 57, p. 923–930,
the blue catfish in the Chesapeake Bay. This study focused on accessed December 8, 2017, at https://doi.org/10.1016/j.
methods that can be used to determine the diet of blue catfish. dsr.2010.02.006.
Further research that includes a larger sample size, increased
numbers of extractions per individual, and collection of blue Fetzer, W.W., Jarman, S.N., Coissac, E., Pompanon, F., and
catfish from multiple sites and during multiple seasons would Taberlet, P., 2016, Year-class variation drives interactions
improve the knowledge of prey consumed by this predator. between warm-water predators and yellow perch: Canadian
This method could be useful in determining prey consumed by Journal of Fisheries and Aquatic Sciences, v. 73, no. 9,
fish species other than blue catfish. p. 1330–1341, accessed December 8, 2017, at http://www.
nrcresearchpress.com/doi/pdf/10.1139/cjfas-2015-0275.You can also read