Comparison of ozone measurement methods in biomass burning smoke: an evaluation under field and laboratory conditions - Recent
←
→
Page content transcription
If your browser does not render page correctly, please read the page content below
Atmos. Meas. Tech., 14, 1783–1800, 2021
https://doi.org/10.5194/amt-14-1783-2021
© Author(s) 2021. This work is distributed under
the Creative Commons Attribution 4.0 License.

Comparison of ozone measurement methods in biomass burning
smoke: an evaluation under field and laboratory conditions
Russell W. Long1 , Andrew Whitehill1 , Andrew Habel2 , Shawn Urbanski3 , Hannah Halliday1 , Maribel Colón1 ,
Surender Kaushik1 , and Matthew S. Landis1
1 Center for Environmental Measurement and Modeling, Office of Research and Development, United States Environmental
Protection Agency, Research Triangle Park, North Carolina, United States of America
2 Jacobs Technology Inc., Research Triangle Park, North Carolina, United States of America
3 U.S. Forest Service, Rocky Mountain Research Station, Missoula, Montana, United States of America

Correspondence: Russell W. Long (long.russell@epa.gov)

Received: 17 September 2020 – Discussion started: 29 September 2020
Revised: 25 January 2021 – Accepted: 25 January 2021 – Published: 4 March 2021

Abstract. In recent years wildland fires in the United States     that are positively correlated with carbon monoxide (CO) and
have had significant impacts on local and regional air quality    total gas-phase hydrocarbon (THC), two indicator species of
and negative human health outcomes. Although the primary          biomass burning. Of the two catalytic scrubber UV photo-
health concerns from wildland fires come from fine particu-       metric methods evaluated, the instruments that included a
late matter (PM2.5 ), large increases in ozone (O3 ) have been    Nafion® tube dryer in the sample introduction system had
observed downwind of wildland fire plumes (DeBell et al.,         artifacts an order of magnitude smaller than the instrument
2004; Bytnerowicz et al., 2010; Preisler et al., 2010; Jaffe et   with no humidity correction. We hypothesize that Nafion® -
al., 2012; Bytnerowicz et al., 2013; Jaffe et al., 2013; Lu et    permeating VOCs (such as aromatic hydrocarbons) could
al., 2016; Lindaas et al., 2017; McClure and Jaffe, 2018; Liu     be a significant source of interference for catalytic scrub-
et al., 2018; Baylon et al., 2018; Buysse et al., 2019). Condi-   ber UV photometric O3 monitors and that the inclusion of
tions generated in and around wildland fire plumes, includ-       a Nafion® tube dryer assists with the mitigation of these in-
ing the presence of interfering chemical species, can make        terferences. The chemiluminescence FRM method is highly
the accurate measurement of O3 concentrations using the ul-       recommended for accurate measurements of O3 in wildland
traviolet (UV) photometric method challenging if not impos-       fire plume studies and at regulatory ambient monitoring sites
sible. UV photometric method instruments are prone to in-         frequently impacted by wildland fire smoke.
terferences by volatile organic compounds (VOCs) that are
present at high concentrations in wildland fire smoke. Four
different O3 measurement methodologies were deployed in
a mobile sampling platform downwind of active prescribed
grassland fire lines in Kansas and Oregon and during con-
                                                                  1   Introduction
trolled chamber burns at the United States Forest Service,
Rocky Mountain Research Station Fire Sciences Labora-
tory in Missoula, Montana. We demonstrate that the Federal        Ground-level ozone (O3 ) is a secondary air pollutant gener-
Reference Method (FRM) nitric oxide (NO) chemilumines-            ated from the photochemical interactions of nitrogen oxides
cence monitors and Federal Equivalent Method (FEM) gas-           (NOx ) and volatile organic compounds (VOCs). The most
phase (NO) chemical scrubber UV photometric O3 monitors           robust methods for O3 measurements are based on chemi-
are relatively interference-free, even in near-field combus-      luminescence reactions with ethylene (ET-CL, for ethylene
tion plumes. In contrast, FEM UV photometric O3 monitors          chemiluminescence) or nitric oxide (NO-CL, for nitric oxide
using solid-phase catalytic scrubbers show positive artifacts     chemiluminescence) (Long et al., 2014). The overall reac-
                                                                  tion mechanism for ET-CL generally proceeds as detailed in

Published by Copernicus Publications on behalf of the European Geosciences Union.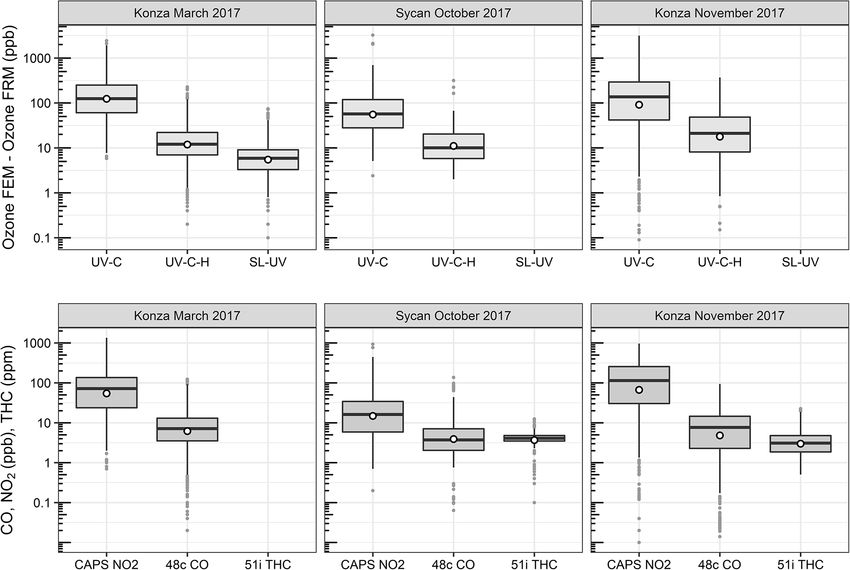
1784                            R. W. Long et al.: Comparison of ozone measurement methods in biomass burning smoke

Eqs. (1–2):                                                        eration. UV photometric analyzers determine O3 concentra-
                                                                   tions by quantitatively measuring the attenuation of light due
C2 H4 + O3 → H2 CO∗ + other products,                       (1)    to absorption by O3 present in an absorption cell at the spe-
        ∗                                                          cific wavelength of 254 nm (Parrish and Fehsenfeld, 2000;
H2 CO → H2 CO + hν.                                         (2)
                                                                   Williams et al., 2006). The O3 concentration is determined
The reaction generates electronically activated formaldehyde       through a two-step process in which the light intensity pass-
(H2 CO*) which luminesces in the high-ultraviolet (UV) to          ing through the sample air (I ) is compared with the light in-
visible portion of the spectrum (380–550 nm) and vibra-            tensity passing through similar sample air from which all O3
tionally activated hydroxide ions which luminesce in the           is first removed (I0 ). The ratio of these two light intensity
visible light to the low-infrared (IR) portion of the spec-        values (I /I0 ) provides the measure of the light absorbed at
trum (550–800 nm). The number of photons emitted dur-              254 nm, and the O3 concentration in the sample is then de-
ing the reaction is directly proportional to the amount of         termined through the use of the Beer–Lambert law as given
O3 present and is counted by a photomultiplier tube (PMT),         in Eq. (5):
with its response centered at 440 nm. Then the count is con-
verted to O3 concentration. The ET-CL method requires a            I /I0 = e−KLC (C = 1/KL ln[I /I0 ]),                       (5)
constant supply of ethylene for continuous operation. NO-
chemiluminescence analyzers measure O3 concentrations us-          where L is the length of the absorption cell (cm), C is
ing the principle that the dry, gas-phase reaction between NO      the O3 concentration (ppm), and K is the absorption cross
and O3 generates nitrogen dioxide in an electronically ex-         section of O3 at 254 nm at standard atmospheric tempera-
cited state (NO2 *) and oxygen (O2 ) (Ollison et al., 2013;        ture and pressure conditions (308 atm−1 cm−1 ). Photometric
Boylan et al., 2014). As each unstable NO2 * molecule re-          monitors generally use mercury vapor lamps as the UV light
turns to a lower energy state (NO2 ), it emits a photon (hv).      source, with optical filters to attenuate lamp output at wave-
The reaction causes luminescence in a broadband spectrum           lengths other than 254 nm.
ranging from visible light to infrared light (approximately           Air for the reference cell measurement (I0 ) is typically
590–2800 nm). The two-step gas-phase reaction proceeds as          obtained by passing the ambient air sample stream through
detailed in Eqs. (3–4):                                            a catalytic scrubber containing manganese dioxide (MnO2 ),
                                                                   hopcalite (a mixture of Cu, Mn, and Ag oxides), heated silver
NO + O3 → NO2 ∗ + O2 ,                                      (3)    wool, or another solid state material to “scrub” only O3 from
    ∗                                                              the sample air while preserving all other substances in the
NO2 → NO2 + hv.                                             (4)
                                                                   sample air that potentially absorb at 254 nm (e.g., elemental
The ET-CL method is no longer used nor produced commer-            gaseous mercury [Hg0 ], hydrogen, sulfide [H2 S], VOCs) so
cially and has been replaced by the NO-CL method. Similar          that their effects are canceled in the differential I /I0 mea-
to the ET-CL method, the NO-CL method requires a con-              surement. The integrity of the O3 reference scrubber is crit-
stant supply of gas, in this case NO, for continuous oper-         ical and may allow measurement interferences if it does not
ation. Both the ET-CL and NO-CL methods are subject to             perform adequately. Similarly, any tendency of the scrub-
slight interferences by water vapor. However, these potential      ber to fail to effectively remove all O3 from the reference
interferences can be eliminated through the use of a Nafion® -     sample will result in a measurement bias. In addition to O3 ,
based dryer or equivalent sample water vapor treatment sys-        catalytic scrubbers have been shown to remove UV-active
tem. The ET-CL method was promulgated as the Federal Ref-          VOCs (Kleindienst et al., 1993), creating the potential for
erence Method (FRM) for measuring O3 in the atmosphere in          positive artifacts in O3 measurements when the efficiency of
1971, and the NO-CL method was promulgated as the FRM              this VOC removal is impacted.
in 2015 (U.S. EPA, 2015).                                             Although FEM-designated UV photometric instruments
   While the chemiluminescence method for measuring O3             are accurate under most ambient conditions, locations with
is technically robust and free of analytical artifacts (Long et    high VOC concentrations can produce significant analyti-
al., 2014), it is not widely used in the United States. Instead,   cal artifacts. Smoke-plume-impacted locations and measure-
Federal Equivalent Methods (FEM) based upon UV photom-             ments downwind from wildland fires are a particular con-
etry are employed at the majority of O3 regulatory monitor-        cern; O3 measurements of up to 320 ppb were observed in a
ing locations. According to July 2020 data from the United         smoke plume in western Oregon using a Dasibi 1003AH UV
States Environmental Protection Agency (EPA) Air Quality           photometric O3 monitor (Huntzicker and Johnson, 1979),
System (AQS) database, the UV photometric method repre-            which also showed a correlation between apparent O3 and
sents 99 % of the roughly 1200 instruments deployed in net-        aerosol concentrations (bscat , a combustion plume indica-
work monitoring for O3 National Ambient Air Quality Stan-          tor in this case). O3 measurements from UV photomet-
dard (NAAQS) attainment. UV photometric methods for O3             ric instruments exceeding 1500 ppb at night (22:00–05:00)
are generally considered easier to deploy and operate and in       were observed in Fort McMurray, Alberta, during smoke im-
most cases do not require external compressed gases for op-        pacts from the 2016 Horse River Fire, which were positively

Atmos. Meas. Tech., 14, 1783–1800, 2021                                             https://doi.org/10.5194/amt-14-1783-2021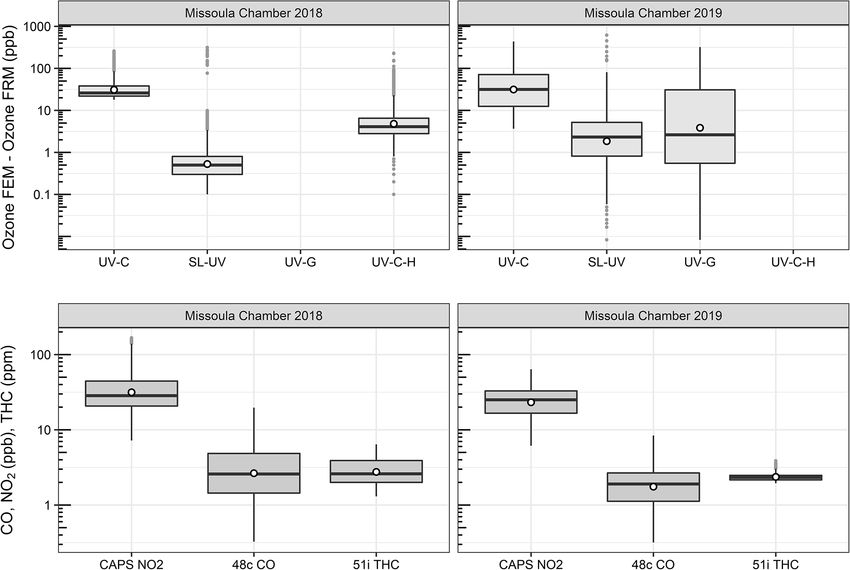
R. W. Long et al.: Comparison of ozone measurement methods in biomass burning smoke                                        1785

correlated with NO and non-methane hydrocarbons (Lan-              (which the instrument converts to NO) to serve as the scrub-
dis et al., 2018). Follow-up pyrolysis experiments demon-          ber gas.
strated that ET-CL instruments do not show a similar re-              In this study, we investigate UV photometric FEM instru-
sponse to biomass burning smoke (Huntzicker and Johnson,           ment O3 measurement interferences in fresh biomass burn-
1979). Photochemical chamber experiments comparing the             ing smoke plumes from prescribed grassland fires and dur-
O3 response of UV (Dasibi model 1003AH, Dasibi model               ing controlled burn experiments in a large-scale combustion
1008AH, and Thermo model 49) and ET-CL (Bendix model               chamber. We directly compare NO-CL FRM O3 measure-
8002 and Monitor Labs model 8410) mixtures show neg-               ments to several FEM-designated UV photometric technolo-
ligible differences for irradiated paraffin–NOx and olefin–        gies, including a gas-phase scrubber and catalytic scrubbers
NOx mixtures but do show a positive UV interference in             with and without Nafion® tube dryer systems. Based on the
mixtures with toluene and other aromatics present (Klein-          results from the measurements, we assess the magnitude of
dienst et al., 1993). Laboratory studies comparing the re-         the observed artifacts for different technologies and under
sponse of UV (Thermo model 49, Horiba APOA-370, and 2B             various smoke conditions and provide suggestions for poten-
Tech model 202) and ET-CL (Bendix) instruments showed a            tial mitigation of the interferences.
positive interference for o-nitrophenol, naphthalene, and p-
tolualdehyde for the UV instruments but not the ET-CL in-
struments (Grosjean and Harrison, 1985; Spicer et al., 2010).      2     Methods
Additionally, during the Mexico City Metropolitan Area
                                                                   2.1    Overview of methods evaluated
(MCMA-2003) field campaign a mobile laboratory using
an FEM-designated UV photometric O3 monitor (unheated              In this study we compared the measurement results from six
MnO2 scrubber, Thermo 49 series) showed a large positive           different commercially available FRM- and FEM-designated
O3 interference (∼ 400 ppb) associated with PM2.5 and pol-         O3 instruments operated in ambient or chamber-generated
yaromatic hydrocarbons (PAHs) when following some diesel           biomass burning smoke. All instruments were operated ac-
vehicles (Dunlea et al., 2006). Although not compared to           cording to their FRM or FEM designation. The six instru-
a chemiluminescence instrument, those high O3 values are           ments differed by measurement principle (chemilumines-
unlikely real considering the high concurrent NO concentra-        cence versus UV photometric) and by sample treatment con-
tions (in some cases >1000 ppb). The authors of this study         figuration (scrubber material, presence of dryer, etc.). For
attributed the interference to fine particles, based on the        interference-free O3 measurements, we utilized the newly
correlation with PM2.5 and the lack of a correlation with          designated FRM NO-CL method (U.S. EPA, 2015). For the
gas-phase organic species measured by the proton-transfer-         UV photometric methods, we compared both catalytic scrub-
reaction mass spectrometer (PTR-MS; Dunlea et al., 2006).          ber and “scrubberless” (gas-phase chemical scrubber) tech-
   In addition to interferences from the presence of aro-          nologies, with the scrubberless monitor using a NO chemi-
matic VOCs and semi-volatile PAHs, water vapor (rela-              cal scrubber. Finally, within the catalytic scrubber UV photo-
tive humidity) issues have also been observed with older-          metric category, we compared instruments with and without
generation FRM- and FEM-designated chemiluminescence               Nafion® tube dryer systems. The operation principle and des-
and UV photometric O3 instruments, respectively (Kleindi-          ignations (FRM vs. FEM) for the analyzers under investiga-
enst et al., 1993; Leston et al., 2005; Wilson and Birks, 2006).   tion are summarized in Table 1 and described in Sect. 2.1.1–
As such, Nafion® tube dryers are regularly incorporated into       2.1.4. These analyzers were operated immediately downwind
some newer-generation chemiluminescence and UV photo-              of fresh biomass burning plumes over 8 d of prescribed fires
metric O3 monitors in an attempt to mitigate the humidity-         in grassland ecosystems in Oregon and Kansas and during
related measurement artifacts.                                     laboratory-based studies at the U.S. Forest Service’s (USFS)
   A recently introduced variation in the UV photometric           combustion facility at the Fire Sciences Laboratory (FSL) in
method, known as the “scrubberless” UV photometric (SL-            Missoula, Montana. The grassland fire fuels consisted pri-
UV) method (Ollison et al., 2013), specifies removal of O3         marily of mixed native prairie tallgrass of varying moisture
from the sample air for the reference by a gas-phase reac-         content. A total of 7 of the 8 d of prescribed burning were
tion with NO rather than using a conventional solid-state cat-     conducted in the tallgrass prairie ecosystem of central Kansas
alytic scrubber. The NO gas-phase chemical scrubber reacts         (4 d in March of 2017 and 3 d in November of 2017). The
with O3 much faster and more selectively than with other po-       additional burn day was conducted at the Sycan Marsh in
tential interfering compounds and is very effective at remov-      central Oregon (October of 2017). Laboratory-based cham-
ing the O3 without affecting other interfering compounds that      ber burns at the FSL were conducted during April 2018
may be present in ambient air. The differential UV measure-        and again during April 2019. Fuels for the laboratory based
ment can then effectively reduce interferences to an insignif-     chamber burns consisted of ponderosa pine needles and fine
icant level. Similar to NO-CL, the SL-UV method requires a         woody debris. Details of the individual studies are provided
continuous supply of compressed NO or nitrous oxide (N2 O)         in Sect. 2.2–2.6.

https://doi.org/10.5194/amt-14-1783-2021                                            Atmos. Meas. Tech., 14, 1783–1800, 2021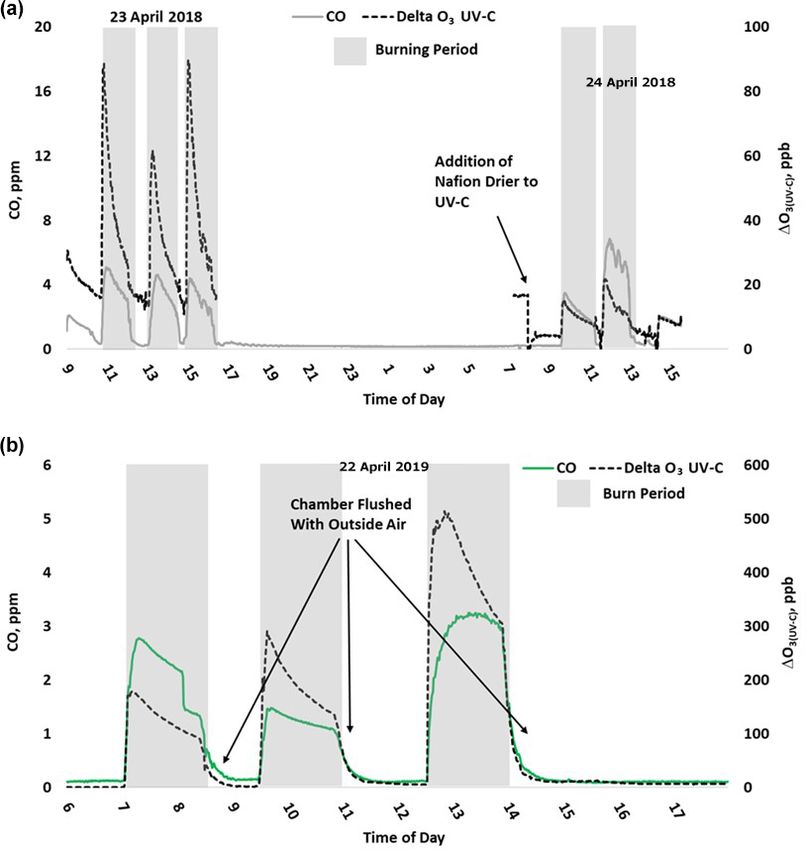
1786                                    R. W. Long et al.: Comparison of ozone measurement methods in biomass burning smoke

Table 1. Ozone measurement methods investigated. N/A – Not applicable

  Name           Manufacturer             Model        Method             Scrubber                   Cells      Humidity                        Deployment∗
                                                                                                                correction
  U.S. EPA Federal Reference Methods (FRM)
  NO-CL          Teledyne API              T-265       CL (NO)            N/A                             1     Nafion® -based                  K1, S, K2,
                                                                                                                (dryer)                         T, M1, M2
  U.S. EPA Federal Equivalent Methods (FEM)
  UV-C           Thermo Scientific               49i   UV (254 nm)        Catalyst (MnO2 )                2     None                            K1, S, K2,
                                                                                                                                                T, M1, M2
  UV-C-H         2B Technologies             205       UV (254 nm)        Catalyst (hopcalite)            2     Nafion® -based                  K1, S, K2,
                                                                                                                (equilibration)                 T, M1
  SL-UV          2B Technologies             211       UV (254 nm)        Gas chemical (NO)               2     Nafion® -based                  K1, M1, M2
                                                                                                                (equilibration)
  UV-G           2B Technologies          211-G        UV (254 nm)        Heated graphite                 2     Nafion® -based                  M2
                                                                                                                (equilibration)
 ∗ K1 – Konza Prairie March 2017; S – Sycan Marsh, October 2017; K2 – Konza Prairie November 2017; T – tallgrass prairie November 2017; M1 – Missoula chamber
 April 2018; M2 – Missoula chamber April 2019.

2.1.1    NO chemiluminescence                                                            The UV photometric with a Nafion® humidity condition-
                                                                                      ing system was represented in this study by a 2B Technolo-
The FRM O3 measurement method was the Teledyne API                                    gies (Boulder, CO, USA) model 205 (2B 205) O3 monitor.
(San Diego, CA, USA) model T265 chemiluminescence                                     The 2B 205 utilized a dual-cell design where sample air and
monitor (TAPI T265), which utilizes a NO-CL measurement                               scrubbed air are measured simultaneously. The 2B 205 uses
principle. These NO-CL O3 analyzers have been shown to                                a hopcalite (CuO/MnO2 ) catalytic scrubber to remove O3
be free of interferences (Long et al., 2014) and have been                            from the reference stream. This instrument will be referred
used as a reference method in other O3 comparison studies                             to as UV-C-H. Manufacturer-provided performance specifi-
(Williams et al., 2006; Landis et al., 2021). Although there is                       cations for the UV-C-H-based 2B 205 are given in Table S1.
a known water vapor interference with chemiluminescence
technology (Kleindienst et al., 1993), the TAPI T265 uses
a Nafion® tube dryer system to remove water vapor from                                2.1.3     Scrubberless UV photometric
the air prior to making the measurement, thus eliminating
any humidity-related effects. Like the ET-CL technologies                             For comparison with the NO-CL, UV-C, and UV-C-H
(Kleindienst et al., 1993), the NO-CL analyzers have no doc-                          methodologies, a scrubberless UV (SL-UV) photometric an-
umented VOC interferences. Manufacturer-provided perfor-                              alyzer with a gas-phase (NO) chemical scrubber was em-
mance specifications for the NO-CL-based TAPI T265 are                                ployed (Ollison et al., 2013; Johnson et al., 2014). The ad-
given in Table S1.                                                                    dition of NO gas to the reference stream selectively scrubs
                                                                                      O3 while not significantly affecting interfering VOC species,
2.1.2    Catalytic scrubber UV photometric                                            resulting in an interference-free O3 determination. Inclusion
                                                                                      of this instrument in the study allows evaluation of the impact
For this study the UV photometric method with no hu-                                  of the UV method in general (compared with chemilumines-
midity correction was represented by the Thermo Scientific                            cence) versus the influence of specific scrubber technologies.
(Franklin, MA, USA) model 49i (Thermo 49i), which is a                                The SL-UV method is represented by the 2B Technologies
dual-cell instrument with a manganese oxide (MnO2 ) cat-                              model 211 scrubberless ozone monitor (2B 211). The model
alytic scrubber, referred to as UV-C. Nafion® -based humid-                           2B 211 requires a continuous supply of compressed NO or
ity systems or dryers have been employed within photomet-                             nitrous oxide (N2 O) (which the instrument converts to NO).
ric O3 monitors with catalytic scrubbers before the measure-                          The SL-UV method also utilizes a Nafion® -based sample
ment cell, offering a reduction in relative humidity interfer-                        humidity conditioning system to eliminate any humidity ef-
ences and artifacts (Wilson and Birks, 2006). Manufacturer-                           fects. The SL-UV instrument was not used in the October
provided performance specifications for the UV-C-based                                or November 2017 burns due to the lack of the necessary
Thermo 49i are given in Table S1.                                                     reagent gas (nitrous oxide, N2 O) needed to run the instru-

Atmos. Meas. Tech., 14, 1783–1800, 2021                                                                       https://doi.org/10.5194/amt-14-1783-2021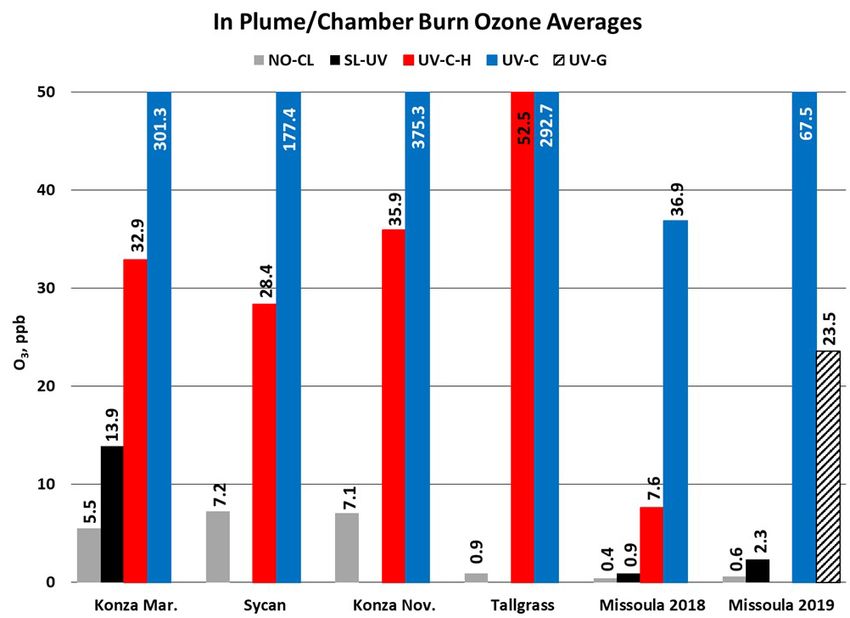
R. W. Long et al.: Comparison of ozone measurement methods in biomass burning smoke                                      1787

ment. Manufacturer-provided performance specifications for       brations for NO, NO2 , NOx , and CO were performed using
the SL-UV-based 2B 211 are given in Table S1.                    the same calibrator and zero air generator utilizing a certi-
                                                                 fied EPA protocol tri-blend (CO, NO, SO2 ) gas cylinder (Air-
2.1.4    Heated graphite scrubber UV photometric                 gas). Per the manufacturer-provided operator’s manual, cali-
                                                                 brations for THC were performed using the T700U calibrator
During the final phase of laboratory-based burning, a 2B         and a certified EPA methane–propane gas cylinder (Airgas).
Technologies model 211-G UV photometric analyzer (2B             FID response factors for organic compounds can vary signif-
211-G) was operated for comparison to the monitors detailed      icantly based upon factors such as carbon number and com-
in Sect. 2.1.1–2.1.3. The 2B 211-G differs from the 2B 211 in    pound class (Tong and Karasek, 1984). The carbon numbers
that it employs a heated graphite scrubber to remove O3 from     for methane and propane vary by a factor of 3 and the FID
the reference sample stream (I0 ) (Turnipseed et al., 2017).     response factors for those compounds may also vary by a
The 2B 211-G utilizes the same Nafion® -based sample hu-         similar amount. In addition, the complex mixture of hydro-
midity conditioning system as employed in the 2B 211. For        carbons found in smoke will have large variations in carbon
the purposes of this paper the UV photometric method em-         number and FID response factors. As such, the results ob-
ploying the heated graphite scrubber is referred to as UV-       tained with the THC analyzer are an approximation of THC
G. Manufacturer-provided performance specifications for the      (and VOC) concentrations in smoke. In addition, for THC
UV-G-based 2B 211-G are given in Table S1.                       calibrations, the T701H zero-air generator was replaced with
                                                                 scientific-grade zero-air compressed gas cylinders (Airgas).
2.2     Prescribed fire burn mobile sampling platform
                                                                 2.3   Kansas prescribed burns, March 2017
During the prescribed fire grass burns, all study instrumen-
tation (analyzers, data acquisition systems, and peripheral      Biomass burning plumes were sampled over 4 d of prescribed
systems) were mounted in portable instrument racks and           burns (15–17 and 20 March 2017) on the Konza Prairie Long
installed inside an enclosed EPA 4 × 4 vehicle (Whitehill        Term Ecological Research (LTER) site outside of Manhattan,
et al., 2019). The instruments were connected via perflu-        Kansas. The fuels for this series of burns consisted of mixed
oroalkoxy alkane (PFA) Teflon® tubing (0.64 cm diame-            native prairie tallgrass of varying moisture content. Over the
ter) to PFA Teflon® filter packs loaded with 47 mm, 5 µm         4 d period, a total of 13 burns were conducted and sampled.
pore size pressure-drop-equivalent Millipore (Burlington,
MA, USA) Omnipore® polytetrafluoroethylene (PTFE) fil-           2.4   Oregon prescribed burns, October 2017
ter membranes which were (i) mounted to a rooftop sampling
                                                                 A single 10 h day of prescribed grassland burning was mea-
platform during spring 2017 sampling or (ii) connected to a
                                                                 sured at the Sycan Marsh Preserve in central Oregon on
cross-linked Teflon® -coated high-flow manifold mounted on
                                                                 11 October 2017. Fuels for the Sycan Marsh burn consisted
the inside roof of the truck compartment during fall 2017
                                                                 of mixed native prairie tallgrass of varying moisture content.
sampling. The truck was positioned downwind of active
biomass burning plumes, usually within meters to hundreds        2.5   Kansas prescribed burns, November 2017
of meters of the active fire line, and positioned so that the
trailer was downwind of the sample inlets (to avoid interfer-    Biomass burning plumes were sampled during a single day of
ences from generator exhaust). In addition to the O3 analyz-     prescribed burning (10 November 2017) on the Konza Prairie
ers under investigation, additional monitors were also oper-     LTER site outside of Manhattan, Kansas, and on 2 additional
ated for the determination of carbon monoxide (CO), NO,          days (13 and 15 November 2017) at the Tallgrass Prairie Na-
NO2 , total oxides of nitrogen (NOx = NO + NO2 ), and total      tional Preserve outside Strong City, Kansas. Fuels for the
hydrocarbons (THCs, to approximate VOC concentrations).          November 2017 burns consisted of mixed native prairie tall-
The operation principle and designation (FRM vs. FEM) in-        grass of varying moisture content. During the 10 November
formation for the additional analyzers deployed in this study    sampling, two separate burns were conducted. Three burns
are summarized in Table 2. Data from all instruments were        were conducted over the 2 d at Tallgrass Prairie National Pre-
recorded on an Envidas Ultimate data acquisition system.         serve.
   All instruments were calibrated with multipoint calibra-
tions before and after each sampling day. All pre- and           2.6   USFS Missoula burn chamber burns 2018, 2019
post-calibrations met our quality performance objectives of
±10 % and linearity of r 2 ≥ 0.99. For the O3 analyzers un-      Laboratory-based studies were performed at the US Forest
der investigation, field and laboratory calibrations were per-   Service’s combustion testing facility at the FSL in Missoula,
formed using a Teledyne API model T700U dynamic dilu-            Montana, by EPA and USFS personnel. These static cham-
tion calibrator with a NIST traceable O3 photometer and O3       ber burns occurred in the spring of 2018 (16–24 April 2018,
generation system. Zero air for the calibrator was supplied      33 burns; Landis et al., 2021) and again in the spring of
by a Teledyne API model T701H zero-air generator. Cali-          2019 (15–26 April 2019, 31 burns). The main combus-

https://doi.org/10.5194/amt-14-1783-2021                                          Atmos. Meas. Tech., 14, 1783–1800, 2021
1788 R. W. Long et al.: Comparison of ozone measurement methods in biomass burning smoke
Table 2. Additional measurement methods operated during the present study.
Pollutant Manufacturer Model Method FRM/FEM Deploymentf
CO Teledyne API 48C NDIRa FRM K1, S, K2, T, M1, M2
NO2 Teledyne API T500U CAPSb FEM K1, S, K2, T, M1, M2
NO, NO2 , NOx Thermo Scientific 42C CL (O3 )c FRM K1, K2, T, M1
NO, NO2 , NOx Teledyne API T200/T201e CL (O3 ) FRM M1, M2
THC Thermo Scientific 51i FIDd NA K2, T, M1, M2
a Non-dispersive infrared absorption. b Cavity-attenuated phase shift. c Ozone chemiluminescence. d Flame ionization detector. e The
Teledyne API model T201 is not a designated FRM or FEM; however it employs the same operating principle as the FRM-designated
model T200. f K1 – Konza Prairie March 2017; S – Sycan Marsh October 2017; K2 – Konza Prairie November 2017; T – tallgrass prairie
November 2017; M1 – Missoula chamber April 2018; M2 – Missoula chamber April 2019.
tion chamber is a square room with internal dimensions with CO and THC (biomass burning indicators) and NO2 .
of 12.4 m × 12.4 m × 19.6 m high and a total volume of These correlations will be discussed separately. The UV-C-
3000 m3 and has been described previously (Bertschi et al., H instrument (2B 205) also showed increased readings in
2003; Christian et al., 2004; Yokelson et al., 1996; Landis et smoke plumes (also correlated with CO, THC, and NO2 ),
al., 2021). During the combustion chamber studies, the fa- but with absolute measurements roughly an order of magni-
cility was fitted with identical instrumentation racks, calibra- tude smaller than the UV-C instruments. The NO-CL (T265)
tion systems, systems for sampling of test atmosphere, and instrument results showed the opposite behavior, with reduc-
data acquisition systems as those described in Sect. 2.2. All tions in O3 readings inversely correlated with increases in
instrumentation was housed in an observation room imme- NO2 concentrations, as expected from general O3 titration
diately adjacent to the combustion chamber with PFA inlet by NO (NO + O3 → NO2 + O2 ). For the March 2017 mea-
lines extending through the wall into the chamber. All in- surements the SL-UV instrument (2B 211) produced read-
let lines contained an identical filter pack and filter assembly ings roughly comparable with the NO-CL monitor, but with
described in Sect. 2.2 to protect inlet lines and the analyzers substantially more noise on a minute-to-minute timescale.
from particulate contamination. Fuel beds consisting of pon- The “in-plume” average O3 concentrations from the four pre-
derosa pine needles and mixed woody debris were prepared scribed grassland burning periods are shown in Fig. 2. For the
and placed in the middle of the chamber. The amount and purposes of this comparison, CO measurements were used
moisture content of the fuels were varied to generate different as an indicator of when sampling occurred in plume. In ad-
flaming/smoldering conditions during the burns. During the dition, ambient RH values were generally below 50 % indi-
chamber burns the combustion room was sealed and the fuel cating that the spring and fall 2017 prescribed burns were
bed was ignited. Two large circulation fans on the chamber conducted under dry conditions.
walls and one on the ceiling facilitated mixing and assured
homogeneous conditions during the burn periods (Landis et 3.2 Results from ozone measurements in USFS
al., 2021). In general, chamber relative humidity (RH) values chamber burns
were below 50 %, facilitating dry burning conditions.
O3 measurement results from the 2018 and 2019 USFS
3 Results and discussion chamber burn studies are shown in Fig. 3. Time series plots of
the chamber study data are included in Supplement Figs. S4
3.1 Results from ozone measurements in prescribed and S5. Figure 4 gives a more detailed view of UV-C and
grassland fire plumes NO-CL O3 results (2 d from 2018 and 1 d from 2019) during
the chamber burns. In contrast to the prescribed grassland
O3 measurement results from the Oregon and Kansas pre- burns, the Missoula chamber burns employed differing fuel
scribed grassland fire studies are shown as the difference types (ponderosa pine needles and fine woody debris) that
between the FEM and FRM in Fig. 1, and 1 min average are more typical of fuels consumed during western US for-
time series plots for the studies are presented in Supple- est fires. In addition, the concentrations of pollutants gener-
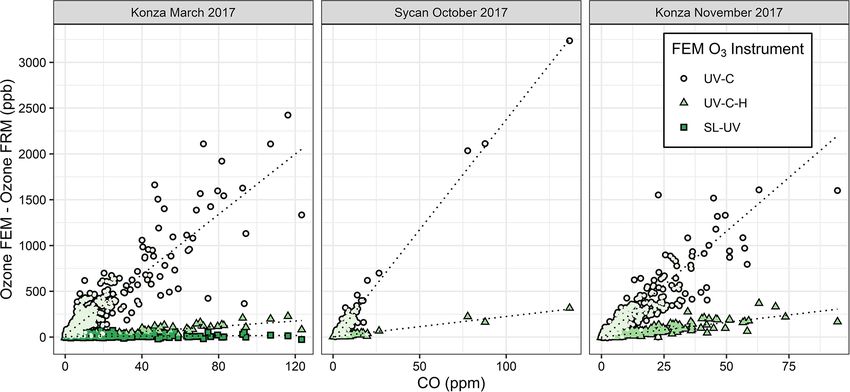
ment Figs. S1–S3. There were significant differences in the ated and observed during the chamber studies were approx-
measurement results obtained from the different O3 moni- imately an order of magnitude smaller than those observed
tors operated during the prescribed fires. The UV-C instru- during the prescribed grassland fires. For reference, maxi-
ment (Thermo 49i) consistently showed large increases in mum PM2.5 concentrations observed during the prescribed
O3 concentration readings in fresh biomass burning plumes, fires were in excess of 50 mg m−3 while maximum chamber
with measurements exceeding the FRM measurement by 2– PM2.5 concentrations were less than 2 mg m−3 . Regardless of
3 ppm. The O3 exceedances were generally correlated in time these differences, there were still significant (order of magni-
Atmos. Meas. Tech., 14, 1783–1800, 2021 https://doi.org/10.5194/amt-14-1783-2021R. W. Long et al.: Comparison of ozone measurement methods in biomass burning smoke 1789 Figure 1. Ozone concentration differences between FEM instruments and the FRM instrument (FEM − FRM) and the measured NO2 , CO, and total hydrocarbons (THCs) during the three 2017 wildfire deployments. All measurements included are within-smoke-only mea- surements, and show both the elevated smoke tracers (NO2 , CO, THC) and the persistent elevation of the FEM O3 measurements. The box-and-whisker plots indicate the 25th, 50th, and 75th quartiles, with the whiskers extending to 1.5 times the inner quartile range. The open dots indicate the mean values for each instrument within smoke. Figure 2. In-plume O3 concentration averages from the 2017 prescribed grassland burns and the 2018 and 2019 Missoula chamber burns. For the 2017 grassland burning periods, CO concentration results (≥ 1 ppm) were used as an indicator of when in-smoke sampling was occurring. https://doi.org/10.5194/amt-14-1783-2021 Atmos. Meas. Tech., 14, 1783–1800, 2021
1790                            R. W. Long et al.: Comparison of ozone measurement methods in biomass burning smoke

tude or more) differences in the measurement results between      scribed grassland burns. During the summer–fall 2018 North
the different FEM O3 instruments operated during both the         Carolina study and prior to the start of the 2019 chamber
2018 and 2019 chamber studies. The NO-CL method showed            burns, a new MnO2 scrubber was installed and resulted in
identical trends to those observed during the grassland burns     a significant and immediate reduction of the observed high
in that its measured O3 concentrations dropped to near zero       bias, shown in Figs. 4 (bottom panel) and S5.
during the active burning periods as indicated in Fig. 4 (ac-
tive burning periods shaded in grey). The only periods when       3.3   Methodological influence on ozone measurements
significant O3 concentrations were measured by the NO-CL                in biomass burning smoke
method were when outside air was brought in to flush the
chamber in between burns. The post-burn calibration checks        As discussed in Sect. 3.1 and 3.2, there are large (order-of-
on 23 April 2018 revealed a +8 % bias in the NO-CL method         magnitude level) differences in O3 concentration measure-
and a −2 % bias in the UV-C-H method. These biases were           ment results obtained from the FRM (NO-CL) and the FEM
evident during the chamber flush periods on that day. Each        UV photometric with catalytic scrubber (UV-C) O3 methods.
analyzer was re-zeroed and spanned, resulting in the elim-        The extremely low O3 concentrations measured by the NO-
ination of the bias between the two methods as observed in        CL instrument are consistent with O3 depletion in the pres-
the results from the subsequent day (24 April 2018). No other     ence of high NOx concentrations (up to parts-per-million lev-
calibration corrections were made during the 2018 and 2019        els) observed in the grass burning plumes and during cham-
chamber studies. As in the grassland fire plumes, the UV-C        ber burns. The reaction between NO and O3 is rapid and oc-
method showed increased O3 concentration (positive analyt-        curs on the timescales of seconds to minutes. As a result,
ical artifact) readings that were correlated in time with CO      high NO in the fresh biomass combustion plumes will effi-
and NO2 ; see Supplement Figs. S9 and S10. Similarly, the         ciently titrate out O3 , leading to near-field depletion within
UV-C-H instrument also showed increased positive analyti-         the plumes relative to background concentrations. There was
cal artifacts during the chamber burns but with absolute mea-     no sign of a positive interference in the NO-CL monitors,
surement values about an order of magnitude smaller than the      and it remains the most robust and accurate routine method
UV-C instruments. The SL-UV method gave similar results           for O3 measurement in fresh and downwind biomass burning
to the NO-CL method during both the 2018 and 2019 cham-           plumes.
ber burns. Newly added during the 2019 burns, the UV-G               In contrast with the NO-CL FRM instrument results, the
method (2B 211-G) gave mixed results: at times it provided        UV-C FEM results showed substantial increases in reported
similar results compared to the NO-CL and SL-UV methods,          O3 concentrations in the fresh biomass burning plumes.
and at others it provided results in line with those provided     There is no known pathway for direct O3 emission from
by the UV-C method. See Supplement Fig. S5 for the 2019           biomass burning, and the proximity (meters to hundreds of
chamber burn time series plot. The burn average O3 concen-        meters) and timescales (travel time of seconds to minutes
trations from the 2018 and 2019 chamber burns are presented       from the combustion source to measurement) involved are
in Fig. 2.                                                        too short for the usual NOx –VOC photochemistry to pro-
   During the 2018 chamber burns the UV-C results were            duce secondary O3 . Further, since the FSL chamber interior
biased high by 15–20 ppb even during non-burn (i.e.,              is not exposed to sunlight, photochemistry would not have
overnight) periods as evident in Figs. 4 (top panel) and S4.      been active in the Missoula laboratory burns. For the pur-
The initial hypothesis was that the bias was associated with      poses of this work, the positive analytical artifact in the UV-C
high chamber backgrounds of interfering species due to years      method, termed 1O3(UV-C) , is estimated using Eq. (6) as the
of heavy burning in the chamber. However, it was later dis-       difference between UV-C and the NO-CL O3 concentration
covered during a subsequent summer–fall 2018 ambient air          measurement results for the same time period:
study in North Carolina in the absence of smoke that sam-         1O3(UV-C) = UV-C – NO-CL.                                   (6)
pling heavy smoke plumes during the fall 2017 prescribed
grassland burns followed by subsequent storage of the UV-         Figure 5 shows in-plume regressions between 1O3(UV-C) and
C analyzer irreversibly damaged the MnO2 scrubber in the          the FRM measurement and CO for the three measured pre-
UV-C instrument. It is hypothesized that the damage resulted      scribed grassland burns in 2017 (Supplement Fig. S6 shows
in the scrubber removing some of the interfering species in       the time series of 1O3(UV-C) and CO). Figures 5 and S6 show
addition to ozone, preventing them from being subtracted off      good correlations within the smoke plumes. The average and
as background in the reference measurement and subsequent         maximum values of 1O3(UV-C) are summarized in Table 3. It
detection as ozone (positive bias) during the measurement         is hypothesized that the large “O3 ” measurement observed in
cycle. The effect of the bias was observed mainly when sam-       the UV-C method results from a positive interference or ar-
pling ambient and chamber air and not readily observed dur-       tifact, likely linked to VOC emissions in the grassland burn
ing routine calibration checks (zeroes and spans) except for      plumes. VOCs are emitted in higher concentrations from the
an increase in the time required to obtain stable zero and span   smoldering phase of combustion, which is also characterized
values. The bias was not observed during any of the 2017 pre-     by large CO emissions (Yokelson et al., 1996, 1997), so a

Atmos. Meas. Tech., 14, 1783–1800, 2021                                            https://doi.org/10.5194/amt-14-1783-2021
R. W. Long et al.: Comparison of ozone measurement methods in biomass burning smoke                                                    1791

Figure 3. Differences between the FEM and FRM instrument concentrations (FEM − FRM) and NO2 , CO, and total hydrocarbon (THC)
concentrations during the 2018 and 2019 Missoula chamber studies. All measurements included are within-smoke-only measurements and
show both the elevated smoke tracers (NO2 , CO, THC) and the persistent elevation of the FEM O3 measurements compared to the FRM.
The box-and-whisker plots indicate the 25th, 50th, and 75th quartiles, with the whiskers extending to 1.5 times the inner quartile range. The
open dots indicate the mean values for each instrument within smoke.

correlation between CO and O3 artifacts would support the                discussed in Sect. 3.5. In addition, the previously described
hypothesis of a VOC-linked interference for the UV-C in-                 bias related to the damaged MnO2 scrubber was also reduced
struments. This is also consistent with observed VOC inter-              upon addition of the Nafion® dryer to the UV-C method.
ferences in previous studies (Grosjean and Harrison, 1985;                  For the March 2017 Konza Prairie study (Fig. 1) and
Kleindienst et al., 1993; Spicer et al., 2010) and observed              the 2018 and 2019 USFS chamber studies (Fig. 3) the SL-
following fireworks (Fiedrich et al., 2017; Xu et al., 2018).            UV instrument concentration results were comparable to, al-
   The presence of a Nafion® -based humidity conditioning                though noisier and slightly higher than, the NO-CL reference
system (Nafion® tube dryer) significantly reduced the mag-               instrument. On numerous occasions during the prescribed
nitude of the observed artifact as evident by comparing the              and chamber burns, the SL-UV instrument shows short (i.e.,
UV-C and UV-C-H results shown in Figs. 1–3 and S1–S5. As                 1 min data point) positive or negative excursions that are not
with the UV-C method, the artifact in the UV-C-H method,                 also observed in the NO-CL results. In addition, these excur-
1O3(UV-C-H) , is calculated using Eq. (7) as the difference be-          sions are not correlated with changes in CO concentrations.
tween UV-C-H and the NO-CL O3 concentration measure-                     Because the SL-UV is a dual-cell instrument that measures
ment results for the same time period:                                   O3 by comparing the absorbance of two cells, it is critical
                                                                         in highly dynamic environments (such as during this study)
1O3(UV-C-H) = UV-C-H – NO-CL.                                   (7)      that both cells be measuring the same air at the same time. A
                                                                         slight difference in flow rates or residence times between the
The addition of the Nafion® -based humidity conditioning
                                                                         two pathways (or a delay in one pathway relative to the other)
system reduces the magnitude of the 1O3(UV-C-H) artifact
                                                                         will cause short-term variability in the difference between the
by approximately an order of magnitude compared with
                                                                         two cells. Although this does not pose an issue for longer
the UV-C method. This is further illustrated in the 2018
                                                                         time averaging (i.e., hourly data) under stable conditions, the
chamber burns, where prior to beginning the final burn day
                                                                         dynamic nature of biomass burning plumes (i.e., changing on
on 24 April 2018, a Nafion® tube dryer (PermaPure, MD
                                                                         the order of seconds) and short time averages (i.e., minute)
Monotube Dryer Series) was installed in the UV-C method
                                                                         can create issues (noise) for the SL-UV method.
(Thermo 49i), in effect converting it to a UV-C-H method.
                                                                            Significant analytical artifacts were observed for FEM
As shown in Figs. 4 and S4, the addition of the Nafion® tube
                                                                         UV photometric O3 instruments with (UV-C-H) and with-
dryer significantly reduced the 1O3(UV-C) artifact to a point
                                                                         out (UV-C) Nafion® -based humidity conditioning systems,
comparable with that observed in the UV-C-H method (2B
                                                                         where it appears that the dual effect of ambient humidity fluc-
205). A possible explanation for this effect is presented and

https://doi.org/10.5194/amt-14-1783-2021                                                    Atmos. Meas. Tech., 14, 1783–1800, 2021
1792 R. W. Long et al.: Comparison of ozone measurement methods in biomass burning smoke Figure 4. Time series example of USFS chamber burn O3 results from the NO-CL, UV-C, and UV-C-H (2018 only) from 23–24 April 2018 (a) and 22 April 2019 (b). O3 concentrations are displayed on a logarithmic scale. The post-burn calibration checks on 23 April 2018 revealed a +8 % bias in the NO-CL method and a −2 % bias in the UV-C-H method. These biases were evident during the chamber flush periods on that day. Each analyzer was re-zeroed and spanned, resulting in the elimination of the bias between the two methods as observed in the results from the subsequent day (24 April 2018). Figure 5. Scatter plots between FEM and FRM O3 differences and the CO measurements within the grassland fire smoke plumes. The FEM measurements are differentiated by color and shape. The SL-UV method was only run during the Konza March 2017 measurements. Atmos. Meas. Tech., 14, 1783–1800, 2021 https://doi.org/10.5194/amt-14-1783-2021
R. W. Long et al.: Comparison of ozone measurement methods in biomass burning smoke                                              1793

Table 3. Ozone artifact (1O3 ) averages, maximum values, and CO, NO2 , and THC averages from the prescribed fire and USFS chamber
burns as measured by the UV-C, UV-C-H, and UV-G instruments.

               Study                                       1O3 avg.       1O3 max      CO avg.    NO2 avg.    THC avg.
                                                              (ppb)          (ppb)      (ppm)        (ppb)      (ppm)
               1O3(UV-C)
               Mar. 2017 Konza Prairie (KS)                   295.8          2423.7       15.8       147.3            –
               Oct. 2017 Sycan Marsh (OR)                     170.2          3235.5        8.5        60.5          2.7
               Nov. 2017 Konza & tallgrass prairies (KS)      330.0           3156        14.1       156.9          4.0
               Apr. 2018 USFS chamber (MT)                     36.5           309.6        3.8        35.6          2.8
               Apr. 2019 USFS chamber (MT)                     66.9           530.9        2.1        31.7          4.8
               1O3(UV-C-H)
               Mar. 2017 Konza Prairie (KS)                      42.8         227.1       15.8       147.3            –
               Oct. 2017 Sycan Marsh (OR)                        21.1         316.4        8.5        60.5          2.7
               Nov. 2017 Konza & tallgrass prairies (KS)         40.2         369.0       14.1       156.9          4.0
               Apr. 2018 USFS chamber (MT)                        7.2         136.8        3.8        35.6          2.8
               1O3(UV-G)
               Apr. 2019 USFS chamber (MT)                       22.9         376.8         2.1       31.7          4.8
               1O3(SL-UV)
               Mar. 2017 Konza Prairie (KS)                       8.3          74.2       15.8       147.3            –
               Apr. 2018 USFS chamber (MT)                        0.5          11.5        3.8        35.6          2.8
               Apr. 2019 USFS chamber (MT)                        1.7          32.1        2.1        31.7          4.8

tuations and VOC interferences caused large positive over-              newest generation of commercially available NO-CL FRM
measurement of in-smoke O3 concentrations. Chemilumi-                   instruments, including that used here (the Teledyne T265),
nescence monitors are highly specific to O3 and have long               have a built-in drying system to correct for the humidity arti-
been known to be free of VOC interferences (Long et al.,                facts that affected earlier-generation chemiluminescence in-
2014; U.S. EPA, 2015). However, studies have shown that                 struments (Kleindienst et al., 1993), making remaining inter-
the chemiluminescence method can be impacted by changes                 ferences negligible compared to other technologies.
in relative humidity (Kleindienst et al., 1993). As such, upon             The gas-phase chemical scrubber UV instrument (2B 211)
promulgation in 2015, the new NO-CL FRM regulatory text                 did not perform as well as the FRM under the prescribed
requires a humidity correction–dryer system to eliminate the            grassland burns or chamber experimental conditions tested
potential water vapor interference. As configured from the              here, with the high-time-resolution (1 min) data showing a
manufacturer, the NO-CL-based Teledyne-API model T265                   much higher degree of variability than the NO-CL FRM in-
instrument operated during this comparative study employs               strument. We hypothesize that the main factor driving this
Nafion® drying technologies to reduce or eliminate the water            divergence between this method and the NO-CL FRM is the
vapor interferences. The use of a chemical (NO) scrubber for            dual-cell differential configuration of the instrument, which
UV photometric instruments (such as the 2B Technologies                 is not conducive to rapidly changing concentrations in O3 or
model 211) is very specific to O3 and shows a much better               other absorbing gases, such as VOCs.
response than the catalytic scrubber instruments, performing               In smoke-impacted monitoring situations where the use of
almost as well as the NO-CL FRM, and has significant poten-             a UV photometric instrument is still preferred or required, the
tial as a low-interference O3 method. Of the catalytic scrub-           choice of a monitor with humidity equilibration provides a
ber photometric instruments, those with Nafion® -based hu-              significant analytical improvement over those monitors with-
midity equilibration (2B Technologies model 205) perform                out the humidity corrections. In the absence of an instrument
significantly better than those without (Thermo 49 series).             with a Nafion® tube dryer and in non-regulatory applications,
   In areas highly impacted by smoke or for studies focusing            a dryer can be installed before the inlet or measurement cells
on biomass burning plumes, the use of a NO-CL FRM instru-               to reduce the interference, as was demonstrated on the final
ment is highly recommended as it was found to be essentially            day of the 2018 Missoula chamber burns. This will have the
interference-free. These instruments are anchored to absolute           added benefit of reducing positive biases from humidity and
O3 concentrations through the use of certified O3 calibration           reducing equilibration time for calibrations (especially when
sources, many of which are based on UV photometry. The

https://doi.org/10.5194/amt-14-1783-2021                                                 Atmos. Meas. Tech., 14, 1783–1800, 2021
1794 R. W. Long et al.: Comparison of ozone measurement methods in biomass burning smoke
switching from high-humidity ambient air to dry calibration resulted in what would be considered high PM concentra-
gases). tions (2–50 mg m−3 ). These high PM concentrations, how-
ever, are not considered to be interfering due to the presence
3.4 Magnitude of ozone artifact in fresh biomass of the inline particle filter assemblies described in Sect. 2.2
burning plumes relative to markers of combustion and 2.6.
Since the CO concentrations (from upwind fires) observed
It is difficult to estimate an absolute magnitude or correct for at most stationary sites from fire plumes are usually on the or-
the observed O3 analytical artifact since primary emissions der of 1 ppm to greater than 10 ppm (Landis et al., 2018), it is
from biomass combustion are highly variable and depend reasonable to assume that O3 artifacts in the range of 15 ppb
upon the fuel loading, fuel type and condition, phase of the to greater than 250 ppb can be observed when employing
fire, and the burn conditions (Yokelson et al., 1996, 1997). a UV-C method. Similarly, O3 artifacts in the range of 1.5
However, assuming the interference is driven primarily by to above 30 ppb might be observed at smoke-impacted sites
VOCs, the artifact should be correlated with the excess CO monitoring with UV-C-H methods. As such, Nafion® -based
(1CO = COplume –CObackground ). Because CObackground dur- humidity conditioning systems are highly recommended for
ing the prescribed grassland burns was below 200 ppb (rel- use if employing UV photometric methodology for monitor-
ative to typical conditions of >2 ppm in the plume), 1CO ing O3 in areas impacted by wildfires or prescribed burns. As
is estimated as the total measured CO concentration. A sim- stated previously and as seen in Fig. 3 and Table 3, O3 arti-
plified view of biomass combustion assumes an approximate facts were observed during the Missoula chamber 2018 and
linear combination of two dominant emission phases, flam- 2019 burns in both the UV-C and UV-C-H methods, although
ing combustion (characterized by emission of highly oxi- reduced compared to the prescribed grassland burns. The
dized compounds, such as CO2 , NOx , and SO2 ) and smol- presence and magnitude of the O3 artifact strongly suggest
dering combustion (characterized by emission of reduced or that smoke generated from fuels typical of forests in the west-
mixed oxidation state compounds, such as CO, CH4 , NH3 , ern United States also result in a measurement interference in
H2 S, and most VOCs) (Yokelson et al., 1996, 1997). Because UV photometric methods. Since downwind O3 production in
the majority of VOCs are in a reduced or mixed oxidation biomass burning plumes is a significant issue in fire-impacted
state, they tend to co-emit with CO during smoldering com- regions, having reliable, interference-free methods is critical
bustion, and the VOC concentrations tend to be highly corre- for assessing the contribution of wildland fires to ambient O3
lated with CO in fresh biomass burning plumes (Yokelson et levels.
al., 1996). Scatter plots comparing the FEM instrument arti- Figure 6 gives a detailed time series view of 1O3(UV-C)
facts (1O3(UV-C) ) and CO for the three prescribed grassland and CO from 2 burn days from 2018 and a single day during
burning periods are shown in Fig. 5. Regression statistics of 2019. As indicated, 1O3(UV-C) and CO appear to be corre-
the comparison of 1O3(UV-C) and 1O3(UV-C-H) with CO and lated in time, but when performing linear regression com-
THC for grassland burns are given in Table 4. The magni- parisons of 1O3(UV-C) and CO during each year’s chamber
tude of the artifact (estimated by the slope of the regression burns as a whole, correlations tend to be poor. We suspect
line of the CO vs. 1O3 comparison), in parts per billion of the positive O3 bias is driven by one or more VOCs (likely
apparent O3 per part per million of CO, ranges between 16– oxygenated VOCs). In fresh smoke the excess concentrations
24 ppb ppm−1 for the UV-C instrument and 1.5–3 ppb ppm−1 of individual VOCs (1X) and VOC sums (1VOC) tend to be
for the instrument with humidity correction (UV-C-H). It is highly correlated with 1CO (Yokelson et al., 1999; Gilman
important to point out that CO, in and of itself, is not con- et al. 2015). The emission ratios of individual VOCs to CO
sidered to be an interfering species in the UV photometric (1X/1CO) can vary considerably with combustion condi-
determination of O3 in that CO absorbs in the infrared (IR). tions such as fuel type and condition (e.g., moisture content
The slight differences in the magnitude of the artifacts (fit- and decay state); fuel bed properties, such as bulk density;
ted regression slopes) along with the low uncertainty (stan- and the relative mix of flaming and smoldering combustion
dard errors) values indicate that the magnitude of the arti- (Gilman et al., 2015; Koss et al., 2018). Additionally, the re-
fact may be influenced by local conditions that make each sponse of 1X/1CO to burn conditions varies among VOCs.
burn unique. Such conditions might include meteorological When each burn is considered individually or in groups with
conditions, fuel composition, fuel moisture content, and time similar conditions, the correlations between 1O3 , CO, and
spent in combustion phase (flaming vs. smoldering). Simi- THC are enhanced. An example of this behavior is shown
lar to CO, THCs and NO2 are indicative of combustion pro- in Fig. S10. For the chamber burns the magnitude of the
cesses and are correlated with 1O3 as given in Table 4 and ozone artifacts in parts per billion of apparent O3 per part
Figs. S7 and S8. In terms of THC, the magnitude of the ar- per million of CO, ranges between 6–210 ppb ppm−1 for the
tifact, in parts per billion of apparent O3 per part per million individual burns. R 2 and standard error values were consis-
THC, is significantly higher at ∼ 88 ppb ppm−1 for the UV-C tent with those observed during the prescribed burns (see Ta-
instrument and ∼ 13 ppb ppm−1 for the UV-C-H instrument. ble 4). The lack of a consistent relationship between the O3
Both the prescribed grassland and Missoula chamber burns artifact and 1CO across all FSL chamber burns, while ob-
Atmos. Meas. Tech., 14, 1783–1800, 2021 https://doi.org/10.5194/amt-14-1783-2021R. W. Long et al.: Comparison of ozone measurement methods in biomass burning smoke 1795
Table 4. Regression statistics for the ozone artifact (1O3 ) versus CO and THC for UV photometric instruments without (UV-C) and with
(UV-C-H) a Nafion® -based humidity equilibration system during the 2017 prescribed grassland burns.
Study Slope (ppb/ppm) Intercept (ppb) r2 n
1O3(UV-C) vs. CO
Mar. 2017 Konza Prairie (KS) 16.46 (±0.34)a 18.53 (± 6.72)b 0.79 653
Oct. 2017 Sycan Marsh (OR) 24.02 (±0.25) −28.05 (±2.73) 0.96 295
Nov. 2017 Konza & tallgrass prairies (KS) 23.51 (±0.73) −20.8 (±13.03) 0.74 461
1O3(UV-C) vs. THC
Nov. 2017 Konza & tallgrass prairies (KS) 87.14 (±3.74) −85.36 (±18.63) 0.59 461
1O3(UV-C-H) vs. CO
Mar. 2017 Konza Prairie (KS) 1.46 (±0.04) 0.87 (±1.03) 0.80 163
Oct. 2017 Sycan Marsh (OR) 2.21 (±0.05) 3.44 (±0.54) 0.88 296
Nov. 2017 Konza & tallgrass prairies (KS) 3.24 (±0.09) −1.17 (±1.67) 0.77 461
1O3(UV-C-H) vs. THC
Nov. 2017 Konza & tallgrass prairies (KS) 13.27 (±0.39) −14.53 (±1.92) 0.75 461
THC vs. CO
Nov. 2017 Konza & tallgrass prairies (KS) 0.21 (±0.004) 1.55 (±0.08) 0.79 461
a Standard error or uncertainty of the linear regression slope in parts per billion per part per million.
b Standard error or uncertainty of the linear regression intercept in parts per billion.
serving a good correlation for individual burns, likely reflects humidity level (Wilson and Birks, 2006). Humidity can af-
the variable response of artifact-producing emission(s) to the fect the transmission of the UV light through the detection
different combustion conditions of the burns. cell, and catalytic O3 scrubbers can modulate the water va-
One interesting observation from the data obtained from por in the scrubbed channel by acting as a temporary reser-
both the prescribed grassland and chamber burns is the or- voir, resulting in significant positive or negative O3 interfer-
der of magnitude difference in the average and maximum O3 ences during rapid swings in relative humidity (Wilson et al.,
artifact between the UV-C and the UV-C-H instruments as 2006). Adding a Nafion® -based equilibration dryer imme-
shown in Table 3. Considering that the prescribed grassland diately prior to the measurement cells reduces this water va-
and chamber burns were conducted under dry (RH1796 R. W. Long et al.: Comparison of ozone measurement methods in biomass burning smoke Figure 6. Time series example of USFS chamber burn 1O3 (UV-C) and CO concentration results from 23–24 April 2018 (a) and 22 April 2019 (b). cesses. The species that are responsible for most of the tions above 10−17 cm2 molec.−1 at 254 nm (El Dib et al., O3 artifact in UV-C O3 instruments would have to be 2008). Baker (1974) found 75 % of benzaldehyde was re- permeable through Nafion® membranes or reactive with moved by a Nafion® membrane, meaning that the Nafion® Nafion® membranes; would have to be scrubbed by solid- permeability of tolualdehydes and dimethylbenzaldehydes is phase, catalytic O3 scrubbers (such as MnO2 or hop- also likely to be high. In addition, benzaldehyde was almost calite); and would have a significant absorption cross section quantitatively removed by several commercial catalytic O3 around 254 nm. The absorption cross section of O3 around scrubbers, including the Thermo 49i MnO2 catalytic scrub- 254 nm is on the order of 10−17 cm2 molec.−1 (Molina and ber (Kleindienst et al., 1993), so similar aldehydes are likely Molina, 1986), which means species with absorptions around to behave in a similar manner. Therefore, substituted aro- 10−17 cm2 molec.−1 at 254 nm would be potential interfer- matic aldehyde species are one class of compounds that fit ing species. As a class, aromatic VOCs and specifically the necessary criteria for causing the interference on the UV- oxygenated aromatic species (and other polar-derivatized C while having a reduced interference on the UV-C-H in- species) absorb strongly in this region of the UV spec- strument. Future work examining the potential interferences trum, and their potential permeability through Nafion® mem- from different species (or classes of species) on a species- branes results in them being likely compounds to interfere or class-specific basis are required to confirm this potential in UV-C instruments. As an example, aromatic aldehydes mechanism and suggest others. such as o-tolualdehyde and p-tolualdehyde absorb around 5×10⁻¹⁸ cm2 molec.−1 and 4×10⁻¹⁸ cm2 molec.−1 , respec- tively (Etzkorn et al., 1999). Both 2,4-dimethylbenzaldehyde and 2,6-dimethylbenzaldehyde have absorption cross sec- Atmos. Meas. Tech., 14, 1783–1800, 2021 https://doi.org/10.5194/amt-14-1783-2021
You can also read