A multidisciplinary experimental study on the effects of breeders diet on newborn seahorses (Hippocampus guttulatus) - Research Square
←
→
Page content transcription
If your browser does not render page correctly, please read the page content below
A multidisciplinary experimental study on the
effects of breeders diet on newborn seahorses
(Hippocampus guttulatus)
Miquel Planas ( mplanas@iim.csic.es )
Institute of Marine Research (CSIC), Vigo (Spain) https://orcid.org/0000-0003-1217-5716
Ike Olivotto
Dipartimento di Scienze della Vita e dell’Ambiente, Università Politecnica delle Marche, Ancona (Italy)
https://orcid.org/0000-0002-0906-4225
María Jesús González
Intitute of Marine Research (CSIC), Vigo (Spain) https://orcid.org/0000-0003-2296-185X
Rosaria Laurá
Dipartimento di Scienze Veterinarie, Università di Messina, Messina (Italy) https://orcid.org/0000-0001-
6847-880X
Matteo Zarantoniello
Dipartimento di Scienze della Vita e dell’Ambiente, Università Politecnica delle Marche, Ancona (Italy)
Research Article
Keywords: Syngnathidae, seahorse, Hippocampus, diet, breeding, newborn, quality
DOI: https://doi.org/10.21203/rs.3.rs-34728/v1
License: This work is licensed under a Creative Commons Attribution 4.0 International License.
Read Full License
Page 1/40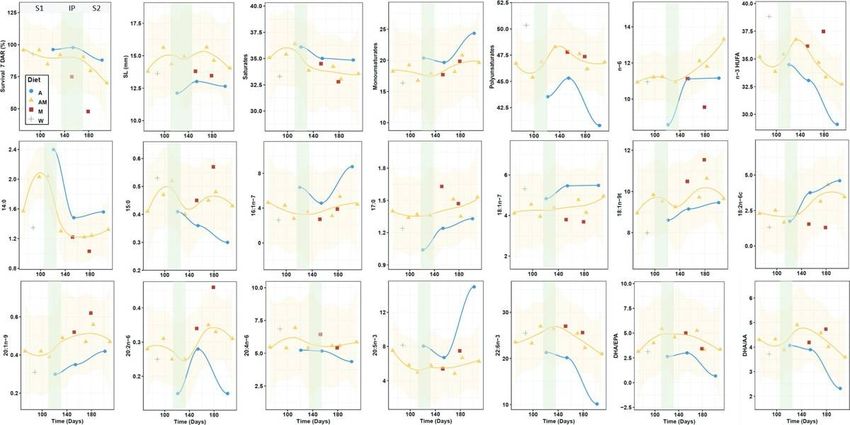
Abstract
The global trade in seahorses is increasing and new rearing techniques are currently available for a few
species. One of the main bottlenecks in seahorse production is reproduction success, which is dependent
upon the administration of high quality diets to breeders. However, very little is known about the most
adequate diets, on how they should be administered and on how they might affect newborn performance.
In this study, three homogeneous groups of adult seahorses Hippocampus guttulatus were maintained in
captivity. Each group was fed on one of the following diets since the onset of the breeding period:
Unenriched adult Artemia (Diet A), unenriched adult Artemia and mysidaceans (Diet AM) and
mysidaceans (Diet M). As a positive control we used a wild pregnant male. The mixed diet AM provided
the highest overall breeding success and reasonable fatty acid pro les, and better resembled newborn
from a wild male. The use of only mysidaceans (Diet M) provided the worse results in spite of the high
DHA content. Signi cant differences were observed in newborn characteristics and fatty acid pro les
among dietary groups and along the breeding season, especially in total n-3 HUFA and DHA.
Monospeci c diets including Artemia or mysidaceans very likely suffered nutritional de ciencies, which
were re ected in morphological alterations of the muscle tissue (diet A) or abnormal early mortalities in
newborn (diet M). Three progressive stages were identi ed along the whole breeding period: Initial mixed
capital-income period (100 – 120 days since the onset of the breeding period), followed by an in exion
period (short transitional stage - income sources), and nally a long period characterized by the use of
income sources and the progressive exhaustion of body reserves. Special attention should be deserved to
the progressive changes in fatty acid pro les along the breeding season, resulting in a decrease in
newborn performance. Considering the time required for a diet to be re ected in newborn, we recommend
Hippocampus guttulatus breeders to be fed on a high quality diet for at least three months prior the
breeding period.

Contribution To The Field
The global trade in seahorses is estimated to exceed 20 million animals per year to sustain the aquarium
trade, the traditional Chinese medicine and as souvenirs. However, seahorse populations are declining
due to the degradation of coastal habitats.

Aquaculture represents a valid alternative to wild captured seahorses but ex-situ production still needs to
face some constrains. Low spawning quality and juvenile survival rates are the most critical factors for
optimizing commercial seahorse production. Only a few studies have focused on the effects of breeder's
feeding on breeding success and newborn quality in seahorses. In the present study, the following
questions have been addressed: (1) How experimental diets are assimilated (stable isotope analysis) by
breeders and re ected in general features and biochemical composition of Hippocampus guttulatus
newborn?, (2) Do mixed diets perform better than monospeci c ones?, and (3) Does H. guttulatus follow

                                                 Page 2/40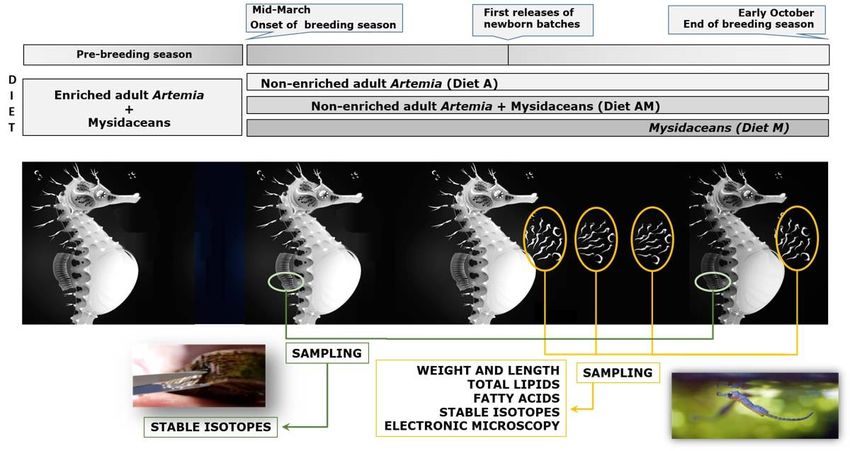
a mixed income-capital breeding strategy?. To our knowledge, this is the rst multiapproach study on the
effect of breeder’s diet on reproductive performance and newborn quality in H. guttulatus.

Introduction
The global trade in seahorses is estimated to exceed 20 million animals per year to sustain the aquarium
trade, the traditional Chinese medicine and as souvenirs (Vincent, 1996; Planas et al., 2017a). In addition,
because of the destruction and degradation of their coastal habitats (seagrasses, coral reefs and
mangroves), wild populations are progressively declining (Vincent, 1996; Martin‐ Smith et al., 2004). At
present, many are the concerns over their long-term viability in nature (Vincent, 1996; Vincent et al., 2011,
Kumaravel et al., 2012) and all seahorses species are included in Appendix II list of endangered species
by CITES (Convention for the International Trade in Endangered Species).

Aquaculture represents a valid alternative to wild captured seahorses but ex-situ production still needs to
face several biological and technical challenges (Cohen et al., 2016; Planas et al., 2017a). Both, low
spawning quality and juvenile survival rates are the most critical factors for optimizing commercial
seahorse aquaculture (Adams et al., 2001; Chang and Southgate, 2001; Lin et al., 2007). Reproduction
represents a key aspect in breeding success, and broodstock feeding / nutrition is doubtless, one of the
key factors to sustain reproduction in teleost (Migaud et al., 2013). The dietary effect on the output
performance (egg and fry quality and quantity) is well known in shes, and many studies have reported
the importance of lipids and fatty acids (Rainuzzo, 1993; Bromage, 1995; Izquierdo et al., 2001; Sargent et
al., 2002; Tocher, 2003, 2010; Pavlov et al. 2004). Broodstock preparation is thus a critical step in the
success of the spawning process of a certain species. On this regard, many studies have been directed
towards egg quality in oviparous shes and the underlying characteristics to produce viable fry (Kjørsvik
et al., 1990; Brooks et al., 1997). The egg's potential to produce viable fry is determined by several
physical, genetic, and chemical factors, including the initial physiological processes occurring in the egg
itself (Kjørsvik et al., 1990).

The ongoing process of oocytes maturation is one of the most metabolic demanding activities in sh and
the quality of parental nutrition is thus of primary importance for the appropriate allocation of
macromolecules into the oocytes and their maturation (Izquierdo et al., 2001; Volkhoff and London,
2018). However, there is a scarcity of studies focused on breeding performance and egg or fry quality in
 shes with male pregnancy such as syngnathids (pipe sh and seahorses). Due to the uncommon nature
of reproduction, syngnathids offer a unique opportunity to examine pathways of repercussion of
breeder’s dietary resources on breeding performance and the resulting newborn quality. Reproduction in
seahorses has received increasing attention in recent years, mostly on the effect of environment (e.g.
photoperiod regime, temperature) (Lin et al., 2006, 2008b; Planas et al., 2010, 2013), zootechnical
conditions (e.g. sex ratio, aquaria design, seahorse size) (Woods et al., 2000; Dzyuba et al., 2006; Planas
et al., 2008; Faleiro et al., 2008, 2016), and biological / physiological features (Boisseau, 1967; Carcupino
et al., 2002; Poortenaar et al., 2004; Stölting and Wilson, 2007; Scobell and MacKenzie, 2011; Zhang et al.,
2019; Wittington and Fresien, 2020). Only a few studies have focused on the effects of feeding and
                                                   Page 3/40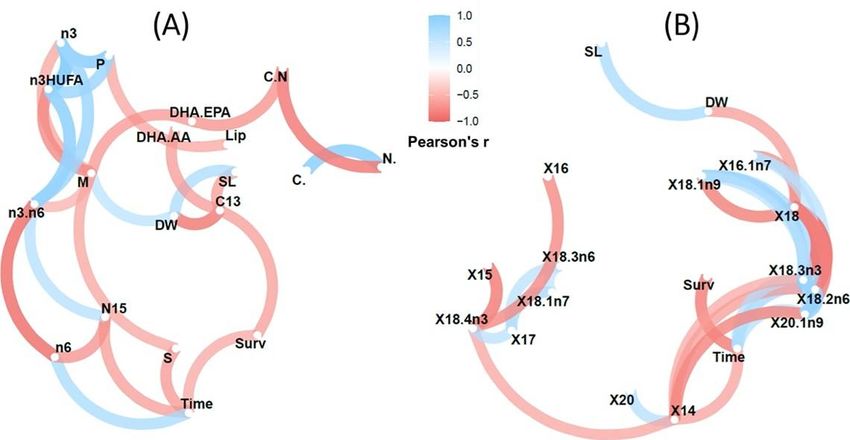
dietary sources on breeding success and newborn features in seahorses under ex-situ conditions (Lin et
al., 2007; Faleiro and Narciso, 2010; Binh and Serrano, 2012; Saavedra et al., 2015; Palma et al., 2012,
2017; Otero-Ferrer et al., 2012, 2016, 2020).

Seahorses (Hippocampus spp.) are batch spawners with cyclical egg maturation and repeated mates
within the breeding season. The eggs produced by females are transferred to the brood pouch of males,
where embryogenesis will take place for 2-4 weeks, depending on the species and temperature (Foster
and Vincent, 2004). The sealed brood pouch of the male works as a pseudo- placenta, not only providing
protection and oxygen to the developing embryos, but also nutrients (Wilson et al., 2001; Carcupino et al.,
2002; Stölting and Wilson, 2007). As a consequence both female and male nutrition play a role on the
embryonic and fry quality and development, but unfortunately, this topic remains one of the less studied
subjects in seahorses (Olivotto et al., 2011a; Cohen et al., 2016).

The European long-snouted seahorse Hippocampus guttulatus Cuvier, 1829 has been identi ed as a
potential candidate for the marine ornamental trade (Cohen et al., 2016). Rearing techniques are currently
available for this species but the breeding success (especially mating events) are still not optimized
(Olivotto et al., 2011a; Planas et al., 2017a). Male competition is rather frequent resulting in mating
interruption, and juvenile number and size decrease over the time in captive conditions (Faleiro et al.,
2008). A bottleneck in breeding performance relies on both type and nutritional quality of diets. In
captivity, both frozen and alive feed are usually used to nourish the broodstock, including mysid shrimps,
amphipods and Artemia brine shrimps (Woods and Valentino, 2003; Olivotto et al., 2008; Palma et al.,
2008; Murugan et al., 2009; Planas et al., 2017a). As concerns mysid shrimps, they are generally
considered an optimal diet for seahorses (Woods and Valentino, 2003, Otero-Ferrer et al., 2012).
Nutritionally enriched Artemia has received great attention and is presently widely employed (Woods,
2001; Wong and Benzie, 2003; Woods and Valentino, 2003; Planas et al., 2008), especially because it is
easily cultured up to the adult stage, provides satisfactory n-3 HUFA and DHA contents after a long-time
enrichment (Planas et al., 2017b), and supports high growth rates in H. guttulatus (Planas et al., 2008).
However, it has been reported that the breeding performance in H. hippocampus decreased when fed on
Artemia compared to diets including mysidaceans (Otero-Ferrer et al., 2012).

In the present study, the following questions have been addressed: (1) How experimental diets are
assimilated (stable isotope analysis) by breeders and re ected in general features and biochemical
composition of Hippocampus guttulatus newborn?, (2) Do mixed diets perform better than monospeci c
ones?, and (3) Does H. guttulatus follow a mixed income-capital breeding strategy?. The main objectives
of the study were (1) to propose a breeder’s diet enhancing reproduction performance in the selected
species, and (2) to ascertain when and how long the diet should be administered to provide its bene cial
effect. To our knowledge, this is the rst multiapproach study on the effect of breeder’s diet on
reproductive performance and newborn quality in H. guttulatus.

Materials And Methods

                                                  Page 4/40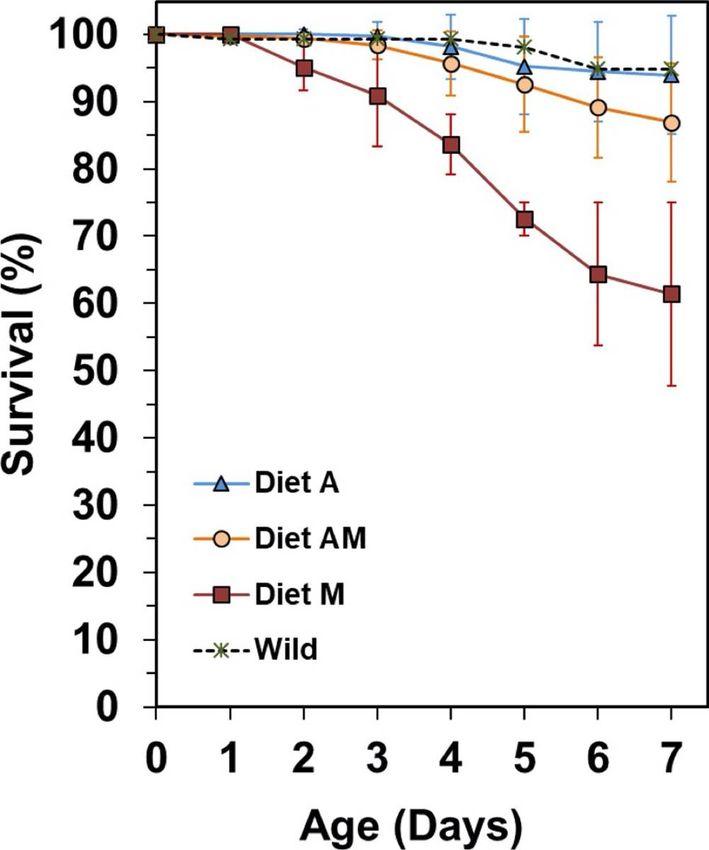
Microalgae and live prey

Microalgae (Phaeodactylum tricornutum, Rhodomonas lens and Isochrysis galbana) were cultured at 22
± 1 °C in 80 L plastic bags containing sterilized seawater supplemented with F2P (100 g L-1) media
(VarAqua). Additionally, silicates were added to P. tricornutum cultures, and 200 μl F2P media to the R.
lens culture asks.

Artemia cysts (AF, Inve, Spain) were hatched at 28 °C for 20 h in 20 L units, and the hatched nauplii gently
rinsed with tapwater, collected on a 125μm mesh, rinsed and offered to seahorse juveniles.

Adult non-enriched Artemia was produced to feed adult seahorses during the breeding period. For that,
the nauplii were hatched from MC450 cysts (Ocean Nutrition, Spain) and grown in 100 L units, at 26–28
°C with gentle aeration and constant light. Adult Artemia was long-time enriched (3-6 days) to feed
breeders prior to the start of the experiment but not during the experimental period. The enrichment was
carried out in Artemia from day 16 onwards on a mixture consisting on live microalgae P. tricornutum and
I. galbana (107 cells mL-1 ), Red Pepper (0.015 g L-1) and dried Spirulina (0.03 g L-1) (Planas et al.,
2017).

Copepods (Acartia tonsa) were cultivated for the early feeding of seahorse juveniles in 700 L tanks at 26-
27 °C and 38 salinity, at an initial density of 1 copepod mL-1. Copepods were fed every two days on the
microalgae R. lens (103 cells mL-1). Siphoning of the culture tanks and water renewals (10% of the total
volume) were carried out three times per week.

Seahorse Breeding and Rearing

Animal capture, handling and sampling were conducted in compliance with all bioethics standards on
animal experimentation of the Spanish Government (Real Decreto 1201/2005, 10th October 2005) and
the Regional Government Xunta de Galicia (REGA ES360570202001/15/FUN/BIOL.AN/MPO01).

The adults of Hippocampus guttulatus seahorses used in the present study were reared in captivity or
collected in Galicia (NW Spain) from August 2016 to January 2017 with permission of the Regional
Government Xunta de Galicia. Prior to the start of the experiment, seahorses were maintained at the
facilities of Instituto de Investigaciones Marinas (CSIC) in Vigo (Spain) in 320 L aquaria in a semi-closed
system with a 10-14% daily renewal of seawater (Planas et al., 2008), and submitted to temperature and
photoperiod natural-like regimes (Planas et al., 2010, 2013), uctuating from 15 ºC (Winter) to 19 ºC
(Summer) and from 10L:14D (Winter) to 16L:8D (Summer), respectively. Water quality was checked
periodically for NO2, NO3 and NH4/NH3 content (0 mg L-1). Salinity and pH levels were 37 ± 2 and 8.0 ±
0.2, respectively for both species. Wastes and uneaten food were removed daily by siphoning the bottom
of aquaria.

Males and females were maintained separate until the start of the experiment in mid-March 2017, when
all seahorses were randomly distributed (1:1 sex ratio; 6 pairs per aquaria) in three 320 L aquaria and

                                                 Page 5/40
maintained for a whole breeding season (until early October 2017). All aquaria were maintained under the
same conditions except for the diet administered. Temperature and photoperiod regimes were as
described above. The average size (curved standard length) and weight of seahorse breeders (17.4 ± 2.6
cm and 11.50 ± 5.0 g, respectively) did not differ across experimental groups (ANOVA, p = 0.702, 17.4 ±
2.6 cm; ANOVA, p = 0.470, 11.5 ± 5.0 g). Seahorse broodstocks were continuously monitored to check for
newborn release from male’s pouch.
Prior to the breeding period, all breeders were fed for 2 – 5 months on a diet based on enriched adult
Artemia and captured/frozen mysidaceans (see below). During the breeding period, each husbandry
aquaria received two daily doses (ad libitum) of different diets (Figure 1):
Diet A: Cultivated adult non-enriched Artemia.
Diet M: Captured (Siriella armata and Leptomysis ) and frozen (Neomysis sp.; Ocean Nutrition, USA)
mysidaceans (1:1).
Diet AM: Mixture (1:1) of diets A and
Small portions of the breeders dorsal n (partial n-clipping; about 20 m2 surface) were sampled at the
onset and at the end of the breeding period, and properly stored for further stable isotopic analysis (SIA)
(Valladares et al., 2012).
Newly released juveniles were carefully collected by siphoning, counted and transferred (2-5 juveniles L-1)
to 30 L pseudo-kreisel aquaria connected to a semi-opened recirculation system (Blanco et al., 2014). The
newborn were reared until day 7 after male’s pouch release (DAR) at 19 ºC under a constant 14L:10D
photoperiod. The aquaria were lled with seawater ltered by a series of lter-cartridges (20, 10, 5 and 1
μm) and UV treated (76w; 16 L min-1) (JR1/50). The rearing system included a degasifying column and
two 50 L chambers including mechanical (up to 20μm) and biological lters (perforated plastic bio-balls)
and aerators. From the bio lter unit, the seawater was pumped to 36w UV units (AquaMedic®, Germany)
and then to a 50 L reservoir aquarium, being nally routed by gravity towards the rearing aquaria (Planas
et al., 2012).
Newborn seahorses were fed according to the following optimized schedule (Blanco and Planas, 2015):
0-5 DAR: Two daily doses of Acartia tonsa (0.67 copepods mL-1 dose-1).
6-7 DAR: One daily dose of Acartia tonsa (0.67 copepods mL-1 dose-1) and one daily dose of
Artemia nauplii (1 Artemia mL-1dose-1).
Dead seahorses were daily removed (8:00 am and 15:00 pm) and counted. Final survivals of juveniles
were recorded at 7 DAR (M50 at 18 - 21 °C occurs at 6.3 - 6.7 DAR) (Planas et al., 2012). For each
experimental group, samples of newborn juveniles (see further sections for details) were randomly
collected before rst feeding, euthanized with Tricaine MS-222 (0.1 mg L-1, Sigma Aldrich), rinsed with
distilled water, and conserved at 80 °C for further fatty acids and isotopic analyses.
Page 6/40For length and weight measurements, sampled seahorses were transferred to Petri dishes, photographed
and weighed individually on a Sartorius microbalance MC210P (± 0.01 mg). Curved standard lengths (SL
= head + trunk + curved tail) were measured from digital photographs using an image processing
software (NIS Elements, Nikon).
Sample Analysis
Total lipids from live prey and juveniles (10-20 mg dry weight per sample, in duplicate) were extracted
according to Bligh and Dyer (1959). Aliquots of total lipid extracts with known lipid content were
centrifuged, resuspended with 0.5 M ammonium formate solution, freeze-dried and stored at -80 °C until
further fatty acids analyses. Total lipid content was quanti ed gravimetrically (Herbes and Allen, 1983).
Fatty acid (FA) composition of lipids was analyzed by gas-chromatography (GC) according to Christie
(1982). Lipids were transmethylated (Lepage and Roy, 1986) and fatty acids analyzed by GC (Perkin
Elmer, Clarus 500 gas chromatograph) as described in Planas et al. (2010). Samples were analyzed in
duplicate.
Carbon (δ13C) and nitrogen (δ15N) isotope signatures and elemental composition (total C and N) were
analyzed in both prey and seahorses samples ( n of breeders and bulk juveniles). Frozen juveniles (n > 5;
pooled individuals) were dried for 48 h (60 ºC), weighted and manually homogenized. The analyses were
made on sub-samples of 0.2-1.0 mg dry weight biomass at Servizos de Apoio á Investigación (SAI) of the
University of A Coruña (Spain) as reported by Valladares et al. (2016). As defatting of samples prior to
isotopic analysis is recommended when lipid content exceeds 5% weight (C:N >3.56) (Post et al., 2007),
samples were not defatted but arithmetical corrected factors (Supplementary Table 1) were applied
considering defatting (copepods, Artemia nauplii and metanauplii, and seahorse ns or juveniles) or
defatting + acidi cation (10% HCl) (Mysidacea and adult Artemia). The samples were measured by
continuous ow isotope ratio mass spectrometry using a FlashEA1112 elemental analyzer (Thermo
Finnigan, Italy) coupled to a Delta Plus mass spectrometer (FinniganMat, Bremen, Germany) through a
Con o II interface. Stable isotope abundances are expressed as permil (‰) in conventional delta relative
to VPDB (Vienna Pee Dee Belemnite) and Atmospheric Air. The precision (standard deviation) for the
analysis of δ13C and δ15N of the laboratory standard (acetanilide) was ± 0.15‰ (1-sigma, n=10).
Standards were run every 10 biological samples.
Transmission electron microscopy (TEM) was applied to abdominal portions of seahorses (three
newborn per dietary treatment). The samples were processed for Durcupan ACM (Fluka) resin embedding
as follows: pieces xed in 2.5 % glutaraldehyde in 0.2 M phosphate-buffered saline (pH 7.4), for 2 h at 4
°C, were washed repeatedly in the same buffer and post xed in 1 % osmium tetroxide in 0.2 M phosphate-
buffered saline for 1 h at 4 °C. Then, the tissues were dehydrated with increasing alcohol concentrations.
The dehydrated pieces were embedded in Durcupan ACM (Squadrito et al., 2017). Finally, the sections
were obtained with a Reichert Jung Ultracut E. Semi- thin sections (1 μm) were stained with toluidine blue
and examined with a light microscope. Ultrathin sections (740 Å) were obtained from selected areas of
Page 7/40the semi-thin sections, stained with uranyl acetate and lead citrate, and examined and photographed with a transmission electron microscope (JEOL JEM 1400 Flash) (Viña et al., 2014). Data Analysis All statistical analyses were conducted in R v.3.6.1 (R Core Team 2019). Variability across treatments was examined by ANOVA or non-parametric Kruskal-Wallis test for independent samples, depending on signi cant deviations from normality and homogeneity of variance, as examined by the Shapiro–Wilks and Levene tests, respectively (ggpubr v0.2.5 R package) (Kassambara, 2020a). When signi cant, A Kruskal–Wallis test followed by Wilcoxon range comparisons were applied (Pgirmess v1.6.9 package of R) (Giraudoux et al, 2018). Significance levels were set at p
The incorporation of the experimental diets in breeder tissues was analyzed considering dietary isotopic
pro les (Table 1) and the resulting isotopic changes in dorsal ns (initial vs nal) (Table 2). Differences in
isotopic signatures of diets corresponded approximatively to one trophic level, with values ranging from
-22.12 to -20.53 ‰ for δ13C (Δ = 1.59) and from 7.67 to 10.83 ‰ in δ15N (Δ = 3.16).

Initial isotope values for δ13C and δ15N in dorsal n at the onset of the experimental breeding

period did not differ signi cantly (ANOVA, P = 0.192 and 0.143, respectively) (Table 2). At the end of the
experiment, changes in signatures for both isotopes in ns were inversely correlated (Linear regression,
R2 = 0.994) across treatments (Supplementary Figure 2) and strongly agreed with isotope values of the
corresponding diets, with signi cantly lower δ15N signatures in the group fed uniquely on Artemia (K-W
test, P= 0.044). Isotopic changes (Δδ) in ns during the breeding season were 2.97, -0.20 and -1.89 for
δ13C, and -1.42, 0.88 and 2.58 for δ15N, respectively (Table 3). Isotopic changes between nal isotopic
values in dorsal ns and diets A, AM and M were 8.13, 4.14 and 2.50 for δ13C, and 2.62, 4.25 and 3.91 for
δ15N, respectively.

Breeding performance

The total amount of newborn batches produced in treatments A, AM and M were 4, 7 and 3, respectively,
and the total production of newborn were 534, 1416 and 248, respectively (Table 4). Average batch size in
treatment AM (202 ± 82 newborn; max = 343) was higher than in treatments A (134 ± 83) and M (84 ± 72)
but differences across treatments were not signi cant (ANOVA, P=0.331) due to the large standard
deviations of means. Newborn production started earlier and extended over a longer period for group AM
breeders (from day 72 to 210 of the breeding period). The opposite occurred in group M (from days 152
to 179). In group A, newborn batches were released from days 121 to 202.

Newborn differed in length (K-W test, p=0.018) but not in dry weight (0.60 - 0.74 mg) (K-W test, P=0.440)
(Table 4; Supplementary Figure 3). Newborn from treatment A (12.9 ± 0.7 mm) were signi cantly smaller
in length than those from treatments AM (14.7 ± 0.7 mm) and M (14.1 ± 0.2 mm).

Survivals at 7 DAR were high but not signi cantly different across treatments (K-W test, P=0.066) (Table
4), ranging from 94.0 ± 5.3 % in treatment A to 61.4 ± 19.2 % in treatment M. First mortalities in treatment
M occurred at 2 DAR, with a peak at 4-5 DAR (Figure 2). Similarly to newborn reared from a batch
released by a wild male, rst mortalities in treatments A and AM were delayed until 3-4 DAR.

Newborn characteristics

Pooled samples of newborn differed in δ15N across treatments (K-W test, P = 0.044) but not in δ13C,
ranging from 11.21 to 14.96 ‰ and from -17.31 to -13.86 ‰, respectively (Table 2; Supplementary
Figure 3). Mean δ15N value in group A was signi cantly lower than those from the other groups.
However, mean isotopic values did not re ect the pattern of change across treatments during the
breeding period. The low number of batches released in treatments A and M did not allow a precise
analysis of isotopic changes but a trend could be inferred from treatment AM, in which a progressive
                                                  Page 9/40
change in δ15N towards those in the diet was noticed throughout the breeding season, with signals
decreasing from 16.0 to 12.3 ‰.
Total lipids in newborn were similar in all experimental groups (12.17 – 12.99 % DW) (K-W test, P=0.580),
but signi cant differences were noticed for some FA in total lipids (Table 2). Signi cant differences
across treatments (K-W test, P< 0.05) were obtained for 15:0, 17:0, 18:1n- 7, 20:1n-9, 20:2n-6, 20:4n-6,
22:6n-3, total polyunsaturated FA and DHA/EPA ratio. J-T test revealed that increasing proportions of
mysidaceans in the diet of breeders promoted signi cant increasing trends in newborn for 14:0, 15:0,
17:0, 18:1n-9t, 20:1n-9, 20:2n-6, 20:4n-6, 22:6n-3 and n-3 HUFA and DHA/EPA ratio, and declines in 16:1n-
7, 18:1n-7 and 18:2n-6c (Table 2). The FA pro le of newborn released by a wild male better resembled
those from groups AM or M.
Global Assessment
From the correlation network developed for treatment AM (Figure 3) it can be observed that time (days
elapsed from the onset of the breeding season) negatively affected survival, the relative content in
saturated FA (particularly 14:0) and δ15N values, but increased the content in total n-6 FA (mainly 18:2n-
6c) and 18:3n-3. Length and dry weight of newborn were positively correlated but they did not correlate
with time. Size and weight were negatively correlated with δ13C. In addition, weight was negatively and
positively correlated with total monoenes and 18:0, respectively. The full results on correlation analyses
are provided in Supplementary Figures 4 and 5. Sample similarities were remarkably high (R2>0.7).
However, early released newborn batches from group A were more similar to intermediate batches from
group AM, and late released batches were similar, independently of the group considered. The only batch
available by a wild male was similar to early batches released by males fed on diet AM.
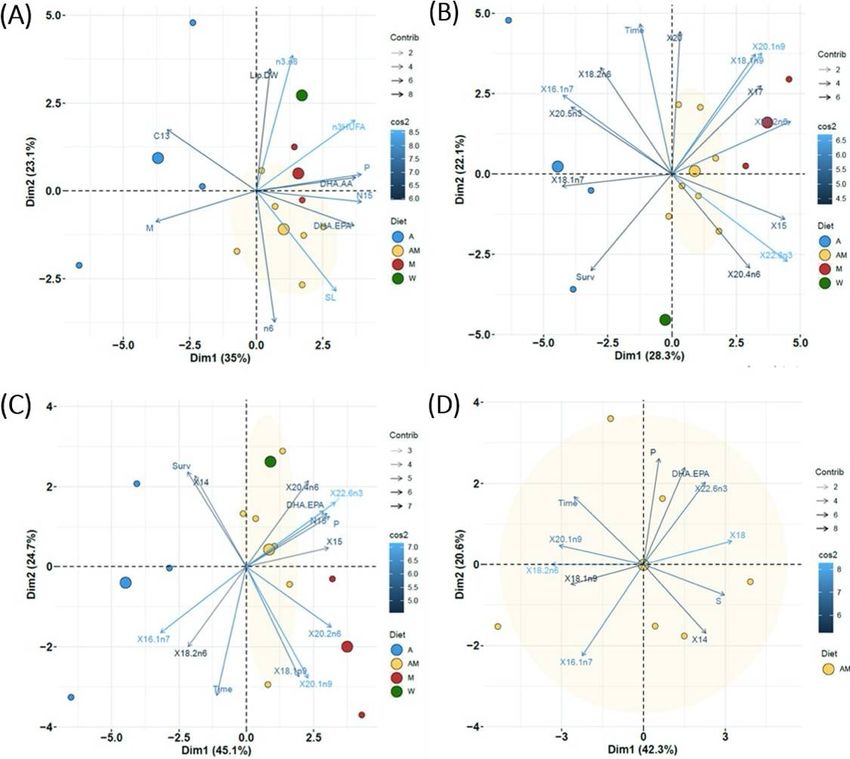
The results obtained with Principal Component Analysis (PCA) differed depending on the dataset used
(Figure 4 and Supplementary Figure 6). PCA performed with the datasets including general newborn
characteristics (Figure 4A) and FA (Figure 4B) showed the proximity of newborn from the wild male to
males from groups M and, to a lesser extent, AM. The rst two components of PCA accounted for 58.1%
and 50.4% of total variation in the dataset. The rst component PC1 clearly separated samples from
group A (left side) from the others (right side). The most signi cantly associated variables to PC1
(increasing order of signi cance) were δ15N, polyunsaturated FA, DHA/AA ratio, n-3 HUFA, DHA/EPA ratio
and SL for positive associations, and monounsaturated FA, δ13C and time for negative associations
(Supplementary Figures 4A and 4B). Main FA relevant to PC1 were 20:2n-6, 22:6n-3, 15:0, 20:1n-9, 17:0,
18:1n-9t and SL (right side), and 16:1n-7, 20:5n-3 and survival at 7 DAR (left side). For PC2, the most
relevant proximate variables were n-3/n-6, lipid content, C/N ratio (positive association), and n-6 FA and
SL (negative association). For FA, main positive associations with PC2 were time, 20:0, 20:1n-9, 18:1n-9t,
20:3n- 6 and 18:2n-6c (positive), and 24:0 and survival (negative).
Variability explained by factors PC1 and PC2 increased up to 69.8% in the PCA performed on all diets and
including exclusively signi cant variables in K-M and J-T tests, (Figure 4C). In increasing order of
importance, the most signi cantly associated variables (Supplementary Figure 4C) to PC1were DHA,
Page 10/4020:2n-6, total polyunsaturated FA, total N, δ15N, DHA/EPA ratio, 17:0, AA and 20:1n-9 for positive
associations, and 18:1n-7, 16:1n-7 and survival for negative associations. Survival, 14:0 and saturated FA
were positively associated to PC2, with negative association for time and monounsaturated 18:1n-9t and
20:1n-9.
Finally, the PCA performed for selected variables in AM dataset (other groups were not analyzed due to
insu cient data) explained 69.2% of total variability with PC1 and PC2 (Figure 4D). PC1 was positively
associated to DHA, 20:2n-6, total polyunsaturated FA, 15:0, δ15N, DHA/EPA ratio, 17:0, 20:4n-6 and 20:1n-
9, and negatively associated to 16:1n-7, 18:1n-8 and survival (Supplementary Figure 4D). For PC2, the
mostly positive contributions were due to survival, 14:0, and total saturated FA, with time, 20:1n-9 and
18:1n-9 as negatively associated factors..
Transmission Electron Microscopy
Ultrathin sections of abdominal portions of newborn seahorses were observed by transmission electron
microscopy (TEM) in order to analyze the ultrastructural features of muscular tissue. Generally, TEM
micrographs of skeletal muscle sections revealed a regular morphology with a normal arrangement of
sarcomeres, resulting in a regularly striated appearance with a normal alternation of dark anisotrope
band A (myosin and actin) and light isotrope band I (actin lament) (Figures 5A, B, D). In the longitudinal
sections of TEM micrographs of skeletal muscle sections, the myo brils appeared tightly packed in the
scarce amount of cytoplasm. The nuclei were located in the peripheral layer of the bre and mitochondria
beneath the sarcolemma and among the myo brils. Besides, the regular repeating pattern of
myo laments in the myo brils were detected displaying dense Z lines, forming a regular zigzag (Figures
5A, B, D) at the center of the light I bands. The A bands showed a central light H zone divided by a dark M
line (Figure 5A). In addition, the organization of the sarcoplasmic reticulum and the sarcoplasmic triad,
consisting of two terminal cisterns and the transverse tubule T (formed by the invagination of the
sarcolemma) were also observed (Figures 5 A, C). Scattered satellite cells surrounded by volumetrically
modest cytoplasm were often seen in muscle tissue (Figures 5 E, 6B).
In the cross sections, the disposition of the two sets of myo laments in different bands of the sarcomere
were analysed. The myo brils were well delineated by the close apposition of the sarcoplasmic elements
(Figures 6 A, B). The nuclei were located in the peripheral layer of the bre and mitochondria beneath the
sarcolemma and among the myo brils.
The general morphology observed in newborn released by males from diet A appeared similar to the other
groups (M and AM). However, some ultrastructural muscle changes were noticed. In particular, group A
displayed regressive changes in some muscle bers characterized by a disarrangement of myo brils
(Figure 5B), with evident myo brillary interstitial spaces. Besides, a discontinuity of the sarcolemma and
myelin-like bodies were present (Figure 6C). In addition, a disorganization of the sarcoplasmic elements
and of the invagination of the sarcolemma (i.e., tubules T) was also noticed. An interruption of the Z line
was also occasionally evidenced (Figures 5 E, F) and neuromuscular junctions were observed between
motor nerve endings and muscle bers. Particularly, the terminal axons of the motor neuron were
Page 11/40spherical or oval in shape and t into smooth depressions in each muscle bre (Figures 6D-F). At the
presynaptic zone, several mitochondria and small clear synaptic vesicles were noticed. Other
morphological alteration were not detected at the level of the above structures.
Discussion
Breeding performance
In this study, the isotopic results achieved in dorsal ns of the seahorse Hippocampus guttulatus
con rmed the effective assimilation of experimental diets by breeders, with effects on average isotopic
signatures and fatty acid pro les in newborn seahorses across groups. The overall breeding performance
(extension of the effective breeding period, batches produced, newborn released) resulted enhanced in
parents fed on the mixed diet AM (non-enriched Artemia and mysidaceans), suggesting a better
nutritional condition than in groups A and M. Unexpectedly, the use of mysidaceans as only prey (Diet M)
resulted in the worse breeding success among the three experimental diets.
Brood size in some seahorse species (e.g. H. kuda, H. erectus) has been related to the length of brood
pouches of males and trunk of females (Dzyuba et al., 2006; Lin et al., 2012). The newborn size might be
correlated to brood size, gestation time and nutrient supply in the same males and females’ investment
(Lin et al., 2008b, 2012). Besides this, larger H. erectus males (larger brood pouches) do not produce
larger broods, and male size can be positively correlated with juvenile size (Lin et al., 2012). In H.
guttulatus, it has been pointed out that the size of newborn seahorses can be, in part, paternally
determined (limited carrying capacity of the male), as male size is negatively correlated with embryo
density and positively correlated with newborn size (Faleiro et al., 2016). As breeders average size did not
differ across our experimental groups, we assume that differences between treatments in our study were
due to dietary dissimilarities. Differences in the capability of seahorses to digest and assimilate a given
prey is another subject to consider when assessing diet quality. The monitoring of prey in faeces of H.
guttulatus by 18SrDNA ampli cation showed that gut passage times of crustaceans (Artemia,
Palaemonetes, and mysidaceans Leptomysis sp. and Siriella sp.) are species-dependent (longer
passages times in mysidaceans), probably due to differences in their digestibility (lower digestibility in
Palaemonetes) (Corse et al., 2015).
Mysidaceans have been considered an excellent prey for the on-growing and breeding of some seahorse
species (e.g. H. abdominalis, H. hippocampus). Otero-Ferrer et al. (2012) studied the effect of feeding H.
hippocampus breeders exclusively on Artemia enriched with docosahexaenoic acid (DHA) or captured
mysids (Leptomysis sp.). The authors reported better results on reproduction (spawning events, brood
size) and newborn size in breeders fed on mysids, presumptively due to a higher nutritional quality of
mysidaceans (basically in DHA content). Those results strongly agree with those with diet AM, but not
with the poor results achieved with diet M. The authors also recommended (but not tested) the use of a
mixed diet including Artemia and mysids.
Page 12/40The survivals achieved in newborn from group A were unexpectedly high, being accompanied by small
initial lengths and reduced batch sizes. Interestingly, it has been reported in H. reidi that reducing the
nutritional quality of a male’s diet since one month before conception resulted in abnormally large and
heavy newborns with extremely reduced survivals, independently of the dietary quality in females (Otero-
Ferrer et al., 2016). These ndings partially agree with those reported in the pipe sh Syngnathus typhle, in
which a higher nutritional condition in males brooding heavier embryos was correlated with a higher
embryo survival (Sagebakken et al., 2017).
Premature newborn or egg clutch dropping were not observed, contrarily to previous ndings in
H. hippocampus fed on Artemia (Otero-Ferrer et al., 2012) or commercial mysidaceans (i.e. much lower
DHA and HUFA levels than in the present study) (Saavedra et al., 2015), and in H. guttulatus fed on
suboptimal quality of Artemia (i.e. high lipid and low DHA content) (Planas et al., 2009a, 2010). In the
later, the issue was solved by optimizing DHA and EPA content in Artemia (Planas et al., 2017b) and
isolating pregnant males a few days prior to newborn release (Olivotto et al., 2011a). Even though the
growth of adult H. guttulatus fed on Artemia may be satisfactory (Planas et al., 2008, 2009b; Segade et
al., 2015), it seems that its high lipid content and unbalance fatty acids pro le might result in an
excessive accumulation of lipids in the liver and an abnormal (not necessarily pathological)
displacement of hepatocytes core to the periphery of the cells (Segade et al., 2016). The presence of
ultrastructural muscle alterations at the level of the contractile component and presence of myelin-like
bodies (expression of the lysis of the membranes involved by the regressive phenomena) in newborns
released by males fed on diet A can be related to some nutritional de ciencies in unenriched Artemia.
Polyunsaturated fatty acids (PUFAs) are essential FAs in regulating normal growth and development in
many sh species (Anderson et al., 1990; Olivotto et al., 2011b) and promoting muscle ber development
(Cong-cong et al., 2019). Speci cally, DHA is a structural key component of cell membranes involved in
their biosynthesis (Olivotto et al., 2011b; Randazzo et al., 2018). The low levels of DHA in diet A might
thus be responsible for the alterations found in some muscle bers. Furthermore, an interruption,
observed only occasionally of the Z line, could be the expression of the structural disarrangement of
myo brils demonstrated in muscle bers with regressive phenomena.
The supposed superior quality of several small species of marine crustaceans (e.g. amphipods,
mysidaceans) over Artemia has been reported in seahorse culture (Palma et al., 2008; Woods, 2009;
Otero-Ferrer et al., 2012; Buen-Ursue et al., 2015; Vargas-Abúndez et al., 2017). Those sources are among
the mostly consumed preys by wild seahorses (Manning et al., 2019). However, the main dietary sources
for H. guttulatus adults in our nearby region (NW Iberian Peninsula) are amphipoda (caprellids and
gammarids), whereas mysidaceans are insigni cant prey in the bulk diet composition (Valladares et al.,
2016). We recently demonstrated that diets including mysidaceans (alone or mixed with Artemia) provide
the best trophic enrichment factors (laboratory derived) to infer the composition of bulk diet in wild
syngnathids by means of isotopic signatures (Planas et al., 2020). Hence, even though mysidaceans
might be considered a high quality prey for some seahorse species, it is very likely not suitable for
breeding H. guttulatus when administered as the sole prey. Unfortunately, nutritional requirements in
seahorses are unknown, and provision of suitable food sources for ex-situ culture often represents a
Page 13/40serious constraint (Chang and Southgate, 2001) as not all species seem to have the same nutritional
needs, as suggested by inter-speci c differences in FA pro les (Lin et al., 2008a). Consequently, mixed
diets (present study) and/or dietary supplementation would potentially reduce some nutritional
de ciencies of single prey (Palma et al., 2012, 2017).
Breeding strategy
Seahorses are synchronous batch spawners, as several oocyte populations are present during the
reproductive season and clutches of oocytes develop, mature, and are released simultaneously
(Fernández-Palacios et al., 2011). During the last part of the secondary growth of oocytes (vitellogenesis),
lipids and yolk proteins are incorporated and stored in large amounts in the yolk. That process and further
embryogenesis of fertilized eggs in males cyclically occurs along the breeding season, requiring a
continuous expenditure of energy and nutrients. Seahorse females and males are time-synchronized for
egg batch transfer from females to males and newborn release in males, and in H. guttulatus kept at 19
-20 °C both processes occur at 25 - 27 days time-intervals (Planas et al., 2010). On this regard, it is very
important to ascertain the origin (capital, income or mixed capital-income reproduction strategy) of the
energy and nutrients necessary for reproduction (Williams et al., 2017), and to evaluate whether and when
egg/fry composition can be affected by the type of diet provided. Hence, the identi cation of both diet
quality and effective feeding periods (the time period needed to change the biochemical composition of
eggs/fry) for optimum broodstock performance is of pivotal importance in enhancing newborn quality
(Fernández-Palacios et al., 2011; Griffen, 2018). The present study and the pattern of isotopic changes
discussed elsewhere (Planas et al., 2020) suggest that the reproduction type followed by H. guttulatus
corresponds to a mixed capital-income strategy. This strategy usually implies a progressive drop in
newborn quality in successive batches (McBride et al., 2016, Griffen, 2018). In order to properly assess
the breeding strategy followed by H. guttulatus, the effects of experimental diets must be analyzed over
the entire breeding period. Given that the pattern of change in the biochemical components analyzed in
newborn did not follow a mathematical model for tting, the effective feeding periods were inferred from
the smoothed trends in the most remarkable components along the breeding period (particularly for
group AM) (Figure 7). In most cases, trend in exions occurred within the period comprising 100 and 140
days, depending on the variable and seahorse group considered. We identi ed three stages along the
whole breeding period:
Stage 1 (mixed capital-income sources): Progressive changes occur since the dietary shift at the
onset of the breeding season. Energy and nutritional resources would mostly originate from
resources gained prior to the breeding period (capital breeding), accompanied by an increasing use
of sources derived from the experimental diet (income breeding). This stage would extend until days
100 – 140 since the onset of the breeding
In exion period (income sources): This is a transitory period indicating the end of the capital- income
breeding strategy and the use exclusively of resources from the experimental diet. In this period,
differences among treatment were clearly
Page 14/40Stage 2 (income sources and exhaustion of body reserves): In most cases, differences among
groups increased or decreased (depending on the variable considered) beyond the in exion period.
Maximal divergences between treatments were reached during this period, notably by the end of the
stage. The trend followed by certain variables (e.g. DHA, DHA/EPA) in late newborn batch releases
suggests a more or less intense exhaustion of body resources, accompanied by decreases in
survivals at 7 DAR and newborn size. This statement is also supported by the trends in newborn
isotopic signatures (Planas et , 2020).
Fry quality can be manipulated to a certain extend by modifying the nutritional composition of the diet
during the breeding season of shes (Fernández-Palacios et al., 2011), including seahorses (Otero-Ferrer
et al., 2020). However, it is also important to assess the effect of preconception diet on reproduction
success and the contribution of males and females, as reported by Otero-Ferrer et al. (2016) in H.
hippocampus. According to our above hypothesis on the stages recognized along the breeding season,
the diet provided preceding the reproduction season would contribute for a certain period to the initial
composition and quality of H. guttulatus newborn. Hence, the initial quality of eggs/newborn could be
improved by feeding the breeders on a high quality diet for at least 3 months in advance of the onset of
the breeding season, which is in agreement with previous ndings in the tropical species H. reidi (Planas
and Chamorro, 2019). That nding is of primary importance to female diets as it is noteworthy that
embryos are mostly dependent on maternal nutrition (yolk quality) until later stages of development,
when the embryos are mostly dependent on paternal contribution (Otero-Ferrer et al., 2020).
Newborn composition
Breeders diet must be optimized to ensure good early development (Izquierdo et al., 2001; Migaud et al.,
2013). Currently, nutrients requirements are rather well known in many marine species with interest in
ornamental trade, and optimal dietary formulations are available (Craig et al., 2017). However, there are
two main issues in the feeding of seahorses in captivity: the lack of knowledge on their nutritional needs
and the rejection of inert formulated diets (Olivotto et al., 2011a; Palma et al., 2012; Planas et al., 2017a).
As the broodstock diet is strongly re ected in the composition of eggs/fry, particularly for lipids (Wiegand,
1996), the composition of eggs or fry can be used as a proxy to infer nutritional requirements in shes to
improve breeding success (Sargent et al., 1989, 1999; Fernández-Palacios et al., 1995; Rainuzzo, 1993;
Rainuzzo et al., 1997). The content in lipids and FA pro les in eggs of H. guttulatus under different dietary
regimes were reported by Planas et al. (2008, 2010) and Faleiro and Narciso (2010). Essentially, FA
pro les in eggs and newborn do not differ signi cantly when the content is referred to relative percentage
of total FA, but they differ markedly when the content is given as dry weight percentage (Faleiro and
Narciso, 2010). In the present study, we focused exclusively on newborn, including a batch released by a
wild pregnant male for comparative purposes.
The cluster analysis (Supplementary Figure 5) and PCA (Figure 4C) performed on newborn revealed a
higher similarity between the wild batch (released early in de season) and the early and mid-term batches
released from group AM. The similarity among those batches was mainly due to DHA, total
Page 15/40polyunsaturated FA, δ15N, survival at 7 DAR, DHA/EPA ratio, AA and, to a lesser extent, to minority 20:1n- 9 and 20:2n-6 (
in newborn, with higher δ15N signals in breeders and newborn from the diets including mysidaceans.
Monospeci c diets including Artemia or mysidaceans very likely suffered from nutritional de ciencies,
re ected in morphological alterations of the muscle tissue or abnormal early mortalities in newborn.
Those de ciencies seemed to be overcome with the mixed diet AM (unenriched Artemia and
mysidaceans), which provided the highest overall breeding success and reasonable fatty acid pro les,
and better resembled newborn from a wild male. However, special attention deserve the progressive
changes in fatty acid pro les along the breeding season, resulting in a decrease in newborn performance.
Considering the time required for a diet to be re ected in newborn, we recommend that Hippocampus
guttulatus breeders be fed on a high quality diet at least 3 months in advance of the onset of the breeding
period. In order to further optimize captive breeding and rearing of seahorses, further research should be
addressed on wild populations with particular emphasis on broodstock feeding habits, on how feeding
preferences possibly change during the breeding season and on potential shifts depending on the
geographical distribution of the sh. Data collected from the wild will help scientist in the selection of the
more suitable diet able to sustain the best egg and fry quality.

Tables
Table 1. Average isotopic pro les (δ13C ‰ and δ15N ‰), total C and N, and C/N ratios in prey (A

– Artemia, Mc – Captured mysidaceans, Mf – Frozen mysidaceans) and in diets for breeders (Diets A, AM
and M) of Hippocampus guttulatus. See text for further details on the composition of diets. Raw isotopic
data were transformed considering conversions provided in Table 1.

                                 %C             %N              C/N             δ13C ‰         δ15N ‰

 Prey            Adult           43.8           10.3            4.25            -22.12         7.67
                 Artemia (A)

                 Captured        42.3           12.9            3.92            -24.34         12.71
                 Mysidacea
                 (Mc)

                 Frozen          38.7           9.3             4.16            -16.72         8.96
                 Mysidacea
                 (Mf)

 Diet            A               43.8           10.3            4.25            -22.12         7.67

                 AM              42.2           10.7            3.95            -21.32         9.25

                 M (Mc +         40.5           11.1            3.65            -20.53         10.83
                 Mf)

Table 2. Total lipids (% dry weight) and fatty acids (relative percentage) in prey, diets and newborn
seahorses. J-T test: Jonckheere-Terpstra test. The medians of the groups ascend (ä) or descend (æ) in
                                                  Page 17/40
the order speci ed by the coding variable (Order: increasing proportions of mysidaceans in the diet
- A, AM, M). Seahorse juveniles: Different superscript letters indicate signi cant differences. W: Newborn
from a pregnant wild male. n.s.: Not signi cant.
Prey for seahorse breeders Diets for seahorse breeders Seahorse
juveniles (0 DAR)
Fatty acids (%) Adult Artemia Frozen
Mysidacea
Captured Mysidacea
Diet A Diet AM Diet M Diet A (n=3) Diet AM (n=7) Diet M (n=2) W
(n=1) J-T test
Page 18/4014 1. 0. 3. 0. 1. 1. 2. 1. 1. ± 0. 1. 1. 1. ä *
:0 43 09 41 62 43 72 02 97 81 51 53 13 35
± ± ± ± ± ± ± ±
0. 0. 0. 0. 0. 0.
02 02 09 18 36 14
15 0. 0. 0. 0. 0. 0. 0. 0. 0. ± 0. 0. 0. 0. ä *
:0 46 05 84 56 46 58 70 20 36 05 45 51 53
± ± ± ± ± ± a ± ±
0. 0. 0. 0. 0. 0.
03 01 05 01 04 08
ab b
16 17 0. 21 21 17 19 21 0. 17 ± 1. 17 18 17 n.
:0 .9 92 .6 .3 .9 .6 .4 24 .8 05 .6 .0 .9 s.
2 3 0 2 9 6 4 8 7 1
± ± ± ± ± ± ± ±
0. 0. 0. 0. 0. 1.
15 07 92 22 61 00
16 8. 0. 9. 0. 8. 6. 4. 5. 6. ± 2. 4. 3. 2. æ **
:1 31 17 06 83 31 63 95 82 57 11 02 30 61
n- ± ± ± ± ± ± ± ±
7 0. 0. 0. 1. 0. 0.
04 01 17 00 90 83
17 3. 0. 1. 1. 3. 2. 1. 0. 1. ± 0. 1. 1. 1. ä *
:0 22 10 23 57 22 31 40 24 21 15 41 55 24
± ± ± ± ± ± a ± ±
0. 0. 0. 0. 0. 0.
03 06 10 02 08 12
ab b
17 0. 0. 0. 0. 0. 0. 0. 0. 0. ± 0. 0. 0. 0. n.
:1 06 01 12 91 06 29 51 56 18 05 12 14 13 s.
± ± ± ± ± ± ± ±
0. 0. 0. 0. 0. 0.
09 12 01 00 03 04
18 11 0. 2. 4. 11 7. 3. 0. 13 ± 0. 12 11 11 n.
:0 .4 56 65 04 .4 39 34 98 .0 78 .3 .2 .2 s.
4 ± ± 4 ± ± 0 5 4 5
± 0. 0. ± 0. ± ±
04 01 0. 55 0. 1.
56 90 97
18 10 3. 4. 3. 10 7. 3. 0. 5. ± 0. 4. 3. 5. æ **
:1 .3 98 11 21 .3 02 66 64 27 37 42 74 32
n- 9 ± ± 9 ± ± b ± ±
7 ± 0. 0. ± 2. 0. 0.
00 02 3. 53 37 08
98 ab a
18 6. 0. 5. 8. 6. 7. 7. 1. 9. ± 0. 9. 11 7. ä **
:1 97 50 99 56 97 12 27 82 07 43 65 .0 99
n- ± ± ± ± ± ± ± 1
9t 0. 0. 0. 0. 0. ±
05 03 50 91 53 0.
75
Page 19/4018 12 0. 1. 1. 12 7. 1. 0. 3. ± 1. 2. 1. 1. æ **
:2 .5 68 17 77 .5 01 47 42 37 46 82 42 32
n- 5 ± ± 5 ± ± ± ±
6c ± 0. 0. ± 0. 0. 0.
01 00 0. 29 88 17
68
18 0. 0. 1. 1. 0. 1. 1. 0. 0. ± 0. 0. 0. 0. n.
:3 86 04 31 05 86 02 18 19 57 47 40 24 23 s.
n- ± ± ± ± ± ± ± ±
3 0. 0. 0. 0. 0. 0.
01 01 04 01 28 05
18 6. 0. 0. 0. 6. 3. 0. 0. 0. ± 0. 0. 0. 0. n.
:3 36 36 22 18 36 28 20 02 23 12 22 16 32 s.
n- ± ± ± ± ± ± ± ±
6c 0. 0. 0. 0. 0. 0.
00 04 36 01 08 04
18 0. 0. 0. 0. 0. 0. 0. 0. 0. ± 0. 0. 0. 0. n.
:4 15 03 18 15 15 16 17 02 13 13 22 17 34 s.
n- ± ± ± ± ± ± ± ±
3 0. 0. 0. 0. 0. 0.
02 00 03 00 15 18
20 0. 0. 0. 0. 0. 0. 0. 0. 0. ± 0. 0. 0. 0. n.
:0 64 01 20 22 64 43 21 01 70 18 70 78 55 s.
± ± ± ± ± ± ± ±
0. 0. 0. 0. 0. 0.
03 01 01 00 03 10
20 0. 0. 0. 0. 0. 0. 0. 0. 0. ± 0. 0. 0. 0. ä **
:1 30 01 84 97 30 60 91 09 36 06 46 57 31
n- ± ± ± ± ± ± a ± ±
9 0. 0. 0. 0. 0. 0.
01 06 01 00 06 07
ab b
20 0. 0. 0. 1. 0. 0. 0. 0. 0. ± 0. 0. 0. 0. ä **
:2 31 00 52 28 31 61 90 54 19 07 30 40 25
n- ± ± ± ± ± ± a ± ±
6 0. 0. 0. 0. 0. 0.
02 03 00 00 04 08
ab b
20 0. 0. 0. 0. 0. 0. 0. 0. 0. ± 0. 0. 0. 0. n.
:3 66 06 27 41 66 50 34 10 27 04 27 27 22 s.
n- ± ± ± ± ± ± ± ±
6 0. 0. 0. 0. 0. 0.
00 03 06 01 04 01
20 0. 0. 0. 0. 0. 0. 0. 0. 0. ± 0. 0. 0. 0. n.
:4 24 00 35 27 24 28 31 05 07 03 13 09 44 s.
n- ± ± ± ± ± ± ± ±
3 0. 0. 0. 0. 0. 0.
02 03 00 00 12 05
20 1. 0. 2. 6. 1. 2. 4. 2. 4. ± 0. 5. 5. 6. ä **
:4 45 05 33 34 45 89 33 84 93 48 74 93 85
Page 20/40n- ± ± ± ± ± ± a ± ±
6 0. 0. 0. 0. 0. 0.
(A 01 10 05 15 55 72
A) b b
20 15 0. 22 21 15 18 21 0. 9. ± 4. 5. 6. 8. n.
:5 .4 76 .1 .6 .4 .6 .8 41 93 44 98 44 16 s.
n- 3 9 0 3 6 9 ± ±
3 ± ± ± ± ± ± 0. 1.
(E 0. 0. 0. 0. 94 48
PA 04 03 76 31
)
22 0. 0. 0. 0. 0. 0. 0. 0. 0. ± 0. 0. 0. 1. n.
:4 12 01 28 31 12 21 29 02 79 08 69 78 13 s.
n- ± ± ± ± ± ± ± ±
6 0. 0. 0. 0. 0. 0.
01 11 01 00 11 04
22 0. 0. 0. 0. 0. 0. 0. 0. 5. ± 1. 4. 3. 4. n.
:5 00 00 43 54 00 24 49 08 01 15 31 98 77 s.
n- ± ± ± ± ± ± ± ±
3 0. 0. 0. 0. 0. 0.
08 04 00 00 57 37
22 0. 0. 0. 0. 0. 0. 0. 0. 0. ± 0. 1. 1. 0. n.
:5 00 00 83 36 00 30 59 33 51 11 61 39 86 s.
n- ± ± ± ± ± ± ± ±
6 0. 0. 0. 0. 0. 0.
05 03 00 00 54 29
22 0. 0. 19 22 0. 10 21 2. 17 ± 6. 24 26 25 ä **
:6 51 01 .6 .8 51 .8 .2 20 .2 14 .1 .3 .4
n- ± 9 1 ± 8 5 2 a 5 1 7
3 ± ± 0. ± ± ± ±
(D 0. 0. 01 0. 2. 0.
H 03 02 02 22 97
A) ab b
24 0. 0. 0. 0. 0. 0. 0. 0. 0. ± 0. 0. 0. 0. n.
:0 20 02 15 14 20 17 14 01 42 18 37 37 49 s.
± ± ± ± ± ± ± ±
0. 0. 0. 0. 0. 0.
01 03 02 00 12 17
Sa 35.3 30 28 35 32 29 35.33 34.50 33 33 n.
tur .1 .4 .3 .3 .2 .6 .3 s.
at 2 0 8 5 0
ed
M 26.0 20 14 26 21 17 21.45 18.67 18 16 n.
on .1 .5 .0 .6 .3 .7 .3 s.
ou 3 6 0 7 5
ns
at
ur
at
ed
Po 38.7 49 57 38 46 53 43.22a 46.83ab 47 50 ä **
Page 21/40ly .8 .1 .6 .0 .4 .5 .3
un 5 4 2 8b 5
sa
tur
at
ed
n- 17.2 44 46 17 31 45 32.93 35.18 37 39 ä *
3 .2 .4 .2 .2 .2 .2 .4
0 4 9 4 0
n- 21.5 5. 10 21 14 8. 10.29 11.65 10 10 n.
6 6 .7 .4 .7 13 .3 .9 s.
6 9 4 5
n- 16.2 42 45 16 30 43 32.22 34.56 36 38 ä *
3 .6 .2 .1 .0 .9 .8 .8
H 8 6 4 2 3
UF
A
D 0.03 0. 1. 0. 0. 0. 2.11a 4.16b 4. 3. ä *
H 89 06 03 58 97 22 12
A/ b
EP
A
D 0.35 8. 3. 0. 3. 4. 3.43 4.23 4. 3. n.
H 45 60 35 76 90 46 72 s.
A/
A
R
A
n- 0.80 7. 4. 0. 2. 5. 3.27 3.04 3. 3. n.
3/ 87 36 80 11 57 63 60 s.
n-
6
To 10.39 7. 6. 10 8. 7. 12.99 12.17 12 15 n.
tal 99 70 .3 87 35 .5 .8 s.
lip 9 6 5
id
s
Table 3. Isotope pro les (δ13C‰ and δ15N‰) in dorsal ns (start and end of the experimental breeding
period) of Hippocampus guttulatus breeders fed on diets A (Artemia), AM (Artemia + Mysidacea) and M
(Mysidacea), and in newborn juveniles. Enrichment factors (Δδ) for ns (Final - initial) are provided.
Sample size (n) is given in brackets. δ13C and δ15N values in newborn from a batch released by a wild
pregnant male are also given for comparative purposes.
Page 22/40Breeder’s dorsal n Newborn juveniles
Gro Initial Final Δδ Pooled batches
up
δ1 -17 ± 1.4 (7) -13 ± 1.0 (7) 2.9 -13. ± 1.6 (4)
3C .37 7 .99 5 7 86 4
A
AM -16 ± 2.0 (11 -17 ± 1.6 (11 -0.2 -17. ± 1.1 (6)
.98 0 ) .18 4 ) 0 31 3
M -16 ± 0.8 (10 -18 ± 1.3 (10 -1.8 -16. ± 1.2 (3)
.04 7 ) .03 8 ) 9 80 7
Wil -16 - (1) -18 - (1) - -14. - (1)
d .00 .00 10
δ1 11. ± 0.8 (7) 10. ± 0.9 (7) -1.4 11. ± 0.8 (4)
5N 94 1 28 1 3 21 8
A
AM 12. ± 1.1 (11 13. ± 0.9 (11 0.8 14. ± 1.5 (6)
79 1 ) 50 8 ) 8 96 0
M 12. ± 0.7 (10 14. ± 0.8 (10 2.5 14. ± 2.3 (3)
19 2 ) 74 6 ) 8 28 5
Wil 12. - (1) 14. - (1) - 14. - (1)
d 00 40 10
Table 4. Batches produced, batch size, standard length (mm), dry weight (mg), and survival percentage (7
DAR) of newborn juveniles released by Hippocampus guttulatus breeders fed on diets A (Artemia), AM
(Artemia + Mysidacea) and M (Mysidacea). W: Newborn from a wild pregnant male. Different letter
superscripts indicate signi cant differences (P < 0.05).
Batches Total Batch size Length (mm) Dry weight (mg) Survival (%)
Page 23/40Diet prod juven mea sd mea sd sd mea sd
uced iles n n n
mea
n
A 4 534 134a ± 83 12.9 ± 0.7 ± 94.0 5.3
a 0.16 a±
0.60
a
AM 7 1,41 202a ± 82 14.7 ± 0.7 ± 86.9 9.5
6 b 0.11 a±
0.74
a
M 3 248 84a ± 72 14.1 ± 0.2 ± 61.4 19.2
b 0.06 a±
0.73
a
W 1 - 210 14.1 0.78 94.9
Declarations
Con ict of Interest Statement
The authors declare that the research was conducted in the absence of any commercial or nancial
relationships that could be construed as a potential con ict of interest.
Data Availability Statement
The datasets analyzed for this study can be found in the Pangaea collection (doi pending). Data not
listed in this collection is available from the authors upon reasonable request.
AUTHOR CONTRIBUTIONS
MP as leading author has done the conception of the work, breeding and rearing, sampling, lipid and
stable isotope analysis, interpretation of data, and most part in drafting. IO and RL assisted in paper
writing. MJG was responsible for fatty acid analysis. RL and MZ were responsible for TEM and this part
of the draft. All authors revised the manuscript.
FUNDING
This study was nancially supported by the Spanish Government with Project Hippoeco (Ref. CGL2015-
68110-R, Ministerio de Ciencia, Innovación y Universidades and Fondos FEDER). Jorge Hernández-Urcera
was supported by a Juan de la Cierva post-doc research grant (FJCI-2016-30990, Ministerio de Ciencia,
Innovación y Universidades).
ACKNOWLEDGMENTS
Page 24/40You can also read


