GOVERNMENT OF ROMANIA
 MINISTRY OF ENVIRONMENT AND FORESTS

     NATIONAL IMPLEMENTATION PLAN
OF STOCKHOLM CONVENTION ON PERSISTENT
          ORGANIC POLLUTANTS

                 2012
←
→
Page content transcription
If your browser does not render page correctly, please read the page content below
GOVERNMENT OF ROMANIA
MINISTRY OF ENVIRONMENT AND FORESTS
NATIONAL IMPLEMENTATION PLAN
OF STOCKHOLM CONVENTION ON PERSISTENT
ORGANIC POLLUTANTS
2012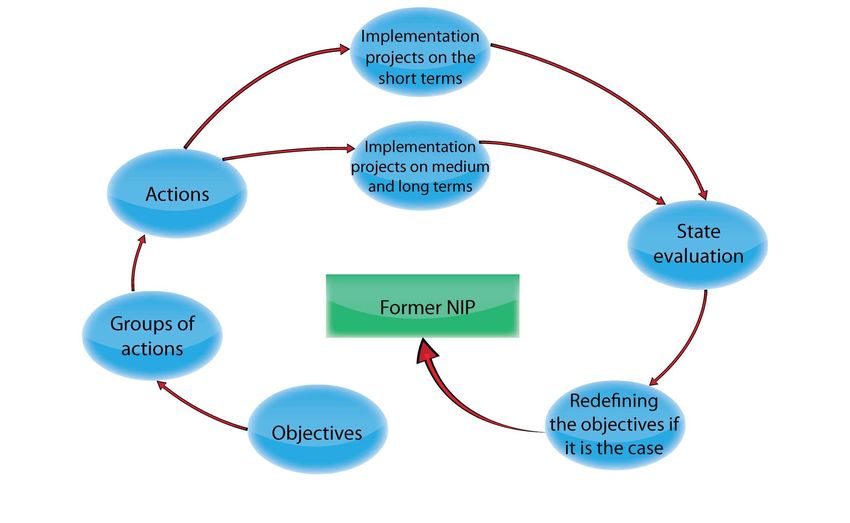
“National Implementation Plan of Stockholm Convention on Persistent Organic Pollutants”
      _________________________________________________________________________________________
CONTENT

1. INTRODUCTION ........................................................................................................................................4
2. GENERAL CHARACTERISTICS OF THE COUNTRY .......................................................................6
   2.1. Country profile........................................................................................................................................6
      2.1.1. Geography and population...............................................................................................................6
      2.1.2. Economic profile .............................................................................................................................6
      2.1.3. Environmental situation in Romania .............................................................................................12
      2.1.4. The Role and responsibilities of ministries, agencies and other institutions involved in POPs life
      cycle.........................................................................................................................................................12
      2.1.5. Relevant international commitments and obligations....................................................................13
      2.1.6. Existing legislation and regulations at EU on POPs......................................................................13
3. CURRENT NATIONAL SITUATION CONCERNING POPs .............................................................15
   3.1. POPs listed in the Annexes “A”, ”B” and “C” of Stockholm Convention ...........................................15
   3.2 Persistent organic pollutants listed in the annexes of the Stockholm Convention before 2009 (aldrin,
   dieldrin, endrin, chlordane, heptachlorine, toxaphene, mirex, HCB, DDT, PCB, PCDD/PCDF) ...............16
      3.2.1. Chlordane, Dieldrin, Endrin, Aldrin, Heptachlor and Toxaphene.................................................16
      3.2.2. DDT ...............................................................................................................................................16
      3.2.3. Dioxines and furans .......................................................................................................................16
      3.2.4. Polichlorinated Biphenyls (PCB) ..................................................................................................19
      3.2.5. Hexachlorbenzen (HCB) ...............................................................................................................28
   3.3. Characterization of the new POPs substances introduced in the Annexes of Stockholm Convention 29
      3.3.1. Inventory of new POPs substances................................................................................................29
      3.3.2. Alpha – Hexachlorociclohexan and Beta – Hexachlorociclohexan (Annex A).............................35
      3.3.3. Chlorodecone.................................................................................................................................35
      3.3.4. Hexabromobiphenyl ......................................................................................................................35
      3.3.5. Hexabromodiphenyl ether (hexa-BDE), Heptabromodiphenyl ether (hepta-BDE),
      Tetrabromodiphenyl ether (tetra BDE) and Pentabromodiphenyl ether (penta BDE).............................36
      3.3.6. Gamma hexachlorociclohexan – Lindane, with special derogation ..............................................37
      3.3.7. Pentachlorobenzen – PeCB............................................................................................................37
      3.3.8. Endosulfan .....................................................................................................................................38
      3.3.9. Perfluorooctanic sulfonic acid (PFOS) with its salts and Perfluorooctanic sulphonyl fluoride
      (PFOS-F) – listed in Annex B with certain restrictions...........................................................................38
   3.4. Contaminated/potentialy contaminated soils with POPs ..................................................................4040
   3.5. Prognosis on production, use and emissions of POPs in the medium and long terms..........................42
   3.6. Identification of population or environments affected by POPs .........................................................433
   3.7. Epidemiological studies on human exposure to POPs ........................................................................433
   3.8. Details of any relevant system for the assessment and listing of new chemicals……………………..43
   3.9. Details of any relevant system for assessment and regulation of chemicals placed on the market ......43
   3.10. Relevant activities of NGOs .............................................................................................................444
   3.11. Exchange of information, awareness, research and development.......................................................45
4. STRATEGY AND ACTION PLAN OF THE STOCKHOLM CONVENTION NATIONAL
IMPLEMENTATION PLAN .......................................................................................................................46
   4.1. Policy aspects........................................................................................................................................46
   4.2. Implementation strategy........................................................................................................................46
   4.3. Key - Objectives ...................................................................................................................................47
5. FINANCIAL RESOURCES FOR NIP IMPLEMENTATION..............................................................62

                                                                                                                                                                    2
                                           MINISTRY OF ENVIRONMENT AND FORESTS
“National Implementation Plan of Stockholm Convention on Persistent Organic Pollutants”
  _________________________________________________________________________________________
       The Stockholm Convention on Persistent Organic Pollutants was adopted at a
Conference of Plenipotentiaries on 22 May 2001 in Stockholm, Sweden. The Convention
entered into force on 17 May 2004, ninety (90) days after submission of the fi ftieth instrument
of ratifi cation, acceptance, approval or accession in respect of the Convention.

       The objective of the Stockholm Convention is to protect human health and the
environment from persistent organic pollutants.

       Persistent Organic Pollutants (POPs) are a group of chemicals exhibiting specific
hazardous properties: toxicity, resistance to degradation, bioaccumulation and are transported,
through air, water and migratory species, across international boundaries and deposited far
from their place of release, where they accumulate in terrestrial and aquatic ecosystems.

       Romania signed the Convention in 2001 and ratified it in October 2004 (Law No
261/2004).

       On the occasion of the 4th and 5th meetings of Conferences of the Parties, respectively,
in May 2009 and April 2011, 10 substances were included in the Convention in its Annexes A
(Elimination), B (Restriction) and C (POPs from unintentional production) by virtue of
Decisions SC-4/10 through SC-4/18 and SC-5/3.

       The Convention bans or restricts, pursuant to Article 3, the production, use and trade
of/with 22 hazardous chemicals. Similarly to the extent that no general or specific derogations
exist, export of waste is prohibited, except for the purpose of environmentally sound disposal.

       The first amendment for including the “new” POPs, as they are called, entered into
force for Romania pursuant to Article 22 paragraph 3) subparagraph c) on August 26, 2010;
pursuant to Article 7 paragraph 1) subparagraph b), the revised National Implementation Plan
must be submitted by August 27, 2012.

       The second amendment will enter into force on October 27, 2012 and should thus be
taken into consideration as well.

       Romania is also a Party to the UNECE Convention on Long-Range Transboundary Air
Pollution (LRTAP) and its POPs Protocol of which has laid down rules for 23 substances since
its overall revision in 2009. The Protocol obliges the Parties to the Convention to work out

                                                                                                   3
                         MINISTRY OF ENVIRONMENT AND FORESTS
“National Implementation Plan of Stockholm Convention on Persistent Organic Pollutants”
_________________________________________________________________________________________
1. INTRODUCTION
The general objective of the Stockholm Convention is to protect human health and environment
against persistent organic pollutants.
Annexes A, B and C include 22 chemical substances identified as POPs and in accordance with this
Convention, the Parties shall:
- take measures to reduce or eliminate releases from intentional production and use;
- take measures to reduce or eliminate releases from unintentional production;
- take measures to reduce or eliminate releases from stockpiles and wastes;
- develop plans to implement the requirements deriving from the Convention;
- promote and facilitate actions for public education, awareness and information related to
POPs and for developing research activities and monitoring systems.
In July, 2002, the Ministry of Environment and Forests, with financial support from GEF (Global
Environment Facility) and technical assistance from the United Nations Industrial Development
Organization (UNIDO), through the National Research - Development Institute for Environmental
Protection developed the National Implementation Plan (NIP) of Stockholm Convention, which was
submitted to the Stockholm Secretariat in April 2006.
Since 2006 the process of implementing the actions and measures provided in NIP has started at the
national level in order to fulfill the obligations assumed through the Convention.
In 2008 entered into force the Goverment Decision 1497/2008 for the approval of the National
Implementation Plan.
At the 4th meeting of the Conference of the Parties to the Stockholm Convention, held in May, 4-8,
2009, in Geneva, Switzerland, there had been adopted the amendments made to Annexes A, B and
C of the Convention. Thus, 9 new POPs substances were introduced in the Annexes A, B and C,
respectively:
Annex A - Elimination, Part I: alpha-hexachlorocyclohexane, beta-hexachlorocyclohexane,
chlorodecone, hexa-bromobiphenyl, hexa- and hepta-bromobiphenyl ether, lindane,
pentachlorobenzene, tetra- and penta-bromobiphenyl ether;
Annex A, Part III – Definitions : hexa- and hepta-bromobiphenyl ether, tetra-and penta-
bromobiphenyl ether;
4
MINISTRY OF ENVIRONMENT AND FORESTS“National Implementation Plan of Stockholm Convention on Persistent Organic Pollutants”
_________________________________________________________________________________________
Annex A, Part IV: hexa- and hepta-bromobiphenyl ether;
Annex A, Part V: tetra- and penta-bromobiphenyl ether;
Annex B – Restriction, Part I and Part III: perfluorooctanic sulphonic acid, its salts and
perfluorooctanic sulphonyl fluoride ;
Annex C – Unintentional production, Part I – pentachlorobenzene.
In accordance with the provisions of Article 22 in the Convention, the amendments brought to the
Convention enter into force a year after the date of communication by the depositary (the Secretary
General of the United Nations). The depositary informed the Parties about the adoption of the
amendments on the 26th of August 2009, and the amendments entered into force on the 26th of
August 2010.
At the 5th meeting of the Conference of the Parties to the Stockholm Convention, held on May, in
Geneva, Switzerland, the representatives of the 127 governments agreed upon that endosulfan is
introduced on the list of persistent organic pollutants proposed to be eliminated. This substance was
introduced in Annex A (Elimination) with certain exceptions. The amendment to Annex A shall
enter into force in October 2012. Thus, endosulfan shall be the 22nd persistent organic pollutant on
the Stockholm Convention list.
Taking into consideration the new changes made within the Convention Law 227/2010 was
promulgated. By this Law the amendments of Stockholm Convention have been ratified.
Decision SC-1/12: the National Implementation Plans of the Conference of the Parties to the
Stockholm Convention stipulate the fact that, if due to some external factors, such as changes of the
obligations derived from the amendments made to the Convention or its annexes, including addition
of new substances in Annexes A, B and C, it is necessary to update/revise the National
Implementation Plan in two years from the date the amendments enter into force.
5
MINISTRY OF ENVIRONMENT AND FORESTS“National Implementation Plan of Stockholm Convention on Persistent Organic Pollutants”
_________________________________________________________________________________________
2. GENERAL CHARACTERISTICS OF THE COUNTRY
2.1. Country profile
2.1.1. Geography and population
a) Geography
For this section there are no changes to the NIP 2005.
b) Population
The number of inhabitants was 21.8 millions on the 1st of July 2009, out of which 10.65 millions
men and 11.15 millions women. The distribution is presented in the following table:
Table 2-1 - Romanian population
TOTAL URBAN RURAL
Age (years)
Both sexes Women Both sexes Women Both sexes Women
0-4 1094213 532170 487110 236674 607103 295496
5-9 1138448 555452 519080 253154 619368 302298
10-14 1546637 757032 820913 403082 725724 353950
15-19 1646667 803016 943191 464631 703476 338385
20-24 1752646 856679 1019609 507988 733037 348691
25-29 1733618 846325 950006 478905 783612 367420
30-34 1953607 964106 1110055 579822 843552 384284
35-39 1219037 604443 723336 385008 495701 219435
40-44 1427621 716071 900782 479306 526839 236765
45-49 1603366 815450 1033035 534722 570331 280728
50-54 1433857 739137 835315 424912 598542 314225
55-59 1061665 558424 530835 276396 530830 282028
60-64 1122390 610803 508819 275275 613571 335528
65-69 1085893 605877 450185 252684 635708 353193
70-74 900956 517380 358978 209327 541978 308053
75-79 630292 380019 241732 149476 388560 230543
80-84 279105 180764 108354 72730 170751 108034
85 and over 164775 109107 67400 45601 97375 63506
Total 21794793 11152255 11608735 6029693 10186058 5122562
Source: National Institute of Statistics – Romanian Statistical Yearbook, 2010
2.1.2. Economic profile
Emission sources of POPs are placed in four main economic sectors: energy, industry, agriculture,
transport and in “others sources”.
Energy
In 2009 the energy resources and final energy consumption decreased comparing with the values of
2008 (-11.3 %, and -10.5 %, respectively).
6
MINISTRY OF ENVIRONMENT AND FORESTS“National Implementation Plan of Stockholm Convention on Persistent Organic Pollutants”
_________________________________________________________________________________________
The decrease of the energy resources was mainly caused by the 31.2% decrease of energy import.
The final energetic consumption decreased in industry including constructions by 27.5%, while
remaining relatively the same in transport and for population.
In 2009, the available energy resources amounted to 43.8 million oil equivalent tons (toe), a
decrease of 5591 thousands tons (-11.3%) as compared to the preceding year, which was caused by
the 31.2%.reduction of electric power import and energy carriers.
In 2009 the resources of primary energy were 42729 thousand oil equivalent tons, a decrease of
5437 thousand oil equivalent tons as compared to the preceding year.
Coal, natural gases and oil resources were reduced mainly because of the import reduction of these
energy carriers (i.e. -1390 thousand tons, -1953 thousand tons and -1525 thousand tons). Primary
electric energy resources were relatively constant as compared to 2008, the reduction of wind power
and hydro electric power by 120 thousand tons being compensated by a 129 thousand tons rise of
nuclear- electric power.
Production of primary energy in 2009, 28.0 million tons, a small fall compared to 2008 (-2.6%),
increased significantly its share among the total energy resources; it amounted to 64.0%, as
compared to the value of the preceding year (58.3%).
Table 2-2 Production of the main primary energy carriers in 2009, in comparison with 2008
Year Year Rise (+) or fall (-)
2009 2008 As compared to
Thousand tons Thousand tons Thousand tons
Coal (exclusively coke) 6477 7011 -534 -7,6
• pit coal 751 979 -228 -23,3
• lignite and brown coal 5726 6032 -306 -5,1
Oil 4390 4619 -229 -5,0
Usable natural gases 8964 8982 -18 -0,2
Wind and hydro = electric power 1361 1481 -120 -8,1
Source: National Institute of Statistics – Energetic Balance, 2009
Renewable natural resources of Romania are limited although they are varied. The most important
ones are water, soil, fauna, and flora and forest resources.
The main economic indicator is the Gross National Product (GNP), which is the annual value of
goods and services derived from production processes of the economy with the purpose to be
consumed, invested, stored or exported, whose evolution is presented in Figure 2-1, bellow.
7
MINISTRY OF ENVIRONMENT AND FORESTS“National Implementation Plan of Stockholm Convention on Persistent Organic Pollutants”
_________________________________________________________________________________________
600060
500060
400060
300060
200060
100060
60
2004 2005 2006 2007 2008 2009
gross domestic product 247368 288954.6 344650.6 416006.8 514700 498007.5
gross added value 220931.3 255232.7 304269.8 368356.3 458535.5 447847.2
gross domestic product/inhabitant 11413.5 13362.8 15967.6 19315.4 23934.6 23195.5
Source: National Institute of Statistics – Romanian Statistical Year Book, 2010
Figure 2-1- Gross National Product (2004-2009) (%)
The main indicators of industrial production in the period 2007-2009 are presented in Table 2-3.
Table 2-3 - Indicators of industrial production by activities
Economic activity 2004 2005 2006 2007 2008 2009
Total 122.7 125.1 109.3 120,6 123,8 116,9
Mining and working of mines: 101.6 101.0 102.4 100.8 100.7 88,7
Coal processing and mining 103.7 102.5 112.7 114.3 114.2 98.3
Oil and natural gases extraction 95.3 96.8 95.7 94.6 89.4 84.7
Quarrying and 103.8 80.5 79.9 18,8 4,0 2,8
metal-bearing ore processing 135.9 140.5 129.1 152,6 170,9 109,6
Other extractive activities 128.8 132.1 112.5 126,1 130,1 121,6
Processing 92.3 90.9 92.3 96,3 96,6 103,4
Electric and thermal energy, gases and water 106.0 114.0 92.3 96,3 96,6 103,4
:
- production, transport and distribution of
thermal and electric energy, gases and hot water
Source: National Institute of Statistics – Romanian Statistical Year Book, 2008
National Institute of Statistics – Romanian Statistical Year Book, 2010
Table 2-4 presents a general view on the primary energy consumption in the period 2007-2009.
Table 4 - Energy consumption
2004 2005 2006 2007 2008 2009
Gross domestic energy consumption
(thousand tons of equivalent oil)
Total
Electric energy 1320 1489 1212 1195 1115 1164
8
MINISTRY OF ENVIRONMENT AND FORESTS“National Implementation Plan of Stockholm Convention on Persistent Organic Pollutants”
_________________________________________________________________________________________
Crude oil 10092 9163 9651 9658 9719 8239
Coal and oil products 9172 8742 9540 10064 9649 7436
Natural gases 13766 13820 14308 12862 12476 10642
Final energy consumption (thousand tons of equivalent oil)
Industry (including constructions) 11285 10505 9998 9630 9115 6612
Agriculture, silviculture, fishing 233 237 262 260 293 385
Transport and communications 4353 4379 4407 4729 5399 5377
Other industrial activities 1936 2030 2757 2481 2106 1976
Population 7908 8055 7889 7559 8089 8037
Source: National Institute of Statistics –Romanian Statistical Year Book, 2010
Generally, the evolution of the energetic consumption has had the same trend as the evolution of the
national economy, namely industrial activity.
Agriculture, through its specific characteristics (land exploitation, conservation of natural
biological processes) is one of the most important economic activities.
Studying the evolution of agricultural land distribution by types of uses between 2007-2009 it can
be noticed that the surface of arable lands is almost 61.6% of the total of agricultural lands, whereas
the remainder is distributed among pastures (about 14%), grassland (about 6.4%), vineyard (1.0%)
and orchards (0.86%). The dynamics of agricultural plant production is presented in Figure 2-2.
30000
25000
20000
thousand tonne
15000
10000
5000
0
2004 2005 2006 2007 2008 2009
cereals 24403 19345,5 15759,3 7814,8 16826,4 14873
vegetables 4773,9 3624,6 4138,9 3116,8 3819,9 3901,9
oil seeds 1995,1 1803,1 2050,1 1046,6 1942,3 1764
potatoes 4230,2 3738,6 4015,9 3712,4 3649 4004
cereals vegetables oil seeds potatoes
e
Source: National Institute of Statistics – Romanian Statistical Year Book, 2010
Figure 2-2 - Dynamics of agricultural plant production
The evolution of the use of chemical fertilizers in Romania is presented in Table 2-5 and Figure 2-
3. It can be noticed that in 2005 there was a sudden rise in pesticides consumption as compared to
the year 2004, then, in 2006 there was a sudden fall. In the period 2006-2009 it can be noticed a
slight rise from one to another.
9
MINISTRY OF ENVIRONMENT AND FORESTS“National Implementation Plan of Stockholm Convention on Persistent Organic Pollutants”
_________________________________________________________________________________________
The quantity of natural fertilizers used in 2008 was 11,748, 14 thousand tons, and in 2009 it was
greater, namely 13,748.307 thousand tons. It can be noticed a rise of 85.45% in the use of natural
fertilisers in 2009 as compared to 2008.
Table 2-5 - Use of chemical fertilizers in Romanian agriculture
Used chemical fertilisers N+P2O5+K2O
Year
(thousand tons of active substance) (kg/ha)
Nitrogen phosphorous Potassium Total Arable Agricultural
2004 270 94 16 380 40.3 25.9
2005 299 138 24 461 48.9 31.4
2006 252 94 17 363 38.5 24.7
2007 265 103 19 387 41.1 26.4
2008 280 102 16 398 42.2 27.1
2009 296 100 30 426 45.2 29.0
Source: National Institute of Statistics –Romanian Statistical Year Book, 2010
350
300
250
200
150
100
50
0
2004 2005 2006 2007 2008 2009
Nitrogen Phosporous Potassic
Source: National Institute of Statistics – Romanian Statistical Year Book, 2010
Figure 2-3 - Evolution of used chemical fertilizers in Romania (thousand tonne)
The use of pesticides in agriculture has beside the advantage of increasing the production the
disadvantage of causing environment pollution. Soil acts as receiver and collector for pesticides, in
places where they degrade.
In comparison with other member states of the European Union, Romania is not under the
conditions of being “saturated” with products used for plant protection. In the last 6 years, in our
country, the consumption per ha of arable land areas, vineyard and orchards, is between 0.88 and
0.44 kg/ha, as the data shown in Table 2-6 and Figure 2-4.
10
MINISTRY OF ENVIRONMENT AND FORESTS“National Implementation Plan of Stockholm Convention on Persistent Organic Pollutants”
_________________________________________________________________________________________
Table 2-6 - Quantity of pesticides approved to be placed on the market, used in the period
2004 – 2009
kg/ha
Total (ha of
consumption arable
of pesticides Insecticides Fungicides Herbicides land /kg of
Year Insecticides Fungicides Herbicides
(tons of active (tons) (tons) (tone) active
substance) out substance)
of which out of
which:
2004 8240.568 2206.302 3288.961 2744.5437 0.88 0.24 0.35 0.29
2005 6790.443 968.9147 3304.7896 2513.254 0.72 0.10 0.35 0.27
2006 6994.347 858.8815 3263.1490 2857.754 0.74 0.09 0.35 0.30
2007 5883.579 841.4090 2626.998 2394.142 0.62 0.09 0.28 0.25
2008 6120.020 718.0175 3041.0103 2344.524 0.65 0.08 0.32 0.25
2009 4167.611 313.5112 1811.8567 2041.1925 0.44 0.03 0.19 0.22
Source: NEPA - State of Environment Report, 2009
3500
3000
2500
2000
1500
1000
500
0
2004 2005 2006 2007 2008 2009
Insecticides Fungicides Herbicides
Source: National Institute of Statistics –Romanian Statistical Year Book, 2010
Figure 2-4 - Evolution of quantities of pesticides used
Transport sector has been and still is by far an important consumer of energy (hydrocarbons and
electric energy).
Great efforts are being made to build new highways and to equip urban transport with new vehicles.
Under these circumstances, emissions of pollutants into the air will increase. We are far from
having an ecological transport.
Transport of goods (independent of the transport means) registered a significant reduction in the
period 2007-2009, see Table 2-7.
11
MINISTRY OF ENVIRONMENT AND FORESTS“National Implementation Plan of Stockholm Convention on Persistent Organic Pollutants”
_________________________________________________________________________________________
Table 2-7 - Distance covered by goods
2004 2005 2006 2007 2008 2009
(million tons - km)
Railway transport 72,738 69,175 68,313 68,772 66,711 50,596
Road/Land transport 294,221 306,994 335,327 356,669 56,377 34,265
Inland waterway transport 31,211 33,648 29,304 29,425 30,295 24,743
Maritime transport 40,531 47,694 46,709 48,928 50,458 36,021
Airborne transport 0,020 0.020 0.023 0.022 0.027 0.024
Transport on the route of oil pipelines 12,804 13,378 12,702 12,310 12,390 8,520
Source: National Institute of Statistics –Romanian Statistical Year Book, 2010
There is a fifth sector “Others sources”, which included “residential areas” with deposits / dumps of
waste, incineration plants for hospitals waste, a.s.o.
2.1.3. Environmental situation in Romania
Environmental quality is a concept that includes many aspects of human-nature relationship.
Quality and environmental protection problem entered into topical when people became aware of
the need to conserve and make best use of the productive potential of the environment.
Achieving environmental quality monitoring is carried within the framework established by the
transposition and implementation of EU directives requirements at national and local levels.
Monitoring actions are based on the improvement of living at all levels and ensuring sustainable
development in terms of compatibility of data exchange.
Report on state of environment in Romania is a summary of the results of the monitoring and
control of state environmental elements (air, water, soil, waste, biodiversity and protected areas,
urban, environmental radioactivity), activities carried out by EPAs or by other institutions and local
governments that manage various environmental issues in the country, being made monthly,
quarterly and annually. The raport is intended to inform the public authorities, decision makers at
local and national levels and public informing in accordance with legal provisions on public access
to environmental information.
2.1.4. The role and responsibilities of ministries, agencies and other institutions
involved in POPs life cycle
From an institutional perspective, the environmental effect is the Government Decision no.
544/2012 on organization and functioning of the Ministry of Environment and Forests. The
Ministry of Environment and Forests is the specialized institution of central public administration,
suborditated to the Government, which operates in the areas of strategic planning, sustainable
development, environmental infrastructure and water management, meteorology, hydrology,
12
MINISTRY OF ENVIRONMENT AND FORESTS“National Implementation Plan of Stockholm Convention on Persistent Organic Pollutants”
_________________________________________________________________________________________
hydrogeology, climate change, protected areas, waste management, management of dangerous
substances and preparations, biodiversity, biosafety and environmental noise, air quality
management, forest management administration.
The Ministry of Environment and Forests (MEF) develops at the national level, the policy of
environment and water management domain, elaborates the strategy and specific regulations of
development and harmonization of these activities within the framework of the Government general
policy, coordinates the implementation of Government strategy in its domain of competency,
fulfilling the role of State Authority for synthesis, coordination, inspection and control in this
domains.
As the role and responsibilities of ministries, agencies and other government agencies involved in
the management of POPs substances, there are no changes to the NIP2005.
2.1.5. Relevant international commitments and obligations
Since the first NIP was developed, at the national level were promoted laws which contributed to
the elimination or reduction of the negative effects of persistent organic pollutants, namelly:
Law no. 261/2004 on the ratification of Convention on persistent organic pollutants, adopted
at Stockholm on 22 May 2001;
Law no. 112/2009 on the ratification of Protocol regarding the Register of Pollutants
Emitted and Transferred, adopted la Kiev on 21-23 May 2003;
Law no. 349/2009 on the ratification of the Convention on Environmental Impact
Assessment in a Transboundary Context Protocol on Strategic Environmental Assessment (SEA),
adopted at Kiev on 21-23 May 2003;
Law no. 227/2010 on the ratification of the amendments to the Annexes A, B and C of the
Convention on persistent organic pollutants, adopted at Stockholm on 22 mai 2001, adopted by
Decisions SC-4/10, SC-4/11, SC-4/12, SC-4/13, SC-4/14, SC-4/15, SC-4/16, SC-4/17 and SC-4/18
at the 4th meeting of the Conference of Parties, which took place at Geneva, on 4 to 8 May 2009;
2.1.6. Existing legislation and regulations at EU level on POPs
The main national legislative acts and European Union regulations in force on POPs issues are:
Government Decision (GD) no. 561/2008 regarding establishment of some measures in
order to implement the Regulation (EC) No 850/2004 of the European Parliament and of the
Council of 29 April 2004 on persistent organic pollutants and amending Directive 79/117/EEC;
13
MINISTRY OF ENVIRONMENT AND FORESTS“National Implementation Plan of Stockholm Convention on Persistent Organic Pollutants”
_________________________________________________________________________________________
Government Decision (GD) no. 1497/2008 on the approval of the National Implementation
Plan of the Convention on Persistent Organic Pollutants, adopted at Stockholm on May 22, 2001,
for the period 2008-2029;
MEF Order no. 1179/2010 for the approval of the Guidelines on environment sound
management of PCBs;
Regulation (EC) No 850/2004 of the European Parliament and of the Council of 29 April
2004 on persistent organic pollutants and amending Directive 79/117/EEC;
Council Regulation (EC) No 1195/2006 of 18 July 2006 amending Annex IV to Regulation
(EC) No 850/2004 of the European Parliament and of the Council on persistent organic pollutants;
Council Regulation (EC) No 172/2007 of 16 February 2007 amending Annex V to
Regulation (EC) No 850/2004 of the European Parliament and of the Council on persistent organic
pollutants;
Commission Regulation (EC) No 323/2007 of 26 March 2007 amending Annex V to
Regulation (EC) No 850/2004 of the European Parliament and of the Council on persistent organic
pollutants and amending Directive 79/117/EEC;
Commission Regulation (EC) No 304/2009 of 14 April 2009 amending Annexes IV and V
to Regulation (EC) No 850/2004 of the European Parliament and of the Council as regards the
treatment of waste containing persistent organic pollutants in thermal and metallurgical production
processes;
Commission Regulation (EU) No 756/2010 of 24 August 2010 amending Regulation (EC)
No 850/2004 of the European Parliament and of the Council on persistent organic pollutants as
regards Annexes IV and V;
Commission Regulation (EU) No 757/2010 of 24 August 2010 amending Regulation (EC)
No 850/2004 of the European Parliament and of the Council on persistent organic pollutants as
regards Annexes I and III;
Commission Regulation (EU) No 519/2012 of 19 June 2012 amending Regulation (EC)
No 850/2004 of the European Parliament and of the Council on persistent organic pollutants as
regards Annex I.
14
MINISTRY OF ENVIRONMENT AND FORESTS“National Implementation Plan of Stockholm Convention on Persistent Organic Pollutants”
_________________________________________________________________________________________
3. Current national situation concerning POPs
3.1. POPs listed in the Annexes “A”, ”B” and “C” of Stockholm Convention
POPs are organic substances which have toxic characteristics, are resistant to degradation and
bioacumulative. They are transported through air, water and migration species over international
boundaries and deposited at long distances from the emission sources where they are accumulated
in the terrestrial and aquatic ecosystems.
Stockholm Convention has three Annexes comprising the lists of substances:
ANNEX “A” contains a list of substances that must be prohibited for production and use. These
substances are:
Aldrin, Endrin, Mirex, Chlordan, Heptachlor, Toxaphen, Dieldrin, Hexachlorobenzene, PCB.
After the fourth meeting of Conference of Parties (COP 4), the following new substances have been
introduced in ANNEX “A”:
Alpha hexachlorocyclohexane (Alpha HCH), Beta hexachlorocyclohexane (Beta HCH),
Chlordecone, Hexabromobiphenyl, Hexabromobiphenyl ether and Heptabromodiphenyl ether
(commercial octabromobiphenyl ether), Lindane (Gamma HCH), Pentachlorobenzene– PeCB
(which is also included in ANNEX “C”), Tetrabromobiphenyl ether and Pentabromobiphenyl ether
(commercial pentabromobiphenyl ether).
After the fifth meeting of Conference of Parties (COP5) has been also introduced Endosulfan.
ANNEX “B” contains a list of substances which must be restricted. The use of the substances
mentioned in this ANNEX is accepted according to the prevision from Part III of ANNEX “B”.
Initially only DDT was included in this category. After the fourth meeting of the Conference of
Parties (COP4) in ANNEX”B” the following substances have been introduced: Perfluotooctane
sulfonic acid (PFOS) and its salts and Perfluorooctane sulfonyl fluoride (PFOS-F).
ANNEX “C” is related to the unintentional production of POPs. The following substances are
included in this ANNEX: Polychlorinated para-dibenzodioxine (PCDD) and Polychlorinated
dibenzo furans (PCDF), Hexachlorobenzene (HCB) and Polychlorinated Biphenyls (PCB). After
the forth meeting of the Conference of Parties (COP4) has been also introduced Pentachlorobenzene
(PeCB).
15
MINISTRY OF ENVIRONMENT AND FORESTS“National Implementation Plan of Stockholm Convention on Persistent Organic Pollutants”
_________________________________________________________________________________________
3.2. Persistent organic pollutants listed in the annexes of the Stockholm Convention
before 2009 (aldrin, dieldrin, endrin, chlordane, heptachlorine, toxaphene, mirex,
HCB, DDT, PCB, PCDD/PCDF)
To achieving the key-objective no.1 “Disposal of pesticides wastes and stocks” foreseen by the first
NIP, in the period 2004-2006 the Ministry of Agriculture and Rural Development has developed
and implemented the PHARE project “Elimination of pesticides (repackaging, collection and
disposal the pesticide residues) from Romania”. Following this project were collected, repackaged,
transported and disposed of, in Germany, about 2516 tons of waste pesticides from 218 locations on
the Romanian territory.
3.2.1. Chlordane, Dieldrin, Endrin, Aldrin, Heptachlor and Toxaphene
In Romania, chlorinated pesticides had been used since 1948, and they are products based on
chlordane, dieldrin, endrin, aldrin, heptachlor and toxafen.
All these products were imported excepting those based on DDT and heptachlor which were
produced in a petrochemical installation in Borzeşti.
The respective substances were used under the form of powders, granular or liquid form on large
agricultural land areas, on meadows and alpha-alpha cultures.
Dieldrin-based pesticides were used in Romania in the period 1965-1970, especially for seeds
treatment. In addition to persistent chlorinated pesticides, some of the most used products were
those based on heptachlor.
Preliminary inventory showed that at national level, at the end of 2011, there is no information
regarding the existence of waste stockpiles containg of or contaminated with such substances.
3.2.2. DDT
DDT –based products were used on large agricultural land areas for the purpose of protecting plants
(potato beetles) and of killing destructive/troublesome insects (bugs, flies, etc.).
Preliminary inventory showed that at national level, at the end of 2011, there is no information
regarding the existence of waste stockpiles containg of or contaminated with such substance.
3.2.3. Dioxines and furans
From 2005 to 2009 the emissions of persistent organic pollutants generally registered a decreasing
evolution from 296,8 g I-Teq to 140,33 g I-Teq. In 2009, the total dioxine emissions slightly
16
MINISTRY OF ENVIRONMENT AND FORESTS“National Implementation Plan of Stockholm Convention on Persistent Organic Pollutants”
_________________________________________________________________________________________
increased, reaching to 140,33 g I-Teq. This rise was caused by the use of wood and wood wastes for
burning in the residential sector (Figure 3-1).
350
300
250
200
gI-Teq
150
100
50
0
2005 2006 2007 2008 2009
Source: NEPA – State of Environment Report, 2010
Figure 3-1 - Evolution of the total dioxine emissions
The main sources of dioxine emissions are represented by the following sectors: “Burning in
residential sector”, “Incineration of hospital wastes”, “Burning in metallurgical industry” and
“Production of cast iron and steel” (Figure 3-2).
120
100
80
gI-Teq
60
40
20
0
Burning in metalurgical
Incineration of industrial
Burning of agricultural
Incineratin of hospital
Other combustion in
commercial/institutional
Iron and steel
Heat and power
residential sector
Burning in non-
production
production
Combustion in
industry
industry
waste
waste
waste
sector
2005 2006 2007 2008 2009
Source: NEPA – State of Environment Report - 2010
Figure 3-2 - Evolution of dioxine emissions coming from industrial sources,
wastes treatment and burning processes
17
MINISTRY OF ENVIRONMENT AND FORESTS“National Implementation Plan of Stockholm Convention on Persistent Organic Pollutants”
_________________________________________________________________________________________
The yearly national emissions of policyclic aromatic hydrocarbons (PAH) had an ascending trend in
the period 2005 - 2009, from 131,73 t to133,54 t (Figure 3-3). The greatest rises had been registered
in sectors “Burning in residential sector”, the cause being like in the case of dioxine emissions the
use of wood and wood wastes for this type of burnings and “Production of aluminium” (Figure 3-
4).
160
155
150
145
140
tone
135
130
125
120
115
2005 2006 2007 2008 2009
Source: NEPA – State of Environment Report, 2010
Figure 3-3 - Evolution of total PAH emissions
120
100
80
tone
60
40
20
0
Aluminium production
Burning in metalurgical
residential sector
Other combustion in
Fugitive emissions from
commercial/institutional
-Burning in non
the transforming
Combustion in
industry
industry
industry
sector
2005 2006 2007 2008 2009
Source: NEPA – State of Environment Report, 2010
Figure 3-4 - Evolution PAH emissions from the main industrial
sources and burning processes
18
MINISTRY OF ENVIRONMENT AND FORESTS“National Implementation Plan of Stockholm Convention on Persistent Organic Pollutants”
_________________________________________________________________________________________
3.2.4. Polichlorinated Biphenyls (PCBs)
The emissions of polichlorinated biphenyls (PCBs) registered a decrease from 223,6 kg in 2005
to 62,855 kg in 2009. (Figure 3-5). The most important decreases were registered in the sectors of
“Copper production”, “Production of cast iron and steel” and “Burnings in metallurgical industry".
The shares of the main sources of polichlorinated biphenyls emissions are: “Production of lead”,
“Production of cast iron and steel" and “Production of zinc", (Figure 3-6).
250
200
150
kg
100
50
0
2005 2006 2007 2008 2009
Source: NEPA – State of Environment Report, 2010
Figure 3-5 - Evolution of the total PCBs emissions
80
70
60
50
kilograms
40
30
20
10
0
Lead Iron and Zinc Copper Combustion Burning in Other Burnings in
production steel production production in other burnings in commercial
production metallurgic residential industry and
industry sector institutional
sector
2005 2006 2007 2008 2009
Source: NEPA – State of Environment Report, 2010
Figure 3-6 - Evolution of PCBs emissions from industrial sources
and burning processes
19
MINISTRY OF ENVIRONMENT AND FORESTS“National Implementation Plan of Stockholm Convention on Persistent Organic Pollutants”
_________________________________________________________________________________________
In according with Directive 96/59/EC, transposed into national legislation by Government Decision
no. 173/2000 for the special provisiosn of the management and control of PCBs and other similar
compounds, as amended (GD 291/2005, GD 975/2007), Romania was required to eliminate the
equipments out from operation containing PCBs until 31.12.2010.
In this sense, in the period 2007-2010 was developed and implemented by the Ministry of
Environment and Forests, through the National Research - Development Institute for
Environmental Protection, the GEF/UNIDO project “Disposal of PCBs waste in Romania”
In this project were screened over 7000 samples of transformer oil and were removed about 1200
tonnes of equipments with PCBs content..
According to the information provided by NEPA, at the level of 2010, there were out of use PCBs
containing equipment stockpiles still not eliminated, most of them coming from companies with
uncertain legal situation (insolvency, bankruptcy, litigation, etc..), and to some operators who had
no financial funds necessary to ensure their elimination.
At the level of 2011, the situation concerning the equipments with PCBs content is presented in
Table 3-1, bellow.
20
MINISTRY OF ENVIRONMENT AND FORESTS“National Implementation Plan of Stockholm Convention on Persistent Organic Pollutants”
_________________________________________________________________________________________
Table 3-1 - Situation of PCBs containing equipments at the level of 2011
Decontaminated
Equipment inventory (pieces) Removed in 2011 (pieces) Oil Stock at 31.12.2011
Nr Oil volume in 2011
Tip of equipment volume
crt. (liters) Total Total
Out of Out of removed Out of
Total In use Total In use equip. oil Total In use
use use use
(pieces) (liters)
1. Capacitors 67939 50558 17381 529.976,64 6550 2142 4408 36.547,60 0 0 61389 48416 12973
2. Transformers 649 605 44 505.611,00 47 36 11 27.476,20 1 3.720 601 568 33
Total 68588 51163 17425 1.035.587,64 6597 2178 4419 64.023,80 1 3.720 61990 48984 13006
Source: NEPA
At the end of 2009, in Romania there were only three installations authorized for elimination of equipments containing PCBs/PCTs: PRO AIR CLEAN
Timişoara - incineration, IF TEHNOLOGII Cluj – incineration and SETCAR Brăila – physico - chemical and biological treatment.
Taking into consideration the existing treatment capacities in Romania a great part of equipments containing PCBs/PCTs is transported to be eliminated in
authorized installations from other member states, their transfer being done in accordance with the provisions of the Regulation (CE) no. 1013/2006 of the
European Parliament and the Council regarding wastes transfer.
27
MINISTRY OF ENVIRONMENT AND FORESTS“National Implementation Plan of Stockholm Convention on Persistent Organic Pollutants”
________________________________________________________________________________________________
3.2.5. Hexachlorbenzen (HCB)
Emissions of hexachlorbenzen (HCB) showed a decreasing trend from 2,51 kg in 2005 to 1,63 kg
in 2009, (Figure 3-7).
3
2.5
2
kg
1.5
1
0.5
0
2005 2006 2007 2008 2009
Source: NEPA – State of Environment Report, 2010
Figure 3-75 - Evolution of the annual HCB emissions
The most important decrease came from the sector of “Incineration of hospital wastes”, where the
wastes quantity was reduced by half. Significant reductions were in other sectors as well: “Burnings
in commercial/institutional sector”, “Burnings in metallurgical industry” and “Production of cast
iron and steel". The sources with the highest shares in the total HCB emissions are “Incineration of
hospital wastes” and “Burnings in residential sector", (Figure 3-8).
1.6
1.4
1.2
kilograms
1
0.8
0.6
0.4
0.2
0
Other burning in industry
metallurgical industry
Incineration of hospital
Iron and steel
Burnings in industrial
commercial/institutional
production
Burnings in
Burnings in
sectors
wastes
sector
2005 2006 2007 2008 2009
Source: NEPA – State of Environment Report, 2010
Figure 3-8 - Evolution of HCB emissions coming from industrial sources,
wastes treatment and burning processes
28
MINISTRY OF ENVIRONMENT AND FORESTS“National Implementation Plan of Stockholm Convention on Persistent Organic Pollutants”
________________________________________________________________________________________________
3.3. Characterization of the new POPs substances introduced in the Annexes of
Stockholm Convention
3.3.1. Inventory of new POPs substances
In order to update the National Implementation Plan of the Stockholm Convention regarding the
new POPs substances were drafted a set of guidelines prepared by United Nations Institute for
Training and Research (UNITAR), United Nation Industrial Development Organization (UNIDO)
in collaboration with Secretariat of the Stockholm Convention (SSC). The guidelines and refered to
the inventories of new POPs, monitoring the presence of products containing new POPs substances
and selection of technologies and practices recommended for situations in which production, use
and recycling of industrial persistent organic pollutants that are currently permitted by the
Convention. Even though were at the “draft stage”, the guidelines were of very much help in
designing and conducting a preliminary inventory at the national level.
For the evaluation of the national situation concerning POPs, first was developed a strategy on how
to approach the POPs inventories. This strategy consists in completion of the following steps:
Step 1: Planning of the inventory which included: a) Establishment of the work team; b)
Definition of the inventory objectives and scope; c) Formulation of the work plan;
Step 2: Identify POPs sources;
Step 3: Data collection methodology;
Step 4: Data collection;
Step 5: Data processing and report on inventory.
Figure 3-9 describes the flow of PFOS and PBDE and the diagrams of Figures 3-10, 3-11 and 3-12
are presented the flows of POPs pesticides, PCBs and unintentionally released POPs (dioxins,
furans, PCBs, PeCB and HCB).
Description of these data streams served to identify the source categories defined in the Convention.
29
MINISTRY OF ENVIRONMENT AND FORESTS“National Implementation Plan of Stockholm Convention on Persistent Organic Pollutants”
________________________________________________________________________________________________
Producers / suppliers of
PFOS1+PBDE2
Importers of PFOS*
Industrial activities Industrial activities Industrial activities that
that use PFOS/PBDE that use PFOS/PBDE use PFOS/PBDE as an
in manufacture of in preparation of additive in the
chemicals chemical products production processes of
various articles
Retailers of
Producers of household
Retailers articles products,
cosmetics, etc
Retailers of
furniture, clothing,
footwear, etc 1
– perfluorooctane sulfonic acid and its salts
2
– polybrominatedbiphenyl ethers
Figure 3-9 - PFOS and PBDE flow where fall the sources which inventoried
Domestic producers of Importers (distributors)
pesticides
Distributors of pesticides
Users (specialized
companies for pesticide
application, local
authorities that use
pesticides to eliminate
insects, rodents, etc.)
Figure 3-10 - Pesticides – POPs flow where fall the sources which inventoried
30
MINISTRY OF ENVIRONMENT AND FORESTS“National Implementation Plan of Stockholm Convention on Persistent Organic Pollutants”
________________________________________________________________________________________________
Owners of transformers in Continued
use operation
Analysis
Contains PCB1? Not
Yes
Temporary storage
Disposal of PCBs by
authorized operators
1
- polychlorinated biphenyls
Figure 3-11 - PCB flow where fall the sources which inventoried
Energy
Industry
construction
Transport
Agriculture
Population
Waste
Total unintended
emissions
Figure 3-12 - Emission sources of POPs (dioxins, furans, PCBs, PeCB, HCB)
31
MINISTRY OF ENVIRONMENT AND FORESTS“National Implementation Plan of Stockholm Convention on Persistent Organic Pollutants”
________________________________________________________________________________________________
Data collection method
For updating the national inventory of POPs were practically involved all the local and central
authorities, research institutes, universities, NGOs and economic operators.
In this sense, was developed an interactive website page on which were uploaded questionnaires for
POPs data collection, as well as for public awareness on issues related to POPs.
Figure 3-13 presents a schematic diagrama of the data collection approach to develop the national
inventory of POPs.
32
MINISTRY OF ENVIRONMENT AND FORESTS“National Implementation Plan of Stockholm Convention on Persistent Organic Pollutants”
________________________________________________________________________________________________
MND LEGEND
Data requests
Data provide
METBE Inventory communication
Data requests on the spot
MARD
MEF – Ministry of Environment and Forest
MAI NEPA – National Environmental Protection
Agency
REPA – Regional Environmental Protection
MTI Agency
EPA – Environmental Protection Agency
MH - Ministry of Health
MTI - Ministry of Transports and Infrastructure
MH
MAI - Ministry of Administration and Interior
MARD - Ministry of Agriculture and Rural
Development
METBE - Ministry of Economy, Trade and
Business Environment
MEF NEPA 8 REPA 42 EPA POPs MND – Ministry of National Defence
sources
NSI – National Statistics Institute
NIRDEP – National Institute for Research &
Development for Environmental Protection
NSI NIRDEP
Figure 3-13 - Approach to data collection scheme to develop the national inventory of POPs
33
MINISTRY OF ENVIRONMENT AND FORESTS“National Implementation Plan of Stockholm Convention on Persistent Organic Pollutants”
_________________________________________________________________________________________
For the collection of necessary data were followed three levels of approach:
- Level 1 – the poorest in the data – desk studies analysis;
- Level 2 – corresponds to data collection by the scheme presented in Figure 3-13;
- Level 3 – corresponds to the checking and validation of data collected from level 2.
These checks are done through direct interviews with the main sources of POPs substances.
The data collection approach scheme for inventory of POPs substances is shown in Figure 3-14.
% from complete data
90-95 Level 3 – Checking and validation of data collected
80-90 Level 2 – Data collection
2-5 Level 1 – Desk studies
Level O - Start
Figure 3-14 - Levels of data collection approach for developing the national inventory of POPs
Description of the database
The logical structure of the questionnaire was translated into an online platform, platform served by
open source solution “Limesurvey”. Among the facilities offered by the sofware are listed:
unlimited number of questionnaires available simultaneously on the same platform;
unlimited number of questions in the questionnaire (only limitation is the database);
unlimited number of participants in each questionnaire;
possibility to manage the users and the access type;
integration of images and movies in the questionnaires;
possibility to publish multilingual questionnaires;
possibility to create hard-copy of the questionnaires;
possibility to declare valid questionnaires for a period of time, such access is controlled
34
MINISTRY OF ENVIRONMENT AND FORESTS“National Implementation Plan of Stockholm Convention on Persistent Organic Pollutants”
_________________________________________________________________________________________
automatically;
possibility to import and / or export from and to text files, CSV, PDF, SPSS, R, queXML,
Microsoft Word and Microsoft Excel;
automatically possibility to import the questionnaires on paper.
The platform runs on an external server connected to the internet with its own domain and a public
IP address. Services running on this server are:
- services http served by an Apache platform;
- a MySQL database types (can be PostgreSQL);
- PHP modules for displaying Web pages and operations of read / write MyQSL database (or
PostgreSQL);
3.3.2. Alpha – Hexachlorociclohexan and Beta – Hexachlorociclohexan (Annex A)
Generically, hexachlorocyclohexan (HCH) primarily contains 5 forms of isomers: alpha, beta,
gamma, delta and epsilon – HCH. Lindane is the name given to the gamma isomer of HCH.
Alpha and beta – HCH are very persistent in cold zones and they can bio-accumulate in biota as
well. These substances are transported on long distances being classified as potentially carcinogenic
substances for humans, affecting their life and that of the wild animals in contaminated.
In Romania Alpha and Beta – HCH is likely to be found in the lindane contaminated sites on the
and arround the former chemical platforms that produced Lindane in the past.
3.3.3. Chlorodecone
Chlorodecone is an organo-chlorinated pesticide that is related to Mirex – a pesticide included in
Annex A of the Convention. It is considered a persistent organic pollutant as it bioaccumulates and
it is transported on long distance. This substance is supposed to be carcinogenic and very toxic for
the aquatic organisms.
Clordecone was produced in 1951 and put on the market in 1958, and according to the preliminary
inventory has not been reported any waste stockpiles contaminated with or containing this
substance.
3.3.4. Hexabromobiphenyl
Hexabromobiphenyl belongs to the group of polibromized biphenyls and is classified as potentially
carcinogenic for humans, having other toxic effects as well.
35
MINISTRY OF ENVIRONMENT AND FORESTSYou can also read