Movement behavior of a solitary large carnivore within a hotspot of human wildlife conflicts in India - Nature
←
→
Page content transcription
If your browser does not render page correctly, please read the page content below
www.nature.com/scientificreports
OPEN Movement behavior of a solitary
large carnivore within a hotspot
of human‑wildlife conflicts in India
Dipanjan Naha1, Suraj Kumar Dash1, Caitlin Kupferman2, James C. Beasley2 &
Sambandam Sathyakumar1*
With a rise in human induced changes to natural habitats, large predators are forced to share
space and resources with people to coexist within multiple-use landscapes. Within such shared
landscapes, co-occurrence of humans and predators often leads to human-carnivore conflicts and
pose a substantial challenge for biodiversity conservation. To better elucidate large carnivore space
use within a hotspot of human-wildlife conflicts, we used GPS data for leopards (N = 6) to identify
behavioral states and document spatial patterns of resource selection in response to season and
human activity periods within a fragmented landscape of North Bengal, eastern India. We identified
two major behavioral states (i.e. resting and travelling). From the resource selection models, we
found leopards selected habitats with dense to moderate vegetation cover and proximity to water
while resting and travelling within the landscape. During the dry season, when risk of human-leopard
conflicts is highest, leopards selected tea plantations, forest patches but avoided protected areas.
These results suggest a potential for increase in human-carnivore conflicts and a strategy to conserve
large predators within multiple-use landscapes of South Asia.
Large carnivores are recognized as flagship species for conservation programs g lobally1,2. As apex predators, they
regulate primary consumers (i.e. herbivores) both directly and indirectly, affecting consumption of plant biomass
with cascading effects on the entire e cosystem1. Although protected areas have been established globally to con-
serve endangered species, large carnivores often are forced to occupy human dominated areas beyond protected
reserve boundaries to meet their reproductive and dietary requirements. Such shared landscapes represent a
substantive proportion of remaining geographic distribution of carnivores w orldwide3. However, co-occurrence
of large carnivores and humans poses a conservation challenge through a combination of predation on livestock
and attacks on humans, leading to human-carnivore conflicts4,5. Increased costs of co-existence due to recurring
damage from predator attacks leads to retaliatory killings and local extinctions of large carnivores, threatening
overall biodiversity of an ecosystem1. Hence, strategies aimed at promoting human-predator coexistence within
shared landscapes has been the major focus of carnivore conservation programs6,7.
In spite of the threats posed due to humans, large carnivore populations can persist within close proximity of
people and show behavioral adaptions to survive within human dominated landscapes8. Availability of domestic
prey, anthropogenic food sources, and refuge from other sympatric competitors act as major attractants for
large carnivores within such shared landscapes9–11. In areas where risk of persecution is high, large carnivores
change their activity, movement, habitat use, and exhibit spatial avoidance of humans12–14. However, in areas
where risk of anthropogenic mortality is low, human activity and anthropogenic alterations to the landscape
impact carnivore behavior15.
For predators occupying shared landscapes, risk of encountering humans is generally higher during the
day compared to night. Thus, several studies have reported increased nocturnal behavior of large carnivores in
areas frequented by humans16–20. Such “temporal partitioning” behavior can provide carnivores access to risky
yet important foraging areas13,20, especially at times when humans are generally inactive. Adaptation to human
activity periods have allowed carnivores flexibility to use shared areas efficiently, specifically when risk of detec-
tion is lowest. The amount of time an animal spends within a habitat also can provide cues as to how and why
an animal prefers to spend time within specific sites21. For example, large carnivores are generally expected to
move straighter and faster within human-dominated l andscapes22,23 to avoid risk of detection.
Movement parameters can provide detailed knowledge of animal behavior with respect to humans, co-
predators and livestock24. Both intrinsic (age, sex, life stage) and extrinsic (environmental conditions, availability
1
Department Endangered Species Management, Wildlife Institute of India, Chandrabani, Dehradun, Uttarakhand,
India. 2Savannah Research Ecology Laboratory, University of Georgia, Athens, GA, USA. *email: ssk@wii.gov.in
Scientific Reports | (2021) 11:3862 | https://doi.org/10.1038/s41598-021-83262-5 1
Vol.:(0123456789)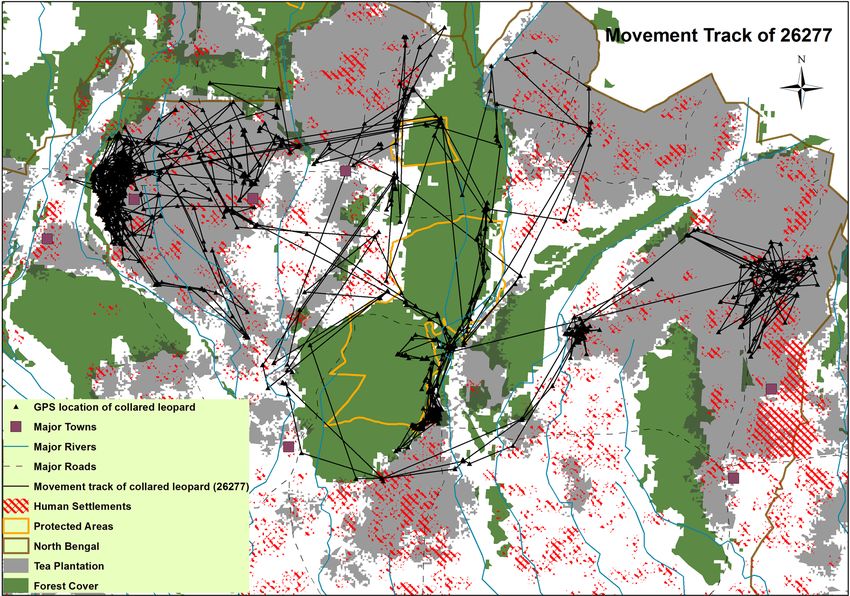
www.nature.com/scientificreports/
of resources) factors can contribute to variance in m ovement23,25. Ecological attributes such as availability of
water, human presence, and the proximity to protected areas, forests, roads, and crop fields have been reported to
affect hunting success and habitat utilization by large c arnivores26–29. These features are essential for maintaining
spatial–temporal avoidance of humans and livestock. In east Africa, lions (Panthera leo) demonstrated temporal
partitioning with humans and exhibited seasonal and temporal differences in habitat selection based on human
activity12–14, whereas cheetahs (Acinonyx jubatus) were nocturnal, avoided humans, and selected semi-closed
habitats30,31. Jaguars (Panthera onca) inhabiting shared landscapes exhibited preference for areas with ambush
cover and killed livestock within closed habitats that were proximal to w ater32. Similarly, leopards (Panthera
pardus) in Kenya spatiotemporally avoided humans . Diurnal activity and use of specific mangrove habitats by
30
tigers (Panthera tigris) were responsible for the large number of attacks on humans in Sundarban delta, I ndia33.
Human-wildlife conflicts are severe in India where protected areas are small and interspersed with crop fields,
forest reserves, and human settlements. With extensive spatial overlap between large carnivores and humans,
and an average density of 380 humans per km2 (Census of India 2011, data accessed on May 2020), conserving
large carnivores and prevention of human-carnivore conflicts is a formidable challenge in India. In particular,
leopards inhabit 68% of the country’s land mass and co-occur with a population of 1.3 billion people34. Human-
leopard conflicts have increased over the past few decades, leading to frequent attacks on people and livestock,
and in many cases retaliatory killings of leopards35,36. Considering that leopards are the most adaptive large
felid to coexist with humans and l ivestock37 we expect some specific behavioral adjustments to avoid detection.
Indeed, the only radio-telemetry study in India documented leopards to be more nocturnal in areas highly
populated with humans17.
Given the paucity of data on leopard space use patterns within shared landscapes in India, our goal was to
quantify how anthropogenic factors influence the activity patterns and spatial ecology of leopards and relative to
the occurrence of human-leopard conflicts. Here we use radio-telemetry data to examine leopard habitat use and
movement behavior with respect to human activity within a heterogeneous landscape of North Bengal, eastern
India. Human-carnivore conflicts are common in this region, with an average of 70 human injuries per year from
2004 to 2016 due to leopard attacks. The majority of these attacks were diurnal in nature, and occurred during the
dry season (summer and winter months) within tea p lantations36. Major victims of leopard attacks were middle-
aged tea estate workers who were working in small groups. Livestock depredation events also are common, and
occur diurnally during the dry season and within tea p lantations38. Leopards killed adult cows and goats and
livestock killing occurred within tea plantations. Probability of leopard attacks on humans and livestock increased
in areas within a heterogeneous matrix of closed and open habitats (i.e. forest, scrubland and tea plantations) and
vicinity of protected areas36,38. Based on the inferences drawn from these studies, we hypothesize that behavioral
adjustments of leopards in response to people and livestock should be influenced by land use types such as tea
plantations that provide adequate crop cover and should be the major driver of human-leopard conflicts. We
also hypothesize that there would be a spatial shift in space use by leopards between the wet and dry seasons,
leading to increased likelihood of conflicts during the dry season. We further hypothesize that leopards should
exhibit temporal partitioning of activity based on human activity periods to minimize interactions with humans.
Results
Home ranges of radio‑collared leopards. After being collared, two leopards (26,283 and 26,284) exhib-
ited dispersal movement patterns for several weeks before establishing a home range, and all locations collected
during these exploratory periods were removed prior to home range estimation, movement, and resource selec-
tion analyses. Four leopards were considered for the wet season analyses, 26,279 had no locations for the wet
season whereas 32,692 was discarded since it had only 20 locations during this season. For the dry season analy-
ses, five leopards were considered; 32,694 was discarded since it had no locations during this season. Figure 1
shows a visualization of the movement track of sub-adult female leopard 26,277 within different habitat types.
A total of 6094 locations from Dec 2017 to April 2020 for 6 leopards were available for the analyses. The
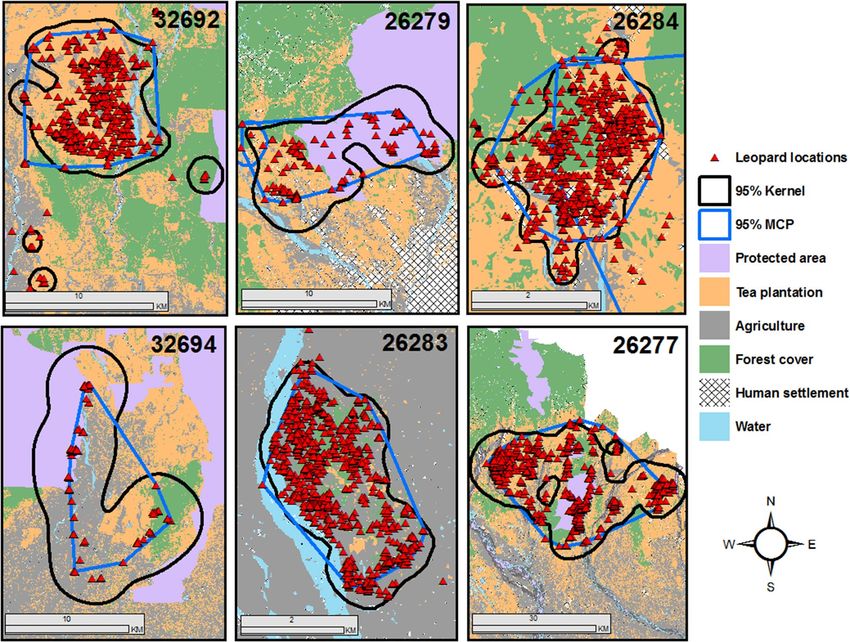
average home range size as measured by the 95% MCPs for the collared leopards was 177.47 km2 (SD = 324.21)
whereas 95% FK home ranges were 212.04 k m2 (SD = 351.49) (Table 1, Fig. 2). The average core area of leopards
(50% FK) was estimated to be 36.66 k m2 (SD = 53.87). The average home range (95% MCP) during wet season
was 104.85 k m2 (SD = 155.03) whereas 95% FK home ranges were 146.02 k m2 (SD = 188.16). Average home
range (95% MCP) during dry season was 218.51 k m2 (SD = 358.17) whereas 95% FK home ranges were 275.19
km2 (SD = 438.88).
Leopard movement and speed within different land use types. Distribution of leopard locations
differed significantly across the five habitat types (χ2 = 77.2, df = 4, p < 0.001). Leopards preferred tea plantations
(52%) followed by agriculture fields (24%), forest patches (14%), protected areas (8%), and human settlements
(2%). On an average, leopards moved at a speed of 0.229 km/hr (SD = 0.40), although there was no significant
variation between habitat types (χ2 = 0.94, df = 4, p = 0.92). Leopards moved at an average speed of 0.59 km/hr
(SD = 1.36) through tea plantations, followed by protected areas 0.20 km/hr (SD = 0.34), forest patches 0.13 km/
hr (SD = 0.55), agriculture 0.10 km/hr (SD = 0.21) and human settlements 0.03 km/hr (SD = 0.077). Eighty-per-
cent of the fixes within tea plantations were located within a distance of 100 m, whereas for human habitation,
35% of the fixes were in close proximity (i.e. 200 m of settlements). Around 65% of the fixes were also located
within a close proximity (i.e. 200 m) of agriculture fields. Only 19% of the fixes were located within a proximity
of 1000 m from protected areas. The average distance moved by leopards per day was estimated to be 0.75 km
(SD = 0.71, Range 1.28–0.52). 32,692 adult male travelled the highest average distance per day among the col-
lared leopards.
Scientific Reports | (2021) 11:3862 | https://doi.org/10.1038/s41598-021-83262-5 2
Vol:.(1234567890)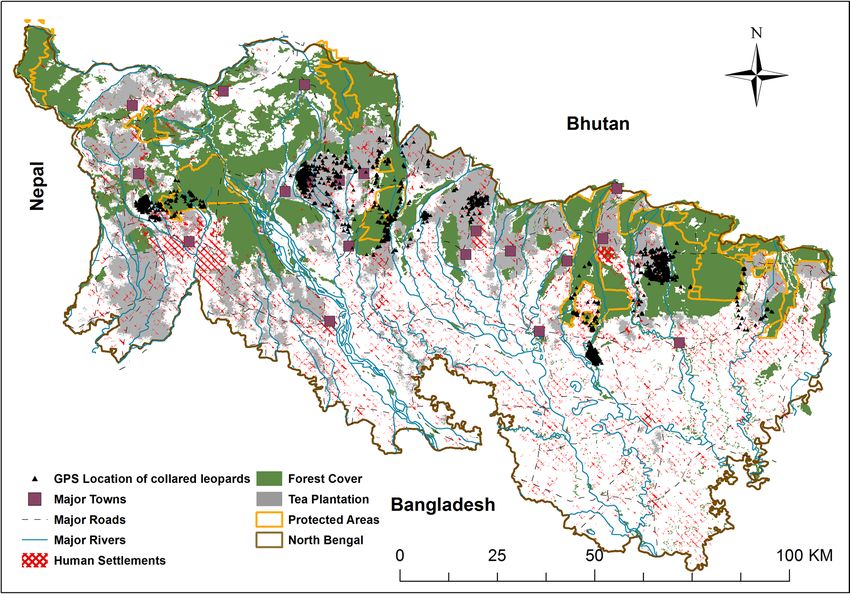
www.nature.com/scientificreports/
Figure 1. Movement track from Global Positioning System (GPS) data of one sub-adult female leopard
(26,277) within different habitat types.
Numbers of
Individuals 95% MCP ( km2) 95% FK (km2) 50% MCP ( km2) 50% FK (km2) Duration locations
26,283 (Sub-adult December 2017–
7.99 9.09 3.12 2.41 1490
Male) January 2018
January–March
26,279 (Adult Male) 62.44 87.08 15.85 14.01 336
2018
26,284 (Adult January–August
6.78 7.08 2.10 1.51 1326
Female) 2018
26,277 (Sub Adult August 2019–
836.09 919.73 447.44 142.49 1864
Female) March 2020
October 2019–
32,694 (Adult Male) 75.28 162.23 45.74 41.80 151
March 2020
August 2019–Octo-
32,692 (Male) 76.26 87.05 22.89 17.68 863
ber 2020
Average HR 177.47 212.04 89.52 36.66 1005
SD 324.21 351.49 176.07 53.87 674.26
Table 1. Individual leopard home ranges from North Bengal, India, including 95% and 50% minimum convex
polygon (MCP) estimations, and 95% and 50% fixed kernel (FK) estimations.
Movement behavior. Our dynamic programming algorithm identified two behavioral states exhibited by
leopards based on the 4-h time scale data. We identified 2 behavioral states, one stationary behavior ‘resting’
indicative of resting and/or foraging and ‘travelling’ behavior indicative of long, straight movements with high
acceleration. However, due to the coarse nature of the data (i.e. moderate temporal scale) we don’t consider the
range of behaviors the individual leopards might have engaged in between sampled locations.
Scientific Reports | (2021) 11:3862 | https://doi.org/10.1038/s41598-021-83262-5 3
Vol.:(0123456789)www.nature.com/scientificreports/
Figure 2. Home ranges of radio-collared leopards in North Bengal prepared using Arc GIS 10.3 (https://enter
prise.arcgis.com/en/portal/10.3/use/link-to-items.htm).
Mean step length and turn angle (radians) during stationary ‘resting’ phase/behavior was estimated to be
0.01 km (SD = 0.01) and − 0.07 (SD 2.02) whereas for movement ‘travelling’ behavior it was 1.20 km (SD = 1.53)
and − 0.06 (SD = 1.97) (Supplementary Table S1, Supplementary Figure S1, S2, S3).
Season. During the wet season when human-leopard conflicts are low, leopards showed preference for areas
in the vicinity of roads, protected areas, rivers, tea plantations, and forests but avoided human settlements (Sup-
plementary Table S2). The three top ranked models included 99% of the model weight (Table 2, Fig. 3A). Leop-
ards selected sites closer to roads, protected areas, rivers, tea plantations, and forests while resting during the
wet season but avoided human settlements (Table 2). The three top ranked models included 100% of the model
weight (Table 2). While travelling during the wet season leopards preferred areas near roads, protected areas,
rivers, and tea plantations but avoided settlements. The three top ranked models included 72% of the model
weight (Table 2).
During the dry season, leopards selected sites closer to tea plantations and forests but avoided protected areas
(Supplementary Table S3). The three top ranked models included 60% of the model weight (Table 2, Fig. 3B).
While resting during the dry season leopards preferred areas near rivers, tea plantations, and forests but avoided
protected areas. The three top ranked models included 52% of the model weight (Table 2). However, while travel-
ling through the landscape during the dry season, leopards selected areas closer to roads, tea plantations, and
forests and avoided human settlements. The three top ranked models included 79% of the model weight (Table 2).
Human activity. During low human activity period (10 PM–6 AM) when risk of encountering humans was
low, leopards selected habitats close to roads, rivers, tea plantations, and forests (Supplementary Table S4). The
three top-ranked models contained 45% of the model weight (Table 3, Fig. 4). During moderate human activity
period (6 AM–10 AM & 6 PM–10 PM), when risk of encountering humans were intermediate leopards preferred
habitats close to roads, rivers, and tea plantations but avoided human settlements (Supplementary Table S5). The
three top ranked models contained 58% of the model weight (Table 3, Fig. 4). During the high human activity
period (10 AM–6 PM), leopards selected habitats close to roads, rivers, and tea plantations but avoided human
settlements (Supplementary Table S6). The three top ranked models contained 88% of the model weight (Table 3,
Scientific Reports | (2021) 11:3862 | https://doi.org/10.1038/s41598-021-83262-5 4
Vol:.(1234567890)www.nature.com/scientificreports/
Model AICc ΔAICc wi LL
Wet Season
Dist. Forest + Dist. PAs + Dist. Road + Dist. River + Dist. Settlement + Dist. Tea plantation 5625.59 0.00 0.88 − 2804.78
Dist. PAs + Dist. Road + Dist. River + Dist. Settlement + Dist. Tea plantation 5630.06 4.46 0.09 − 2808.02
Dist. Forest + Dist. PAs + Dist. Road + Dist. River + Dist. Tea plantation 5632.86 7.26 0.02 − 2809.42
Dry Season
Dist. Forest + Dist. PAs + Dist. Road + Dist. River + Dist. Tea plantation 10,726.02 0.00 0.24 − 5356.01
Dist. Forest + Dist. PAs + Dist. River + Dist. Tea plantation 10,726.29 0.27 0.21 − 5357.14
Dist. Forest + Dist. PAs + Dist. Tea plantation 10,727.04 1.01 0.15 − 5358.51
Dist. Forest + Dist. PAs + Dist. Road + Dist. Tea plantation 10,727.30 1.25 0.14 − 5357.63
Dist. Forest + Dist. PAs + Dist. Road + Dist. River + Dist. Settlement + Dist. Tea plantation 10,728.00 2.00 0.10 − 5356.01
Wet State 1
Dist. Forest + Dist. PAs + Dist. Road + Dist. River + Dist. Settlement + Dist. Tea plantation 3003.88 0.00 0.82 − 1493.92
Dist. PAs + Dist. Road + Dist. River + Dist. Settlement + Dist. Tea plantation 3006.88 3.00 0.18 − 1496.42
Dist. Forest + Dist. PAs + Dist. road + Dist. river + Dist. Tea plantation 3018.36 14.47 0.00 − 1502.16
Wet State 2
Dist. PAs + Dist. Road + Dist. River + Dist. Settlement + Dist. Tea plantation 4561.68 0.00 0.35 − 2273.82
Dist. Forest + Dist. PAs + Dist. Road + Dist. River + Dist. Settlement + Dist. Tea plantation 4562.47 0.79 0.24 − 2273.21
Dist. Forest + Dist. PAs + Dist. Road + Dist. River + Dist. Tea plantation 4563.71 2.03 0.13 − 2274.84
Dry State 1
Dist. Forest + Dist. PAs + Dist. River + Dist. Settlement + Dist. Tea plantation 5771.16 0.00 0.24 − 2878.57
Dist. Forest + Dist. PAs + Dist. River + Dist. Tea plantation 5772.04 0.87 0.17 − 2880.01
Dist. Forest + Dist. PAs + Dist. Road + Dist. River + Dist. Settlement + Dist. Tea plantation 5772.67 1.51 0.11 − 2878.32
Dry State 2
Dist. Forest + Dist. PAs + Dist. Road + Dist. Tea plantation 8689.26 0.00 0.34 − 4338.62
Dist. Forest + Dist. PAs + Dist. Road + Dist. River + Dist. Tea plantation 8689.51 0.26 0.30 − 4337.75
Dist. Forest + Dist. PAs + Dist. Road + Dist. settlement + Dist. Tea plantation 8690.91 1.66 0.15 − 4338.45
Dist. Forest + Dist. PAs + Dist. Road + Dist. River + Dist. settlement + Dist. Tea plantation 8691.20 1.96 0.13 − 4337.60
Table 2. Model selection results relating leopard resource selection during the wet (June–October) and dry
(November–May) seasons to predictor variables for leopards tracked with GPS collars in North Bengal, India
from 2017 to 2020. State 1 represents resting locations whereas state 2 represents travelling locations. *Dist.-
Distance to. *PAs- Protected Areas.
Fig. 4). While resting (State 1, (Supplementary Table S7) and travelling (State 2, Supplementary Table S7) during
low, moderate and high human activity periods leopards preferred sites close to roads, rivers, forests, tea planta-
tions but avoided human settlements. After accounting for the effect of individual leopards as a random error,
we found significant effect of time (estimate: 0.70, SE = 0.02, p < 0.001) but not season (estimate: − 0.03, SE = 0.03,
p = 0.24) on leopard movement.
Discussion
Our study integrated animal locations, remote sensing, and statistical modelling to make inferences regarding
the ecological and anthropogenic attributes influencing leopard movement behavior and habitat selection within
a human-dominated landscape of South Asia. Our primary focus was to assess how leopards use mixed land-
scapes during two seasons (dry and wet) and periods of human activity (low, medium, high), and its relevance to
human-leopard conflicts in the North Bengal region of India. We identified two major behavioral states (resting
and travelling) for the collared leopards. Our results support the first two hypotheses regarding preferential use
of anthropogenic habitats and seasonal variation in space use by leopards. We found the majority of leopard
locations occurred within close proximity to tea plantations. Resource selection was strongly governed by pres-
ence of vegetation cover, proximity to water and avoidance of human settlements. During the dry season when
human-leopard conflicts are h igh36,37, leopards actively selected tea plantations and forest patches but avoided
protected areas. However, during the wet season, leopards showed preference for forested patches, protected
areas, riverine patches, roads, and tea plantations, and avoided settlements. Our 3rd hypothesis was rejected as
there was no temporal partitioning between leopards and humans. Leopards showed a preference for sites in
close proximity to roads, rivers and tea plantations during periods of moderate and high human activity. Our
overall results indicate that there was no spatial–temporal avoidance of humans by leopards, which likely is the
major driver of conflicts in the North Bengal landscape. However, there is limited data availability on the spac-
ing and resource selection patterns of leopards that were not radio-tagged in the landscape and hence all results
regarding overall habitat use should be interpreted with caution.
The average home range size of collared leopards in our study (177.47 km2) was much larger than the previ-
ous estimates reported from other Asian landscapes such as India, N epal17,39 and Iran40. However, there was also
Scientific Reports | (2021) 11:3862 | https://doi.org/10.1038/s41598-021-83262-5 5
Vol.:(0123456789)www.nature.com/scientificreports/
Figure 3. (A) Parameter estimates for step-selection function analyses conducted at the 4-h timescale for radio-
collared leopards. Results of the three top ranked models conducted on different behavioral subsets within wet
season are shown in different colors. (B) Parameter estimates for step-selection function analyses conducted
at the 4-h timescale for radio-collared leopards. Results of the three top ranked models conducted on different
behavioral subsets within dry season are shown in different colors.
Scientific Reports | (2021) 11:3862 | https://doi.org/10.1038/s41598-021-83262-5 6
Vol:.(1234567890)www.nature.com/scientificreports/
Figure 3. (continued)
considerable variation in size of home ranges with the lowest being 6.78 km2 and the highest being 836 km2. The
sub-adult leopardess 26,277 had the largest home range as she traversed vast areas between protected areas, tea
plantations, crop fields and settlements from the western to the eastern part of the landscape. Home range sizes
are an artifact of the spatial distribution and abundance of wild p rey41,42. The smallest leopard home ranges are
39
reported from the alluvial flood plains of N epal and eastern, southern A frica43,44 where there is abundance of
wild prey, whereas the largest reported home ranges prior to this study (103 k m2) were reported from Iran40.
The interplay between human, animal behavior, activity patterns and resource use has often been regarded
as a major driver of human-carnivore c onflicts4. Within shared landscapes where density of humans is high,
some overlap is expected as complete avoidance between humans, livestock and carnivores is not possible.
Leopards showed flexibility in using anthropogenic areas and preferred a matrix of both open and closed habi-
tats. Carnivores are expected to move faster and straighter within anthropogenic landscapes13,45. Our collared
leopards exhibited no significant variation in speed while travelling across habitat types such as tea plantations,
crop fields, settlements, forests and protected areas. Though human settlement areas provide easy prey such as
unattended livestock, domestic dogs46,47 there was no major variation in movement within this habitat. There
was similarity in the relationship between the seasonal use of sites with close proximity to tea plantations, rivers,
and avoidance of settlements across both the behavioral states. While moving and resting, leopards preferred
habitats with vegetation cover and water, but avoided areas close to human settlements. Such results indicate
there was an avoidance of sites with absence of crop cover such as settlements, which seems to be an artifact
of their perception of risk (landscape of fear)48. Though leopards are the most adaptive large felid37, they also
exhibit fear of human presence and hence avoid settlements. Our findings are similar to a global study on move-
ment behavior of a diversity of large m ammals49. Cheetahs and lions also avoided areas with increased human
disturbance in Kenya14,50, which suggests human presence and disturbance can have a negative influence on the
movement behavior of large carnivores.
Our data were limited to a four-hour collection interval, and thus we were unable to distinguish between
resting and feeding behaviors within our stationary state, although given the foraging behavior of leopards the
majority of stationary locations likely reflected resting behavior.
Large carnivores generally prefer areas with dense to moderate vegetation cover to avoid threats from co-
predators and h umans14,31,33,51. Though leopards are considered to be habitat g eneralists45, they are reported to
exhibit preference for landscape features which provide concealment within human-dominated landscapes52,53.
Scientific Reports | (2021) 11:3862 | https://doi.org/10.1038/s41598-021-83262-5 7
Vol.:(0123456789)www.nature.com/scientificreports/
Model AICc ΔAICc wi LL
Low Human Activity
Dist. Forest + Dist. Road + Dist. River + Dist. Tea 5019.539 0 0.210983 − 2503.76
Dist. Forest + Dist. Road + Dist. River + Dist. Settlement + Dist. Tea plantation 5020.246 0.707 0.148 − 2503.11
Dist. Forest + Dist. PAs + Dist. road + Dist. River + Dist. Tea plantations 5021.231 1.692 0.091 − 2503.60
Dist. Forest + Dist. River + Dist. Tea plantations 5021.50 1.93 0.12 − 2505.73
Dist. Forest + Dist. Road + Dist. Tea plantations 5021.50 1.99 0.12 − 2505.76
Moderate Human Activity
Dist. Forest + Dist. Road + Dist. River + Dist. Settlement + Dist. Tea plantation 6018.842 0 0.285 − 3002.41
Dist. Road + Dist. River + Dist. Settlement + Dist. Tea plantation 6019.798 0.956 0.177 − 3003.89
Dist. Forest + Dist. PAs + Dist. Road + Dist. Settlement + Dist. Tea plantation 6020.488 1.645 0.125 − 3002.23
High Human Activity
Dist. Road + Dist. River + Dist. Settlement + Dist. Tea plantation 4682.584 0 0.482 − 2335.28
Dist. Forest + Dist. Road + Dist. River + Dist. settlement + Dist. Tea plantation 4684.121 1.537 0.224 − 2335.04
Dist. PAs + Dist. Road + Dist. River + Dist. Settlement + Dist. Tea plantation 4684.586 2.001 0.177 − 2335.28
Low State 1
Dist. Forest + Dist. Road + Dist. River + Dist. Settlement + Dist. Tea plantation 2168.231 0 0.277 − 1077.09
Dist. Forest + Dist. Road + Dist. River + Dist. Tea plantation 2168.526 0.295 0.239 − 1078.24
Dist. Forest + Dist. PAs + Dist. Road + Dist. River + Dist. Settlement + Dist. Tea plantation 2169.68 1.449 0.135 − 1076.81
Dist. Forest + Dist. PAs + Dist. Road + Dist. River + Dist. Tea plantation 2170.00 1.75 0.13 − 1077.96
Low State 2
Dist. Forest + Dist. Road + Dist. Tea plantation 4367.119 0 0.128 − 2178.55
Dist. Forest + Dist. Tea plantation 4367.322 0.203 0.116 − 2179.65
Dist. Forest + Dist. PAs + Dist. Tea plantation 4367.717 0.597 0.095 − 2178.85
Dist. Forest + Dist. Road + Dist. River + Dist. Tea plantation 4367.80 0.66 0.09 − 2177.87
Dist. Forest + Dist. PAs + Dist. Road + Dist. Tea plantation 4368.00 0.85 0.08 − 2177.97
Dist. Forest + Dist. River + Dist. Tea plantation 4368.40 1.26 0.07 − 2179.18
Dist. Forest + Dist. PAs + Dist. Road + Dist. River 4368.70 1.60 0.06 − 2177.34
Dist. Forest + Dist. PAs + Dist. River + Dist. Tea plantation 4368.80 1.71 0.06 − 2178.40
Dist. Forest + Dist. Road + Dist. Settlement + Dist. Tea plantation 4368.90 1.76 0.05 − 2178.43
Moderate State 1
Dist. Road + Dist. River + Dist. Settlement + Dist. Tea plantation 3566.103 0 0.296 − 1777.04
Dist. Forest + Dist. Road + Dist. River + Dist. Settlement + Dist. Tea plantation 3566.165 0.061 0.287 − 1776.06
Dist. PAs + Dist. Road + Dist. River + Dist. Settlement + Dist. Tea plantation 3567.918 1.814 0.119 − 1776.94
Moderate State 2
Dist. Road + Dist. River + Dist. Settlement + Dist. Tea plantation 4652.433 0 0.163 − 2320.2
Dist. Road + Dist. Settlement + Dist. Tea plantation 4652.604 0.171 0.150 − 2321.29
Dist. Forest + Dist. Road + Dist. River + Dist. Settlement + Dist. Tea plantation 4653.897 1.465 0.078 − 2319.93
Dist. Road + Dist. Tea plantation 4654.00 1.54 0.13 − 2322.98
Dist. PAs + Dist. Road + Dist. River + Dist. Settlement + Dist. Tea plantation 4654.30 1.85 0.11 − 2320.13
Dist. Forest + Dist. Road + Dist. Settlement + Dist. Tea plantation 4654.30 1.87 0.06 − 2321.14
Dist. Forest + Dist. Road + Dist. River + Dist. Tea plantation 4654.30 1.89 0.06 − 2321.15
High State 1
Dist. Road + Dist. River + Dist. Settlement + Dist. Tea plantation 2737.66 0 0.472 − 1362.81
Dist. Forest + Dist. Road + Dist. River + Dist. Settlement + Dist. Tea plantation 2739.228 1.567 0.216 − 1362.59
Dist. PAs + Dist. Road + Dist. River + Dist. Settlement + Dist. Tea plantation 2739.326 1.665 0.205 − 1362.64
High State 2
Dist. Road + Dist. River + Dist. Settlement + Dist. Tea plantation 3803.657 0 0.375 − 1895.81
Dist. Forest + Dist. Road + Dist. River + Dist. Settlement + Dist. Tea plantation 3805.121 1.464 0.181 − 1895.54
Dist. PAs + Dist. Road + Dist. River + Dist. Settlement + Dist. Tea plantation 3805.583 1.925 0.143 − 1895.77
Table 3. Model selection results relating leopard resource selection during periods of low, moderate, and high
human activity to predictor variables based on leopards tracked with GPS collars in North Bengal, India from
2017 to 2020. State 1 represents resting locations whereas state 2 represents travelling locations.
Scientific Reports | (2021) 11:3862 | https://doi.org/10.1038/s41598-021-83262-5 8
Vol:.(1234567890)www.nature.com/scientificreports/
Figure 4. Parameter estimates for step-selection function analyses conducted at the 4-h timescale for radio-
collared leopards. Results of the three top ranked models conducted on different behavioral subsets in relation
to human activity periods (low, medium, high) are shown in different colors.
Tea plantations and riverine habitats are interspersed between protected areas, crop fields and forest patches and
provide cover within a human-dominated landscape.
Our earlier study findings highlight that leopards attacked humans and livestock in North Bengal primarily
during the dry season36,37. During the dry season, tea laborers work intensively within the gardens and engage in
various activities which includes plucking of leaves, pesticide control, sprinkling of water, removal of old growth/
mature stands and adding fertilizer to the plants36. Livestock density was fairly high with an average density of
340 animals/km2 and leopard diet was also reported to be primarily comprised of livestock in this r egion47. Data
on wild prey availability within the landscape was extremely limited in nature and hence the results concerning
resource selection by leopards should be interpreted with caution. Assessing seasonal abundance of wild prey,
livestock, dogs, and rodents within tea plantations, riverine and forest patches will be an important topic for
future research efforts in this landscape.
Our generalized linear mixed model results suggested there was significant variation in leopard movement
behavior between night and day. Leopards utilized high risk (conflict prone) areas such as tea plantations during
all time periods but avoided settlements especially during moderate and high human activity (8 AM–4 PM).
Leopard attacks on humans and livestock often occur within or near tea plantations in our study area, typically
during the day when workers are present within the gardens with peak attacks between (8 AM–4 PM). Attacks
also are higher in areas with a matrix of open habitats and vegetation cover36,37, suggesting humans may be
incidentally encountering resting leopards when working in tea plantations. Carnivores optimize their behavior
based on the risk of mortality from other predators and h umans54,55. In Tanzania where risk of mortality was low,
lions were attracted to multiple-use areas outside protected reserves due to presence of wild pigs (Sus scrofa),
resulting in attacks on humans at n ight56. However, in Kenya where risk of persecution by humans was high,
lions avoided areas close to settlements, water, and pastoral lands, and used dense vegetation cover during high
human activity p eriods13,14,57. In the Sundarban delta where risk of persecution was negligible, tiger attacks on
humans were documented to be seasonal and diurnal, and coincided with the activity patterns of honey collectors
and fishermen33. In central India and Terai region of Nepal, there was no seasonal variation in leopard attacks
Scientific Reports | (2021) 11:3862 | https://doi.org/10.1038/s41598-021-83262-5 9
Vol.:(0123456789)www.nature.com/scientificreports/
Figure 5. Location of North Bengal within India along with gps fixes of collared leopards, protected areas,
major roads, towns, rivers, human settlements, tea plantations and forest cover prepared using Arc GIS 10.3
(https://enterprise.arcgis.com/en/portal/10.3/use/link-to-items.htm).
on humans and the majority occurred near forest edges at the interface of human and carnivore activity58,59.
Similarly, in Thailand and Nepal, leopards avoided areas of human disturbance such as roads during the d ay60,61.
Within a multiple-used landscape of Northern Kenya, leopards avoided areas close to roads and human pres-
ence during the day and used vegetation cover for c oncealment53. The only radio-telemetry study from India
documented that leopards avoided areas of high human presence during the day but were close to settlements
during night in search of domestic dogs and unsupervised l ivestock17.
We acknowledge some limitations of our study such as the low sample size and the coarse 4-h duration of fixes.
However, this is the first detailed radio-telemetry study on the movement behavior and space use by leopards
in South Asia, and thus provides unique insights into the behavioral strategies employed by leopards to access
resources within a heterogeneous shared landscape of eastern India and its implications for mitigation of human-
leopard conflicts. Our results demonstrate that there were spatial–temporal overlaps in activity and resource
selection by leopards and humans. Leopards didn’t exhibit complete avoidance of anthropogenic areas and pre-
ferred tea plantations. Due to a strong cultural reverence towards wildlife, there was low risk of persecution by
humans in this landscape. Unlike other large carnivores, leopards showed behavioral adjustments and selected
for areas with vegetation cover within the fragmented, multiple-use North Bengal landscape. A combination
of reduced movement and concealment during high to moderate human activity periods allowed leopards to
remain undetected. However, such behavioral and landscape related preference in space use and activity could
be the major driver of human-leopard conflicts in this region. With increasing incidents of attacks on tea estate
workers and predation on livestock every year, the costs of co-existence with leopards are high. Prolonged costs
of damage would reduce cultural tolerance leading to retaliation against leopards.
Hence necessary measures such as development of early warning systems through digital-geo fencing of
conflict prone areas, real time GPS tracking of leopards and livestock, modifying behavior of tea estate work-
ers through conservation outreach programs, use of non-lethal carnivore deterrents and recognizing costs of
coexistence with large carnivores should be initiated within conflict hotspots. Animal husbandry practices such
as supervised grazing of livestock should be adopted, use of protective collars and knowledge of habitats pre-
ferred by leopards should be discussed and community members should be engaged as leopard custodians to
monitor carnivore presence around settlements. Further research should be undertaken to understand fine scale
behavioral response of leopards within anthropogenic habitats and protected areas, the impact of appropriate
herding practices, and the efficacy of conservation outreach programs on reducing livestock losses and attacks
Scientific Reports | (2021) 11:3862 | https://doi.org/10.1038/s41598-021-83262-5 10
Vol:.(1234567890)www.nature.com/scientificreports/
on humans. Finally, recognizing the importance of shared landscapes in sustaining large carnivore populations
is crucial to ensure coexistence as human expansion and activities continue to modify habitats within develop-
ing regions of South Asia.
Methods
Study area. The study was conducted within the human-dominated North Bengal landscape in eastern
India (Fig. 5). The study area (12,500 km2) included both wildlife and non-wildlife areas. The areas allocated
for wildlife included protected areas such as Buxa National Park (761 km2), Jaldapara National Park (217 km2),
Gorumara National Park (80 km2), Chapramari Wildlife Sanctuary (9.5 km2), and Mahananda Wildlife Sanctu-
ary (158 km2)62, as well as reserve forests. The human-use areas included tea plantations, agriculture fields, and
human settlements. The protected areas were not fenced and hence wild animals could roam freely between
protected and non-wildlife areas. The landscape matrix of this region was comprised of forests, agricultural
fields, tea plantations, river beds, and human settlements interspersed with protected a reas63. The region was
comprised of 46% forest cover, with moist tropical or sub-tropical forests comprising the predominant forest
types along the foothills of the Eastern Himalayas. This region is part of the Terai-Duars belt, which historically
was a contiguous forest patch extending from Nepal in the west to Bhutan and Assam hills in the east.
The average human density ranges between 200 and 700 individuals per km2 (Census of India 2011, Accessed
May 2020). Tribal communities such as Oraon, Munda, Santhals, Bhutia, Rajbanshi and other ethnic groups such
as Gorkha, Bengali inhabit this region. Local community members possess livestock and stay within settlements
close to forested regions and protected areas. The average livestock density is 340 animals per k m2. Primary
occupations are in agriculture, livestock rearing, daily labors, and tea estates. Tribal community members are
engaged as tea estate workers. The tea estates are government lands leased to private companies. These private
companies manage the plantations, provide employment to the local communities, and share a small portion
of the revenue with the government. The village lands are managed by the local community heads (gram pan-
chayat), whereas settlements close to the protected areas are managed by the forest and wildlife staff. This region
is characterized by an annual rainfall range of 1200–3200 mm with 3 distinct seasons i.e. summer (March–June),
monsoon (July–October), and winter (November–February). Summer and winter are dry, with the maximum
rainfall received during the monsoon season. Thus, we considered two major seasons i.e. dry (summer and
winter) and wet (monsoon) for our analyses.
Collaring of leopards. Six leopards (1adult female, 3 adult males, 1 sub adult male, and 1 sub adult female)
were radio-collared between 2017 and 2019. The leopards were trapped in cages using bait and anesthetized
using ketamine i.e. 3 mg/kg and xylazine 2 mg/kg administered intra-muscularly using a blow gun64. We used
live goats to lure leopards towards the cages and all leopard trapping and captures occurred in human-domi-
nated landscapes such as villages and tea plantations within close proximity to protected areas. Animal capture
was conducted in collaboration with the Wildlife Wing, Govt. of West Bengal who provided necessary permis-
sion and logistic support. All procedures for radio collaring were performed by an experienced veterinarian in
collaboration with the wildlife officials. Ethical clearance was sough and studies were performed in accordance
with the relevant guidelines and regulations, reviewed and approved by the Wildlife Wing, Govt. of West Bengal
(Permit No. 1251/WL/2 W-679/2017 dated 09 March 2017). The leopards were aged based on tooth eruption
and wear patterns, development of secondary sexual characters, and genital organs. All leopards were fitted
with VERTEX PLUS IRIDIUM GPS collars provided by Vectronic Aerospace (Berlin, Germany). The gps col-
lars weighed less than 1–2% of the body weight of leopards irrespective of the sex. Collars were programmed
to record fixes every 4 h and were equipped with a vhf beacon which facilitated ground tracking of the animals
(1–13 months). The study was carried out in compliance with the ARRIVE Guidelines.
Data analysis. Home ranges. We cleaned GPS data to exclude spurious locations by mapping the GPS data
within ArcMap 10.7.1 (ESRI, 2019) and removing points outside of the study area. We estimated leopard home
ranges using Fixed kernel density estimations (KDE) where we extracted 95% and 50% utilization distributions
using the ‘adehabitatHR’ package in program R 65, using a reference bandwidth reduced to a fixed proportion of
0.80 in an effort to reduce over-smoothing66. In addition, we quantified 95% minimum convex polygon (MCP)
home ranges (calculating overall, wet, and dry season home ranges for each individual) for use in resource selec-
tion modelling67 (Table 1).
Movement behavior. To assess the relationship between leopard movement patterns and anthropogenic land
use features, we extracted step lengths, turn angles, and movement states for each leopard location using the
‘moveHMM’ package in program R68,69. We calculated the average distance by adding all hourly displacements
per day for all individual leopards. Speed of leopard movement was estimated as the distance between consecu-
tive fixes divided by time (km/hr). We tested for a variation in speed among the leopards monitored in response
to different situations of risk by comparing speed values among different land-use categories. We compared the
results of 25 Hidden Markov Models (HMM), each with randomly generated starting parameters of step lengths
and turn angles for each behavioral state, to designate starting parameters that would maximize the log-likeli-
hood of each behavioral state and to assess numerical stability of the models68. Because our data were restricted
to a four-hour interval between leopard locations, we developed a single HMM incorporating two behavioral
states (i.e. stationary and travelling) as it was impractical to tease out additional behavioral states given the reso-
lution of our data. We extracted movement states using the Viterbi algorithm to generate the most likely state
associated with each observation. After extracting movement states, we subdivided the data based on seasonal
and human activity periods of interest: (1) dry season (November–May), (2) wet season (June–October), (3) low
Scientific Reports | (2021) 11:3862 | https://doi.org/10.1038/s41598-021-83262-5 11
Vol.:(0123456789)www.nature.com/scientificreports/
human activity period (10 PM–6 AM), (4) moderate human activity period (6 AM–10 AM and 6 PM–10 PM),
and (5) high human activity period (10 AM–6 PM). To examine differences in movement patterns, we further
divided each of the above subsections of data by movement state, for a total of 10 subsections of data. We also
calculated average movement rates for individual leopards based on distances between consecutive locations, as
well as average movement rates within each main habitat type across all individuals. Day and Night were defined
as even hour periods (6 AM–6 PM, day) and (6 PM–6 AM, night). Movement of leopards could vary between
seasons and time of the day. We analyzed distance moved by individual leopards using a generalized linear
mixed model where time was considered as day and night while effect of season was considered as dry and wet.
Variation due to individual leopards were considered as a random error in the model. The analysis was done in
70.
R using the function ‘glmer’ within the package ‘lme4′ in R
Resource selection. We calculated the proportion of leopard locations in relation to the proximity of gps fixes
from different habitats using Arc Map. To investigate whether leopards avoided anthropogenic areas compared
to forested and protected habitats, we constructed resource selection functions (RSF) at the home range scale
(third order)71 by comparing habitat use (estimated from the observed leopard location data) to habitat availabil-
ity (estimated through randomly generated locations within leopard home ranges). Habitat use analysis incorpo-
rated availability and usage of each habitat type by collared leopards. We conducted separate RSF analyses based
on the subsections of data outlined previously: (1) dry season, (2) wet season, (3) low human activity periods,
(4) moderate human activity periods, and (5) high human activity periods. We generated random points within
each leopard’s MCP home range using the ‘spsample’ function in the ‘sp’ package in program R72. Each leopard’s
overall home range was used as the boundary to generate random points for each of the human activity RSF sub-
sets, whereas the dry and wet season home ranges of each leopard were used as the boundary for those respective
subsets. The number of random points generated was equal to the number of observed leopard locations within
each subsection of data, resulting in an equal number of used and available locations for each RSF. To examine
associations between leopard habitat use and movement behavior, each of the above subsections of data was
further divided by movement state for each RSF.
For each used and random location, we quantified the distance to tea plantations, forests, agriculture and
human settlements using the land use type map of North B engal63. Since collared leopards occupied flatlands
we didn’t consider altitude, slope or terrain ruggedness as a predictor variable for the resource selection analy-
sis. There was also limited data availability on terrain ruggedness for the landscape. We calculated distance to
protected areas using the Protected Area Network of India. Distance to rivers and roads were calculated using
the Roads and Drainage layers obtained from Digital Chart of the World. We extracted distance covariates using
the ‘near’ function within ArcMap 10.7.173. All these variables were log transformed and standardized using z
score values with a mean of 0 and a standard deviation of 1. Variables were tested for correlations using Pearson
correlation coefficients and the ‘distance to agriculture’ variable was removed because it was correlated (0.67)
with ‘distance to human settlement’74 (Supplementary Table S8).
We generated RSFs by constructing generalized linear mixed-effect models with individual leopards as a
random effect using the ‘glmer’ function within the ‘lme4′ package in program R 70. We developed a global model
incorporating all habitat variables as well as all possible combinations of variables, and selected the best model
based on lowest Akaike information criteria corrected for small sample sizes ( AICc)75.
Received: 8 July 2020; Accepted: 1 February 2021
References
1. Ripple, W. J. et al. Status and ecological effects of the world’s largest carnivores. Science 343, 1241484 (2014).
2. Macdonald, E. A. et al. Conservation inequality and the charismatic cat: Felis felicis. Glob. Ecol. Conserv. 3, 851–866 (2015).
3. Carter, N. H. & Linnell, J. D. C. Co-adaptation is key to coexisting with large carnivores. Trends. Ecol. Evol. 31, 575–578 (2016).
4. Inskip, C. & Zimmermann, A. Human-felid conflict: a review of patterns and priorities worldwide. Oryx 43, 18–34 (2009).
5. Macdonald, D. W., Mosser, A. & Gittleman, J. L. Felid society. In Biology and Conservation of Wild Felids (eds Macdonald, D. W.
& Loveridge, A. J.) 125–160 (Oxford University Press, Oxford, 2010).
6. Treves, A. & Karanth, K. U. Human-carnivore conflict and perspectives on carnivore management worldwide. Conserv. Biol. 17,
1491–1499 (2003).
7. Lute, M. L., Carter, N. H., López-Bao, J. V. & Linnell, J. D. C. Conservation professionals agree on challenges to coexisting with
large carnivores but not on solutions. Biol. Conserv. 218, 223–232 (2018).
8. Chapron, G. et al. Recovery of large carnivores in Europe’s modern human-dominated landscapes. Science 346, 1517–1519 (2014).
9. Van der Meer, E., Fritz, H., Blinston, P. & Rasmussen, G. S. A. Ecological trap in the buffer zone of a protected area: effects of
indirect anthropogenic mortality on the African wild dog (Lycaon pictus). Oryx 48, 285–293 (2014).
10. Khorozyan, I., Ghoddousi, A., Soofi, M. & Waltert, M. Big cats kill more livestock when wild prey reaches a minimum threshold.
Biol. Conserv. 192, 268–275 (2015).
11. Cozzi, G. et al. Anthropogenic food resources foster the coexistence of distinct life history strategies: year-round sedentary and
migratory brown bears. J. Zool. 300, 142–150 (2016).
12. Schuette, P., Wagner, A. P., Wagner, M. E. & Creel, S. Occupancy patterns and niche partitioning within a diverse carnivore com-
munity exposed to anthropogenic pressures. Biol. Conserv. 158, 301–312 (2013).
13. Oriol-Cotterill, A., Macdonald, D. W., Valeix, M., Ekwanga, S. & Frank, L. G. Spatiotemporal patterns of lion space use in a human-
dominated landscape. Anim. Behav. 101, 27–39 (2015).
14. Suraci, J. P. et al. Behavior-specific habitat selection by African lions may promote their persistence in a human-dominated land-
scape. Ecology 100, 1–11 (2019).
15. Kuijper, D. P. J. et al. Paws without claws? Ecological effects of large carnivores in anthropogenic landscapes. Proc. R. Soc. B Biol.
Sci. 283, 20161625 (2016).
Scientific Reports | (2021) 11:3862 | https://doi.org/10.1038/s41598-021-83262-5 12
Vol:.(1234567890)www.nature.com/scientificreports/
16. Carter, N. H., Shrestha, B. K., Karki, J. B., Pradhan, N. M. B. & Liu, J. Coexistence between wildlife and humans at fine spatial
scales. Proc. Natl. Acad. Sci. 109, 15360–15365 (2012).
17. Odden, M., Athreya, V., Rattan, S. & Linnell, J. D. C. Adaptable neighbours: Movement patterns of GPS-collared leopards in human
dominated landscapes in India. PLoS ONE 9, .e112044. https://doi.org/10.1002/ecs2.1408 (2014).
18. Wang, Y., Allen, M. L. & Wilmers, C. C. Mesopredator spatial and temporal responses to large predators and human development
in the Santa Cruz Mountains of California. Biol. Conserv. 190, 23–33 (2015).
19. Wheat, R. E. & Wilmers, C. C. Habituation reverses fear-based ecological effects in brown bears (Ursus arctos). Ecosphere 7, (2016).
20. Gaynor, K. M., Hojnowski, C. E., Carter, N. H. & Brashares, J. S. The influence of human disturbance on wildlife nocturnality.
Science 360, 1232–1235 (2018).
21. Valeix, M. et al. How key habitat features influence large terrestrial carnivore movements: waterholes and African lions in a semi-
arid savanna of north-western Zimbabwe. Landsc. Ecol. 25, 337–351 (2010).
22. Dickson, B. G., Jenness, J. S. & Beier, P. Influence of vegetation, topography, and roads on cougar movement in southern California.
J. Wildl. Manag. 69, 264–276 (2005).
23. Elliot, N. B., Cushman, S. A., Macdonald, D. W. & Loveridge, A. J. The devil is in the dispersers: predictions of landscape con-
nectivity change with demography. J. Appl. Ecol. 51, 1169–1178 (2014).
24. Valeix, M., Hemson, G., Loveridge, A. J., Mills, G. & Macdonald, D. W. Behavioural adjustments of a large carnivore to access
secondary prey in a human-dominated landscape. J. Appl. Ecol. 49, 73–81 (2012).
25. Farhadinia, M. S. et al. Vertical relief facilitates spatial segregation of a high density large carnivore population. Oikos 129, 346–355
(2020).
26. Grant, J., Hopcraft, C., Sinclair, A. R. E. & Packer, C. Planning for success: Serengeti lions seek prey accessibility rather than
abundance. J. Anim. Ecol. 74, 559–566 (2005).
27. Laundré, J. W. & Hernández, L. Total energy budget and prey requirements of free-ranging coyotes in the Great Basin desert of
the western United States. J. Arid. Environ. 55, 675–689 (2003).
28. Miller, J. R. B., Jhala, Y. V., Jena, J. & Schmitz, O. J. Landscape-scale accessibility of livestock to tigers: implications of spatial grain
for modeling predation risk to mitigate human-carnivore conflict. Ecol. Evol. 5, 1354–1367 (2015).
29. Blake, L. W. & Gese, E. M. Resource selection by cougars: influence of behavioral state and season. J. Wildl. Manag. 80, 1205–1217
(2016).
30. Broekhuis, F., Grünewälder, S., McNutt, J. W. & Macdonald, D. W. Optimal hunting conditions drive circalunar behavior of a
diurnal carnivore. Behav. Ecol. 25, 1268–1275 (2014).
31. Klaassen, B. & Broekhuis, F. Living on the edge: multiscale habitat selection by cheetahs in a human-wildlife landscape. Ecol. Evol.
8, 7611–7623 (2018).
32. Gese, E. M. et al. Cross-fostering as a conservation tool to augment endangered carnivore populations. J. Mammal. 99, 1033–1041
(2018).
33. Naha, D. et al. Ranging, activity and habitat use by tigers in the mangrove forests of the Sundarban. PLoS ONE 11, e0152119 (2016).
34. Karanth, K. K., Nichols, J. D., Hines, J. E., Karanth, K. U. & Christensen, N. L. Patterns and determinants of mammal species
occurrence in India. J. Appl. Ecol. https://doi.org/10.1111/j.1365-2664.2009.01710.x (2009).
35. Athreya, V. et al. Spotted in the news: using media reports to examine leopard distribution, depredation, and management practices
outside protected areas in Southern India. PLoS ONE 10, e0142647 (2015).
36. Naha, D., Sathyakumar, S. & Rawat, G. S. Understanding drivers of human-leopard conflicts in the Indian Himalayan region:
spatio-temporal patterns of conflicts and perception of local communities towards conserving large carnivores. PLoS ONE 13,
1–19 (2018).
37. Jacobson, A. P. et al. Leopard (Panthera pardus) status, distribution, and the research efforts across its range. PeerJ, 4, 1–28 (2016).
38. Naha, D. et al. Landscape predictors of human-leopard conflicts within multi-use areas of the Himalayan Region. Sci. Rep. 10,
11129. https://doi.org/10.1038/s41598-020-67980-w (2020).
39. Odden, M. & Wegge, P. Spacing and activity patterns of leopards (Panthera pardus) in the Royal Bardia National Park, Nepal.
Wildl. Biol. 11, 145–152 (2005).
40. Farhadinia, M. S., Johnson, P. J., Macdonald, D. W. & Hunter, L. T. B. Anchoring and adjusting amidst humans: ranging behavior
of Persian leopards along the Iran-Turkmenistan borderland. PLoS ONE 13, e0196602 (2018).
41. Miquelle, D. G. et al. Tigers and wolves in the Russian Far East: competitive exclusion, functional redundancy and conservation
implications. In Large Carnivores and the Conservation of Biodiversity (eds Ray, J. C. et al.) 179–207 (Island Press, Washington,
2005).
42. Powell, R. A. Animal home ranges and territories and home range estimators. In Boitani (ed. L. & Fuller, T.K. ) 65–110 (Research
Techniques in Anim. Ecol. Controversies and Consequences, Columbia University Press, New York, 2000).
43. Mizutani, F. & Jewell, P. A. Home-range and movements of leopards (Panthera pardus) on a livestock ranch in Kenya. J. Zool. 244,
269–286 (1998).
44. Ray-Brambach, R. R., Stommel, C. & Rödder, D. Home ranges, activity patterns and habitat preferences of leopards in Luambe
National Park and adjacent Game Management Area in the Luangwa Valley, Zambia. Mamm. Biol. 92, 102–110 (2018).
45. Karelus, D. L. et al. Effects of environmental factors and landscape features on movement patterns of Florida black bears. J. Mam-
mal. 98, 1463 (2017).
46. Athreya, V., Odden, M., Linnell, J. D. C., Krishnaswamy, J. & Karanth, K. U. A cat among the dogs: Leopard (Panthera pardus) diet
in a human-dominated landscape in western Maharashtra, India. Oryx 50, 156–162 (2016).
47. Kshettry, A., Vaidyanathan, S. & Athreya, V. Diet selection of leopards (Panthera pardus) in a human-use landscape in North-
Eastern India. Trop. Conserv. Sci. 11, 194008291876463 (2018).
48. Ciuti, S. et al. Effects of humans on behaviour of wildlife exceed those of natural predators in a landscape of fear. PLoS ONE 7(11),
e50611. https://doi.org/10.1371/journal.pone.0050611 (2012).
49. Tucker, M. A. et al. Moving in the anthropocene: global reductions in terrestrial mammalian movements. Science 359, 466 (2018).
50. Broekhuis, F., Madsen, E. K. & Klaassen, B. Predators and pastoralists: how anthropogenic behavior inside wildlife areas influence
carnivore space use and movement behavior. Anim. Conserv. https://doi.org/10.1111/acv.12483 (2019).
51. Filla, M. et al. Habitat selection by Eurasian lynx (Lynx lynx) is primarily driven by avoidance of human activity during day and
prey availability during night. Ecol. Evol. 7, 6367–6381 (2017).
52. Du Preez, B., Hart, T., Loveridge, A. J. & Macdonald, D. W. Impact of risk on animal behaviour and habitat transition probabilities.
Anim. Behav. 100, 22–37 (2015).
53. Van Cleave, E. K. et al. Diel patterns of movement activity and habitat use by leopards (Panthera pardus pardus) living in a human-
dominated landscape in central Kenya. Biol. Conserv. 226, 224–237 (2018).
54. Durant, S. M. Living with the enemy: avoidance of hyenas and lions by cheetahs in the Serengeti. Behav. Ecol. 11, 624–632 (2000).
55. Broekhuis, F., Cozzi, G., Valeix, M., McNutt, J. W. & Macdonald, D. W. Risk avoidance in sympatric large carnivores: reactive or
predictive?. J. Anim. Ecol. 82, 1098–1105 (2013).
56. Packer, C., Swanson, A., Ikanda, D. & Kushnir, H. Fear of darkness, the full moon and the nocturnal ecology of African lions. PLoS
ONE 6(7), e22285. https://doi.org/10.1371/journal.pone.0022285 (2011).
57. Schuette, P., Creel, S. & Christianson, D. (2013) Coexistence of African lions, livestock, and people in a landscape with variable
human land use and seasonal movements. Biol. Conserv. 157, 148–154 (2013).
Scientific Reports | (2021) 11:3862 | https://doi.org/10.1038/s41598-021-83262-5 13
Vol.:(0123456789)You can also read