THE ROLE OF TROPHY HUNTING OF ELEPHANT IN SUPPORT OF THE ZIMBABWE CAMPFIRE PROGRAM DECEMBER 2016 - Prepared by CAMPFIRE Association Mukuvisi Woodlands
←
→
Page content transcription
If your browser does not render page correctly, please read the page content below
THE ROLE OF TROPHY HUNTING

        OF ELEPHANT

     IN SUPPORT OF THE

ZIMBABWE CAMPFIRE PROGRAM

      DECEMBER 2016

        Prepared by
    CAMPFIRE Association
     Mukuvisi Woodlands
          Harare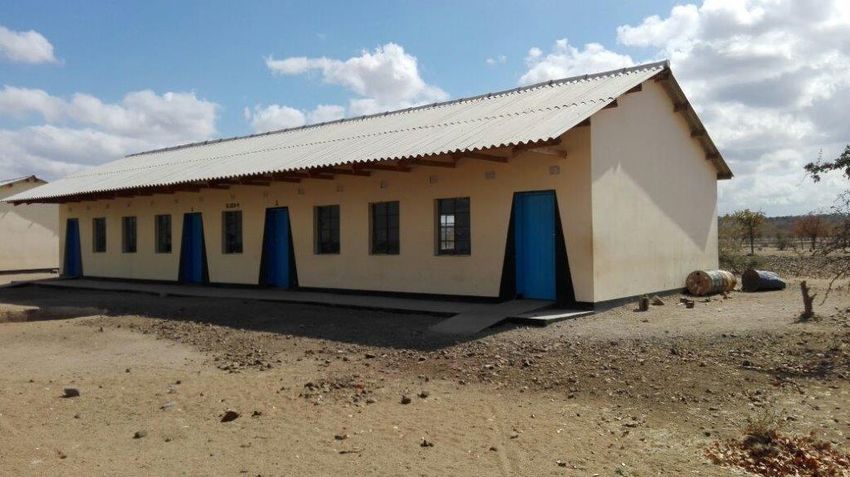
ROLE OF TROPHY HUNTING OF ELEPHANT IN SUPPORT OF THE ZIMBABWE CAMPFIRE PROGRAM

1      CONTENTS
Acronyms and Abbreviations ......................................................................................................................... I
Executive Summary....................................................................................................................................... ii
1      Introduction .......................................................................................................................................... 1
2      Overview of Community Based Natural Resources Management in Zimbabwe .................................. 2
    2.1        The CAMPFIRE Program ................................................................................................................ 2
3      Sustainable Use and Utilization of CAMPFIRE Resources and Revenues ............................................. 5
    3.1        Numbers, distribution and regional trends of elephant in Zimbabwe ......................................... 6
    3.2        Elephant quota allocation and utilisation ..................................................................................... 7
    3.3        Income Generation from Sport Hunting of elephants and other Key Species ............................. 9
       3.3.1          Income received by Outfitters .............................................................................................. 9
       3.3.2          Income from Trophy Fees ................................................................................................... 10
       3.3.3          Other Income to RDCs......................................................................................................... 10
       3.3.4          Benefit sharing: RDC vs Wards ............................................................................................ 11
4      Use of funds by RDCs and Wards ........................................................................................................ 12
    4.1        Profile of Rural District Councils ................................................................................................. 13
       4.1.1          Characteristics of the CAMPFIRE Districts .......................................................................... 14
       4.1.2          Human resources and equipment employed at the District Level ..................................... 14
       4.1.3          RDC expenditure ................................................................................................................. 16
    4.2        Profile of CAMPFIRE Producer Wards ......................................................................................... 16
       4.2.1          Human Resources, Patrol Effort and Equipment ................................................................ 17
       4.2.2          Human and Wildlife Conflict and Problem Animal Control ................................................ 17
       4.2.3          Beneficiaries of CAMPFIRE Income at the Ward Level ....................................................... 19
5 Impact of the Suspension of Elephant Trophy Imports to the United States on THE CAMPFIRE
Program....................................................................................................................................................... 22
6      The Way Forward ................................................................................................................................ 23
7 Annex 1: Examples of Social Services Projects supported by CAMPFIRE funds at the District and
Ward level ................................................................................................................................................... 26
8      References .......................................................................................................................................... 30

                                                                             I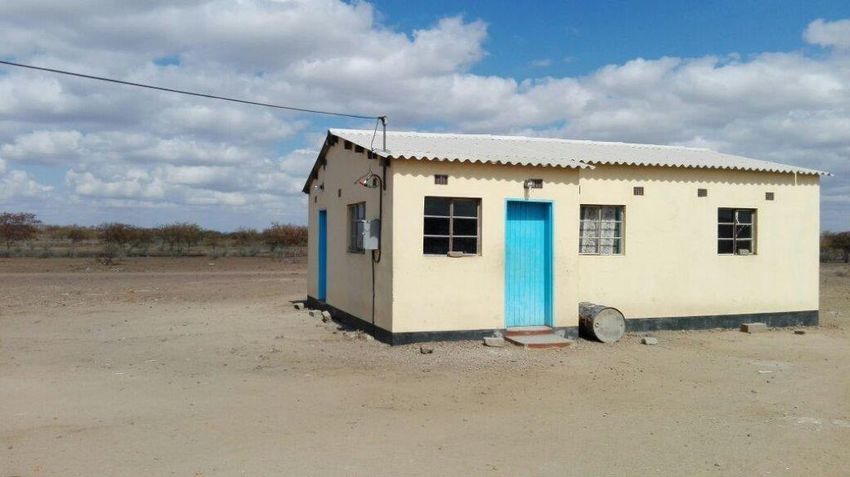
ROLE OF TROPHY HUNTING OF ELEPHANT IN SUPPORT OF THE ZIMBABWE CAMPFIRE PROGRAM
ACRONYMS AND ABBREVIATIONS
AA Appropriate Authority
CA CAMPFIRE Association
CAMPFIRE Community Areas Management Program for Indigenous Resources
CCG CAMPFIRE Collaborative Group
DNPWLM Department of National Parks and Wildlife Management
ESA Endangered Species Act
FWS United States Fish and Wildlife Service
RDCs Rural District Councils
SOAZ Safari Operators Association of Zimbabwe
USAID United States Agency for International Development
ZPHGA Zimbabwe Professional Hunters and Guides Association
ZPWMA Zimbabwe Parks and Wildlife Management Authority
Acknowledgements
This report has been prepared on behalf of the CAMPFIRE Association by Vernon Booth, with support
from Safari Club International Foundation. The input from all CAMPFIRE Managers and Internal
Auditors in the respective RDCs is greatly appreciated. The CAMPFIRE Association also acknowledges
the help provided by Mr. Kennedy Chiremba with data analysis.
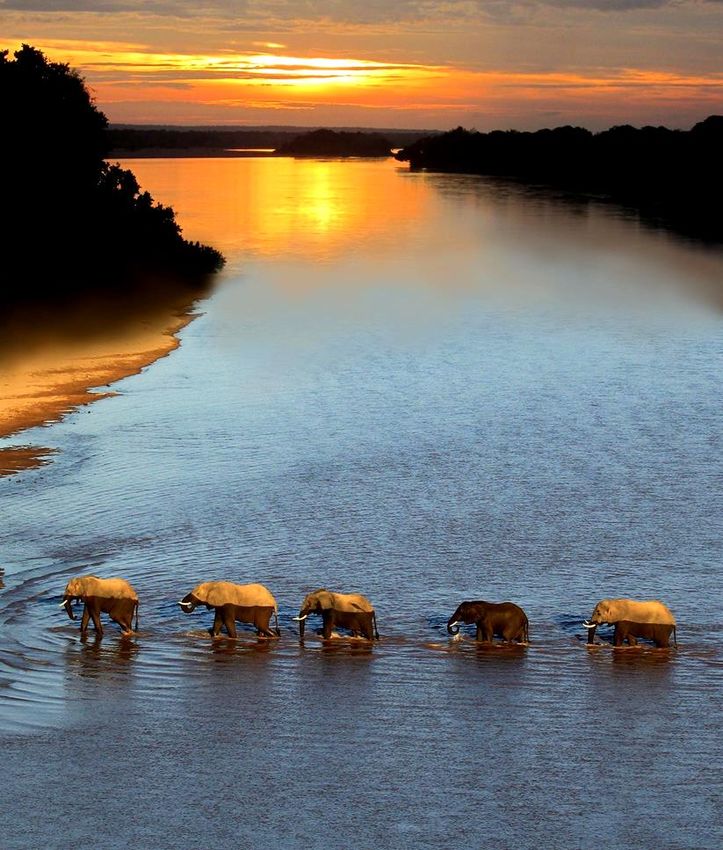
Cover photo: Lin Berrie, Chilo Lodge, Mahenya CAMPFIRE Area
I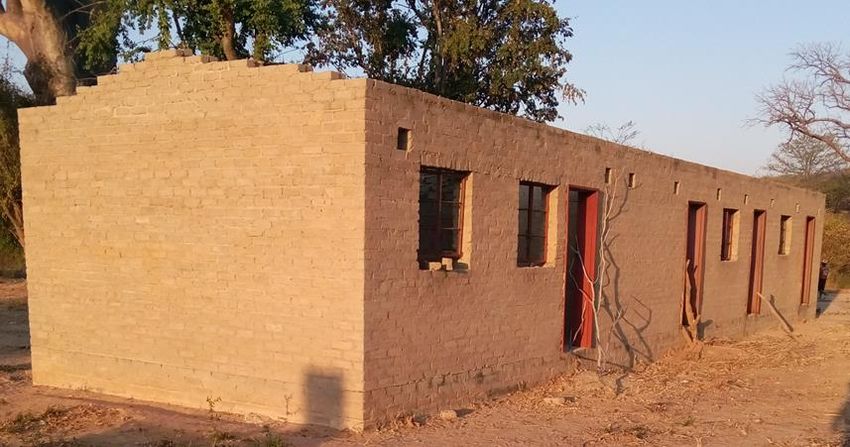
ROLE OF TROPHY HUNTING OF ELEPHANT IN SUPPORT OF THE ZIMBABWE CAMPFIRE PROGRAM

EXECUTIVE SUMMARY
In April 2014, the United States Fish and Wildlife Service (FWS) suspended the import of elephant
trophies taken in Zimbabwe. In March 2015, the suspension was extended to include future hunting
seasons. For it to reverse this decision, the FWS must make a finding that the killing of the animal whose
trophy is intended for import would enhance the survival of the species in the wild. The Zimbabwe Parks
and Wildlife Management Authority (ZPWMA) defended its position and provided the FWS with
significant amounts of information and data related to elephant management. While this is
acknowledged, the FWS was still of the opinion that its concerns had not been addressed, and identified
six areas where additional information was required.
The CAMPFIRE Association has taken these into consideration, especially the issues regarding “excessive
retention of generated funds by Rural District Councils”, and how much revenue elephant sport-hunting
provides and how much of that comes from U.S. hunters. This document addresses part of the
information requested by the FWS under “Revenue Utilization” to demonstrate that by allowing the
importation of trophies taken by U.S. hunters, the survival of elephants in Zimbabwe would be
enhanced. To support this position, the CAMPFIRE Association outlines the evolution of the CAMPFIRE
Program, describing the extent of its coverage and the impact that it has had on wildlife conservation in
Communal Areas of Zimbabwe.
Evidence from the 2014 national elephant survey is provided to show that Zimbabwe has a substantial
elephant population that is managed sustainably through an adaptive quota setting mechanism. Data
from 9 CAMPFIRE Districts that participated in this audit of CAMPFIRE revenue shows that
approximately 60% of the allocated elephant quota is utilized and that the majority of hunters (53%)
originate from America. These hunters have contributed US$9 million towards the CAMPFIRE Program
during the period 2010-2015 compared to US$8 million by the 40 other nations.
The income generated from trophy fees in the last 6 years (2010 – 2015) is approximately US$11.4
million of which elephant trophy fees contributed 65%, while a further US$4 million has come from the
sale of hides, concession fees and other sundry income. These funds have been distributed to CAMPFIRE
communities in various Wards who received approximately 57% (range 39% - 77%) of the Trophy Fees.
A standardized tool designed to gather baseline data has provided information on the physical and
human parameters of the 9 participating Districts including how and on what the revenues from hunting
have been utilized. At the District level, approximately 80% of the funds are used to support the
administration and management of the CAMPFIRE program, including investment on law enforcement.
In contrast, 55% of revenues provided to the producer Wards are channeled towards supporting social
services such schools, clinics and other programs that benefit the community.
The cost of living with wildlife, and particularly elephants, is shown through providing data on the scale
of crop damage (7,000ha over 6 years) that has a significant impact in terms of its monetary value on
rural communities who face food insecurity and deep poverty (average income US$1 a day). 96 human
lives were lost to wildlife attacks, with elephant accounting for more than half of those deaths. Yet
despite these challenges, communities still retain a high level of tolerance for elephants, but this
support is rapidly dissipating as a result of the loss of income from trophy hunting. This places almost
two million hectares of wild land at risk, including the risk of increasing retaliatory killing through
poisoning and illegal wildlife crime.
 A way forward is discussed outlining how the resumption of trophy imports can offset the challenges
facing the CAMPFIRE program and through this, enhance the conservation of elephant outside of the
protected areas.

                                                  II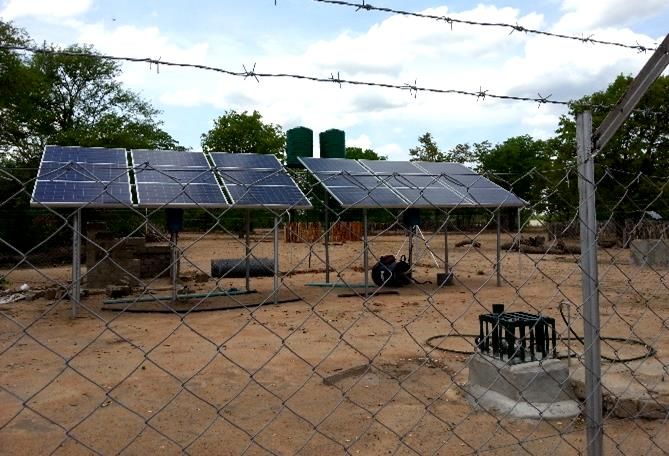
ROLE OF TROPHY HUNTING OF ELEPHANT IN SUPPORT OF THE ZIMBABWE CAMPFIRE PROGRAM

1    INTRODUCTION
In April 2014, the United States Fish and Wildlife Service (FWS) suspended the import of elephant
trophies taken in Zimbabwe. The suspension was extended to include future hunting seasons on March
26, 2015. In May 2015, the Assistant Director (International Affairs) from the United States Fish and
Wildlife Service (FWS), Mr. Byron Arroyo, wrote to the (then) Minister of Environment, Water and
Climate outlining the reasons why the Service made a determination on 26th March 2015 that it was
unable to authorize the import of elephant trophies taken in Zimbabwe in future. This is further
explained in detail in the “Enhancement Findings for African Elephant Taken as Sport-hunted Trophies in
Zimbabwe during 2014” published on the 7/22/14 (see reference FWS/AIA/DMA).

The FWS make the point that for it to authorize imports of sport-hunted African elephant trophies into
the USA, the Service must be able to determine that the requirements of the special rule for the African
elephant under the U.S. Endangered Species Act (ESA) have been met (see 50 CFR 17.40(e)(3)(iii)C).
Specifically, the FWS must make a finding that the killing of the animal whose trophy is intended for
import would enhance the survival of the species in the wild.

In defense of this, the Zimbabwe Parks and Wildlife Management Authority (ZPWMA) provided the FWS
with significant amounts of information and data related to elephant management. The FWS also
communicated with various stakeholders including the Safari Operators Association of Zimbabwe
(SOAZ), Zimbabwe Professional Hunters and Guides Association (ZPHGA), the CAMPFIRE Association, as
well as individual professional hunters and outfitters, and independent scientific researchers.

The FWS acknowledged this input but still believed the data received did not fully address the questions
regarding how elephants are managed in Zimbabwe, and how, by allowing the importation of trophies
taken by U.S. hunters, that the survival of elephants in Zimbabwe would be enhanced. Six areas were
identified where additional information was required. These are:

1: Updated Elephant Management Plan with formalized targets or indicators

2: Current elephant population data and the impact of hunting on the elephant population

3: Levels of poaching and prevention, including MIKE and PIKE data

4: Regulation and enforcement, particularly regarding the use of funds generated by U.S. hunters to
support law enforcement and management

5: Sustainable use of elephant, specifically information of the levels of legal and illegal offtake

6: Revenue utilization from the hunting of elephant on Communal Lands, Safari Areas, Forestry and
Private Conservancies.

The CAMPFIRE Association is not able to address these issues since these are the prerogative of the
ZPWMA who is responsible for the conservation and management of elephant at the national level.
Nonetheless, the CAMPFIRE Association is in a position to address part of the information requested
under “Revenue Utilization”, and contribute indirectly to the other five issues raised by the FWS.

                                                    1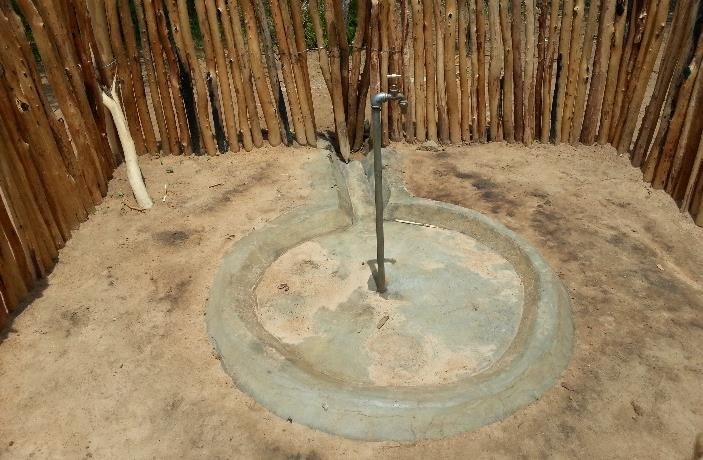
ROLE OF TROPHY HUNTING OF ELEPHANT IN SUPPORT OF THE ZIMBABWE CAMPFIRE PROGRAM

2     OVERVIEW OF COMMUNITY BASED NATURAL RESOURCES MANAGEMENT IN ZIMBABWE
There are numerous reports
and references in the
literature that analyze the
community based natural
resources management
program (CBNRM) in
Zimbabwe. A more recent
assessment can be found in
the document prepared for
USAID Zimbabwe by
Mazambani and Dembetembe
(2010).

In 1982, the government
amended the 1975 Parks and
Wildlife Act to enable Rural
District Councils (RDCs) to
obtain ‘appropriate authority’
(AA) to utilize wildlife for
commercial gain. The
proposed changes were aimed
at finding alternative forms of
land use to subsistence
agriculture on marginal lands.      Figure 1: The location of CAMPFIRE areas (in light green) relative to National
At that time, there was no          Parks (blue), Safari Areas (orange), Forest Areas (dark green) and
particular model as to how this     Conservancies (red).
could happen without
threatening the resource base. The (then) Department of National Parks and Wildlife Management
(DNPWLM) began to explore options within the framework of an integrated landuse plan for the
communal lands bordering National Parks and Safari Areas. This Act provided an opportunity to extend
to communities in the Communal Lands the benefits that the private landowners enjoyed as a result of
the 1975 Parks and Wild Life Act. This eventually led to the birth of Zimbabwe’s Community Areas
Management Program for Indigenous Resources (CAMPFIRE), which had far reaching impacts on wildlife
productivity as well as the socio-economic wellbeing of CAMPFIRE communities.

2.1    THE CAMPFIRE PROGRAM

The CAMPFIRE program was conceptually designed to focus on wildlife, woodlands, water, grazing
resources, and grasslands. In practice, it focused on managing wildlife because of the direct monetary
benefits which this resource offered to producer communities. The CAMPFIRE concept (see Murphree,
1993; Jones and Murphree, 2001) was developed in response to the realization that unless communities
living adjacent to National Parks can obtain direct value from wildlife, they will not protect the wildlife.
These communities would also need to have a much greater say in how those benefits would be derived
and utilized.

                                                     2
ROLE OF TROPHY HUNTING OF ELEPHANT IN SUPPORT OF THE ZIMBABWE CAMPFIRE PROGRAM
While the 1982 amendment of the 1975 Parks and Wildlife Act permitted devolution of authority over
wildlife to Rural District Councils (RDCs), the DNPWLM had meager resources to render the program
operational (Jones and Murphree, 2001). The DNPWLM therefore turned to such institutions as the
Center for Applied Social Sciences (CASS) at the University of Zimbabwe, which was assigned a socio-
economic research and evaluation role; the WWF Multispecies Animal Production System Project in
Zimbabwe; and the Zimbabwe Trust—an NGO focusing on rural development. These agencies had
different but complementary objectives and together with the DNPWLM they formed the original
CAMPFIRE Collaborative Group (CCG).
From 1986 to 1988, DNPWLM and its CCG partners engaged in discussions with selected communities
and RDCs to identify locations for the inception of the program. The discussions focused on two main
criteria, namely:
(a) voluntary interest in participation by communities and District Councils, and
(b) the presence of wildlife populations capable of producing sustainable and economically
significant revenues.
The CCG work during this period also involved securing political support for the program, and attending
to the demands of institutional and administrative detail associated with the conferment of Appropriate
Authority (AA) by DNPWLM to RDCs, including the guidelines for awarding revenues and other benefits
to communities from the the number of animals harvested within a local community’s area each hunting
season.
The agreed but non-binding guidelines stated that not less than 50% of the revenues was to be paid to
the communities (as wards), not more than 35% was to be allocated to wildlife management (habitat
management, fire control, monitoring, hiring of game scouts, etc.), and that 15% could be retained by
the District Councils as an administrative levy.
Under the CCG, the CAMPFIRE Program attracted donor support and evolved through a number of
phases.
Phase I 1989-1994: (US$10m grant support – USAID and various partners). The period saw the
initiation of CAMPFIRE and donor support was channelled towards the improvement of safari
hunting in major districts that had been granted AA by 1995. This is also the period in which
CAMPFIRE Association was established to coordinate the program.
Phase II 1994-2003: (US$30m - USAID). This support focused on the capture of other natural
resources (e.g. timber, sand, fishing, etc.). High-end non-consumptive tourism facilities were
developed in Nyaminyami and Chipinge districts in the early 1990s, and 12 ‘joint venture’ eco-
tourism lodges were in operation in communal areas by 1999. Small grants were also provided
to support the development of eco-tourism, crafts, and other community based natural
resources management projects. Investments were also made in the production of natural
resource products (e.g. fish in Beitbridge, Mwenezi; mopane worms in Bulilima Mangwe and
Gwanda; honey in Binga, Kusile, Mutoko, and Nyanga districts) and many other products.
Phase III 2003-2007: (US$165,000 – Ford Foundation). This period saw the cessation of major
donor funding to CAMPFIRE, and it also coincided with larger macro level policy changes in
3
ROLE OF TROPHY HUNTING OF ELEPHANT IN SUPPORT OF THE ZIMBABWE CAMPFIRE PROGRAM
Zimbabwe after 2000, and the subsequent adverse socio-economic conditions. This led to the
collapse of financial and technical support previously provided by the CCG.
Phase IV 2007-present: (US$350,000 WK Kellogg Foundation). During this period, there was
hyper-inflation, which led to the loss of income from hunting in real terms. This situation
stabilised in 2009, when multiple foreign currencies were introduced. The CAMPFIRE Association
maintained operations through a 4% levy paid by major hunting districts amounting to less than
US$100,000 annually.
Following are key achievements in the development of CAMPFIRE (see Mazambani and Dembetembe,
2010):
I. Guruve and Nyaminyami, the first RDCs to be granted AA status, received their first hunting
revenues in 1988. This had a dramatic effect in that many districts that are rich in wildlife
applied for AA status and by the end of 1991 eleven additional districts had been granted AA
status.
II. By the end of 1991, the 13 districts participating in the program collectively grossed US$1.1
million in revenue for that year.
III. By 1995 there were 23 districts participating in the program.
IV. The CAMPFIRE Association (CA), the secretariat for all districts with CAMPFIRE activities, was
formed in 1992. Its primary objectives were to promote the wildlife interests of RDCs and to
serve as an association of producer communities. The association played an important role in
securing full government support for wildlife management in communal lands so that CAMPFIRE
became a recognized conservation program.
V. Between 1995 and 2000 CAMPFIRE not only witnessed growth in terms of attracting more
districts, but also in building the capacity of the RDCs, and in diversifying their activities to
include other natural resources. The number of RDCs that were awarded AA status to manage
wildlife increased from 2 in 1988 to 27 in 1996. Institutional capacity building grants via United
States Agency for International Development (USAID) funding were secured for 24 districts from
1996 to 1999.
VI. Between 1989 and 2001, CAMPFIRE revenues amounted to almost USD $ 20.3 million, 97% of
which originated in the original 13 districts. Of this, 49% was disbursed to communities (118
wards with over 121,500 households), 20% used for wildlife management, just over 12%
retained by the District Councils as a levy, 3% used for other expenses (including the then 1.5%
levy to the CAMPFIRE Association), and about 15% was retained by the RDCs pending allocation
(Khumalo, 2003). Almost 90% of this income came from safari trophy hunting.
VII. The period from 2001 to 2003 witnessed two significant developments in CAMPFIRE:
a. formation and registration of community trusts as a strategy for devolving decision
making and control over resources from the RDCs to community groups, and
b. a concerted drive to diversify CAMPFIRE. Twenty-eight non-wildlife-based community
projects received financial support through CAMPFIRE compared to only five wildlife-
based community projects.
VIII. At its peak in 2002, CAMPFIRE encompassed 53 districts with AA, though only 23 of these really
functioned as intended, while only 12 received regular income from wildlife.
IX. The Association has spearheaded the revision of CAMPFIRE revenue sharing guidelines to
improve the community’s share of income from 50% to 55% of hunting income. A Direct
Payment System was developed in 2006 to ensure that communities receive their income on
4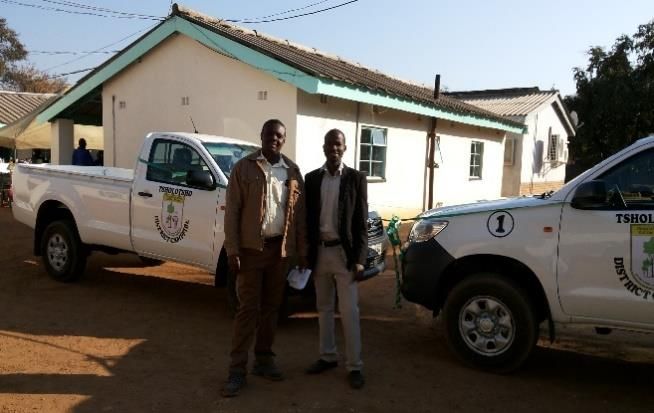
ROLE OF TROPHY HUNTING OF ELEPHANT IN SUPPORT OF THE ZIMBABWE CAMPFIRE PROGRAM
time. A standard hunting contract has been developed to improve hunting administration by
RDCs.
In summary, CAMPFIRE protects about 50,000 km2 (12.7%) of land in Zimbabwe (Figure 1). Benefits from
wildlife and other incomes encompass:
Approximately 777,000 households (25%) in Zimbabwe benefited from CAMPFIRE directly
or indirectly;
Approximately 25% of Zimbabwe’s people are receiving incentives to conserve wildlife and
prevent anti-poaching through CAMPFIRE;
Between 1994 and 2012, CAMPFIRE generated US$39 million of which US$21.5 million was
allocated to communities and used for resource management (22%), household benefits
(26%), and community projects (52%).
About 90% of CAMPFIRE revenue comes from hunting with elephant hunting contributing
up to 70% of annual revenue.
Based on Constitution of the CAMPFIRE Association as amended in 2007, all major RDCs use
CAMPFIRE revenue sharing guidelines, and in these districts revenue is paid directly into
community controlled bank accounts by safari operators using the following guideline:
RDC fees (41%), CAMPFIRE Association Levy (4%), and CAMPFIRE community (55%).
In the following sections, we describe how the income from the hunting of elephant is generated and
utilized using data from 9 Districts (Beitbridge, Binga, Bulilima, Chipinge, Chiredzi, Hwange, Mbire,
Nyaminyami, and Tsholotsho) for the period 2010 and 20151. For each of these areas we provided:
Total number of elephant hunted
Total revenue earned from elephant (and other trophy species)
How the revenue is spent on various management and social services
We also provide examples of community project support and the impact of human-wildlife conflict over
this period.
3 SUSTAINABLE USE AND UTILIZATION OF CAMPFIRE RESOURCES AND REVENUES
The CAMPFIRE program relies almost exclusively on income from hunting. Since 2009, the number of
RDCs where hunting is practiced has decreased, mostly because of the prevailing socio-economic
conditions that have resulted in high levels of poverty. This is seen as the key driver of the escalating
levels of illegal wildlife crime, and poaching of elephant in particular. Maintaining elephant numbers
outside of the protected areas is important to their overall conservation, and the reason why Zimbabwe
regards the sustainable utilization of all wildlife as critical to its national conservation strategy. The
hunting of elephant in CAMPFIRE areas thus plays an important role and is the major source of income
to communities in these areas.
1
Hurungwe provided partial information, as explained in relevant parts of the report
5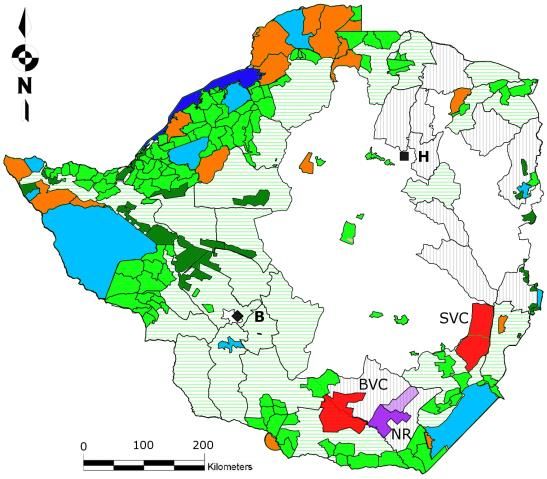
ROLE OF TROPHY HUNTING OF ELEPHANT IN SUPPORT OF THE ZIMBABWE CAMPFIRE PROGRAM

3.1   NUMBERS, DISTRIBUTION AND REGIONAL TRENDS OF ELEPHANT IN ZIMBABWE

Elephants are distributed in four main regional populations in Zimbabwe, namely, Northwest
Matabeleland, the Sebungwe, the mid-Zambezi Valley, and the South-East Lowveld. Crude ecological
densities vary between 2.16 elephant/km2 in Northwest Matabeleland and 0.46 elephant/km2 in the
Sebungwe region.

Elephant densities in the Communal Areas varies from 1.50 elephant/km2 in the south-east Lowveld to
0.06 elephant/km2 in the Sebungwe region. Overall it is estimated that 5,000 elephants reside in
Communal Areas and occupy approximately 16,000km2 (Table 1, Zimbabwe Elephant Management Plan:
2015-2020).

 Table 1. Numbers and densities of elephants in the four regions of elephant range within Zimbabwe.
(Source: Zimbabwe National Elephant Management Plan 2015 - 2020, see Dunham et. al. 2015a, b, c
and d).

 Name of Region & Area              Area (km2)            Estimated Number of              Density of
                                                               Elephants                 Elephants/km2
 NW Matabeleland                      24,989                     53,991                       2.16
 Hwange National Park                 15,180                     45,846                       3.02
 Matetsi Complex                       4,402                     4,843                        1.10
 Forest Areas                          2,332                     1, 101                       0.47
 Communal Lands                        3,075                     2,201                        0.72
 Sebungwe                             15,529                     3,407                        0.22
 Parks & Wildlife Estate               6,234                     2,894                        0.46
 Forest Areas                           261                        16                         0.06
 Communal Lands                        9,034                      497                         0.06
 Mid-Zambezi Valley                   16,014                     11,656                       0.73
 Parks & Wildlife Estate              12,257                     9,752                        0.80
 Communal Lands                        3,757                     1,904                        0.51
 South East Lowveld                    8,835                     13,037                       1.48
 Gonarezhou NP &                       5,118                     11,120                       2.17
 Malapati SA
 Save Conservancy                      3,496                       1,585                       0.45
 Communal Lands                         221                         332                        1.50
 Mozambique Border                     1,574                          0                          0
 National Total*                      65,367                       82,091                      1.23
 Parks & Wildlife Estate              43,191                       74,455                      1.75
 Forest Areas                          2,593                       1,117                       0.43
 Save Conservancy                      3,496                       1,585                       0.45
 Communal Lands                       16,087                       4,934                       0.18
* The survey did not include Bubye Valley Conservancy or the Tuli Safari Area and some other small populations
that likely add another 1,000 elephants to the estimated total for the country. The area surveyed in Mozambique is
not included in the national total or in the South-East Lowveld total area.

                                                      6
ROLE OF TROPHY HUNTING OF ELEPHANT IN SUPPORT OF THE ZIMBABWE CAMPFIRE PROGRAM
3.2 ELEPHANT QUOTA ALLOCATION AND UTILISATION
Zimbabwe is allocated an export quota of 500 elephants (1,000 tusks) in terms of the CITES regulations
(see https://cites.org/eng/res/10/E-Res-10-10R16.pdf). In practice, Zimbabwe adopts an adaptive
management strategy that sets the overall elephant quota at up to 0.75% of the overall population. This
implies that the maximum national quota should not exceed 600 animals at the current population
estimate of 80,000 elephants. However, to maintain trophy quality at approximately 35kg (77lbs), the
national quota is set at 0.3 – 0.5% of the overall population i.e. 240 – 400 elephants, assuming an
average offtake of 60% (R.B. Martin, pers. comm.).
The approach applied to the CAMPFIRE areas is to set quotas that use parameters that are higher than
these national guidelines. This strategy is adopted to provide incentives to local communities that
reside in areas where high levels of human-elephant conflict is recorded, and to facilitate benefits to
local communities through sport hunting.
Figure 2: Total allocation of trophy elephant (N=1087) to nine major CAMPFIRE areas over a 6-year
period
A total of 1,087 elephants have been allocated on quota to nine major CAMPFIRE areas since 2010
(Figure 2). This equates to 180 elephants per year. The distribution of this quota among the nine
CAMPFIRE areas is dictated by the relative density of elephants in the neighboring protected areas and
those residing in the CAMPFIRE areas. Tsholotsho, for example, that borders the southern boundary of
Hwange National Park, was allocated 158 elephants (or 26/year) while Hwange, Binga and Hurungwe
CAMPFIRE Areas that do not border onto areas of high elephant densities receive approximately 10
elephants/year.
7ROLE OF TROPHY HUNTING OF ELEPHANT IN SUPPORT OF THE ZIMBABWE CAMPFIRE PROGRAM
The historical trend of utilization of the elephant quota (667 elephant or 61% of the quota allocation) is
provided in Figure 3.
Figure 3: Overall utilization (%) of elephant quotas in nine major CAMPFIRE Areas over a 6-year period
Over the six years, Tsholotsho (99%), Mbire (71%) and Chiredzi (68%) have successfully utilized their
allocated quotas while areas such as Hurungwe (20%) and Binga (26%) have not performed as well.
The origin of clients hunting in these areas is summarized in Table 2. Over the 6-year period 1702 clients
(average 284/year) have hunted in the seven CAMPFIRE Areas (excluding Binga and Hurungwe for which
no data are available). Of these 897 clients (c.150/year or 53%) originated from the USA and 461 (c.77 or
27%) from Europe.
Table 2: Origin of hunting clients visiting the major CAMPFIRE Areas :2010 – 2015. Note. No data are
available for Binga and Hurungwe
Origin of South Middle
Clients USA Europe Africa Asia America Oceania Canada East Total Average
Beit Bridge 172 36 10 3 14 9 3 0 247 41
Bulilima 17 9 0 0 7 0 0 4 37 6
Chipinge 17 5 0 0 1 0 0 0 23 4
Chiredzi 151 52 57 69 0 0 0 0 329 55
Hwange 20 14 1 5 4 4 1 1 50 8
Mbire 213 90 36 0 10 16 3 0 368 61
Nyaminyami 273 218 24 1 18 21 8 0 563 94
Tsholotsho 34 37 3 4 1 1 1 4 85 14
Total 897 461 131 82 55 51 16 9 1702 284
Percentage 53% 27% 8% 5% 3% 3% 0.9% 0.5%
Average/year 150 77 22 14 9 9 3 2
8ROLE OF TROPHY HUNTING OF ELEPHANT IN SUPPORT OF THE ZIMBABWE CAMPFIRE PROGRAM
3.3 INCOME GENERATION FROM SPORT HUNTING OF ELEPHANTS AND OTHER KEY SPECIES
3.3.1 Income received by Outfitters
To fully account for earnings in the hunting sector, the Reserve Bank of Zimbabwe, in collaboration with
all the relevant stakeholders, introduced the Tourism Receipts Accounting System (TRAS) that required
all outfitters to submit returns listing the revenue generated for hunting activities. This system has been
in place for several years but required manual analysis of the data to extract the information. In January
2015, a web-based system (TRAS2) was introduced which links Safari Operators, Zimbabwe Parks and
Wildlife Management Authority, Taxidermists, Shipping Agents, International Marketing Agents and
Reserve Bank. Under this system all authorized hunts are registered allowing for the capture of hunting
data (origin of clients, value of trophies and hunts, area hunted etc.), monitoring hunting quota
utilization and tracking hunted trophies (Chitauro, 2016). The Exchange Control Division of the Reserve
Bank of Zimbabwe and the ZPWMA are now able to:
1. Assess regional price differentials of similar hunts and the reasons thereof;
2. Present TRAS2 systems updates and reports to the users including international marketing
agents;
3. Engage with international marketing agents of sport-hunting;
4. Obtain relevant insights on governing of the hunting sector; and
5. Come up with an effective mechanism to fully account for export proceeds from the hunting
sector.
Outfitters that operate hunting concessions in CAMPFIRE Areas are required to deposit copies of the
TRAS2 form with the CAMPFIRE Office in their respective RDCs/Wards. Each Office is therefore able to
extract data on daily rates, trophy fees and other incidental revenues. Figure 4 provides a summary of
the income by country of origin. This data confirms the major role of American hunters to the
CAMPFIRE program who contribute 52% of the overall income.
Figure 4: Contribution of hunting clients to the CAMPFIRE Program
9ROLE OF TROPHY HUNTING OF ELEPHANT IN SUPPORT OF THE ZIMBABWE CAMPFIRE PROGRAM
3.3.2 Income from Trophy Fees
The data for the total amount of revenue generated for elephant, buffalo, leopard, hippo, crocodile and
lion between 2010 – 2015 (approximately US$11 million) is shown in Figure 5.
Figure 5: Income (US$) generated from the sale of key trophies
The importance of the income from elephant is clear from these data. Trophy fees from elephant
account for 64% of all fees generated from the key species (approximately US$1.2 million/year). Buffalo
(20%) are ranked second while leopard, hippo and crocodile contribute approximately 5% each.
Noteworthy here is the low contribution of lion (approximately 2%). This low level of income generation
is partly a result of the impact of the lion import suspension into the USA and Europe, decreasing quota
allocations and decreasing offtake levels brought about by the recently imposed lion age hunting
regulations. By comparison, the 897 American clients who hunted in CAMPFIRE Areas in the six-year
period paid US$9 million in trophy fees and daily rates. Other nationalities, contributed US$8 million.
3.3.3 Other Income to RDCs
RDCs can generate income for other revenue streams, notably receiving a percentage of the daily rate,
concession fees, bed night levies from photographic camps and from the lease/rent of equipment
(Figure 6). The eight RDCs for which data are available generated approximately US$4 million from
these revenue streams. Excluded here are revenues that could have been earned from the sale of ivory
recovered from problem animal control (PAC) and natural deaths, and from the distribution of meat
estimated at 550,000kg over the 6-year period.
10ROLE OF TROPHY HUNTING OF ELEPHANT IN SUPPORT OF THE ZIMBABWE CAMPFIRE PROGRAM
Figure 6: Income (US$) accruing to the RDCs from related income revenue streams
3.3.4 Benefit sharing: RDC vs Wards
Communities at the Ward level receive funds directly from the outfitter utilizing their area, except for
those in Beitbridge and Hwange who are paid from dedicated CAMPFIRE accounts with the respective
RDC. These funds are generated through trophy fees and income from the sale of hides, concession fees
etc. (Table 3).
Over the last 6 years, the income generated from trophy fees is approximately US$11 million while a
further US$4 million has come from the sale of hides, concession fees and other sundry income. The
agreed split of these funds is that not less than 55% of the revenues is paid as Ward dividends, not more
than 35% is allocated to the RDC for wildlife management (habitat management, fire control,
monitoring, hiring of game scouts, etc.), and 15% is retained by the RDC as an administrative levy. Some
RDCs do not consider all these revenues as “CAMPFIRE Funds” and segregate trophy fees from the other
revenues. On average, the CAMPFIRE District Wards received 42% (range 23% - 66%) of the combined
Concession and Trophy Fees, but the Wards received approximately 58% (range 26% - 77%) of the
Trophy Fees (Table 3).
11ROLE OF TROPHY HUNTING OF ELEPHANT IN SUPPORT OF THE ZIMBABWE CAMPFIRE PROGRAM
Table 3: Summary of the benefit sharing (US$) of hunting related income between RDCs and Wards:
2010 - 2015
% Trophy Fee Revenue
Hides, Concession fees
% All Revenue share:
share: RDC vs Wards
Income to RDC from
Income to RDC from
Income to Wards
RDC vs Wards
Districts
trophy fees
etc.
Beit Bridge $657,458 $12,298 $370,228 55% 56%
Binga $299,800 $364,224 $162,062 24% 54%
Bulilima $521,700 $46,337 $403,685 71% 77%
Chipinge $349,500 $139,259 $135,572 28% 39%
Chiredzi $1,848,600 $181,420 $1,339,678 66% 72%
Hwange $394,000 $105,131 $237,245 48% 60%
Mbire $3,022,250 $54,420 $1,740,714 57% 58%
Nyaminyami $1,883,853 $1,319,772 $1,132,204 35% 60%
Tsholotsho $2,136,000 $1,990,200 $1,109,956 27% 52%
Total $11,420,886 $4,213,061 $6,631,342 42% 58%
4 USE OF FUNDS BY RDCS AND WARDS
The CAMPFIRE Association prepared two templates in conjunction with district based CAMPFIRE
Managers that were used as tools to audit the flow of income from safari hunting for the period 2010-
2015, and how these funds are used to benefit CAMPFIRE communities. The tools gathered information
on the following:
Tool 1: Data related to Rural District Councils
1. Area of district (either sq. km / ha) and total number of wards
2. The income generated by elephant, lion, leopard, hippo and crocodile i.e. Allocated quota
(Number), Trophy fee, number hunted (offtake), percentage quota utilization.
3. The origin of the hunters (i.e. USA, Germany etc.) and the value of the safaris extracted from the
TRAS2 forms where available. This data provided an indication of the income generation by
outfitters.
4. The gross income that CAMPFIRE Districts received from the hunting and photographic activities
(i.e. trophy fees, daily rates, concession fees, photographic fees, meat and any other sundry
income).
5. Human resources employed at the District level (i.e. number of Wildlife Managers, number of
Game Scouts, equipment (e.g., vehicles, patrol equipment etc.), patrol days per year.
6. The use of the funds to support:
a. Meetings and Administration (i.e. the “15%” of funds)
12ROLE OF TROPHY HUNTING OF ELEPHANT IN SUPPORT OF THE ZIMBABWE CAMPFIRE PROGRAM
b. Law enforcement (RDC Game scouts, equipment, operational costs etc.)
c. Compensation schemes (burial expenses, education, payment for hospital expenses
etc.)
7. Management activities (fire guards, rehabilitation of water supplies, anti-poaching, problem
animal control etc.)
8. Social services i.e. support to clinics, schools etc.
9. Other expenses not related to the above.
Tool 2: Data related to Wards
The following data was summarized for each ward in the District. The data collected at the Ward level
was supported with evidence of income and expenditure e.g. copy of accounts, photographs of
infrastructure etc.
1. Name of ward and ward number
2. Name and size of hunting area(s)
3. Name and number of village(s) and number of household beneficiaries
4. Income received at Ward level from hunting income, income generating projects from wildlife
and other income (grinding mills etc.)
5. Allocation and use of income at Ward level for
a. Meetings and Administration
b. Wages/salaries
c. Compensation schemes (e.g., burial expenses, education)
d. Management activities (e.g., fire guards, rehabilitation of water supplies, anti-poaching,
problem animal control.)
e. Project running costs
f. Social services (e.g. clinics, schools, grinding mills, roads, fencing, equipment,
boreholes/pumps)
g. Food security
h. Direct cash benefits (i.e. to individuals, households, if applicable)
i. Other
6. Human resources employed at the Ward level (i.e. number of Wildlife Managers, number of
Game Scouts, equipment (e.g., vehicles, patrol equipment etc.), patrol days per year.
7. Number of Human and Wildlife Conflict cases by year and type (human death, injury, livestock,
infrastructure)
8. Population estimates of major species (where available)
4.1 PROFILE OF RURAL DISTRICT COUNCILS
The data presented here has been extracted from Tool 1. For ease of understanding, these are
presented below as follows:
Characteristics of CAMPFIRE Districts
Human resources and patrol effort
Investment in equipment
Expenditure
13ROLE OF TROPHY HUNTING OF ELEPHANT IN SUPPORT OF THE ZIMBABWE CAMPFIRE PROGRAM
4.1.1 Characteristics of the CAMPFIRE Districts
The main parameters of the 10 RDCs (including Hurungwe) that provided data for this analysis are
provided in Table 4. These RDCs represent approximately 9 million hectares of which 3.7 million
hectares fall under the CAMPFIRE program. These RDCs have entered into agreements with both
hunting and photographic outfitters who have invested in 26 hunting camps and 8 photographic camps
respectively.
Altogether there are 224 Wards represented in these areas of which 104 are under the CAMPFIRE
program. Excluding Hurungwe, there are 737 villages with a minimum of 85,847 households. This
represents a community of approximately 600,000 people assuming that the average household is
represented by 7 family members.
Table 4: Baseline features of the nine CAMPFIRE Districts
Number
CAMPFIRE Number of Number
District
Total Area Hunting Photo of Campfire of Number of
Area (Ha) (Ha) camps camps Wards Wards Villages Households
Beit Bridge 1,269,700 310,300 4 1 15 8 15 5,070
Binga 1,230,800 364,000 1 0 25 21 51 19,474
Bulilima 203,300 203,300 1 0 22 13 51 7,767
Chipinge 522,300 40,800 1 1 33 2 15 951
Chiredzi 1,710,239 481,004 5 0 32 9 52 9,461
Hurungwe 1,967,834 529,800 2 1 26 7 N/A N/A
Hwange 376,963 376,963 2 1 20 18 93 13,980
Mbire 781,000 898,000 6 0 17 9 328 12,302
Nyaminyami 369,931 140,000 3 3 12 6 62 5,875
Tsholotsho 833,600 410,000 2 1 22 11 70 10,967
Total 9,265,667 3,754,167 26 8 224 104 737 85,847
4.1.2 Human resources and equipment employed at the District Level
Each of the RDCs employ staff to manage the CAMPFIRE program in their Districts. The number of
people employed and the roles that they play is dependent on the level of income generated by the
CAMPFIRE program. The core function of these staff is to monitor wildlife related activities in their
respective areas, notably recording and dealing with human and wildlife conflict, coordinating meetings
at the Ward level and monitoring outfitter hunting activities.
Most RDCs employ Game Scouts to conduct routine patrols and undertake basic law enforcement
activities. In most cases this is low key since the CAMPFIRE program relies on members of the
community to report incidents of wildlife crime, and any other matters related to wildlife in their
respective Wards and villages.
14ROLE OF TROPHY HUNTING OF ELEPHANT IN SUPPORT OF THE ZIMBABWE CAMPFIRE PROGRAM
Table 5: Summary of Human Resources Employed at District Level.
Wildlife Wildlife Game Patrol
District Managers Officers Scouts Employees Days
Beit Bridge 2 0 0 76 0
Binga 2 0 9 0 48
Bulilima 1 0 4 5 24
Chipinge 1 0 10 0 365
Chiredzi 2 0 8 8 91
Hurungwe 1 1 4 0 31
Hwange 1 0 6 0 144
Mbire 2 0 21 50 255
Nyaminyami 1 0 23 46 112
Tsholotsho 1 0 10 30 162
Total 14 1 94 215 1231
All RDCs have invested in various equipment that are employed on wildlife management activities. The
number and type of equipment depends on the level of income and sophistication of the CAMPFIRE
program. For example, the relatively wildlife endowed Mbire RDC has invested in a VHF radio system
and camping gear for its scout force.
Table 6: Examples of equipment used in the CAMPFIRE Districts.
Vehicle (4 x 4, pick up
Grader/Tow Grader
Radio Base Station
Radio hand sets
Motor cycle
Bicycles
Tractor
District
Trailer
Other
Truck
Tents
Rifles
etc.)
Beit Bridge 2 - - - - - - - - 7 - -
Binga 1 - - - - - - - - - - -
Bulilima 1 1 - - - - 2 - - - - -
Chiredzi 2 - 1 1 1 - - - - - - -
Chipinge 1 - - - - - - - - 7 - -
Hurungwe 1 - - - - - - - - - - -
Hwange 1 - - - - 3 - - - 7 1 -
Mbire 3 - - - - 2 20 6 15 - 23 8
Nyaminyami 1 - - - - - - - - 27 - 10
Tsholotsho 2 - - - - - - - - - - -
Total 15 1 1 1 1 5 22 6 15 48 24 18
15ROLE OF TROPHY HUNTING OF ELEPHANT IN SUPPORT OF THE ZIMBABWE CAMPFIRE PROGRAM
4.1.3 RDC expenditure
CAMPFIRE related expenditure over the 6-year period is approximately US$6.2 million (or US$1.0
million/year). Figure 7 represents a breakdown of how the RDCs utilize the income from hunting to
support the CAMPFIRE Program in their respective areas. These can be broken down into
Administration, Management and Law Enforcement which accounts for approximately 80% of the
expenses (or approximately US$835,000/year). The remaining 20% are used to support various
community benefits and are aggregated under Social Services, Compensation and Other2 activities. This
equates to approximately US$220,000/year.
Figure 7: Breakdown of expenditure at the District level on CAMPFIRE program activities
A strategy employed by most RDCs is to invest more in activities related to the management and
administration of the CAMPFIRE program rather than on social services. On average, 40% is spent on
administration, 20% of law enforcement and 11% on management related expenses while 6% is
allocated to support social services. There is no official national compensation scheme, however, RDCs
and Wards (including outfitters) assist people and families who are injured or killed by wildlife.
4.2 PROFILE OF CAMPFIRE PRODUCER WARDS
2
The “Other” activities have been skewed by the inclusion of a number of expenses registered by Mbire RDC that
include construction and maintenance of staff housing, promoting and managing a community cattle production
scheme and purchasing vehicles and office equipment.
16ROLE OF TROPHY HUNTING OF ELEPHANT IN SUPPORT OF THE ZIMBABWE CAMPFIRE PROGRAM
The data presented here has been extracted from Tool 2. For ease of understanding, these are
presented below as follows:
Human resources and patrol effort
Human and Wildlife Conflict
Investment in equipment
Expenditure
4.2.1 Human Resources, Patrol Effort and Equipment
Table 7 represents the decision that the CAMPFIRE producer Wards elect to invest in their respective
CAMPFIRE Programs. Each Ward is required to establish a Wildlife Committee to which at least 7
members are elected from the villages located in that ward. Each Wildlife Committee employs several
people either as ward based monitors or as Game Scouts. This workforce is responsible for
approximately 2.6 million hectares of land and represents the 85,847 households that reside in the 737
villages.
The decision to invest in equipment is dictated by the level of income that each producer Ward receives,
and the ability of the Ward to service and maintain the equipment in the long term. The records kept at
the Ward level under estimate the number of patrol days (minimum 3,002/year) achieved.
Table 7: Average number of staff employed at the Ward level, patrol effort and investment in
equipment
Equipment
Number of (e.g.,
Number of Number of Game Patrol vehicles,
Wildlife Employees Scouts days tractors, Number
Committee paid by paid by per grinding Concession of Number of
District members community community year mills) Area (Ha) Villages Households
Beit Bridge 66 1 3 152 1 324,300 15 5,070
Binga 7 - - - - 364,000 51 19,474
Bulilima - - 100 7 - 193,984 51 7,767
Chiredzi 56 32 - - 3 N/A 52 9,461
Chipinge 9 5 5 1,584 4 9,400 15 951
Hwange 49 - - - - 342,750 93 13,980
Mbire 76 90 48 1,259 19 898,000 328 12,302
Nyaminyami 45 30 12 - - 140,000 62 5,875
Tsholotsho 77 2 - - 1 410,000 70 10,967
Total 385 161 168 3,002 28 2,682,434 737 85,847
4.2.2 Human and Wildlife Conflict and Problem Animal Control
Communities living in CAMPFIRE areas are on the front line and are required to deal with wildlife
problems almost on a daily basis. Table 8 below provides a summary of the magnitude of human and
wildlife conflict (HWC) recorded over a 6-year period (2010 – 2015) in 9 CAMPFIRE Districts.
17ROLE OF TROPHY HUNTING OF ELEPHANT IN SUPPORT OF THE ZIMBABWE CAMPFIRE PROGRAM
Conflict with wildlife falls under two areas: crop damage and livestock deaths. While there are many
other wildlife species responsible for crop damage (baboons, monkeys, bushpig, rats, quelea birds etc.),
elephant are considered the greatest threat and problem.
Although the data are incomplete, it is estimated that 7,000ha of crops were destroyed by elephant
during the 6-year period under review. It is not possible to accurately place a monetary value to this
because crop production varies greatly from one year to the next, and from one region to another. It is
important however to take into consideration that the impact of crop destruction in the highly prone
drought areas and areas of low rainfall (e.g. Beit Bridge, Binga, Tsholotsho) is more acute than in areas
where crop production may be higher. To place this into perspective, the national average maize yield is
estimated at 300 – 600kg/ha, and the minimum cash value is US$180/ton3. The approximate value of
the maize lost is therefore US$500,000 – US$1.0 million. Applying this to livestock losses, the average
price of cattle is US$400 – US$700/head depending on the time of year and condition of the livestock.
Lion and crocodile are responsible for most cattle deaths and at these prices, the value of stock lost to
these predators is US$500,000 – US$1.0 million. Hyena equally destroy cattle but are more likely to kill
small livestock (goats, sheep). At US$75 – US$125/head, the minimum cost of predation on small
livestock is estimated at US$170,000 – US$300,000 (Table 8).
Table 8: Summary of the extent of human – wildlife conflict recorded in CAMPFIRE Wards: 2010 - 2015
Crop Damage (estimated Ha) Livestock killed (cattle, goats, sheep) Human
District Elephant Hippo Buffalo Lion Leopard Crocodile Hyena deaths
Beit Bridge 268 - 1 3 - - 30 4
Binga 26 35 - 1 - 32 29 7
Bulilima 522 - - 5 - - 231 -
Chiredzi 18 9 - 122 - 21 - 2
Chipinge 22 10 - 5 - 7 - 7
Hwange 461 - - 71 2 15 - 2
Mbire 3,878 475 1,146 426 52 416 1,870 53
Nyaminyami 1,216 49 102 59 6 9 - 13
Tsholotsho 1,085 - 20 175 19 - 211 8
7,495 578 1,269 867 79 500 2,371 96
Total
9,342ha 3,817
Cattle@$400 -
@300kg/ha*$180/ton $504,473 $546,800 - $1,040,400
$700/head
Cost (US$) Small
@600kg/ha*$180/ton $1,008,947 livestock@$75 - $177,825 - $296,375
$125/head
Communities who live with wildlife also pay the ultimate price and 96 people have lost their lives and
others injured after encountering dangerous animals. Crocodile and hippo are responsible for most
human deaths and injuries but there are many incidents where elephant have killed and maimed people
who were tending their fields or traversing wildlife areas.
3
Note: the official price for maize is approximately $350/ton but sellers rarely receive this price from the millers
and other interested buyers.
18ROLE OF TROPHY HUNTING OF ELEPHANT IN SUPPORT OF THE ZIMBABWE CAMPFIRE PROGRAM
Table 9 summarizes the incidents of problem animal control and illegal activities recorded in the 9 major
CAMPFIRE RDCs (data extracted from The Proceedings of the CAMPFIRE workshop, Gandiwa et. al.
2014).
Table 9: Summary of problem elephant destroyed and through illegal activities in 9 CAMPFIRE Districts
2009 2010 2011 2012 2013 2014 Total
Conflict 250 283 340 208 295 478 1854
PAC 55 66 41 33 36 66 297
Illegal 7 14 12 11 16 19 79
It is not unexpected that local communities will seek to mitigate these losses either through retaliatory
killings (this applies mostly to the carnivores) or through removal of problem animals. With respect to
elephant, it is important to understand the relationship between trophy hunting, problem animal
control and illegal offtake. The interactions amongst all three variables are not simply additive. For
example, a relatively small offtake of problem animals can have a significant influence on the mean tusk
weight of hunting trophies taken from the population and, hence, the income derived from hunting.
Martin (pers. comm.) uses a population simulation model (Craig et. al. 2011) to carry out an analysis to
examine these interactions. This model assumes that Problem Animal Control (PAC) is selective, and
that most of the elephants killed are males between the ages of 13-36 years old and females between
the ages of 22-42 years old. Moreover, more males are killed than females (5:1).
Martin demonstrates that the combined effect of trophy hunting quotas and level of PAC shows that in a
scenario where there is no PAC, trophy hunting quotas can be set ranging from 0.1 - 0.6 % of the
population. However, as PAC increases, so the trophy hunting quotas must be decreased to maintain
trophy quality. The magnitude of the changes caused by relatively minor increments in PAC are highly
significant. The modelling shows that increases in the trophy hunting quotas and PAC offtake causes
only a minor drop in the rate of increase of the population which remains above 4% per annum,
however, if the PAC offtake exceeds 1% of the population, then hunting quotas should not exceed 0.1%
of the population. Unless these ratios are maintained, there is a real risk that the elephant populations
will decline with the consequential loss of income from sport hunting.
Currently Zimbabwe adheres to quotas set at 0.3 – 0.4% of the population, and slightly higher in the
CAMPFIRE areas. The PAC levels shown in Table 9 do not approach these critical thresholds, however,
close attention needs to be paid to trophy quality and age (see discussion of elephant hunting in Mbire -
in The Proceedings of the CAMPFIRE workshop, Gandiwa et. al. 2014).
4.2.3 Beneficiaries of CAMPFIRE Income at the Ward Level
The beneficiaries of revenues from the CAMPFIRE program are the community’s resident in the
producer Wards. However, the volume of people residing in these areas precludes providing individuals
with direct dividends since the value of such dividends would be meaningless. The CAMPFIRE wards
have therefore elected to invest in projects that provide social services to the whole community and
only in special circumstances are dividends paid out for food security and direct cash benefits.
19ROLE OF TROPHY HUNTING OF ELEPHANT IN SUPPORT OF THE ZIMBABWE CAMPFIRE PROGRAM
Table 10: Examples of Social Services funded in selected CAMPFIRE areas from Ward Revenues
generated from sport hunting: 2010-15
District Project
Beitbridge Rehabilitation of schools, clinics and protection of irrigation schemes
Bililima Rehabilitation of 3 clinics and 3 primary schools, hall, fencing of fields and
rehabilitation of lodge, community truck, tractor, dam repair machinery.
Chipinge 3 grinding mills, lorry, teachers houses, community office, shop
Chiredzi Clinic, teachers’ houses, primary school, community-grinding mill, Police sub-office,
piped water and electrification of clinic.
Hurungwe Construction of classroom block Nyamakate Secondary, Maintenance of Nyamakate
bridge. Purchase of tractor tube, payment of carpenters, Roofing Chipfuko Primary
School and Huyo Secondary School, CAMPFIRE Ward tractor major service, Purchase of
Treasurers bicycle, Payment of Nyamakate Clinic guard, 7 resource monitors
allowances, 26 bag cement Chitindiva, Kabidza , Manyenyedzi and Mawau schools for
toilets construction, renovation Karuru School (5 bags cement), and toilet construction,
Chitindiva Clinic toilet construction, Roofing Chikova Secondary School, Purchase of
buiding materials Chikova Secondary Block, Painting Dete Primary School, Building
toilets Makwiye school, Building shed Mupuse school, Roofing Bhashungwe primary
school, Sanyati Bridge camp renovation, Purchase of Cement Tashinga Primary School,
6 pairs uniform for resource monitors, Purchase of 20 bags cement Chisipite Primary
School, Purchase of tires for Ward tractor, Bridge maintenance
Mbire Clinic, nurse’s houses, office, storerooms, 14 classrooms, 7 teachers houses, grinding
mill, school office, wildlife administration offices, 2 hand pump boreholes, water
piping, toilet, water storage tanks, 2 tractors, a basic tourist camp with 4 chalets;
Nyaminyami Tillage tractors, renovation of dispensary at clinic, nurse’s house. Construction of
Mayovhe classroom block, 3 grinding mills, Teacher’s house, Jongola school. School
bursaries x 3 students at Seke Teacher’s College. Renovation of pre-schools x 2.
Negande: Rehabilitation of water pipeline, grinding mill. Nebiri: Chikuro primary
block, rehabilitation of Harudziva water pipeline. Kasvisva: Rehabilitation of water
pipeline to supply water to Kasvisva clinic, Kasvisva Secondary school block. Msampa:
Teacher’s house, Majazu primary, renovation of ward warehouse; Kanyati: Cement for
teacher’s house renovation.
Tsholotsho Classroom blocks and furniture (Sihazela, Mlevu, Mtshwayeli, Ntulula, Dibutibu,
Gwaai, Nkwizhi, Zibalongwe, Malindi, Mgodimasili, Phelela, Mpilo, Jimila, and Kapane
Primary schools), 2 F14 cottages, 10 sewing machines (Dibutibu Secondary school),
7km piped water system for Thembile primary school, Sikente Clinic, Tshitatshawa
and Jowa clinics construction, fencing of Madlangombe clinic, 10 water engines,
borehole drilling and repairs and repair kits, Lister diesel engines for 6 villages in ward
21 and at Sihazela Line in ward 1, grinding mills, solar water pumping in wards 1, 2
and 4. 2 pickup trucks for wildlife monitoring purchased in 2015.
Figure 8 summaries the distribution of the US$5.4 million that Wards in 9 CAMPFIRE areas received over
the 6-year period under review (2010 – 2015). As with the District expenditure, the Ward Wildlife
Committees allocate 42% of the funds (US$2.2 million) for administrative functions (i.e. Meetings and
Administration, Wages and Salaries, Management and Projects) and 55% of the funds (US$2.9 million) to
20ROLE OF TROPHY HUNTING OF ELEPHANT IN SUPPORT OF THE ZIMBABWE CAMPFIRE PROGRAM
community benefits. Most of the funds are allocated to social services (US$2.4 million) that support
schools, clinics and other infrastructure that benefit the whole community. Examples of this support are
provided in Annex 1.
Figure 8: Allocation of Ward Campfire funds
21ROLE OF TROPHY HUNTING OF ELEPHANT IN SUPPORT OF THE ZIMBABWE CAMPFIRE PROGRAM
5 IMPACT OF THE SUSPENSION OF ELEPHANT TROPHY IMPORTS TO THE UNITED STATES ON THE
CAMPFIRE PROGRAM
The income to CAMPFIRE from the sustainable use of elephants has been declining since 2013, with
2014 registering a significant drop following the announcement of the ban on ivory imports into America
(Figure 9). Although the hunting industry responded by seeking alternative markets (e.g. Russia, Middle
East), this trend continued through 2015 and unconfirmed reports suggest that the decline has
continued in 2016.
Figure 9: Annual income (US$) and offtake of elephants in 10 CAMPFIRE Districts
It is difficult to show concisely how the American ban on importation of elephant ivory from Zimbabwe
has contributed to the decline in CAMPFIRE revenue and how hunting has enhanced the conservation of
this species, due to the nature of the hunting industry in the CAMPFIRE areas. The hunting sector is
integrated across a wide range of socio-economic activities and withdrawing one segment adversely
affects a range of other wildlife based activities. Several indicators are provided here to demonstrate
this:
1. The US suspension of ivory imports from Zimbabwe has had a significant impact on CAMPFIRE,
and resulted in the cancellation of 108 out of 189 (57%) elephant hunts in all major districts
initially booked by US citizens in 2014. The net impact of this was a reduction of CAMPFIRE
income for all areas from US$2.2m in 2013 to US$1.7m in 2014. A similar pattern prevailed in
2015 (US$1.6m), and a further decline is anticipated in 2016 where outfitters struggled to sell
elephant safaris and those that did had to heavily discount their prices.
2. The key trophy species (elephant, buffalo, leopard, hippo, crocodile and lion) contribute
approximately US$1.2 million/year to CAMPFIRE revenues. Elephant account for 64% of these
fees.
22You can also read