Chemical functional groups of extractives, cellulose and lignin extracted from native Leucaena leucocephala bark
←
→
Page content transcription
If your browser does not render page correctly, please read the page content below
Wood Science and Technology (2021) 55:295–313
https://doi.org/10.1007/s00226-020-01258-2

ORIGINAL

Chemical functional groups of extractives, cellulose
and lignin extracted from native Leucaena leucocephala
bark

Rafidah Md Salim1           · Jahimin Asik2 · Mohd Sani Sarjadi2

Received: 15 November 2019 / Accepted: 22 December 2020 / Published online: 23 January 2021
© The Author(s) 2021

Abstract
Bark from trees is considered a worthless raw material. However, this resource
could be economically beneficial if utilized efficiently due to its rich chemical com-
pounds. In this study, an ethanol toluene-soluble extractive, alpha-cellulose and
lignin obtained from Leucaena leucocephala bark were characterized to determine
their chemical functional groups. Based on FTIR spectral analysis, the results indi-
cated that the bands of the functional groups of the extractive from the original bark
remain unchanged; however, the absorbance intensity was found to be weaker in the
group frequency and fingerprint regions. Removal of extractive, pectin, hemicellu-
lose and lignin from the bark indirectly increased the strong absorbance intensity
of cellulose. Broad peaks of OH stretching found in all spectra were assigned to the
presence of phenolic OH and aliphatic structures for extractive and aromatic struc-
tures of lignin. It was revealed that aromatic functional groups were mainly found in
the extractive, while water, carbonyl and ether were the dominant groups in cellu-
lose, and methyl, methylene, carbonyl and carboxyl groups were enriched in lignin.
Graphic abstract

Extended author information available on the last page of the article

                                                                                              13
                                                                                    Vol.:(0123456789)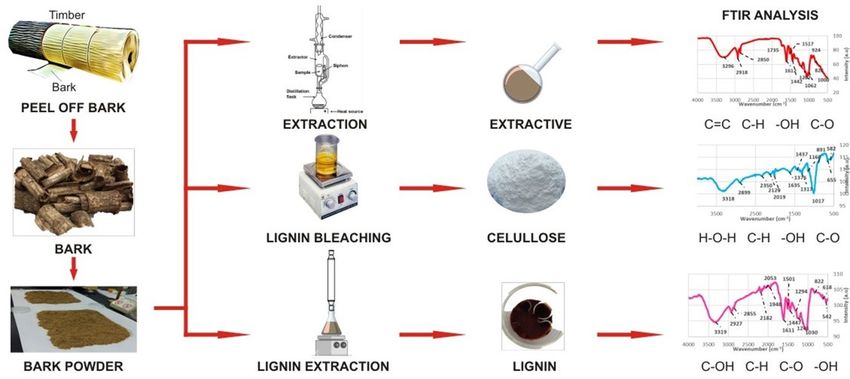
296                                            Wood Science and Technology (2021) 55:295–313

Introduction

Generally, barks from trees are regarded as worthless biomass residues and wastes
and are mostly discarded, burned or used as fuel in the timber and sawmill industries
(Lee and Lan 2006; Niokhor et al. 2009). However, some studies have reported that
barks are rich in chemical compounds and could be beneficial to a variety of fields,
ranging from the pharmaceutical industry to green polymers and bio-based materi-
als (Pietarinen et al. 2006; Conde et al. 1996; Sen et al. 2010; Valentín et al. 2010).
Utilization of these chemical compounds could also contribute to environmental
conservation and the economy (Niokhor et al. 2009). All plant biomasses includ-
ing barks, are rich in cellulose, hemicellulose, and lignin contents (Rutherford et al.
2012; Gonzalez-Vila et al. 2010). Bark, however, is different from other wood parts
because it contains high amounts of water, organic soluble extractives, polypheno-
lics and lignin, as well as inorganic material referred to as ash (Fengel and Wegener
1984; Pereira et al. 2003). Thus, the characterization of chemical compounds and
components in bark is vital before exploring their benefits and potential uses.
   Infrared spectroscopy is currently one of the most important analytical techniques
available to scientists in various fields that analyze almost any type of sample in
the form of liquids, solutions, pastes, powders, films, fibers, gases and surfaces (Fan
et al. 2012). The advantage of this tool is that it is fast, nondestructive, simple and
low in cost (Roggo et al. 2007; Tsuchikawa 2007). In studies investigating lignocel-
lulosic materials, FTIR spectroscopy was used to identify hydrogen bonds, chemical
structures and compositions (Fan et al. 2012), certain functional groups or chemical
bonds (Yang et al. 2012), phenolic compounds (Ghitescu et al. 2015) and aromatic
compounds (Lee and Lan 2006). Apart from that, information obtained from FTIR
analysis could also be used to optimize the experimental technique, to evaluate the
effect of the operating conditions, to detect the presence of mineral matter and to
determine gaseous reactions.
   In another study, FTIR was also executed to investigate the differences in cellu-
lose materials, especially in terms of crystallinity and hydrogen bonds of cellulose
fibers in bark (Ciolacu et al. 2011). Furthermore, FTIR can examine the formation
of inter- and intramolecular hydrogen bonds in cellulose. These properties strongly
influence the physical properties of cellulose, including solubility (Kondo et al.
1994), hydroxyl reactivity (Kondo 1997) and crystallinity (Itagaki et al. 1997), and
play an important role in the mechanical properties of cellulose (Kondo et al. 1994).
   In Malaysia, Leucaena leucocephala is a native fast-growing tree often called
‘Petai Belalang’ by the local population. The genus Leucaena belongs to the family
Leguminosae (flowering plants). This species has been discovered to possess much
potential as timber plantation plants of Malaysia (MTIB 2017). Studies have found
that the trunks and branches of L. leucocephala can be used as raw materials for
composite products such as oriented strand boards (OSBs) (Wan Mohd Nazri et al.
2009), particle boards (Marzuki et al. 2011) and fiber boards (Ab. Rahman et al.
2018) This species is also a major raw material in mills for pulp and paper making
(Kothiyal et al. 2012). It is known as a multipurpose tree and is widely used in gum
production, furniture, construction timber, poles, etc. In fact, this species is now

13
Wood Science and Technology (2021) 55:295–313                                      297

widely planted to restore land, control erosion and participate in water conservation,
reforestation, and land management and has been used as a cover crop and green
manure. The density of L. leucocephala bark is approximately 690 kg/m3 (medium
to hardwood class timber), which is representative of hardwood species of Malaysia
(Ahmad et al. 2011; Babatunde 2008).
   In this study, local L. leucocephala bark from the trunk was investigated. Bark
from this portion normally produces a high percentage of wastes/residues while
peeling off from the trunk. Fine barks were screened and mixed before the extraction
was conducted. The extracts, cellulose, and lignin were further analyzed using FTIR
methods. All peaks of the spectra produced from the analysis were identified, inter-
preted and compared to resolve their functional group activities.

Materials and methods

Materials

An eleven-year-old Leucaena leucocephala tree was harvested from the UMS
campus, Kota Kinabalu, Sabah, Malaysia. It was first verified by botanist experts
from the Forestry Division, UMS. The trunk was cut from the bottom up to the first
branch. The trunk was transferred to a mill for further handling. The bark of the tree
was initially peeled manually before being taken to the mill. In this step, the inner
and outer bark was not separated. This is because the separation is quite difficult
and costly. Furthermore, Xavier et al. (2012) caution that it is important to maintain
these fractions to enhance the phenolic content of the skin and improve the proper-
ties of produced resins. Then, all the samples were transferred to the Wood Chemis-
try Laboratory for further processing.

Preparation of samples

The bark was gently washed under tap water to remove dirt before being air-dried in
the laboratory at room temperature at 24 °C for 2–3 weeks and protected from direct
heat or sunlight. After being dried, the bark was chipped, flaked and pulverized into
coarse powder using the laboratory grinder. The powder was then passed through a
BS 500-um mesh sieve and retained in a 250-um mesh sieve to obtain 250–500 um
particle sizes for extraction.

Extraction of bark

Bark powders were air-dried for several days until they reached the constant weights
prior to chemical extraction. In laboratory work, the extractives were obtained by the
ethanol toluene solubility method (ASTM D1105 2001), i.e., immersing the ground
bark in ethanol-toluene solvent, rotor vaporizing and air-drying, while holocellulose

                                                                           13
298 Wood Science and Technology (2021) 55:295–313 was obtained by bleaching the bark with four times addition of 1.5% N aClO2 to remove lignin and produce air-dried holocellulose. Subsequently, oven-dried alpha- cellulose was produced by further treating the holocellulose with 17.5% NaOH and filtering the residues before washing them repeatedly with distilled water (ASTM D1103 2001). Then, lignin was obtained after filtering the lignin precipitates that occurred after the extractive-free bark was mixed with concentrated H 2SO4 and heated with distilled water (ASTM D1106 2001). Separation of extractives Approximately 2 g of bark in a thimble (Whatman) was placed in a Soxhlet extraction flask. Extraction was performed with 150 ml of ethanol solution. 427 ml of toluene brought up to 1 L with the addition of ethanol. The solvent was mixed well. Extraction was conducted for 6 h with six siphoning steps. Subse- quently, the flask was evaporated and dried in an oven at 103 ± 2 °C for 1 h before being cooled and weighed. Then, the ethanol-toluene soluble bark was ready for FTIR analysis of extractives. Bleaching of lignin Approximately 2 g of air-dried extractive-free bark powder was weighed and transferred to a 250-ml tall beaker. The flask was placed in a hot water bath at 70 °C after the addition of 100 ml of distilled water, 1.5 g of sodium chlorite and 5 ml of 10% acetic acid. The content was swirled every 5 min using a glass rod, making sure the flask was closed with a rounded flattened glass and the solution in the flask was just below the level of the water in the bath. Approximately 5 ml of 10% acetic acid was added after 30 min, followed by the addition of 1.5 g of sodium chlorite for 30 min thereafter. This step was repeated 3 times, followed by a final addition of sodium chlorite. Subsequently, the suspension was cooled in an ice bath prior to filtering into a weighted cruci- ble of porosity 1. Residue (white in color) was finally washed with acetone after being washed with iced distilled water. The residue was transferred to a desicca- tor after air-drying for a day until it was free of acetone. The sample was ready for cellulose extraction. Extraction of cellulose Air-dried holocellulose from the previous step was placed into a 250-ml tall beaker, and 15 ml of 17.5% NaOH was added. The solution was swirled using a magnetic stirrer for 1 min. After the addition of 10 ml of 17.5% NaOH, the solution was stirred for 45 s. Next, the mixture was allowed to stand for 3 min after stirring for 15 s with the addition of up to 10 ml of 17.5% NaOH. After 3 min, another 10 ml of 17.5% NaOH was added and stirred for 2.5 min. This step was repeated 3 more 13
Wood Science and Technology (2021) 55:295–313 299
times (total time: 15 min). The solution was allowed to stand for 30 min (total time:
45 min) before the addition of 100 ml of distilled water and swirling. Subsequently,
the solution stood for 30 min (total time: 75 min).
The mixture was filtered into a weighted fritted glass crucible (coarse porosity
3). The beaker and residue were rinsed with 25 ml of 8.3% NaOH solution before
being washed with 650 ml of distilled water at 20 °C. Filtration was stopped, and the
crucible was filled with 2 N acetic acid for 5 min. Filtration was continued, and the
residue was rinsed with distilled water. The residue was oven-dried at 103 ± 2 °C for
24 h before being cooled and weighed. Alpha-cellulose of bark was ready for FTIR
analysis.
Lignin extraction
Approximately 1.4 g of air-dried extractive free bark powder was weighed out accu-
rately and transferred to a 50-ml tall beaker. Fifteen milliliters of 72% sulfuric acid
was added carefully with a pipette, and the mixture was stirred with a small glass
rod (which was left in the beaker). The beaker was placed in a cold water immersion
at 20 °C for 2 h with stirring every 10 min. At the end of the period, the mixture was
transferred to a 1 L Erlenmeyer flask containing 560 ml of hot distilled water. A con-
denser reflux was connected to an Erlenmeyer flask, and the sample was boiled on a
hot plate for 4 h.
When refluxing was completed, the insoluble lignin was recovered by filtration
through the known weight of the crucible (porosity 4). The residue was rinsed with
500 ml of hot water and dried in an oven at 103 ± 2 °C for 24 h before being cooled
and weighed. The lignin content was ready for further FTIR analysis.
FTIR analysis of barks
Approximately 500 mg of the fine powder of extractives was used for FTIR analysis
to determine functional groups. The sample powder was placed directly on the dia-
mond crystal or light path, and the reflectance spectra were collected. FTIR spectra
were recorded on a Perkin-Elmer FTIR (model spectrum 100 series, USA) at ambi-
ent temperature, in the wavenumber range of 4000 to 400 cm−1 and at the resolution
of 4 cm−1. Each spectrum was collected from an average of 4 scans, and the scan
speed was 0.2 cm−1 s−1. The spectrum was interpreted to determine the functional
group of extractives. This analysis was also conducted for cellulose and lignin. The
spectrum from the original bark was used as a comparison.
Results and discussion
FTIR analysis of Leucaena leucocephala stem bark
In a previous study (Salim et al. 2019), extraction yields of L. leucocephala stem
bark for extractives, cellulose and lignin were found to be 8.39%, 29.19% and
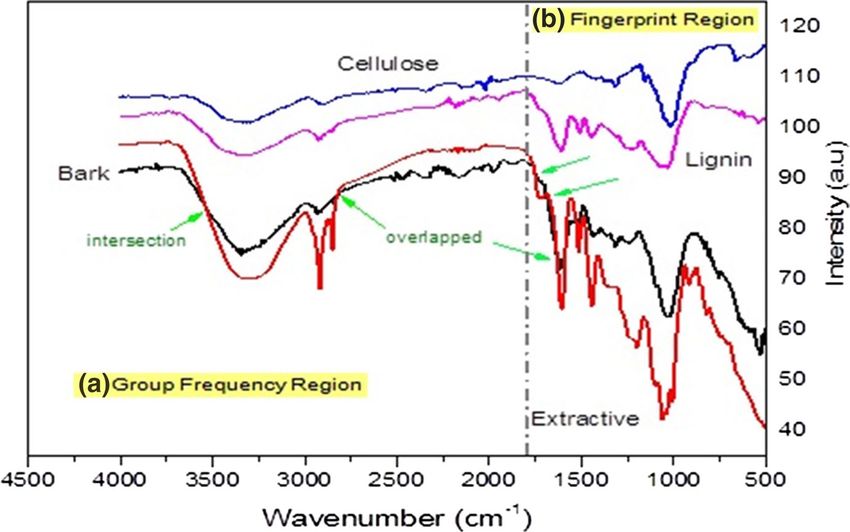
13300 Wood Science and Technology (2021) 55:295–313 38.24%, respectively. For chemical characterization, FTIR was used to determine functional groups of the components. The FTIR used infrared light as an energy source and the spectra produced used wavenumbers as units that were directly pro- portional to energy (a higher wavenumber corresponding to a higher energy); high intensity for FTIR typically means strong bonding, and weak absorption means weaker bonding of the chemical component. High intensity of these contents also means a high chemical content of the L. leucocephala extracted components. The spectrum of the original bark was used for comparison before and after extraction. Functional group of the main chemical components of bark The IR absorption spectra of the bark components (extractives, cellulose and lignin) and the original bark, recorded within the range of 4000–500 cm−1 are shown in Fig. 1. The spectrum of the extractives demonstrates the highest peak with a sharp and broad shape followed by the spectra of lignin and cellulose, which mostly appear as small and tiny peaks. The original bark shows similarly shaped peaks with lignin and cellulose but at lower intensity. However, several peaks of the bark overlapped with the extractives. The majority of the peaks were sharp in the fingerprint region (1800–500 cm−1), while in the group frequency region (1800–4000 cm−1), common peaks were broader than the others. The intensity of the group frequency and fin- gerprint regions recorded in the range of 40.55 to 116.65 (a.u) shows that cellu- lose and lignin had stronger absorption bands and dominated the highest intensity Fig. 1 FTIR spectra of chemical components of L. leucocephala bark a Group frequency region, b fin- gerprint region 13
Wood Science and Technology (2021) 55:295–313                                      301

range at 100.24 to 116.65 (a.u) and at 92.14 to 107.40 (a.u), respectively. Moreover,
extractives and the original bark had the lowest intensity ranges of 40.55–74.82 and
55.03–93.70 a.u, respectively.
   Compared to the original bark, extractives showed broader peaks and intersected
at 3538 cm−1 and 2871 cm−1 in the group frequency region. The peak of extractives
also were sharp at 2918 cm−1 and, at the same time, showed a new sharp peak at
2850 cm−1 (Fig. 1). The appearance of these two sharp peaks revealed the formation
of a new bond of the extractives.
   In the fingerprint region, the overlapping peak between the original bark and
extractives at 1753–1530 cm−1 indicates that the extractives have a similar composi-
tion after separation from the bark. The peaks are consistent with the same function-
alities in the tannin of L. leucocephala bark in this study. However, an extraction
reduces the absorbance intensity of extractives, even though bands of the functional
groups of the extractives remain unchanged (Eberhardt et al. 2007) due to an open-
ing of the cyclic ether structure of polyflavonoids (Soto et al. 2005).
   Holocellulose (hemicellulose and alpha-cellulose) was obtained by bleaching the
extractive-free bark using sodium chlorite to remove lignin. Hemicellulose is the
most unstable component and easily decomposes in sodium hydroxide (NaOH) solu-
tion. Thus, when holocellulose is treated with 17.5% NaOH, alpha-cellulose or cel-
lulose is obtained. These processes contributed to the disappearance of three peaks
of lignin in the cellulose spectrum, as illustrated in Fig. 1. The absence of lignin
caused OH peaks to appear in the cellulose spectrum, indicating that hemicellulose
and lignin were removed extensively during chemical treatment (Li et al. 2009).
Removal of extractives, pectin, hemicellulose and lignin from the original bark con-
tributed indirectly to the increase in the intensity absorbance of cellulose, as shown
in Fig. 1.
   Lignin extraction involves the breakdown of cellulose structures by sulfuric acid.
This concentrated acid is able to absorb water so strongly that it can breakdown
cellulose into carbon and water and subsequently separate lignin as a precipitate.

Fig. 2  FTIR spectra of extractives of L. leucocephala bark

                                                                           13
302 Wood Science and Technology (2021) 55:295–313 Figure 1 shows the absorbance intensity of lignin, which is lower than that of cel- lulose. Lignin intensity, however, was found to increase after the removal of extrac- tives, pectin and hemicellulose (Ciolacu et al. 2011). Extractives of bark Figure 2 shows the functional group of FTIR spectra of the extractives of Leucaena leucocephala bark. The broad and strong band at 3296 cm−1 was from the hydroxyl groups due to moisture in the bark. It is assigned as an OH stretch vibration in phenolic and ali- phatic structures. This finding is almost similar to findings by previous researchers, who found that the band at 3300 cm−1 represents the stretching vibration of hydro- gen bonded –OH groups in phenolic and aliphatic structures (Caron 2010; Williams and Fleming 1989). Feng et al. (2016) also found the broad spectra of OH stretching at the wavelengths of 3600–3200 cm−1, which may be attributed to the presence of phenolic OH. The two sharp and strong absorbed peaks that appeared at 2918 cm−1 (symmet- ric) and asymmetrically at 2850 cm−1 in Fig. 2 are attributed to the CH stretching vibration in the aromatic methoxyl group and methyl and methylene groups. Dirckx et al. (1992) also indicate that a similar value of the signal at 2850 cm−1 raised the C–H stretching vibration in the aromatic methoxyl groups of lignin and methyl (–CH3) and methylene (–CH2) groups of side chains. This is similar to a study by Ferreira et al. (2013), who found that major peaks at 2920 and 2851 cm−1 are mainly attributed to the aliphatic chains of suberin, accounting for asymmetric and sym- metric C–H stretching vibrations, respectively. Zhao et al. (2013) also imply that the main structures of the resins from bark changed to poly-aromatic structures during thermal degradation. The intensities of the peaks at 2914 and 2848 cm−1 were due to the aliphatic C H2 asymmetric stretch and aliphatic C H2 symmetric stretch, respec- tively. Lee and Lan (2006) also confirm that FTIR analysis showed that an aromatic compound is the main component in bark extracts. The shoulder peak at 1735 cm−1 in Fig. 2 is assigned to the carbonyl group, C=O. Previous researchers found that the presence of C=O stretching vibration at 1735 cm−1 corresponds essentially to the ester groups in suberin (Ferreira et al. 2013) and the carbonyl group (Eberhardt et al. 2007). Sinha and Rout (2009) also confirm the absorption bands at 1730 cm−1 assigned to C–O stretching in the car- boxyl and ketone groups. The peak centered at 1736 cm−1 is attributed to the acetyl and uronic ester groups of hemicellulose and ρ-coumaric acids of lignin and/or hemicellulose (Li et al. 2009). Moreover, Soto et al. (2005) suggest that the peaks between 1400 and 2000 cm−1 show the aromatic nature of the compound in the extract. C=C stretching in the aromatic ring appeared at 1612 cm−1 and 1442 cm−1 (Cheng et al. 2011; Feng et al. 2014). Figure 2 also shows that the intensities of the absorption bands at 1612, 1517 and 1442 cm−1 were due to the aromatic stretching vibration. At 1442 cm−1, OH in-plane deformation absorption bands were weaker. The intensity of the bands is attributed to the carbohydrates that have diminished 13
Wood Science and Technology (2021) 55:295–313                                        303

significantly in all extract spectra. This indicates that few carbohydrates have been
extracted under the experimental conditions.
   The presence of C–O–C stretch was detected at 1207 cm−1 (Dirckx et al. 1992;
Schwanninger et al. 2004) as shown in Fig. 2. Moreover, the lower intensity of the
peak was absorbed at 1062 cm−1 corresponding to –CO stretch vibration. Li et al.
(2009) also confirm that the peak at 1061 cm−1 is associated with the C–O stretching
that appeared in all of the spectra. The cyclic nature of the ether was reflected by the
signal located at 1030 cm−1, which was produced by the aliphatic C–O stretching.
However, Liu et al. (2010) declared that the region between 1000 and 1150 cm−1
corresponded to the strength vibration of C–OH side groups and the C–O–C gly-
cosidic bond vibration. Figure 2 shows the FTIR spectra of extractives of L. leuco-
cephala bark. The band intensity detected at 1000 cm−1 is attributed to C–OH side
groups (Feng et al. 2016), while the peak at 924 cm−1 region is assigned to the C-H
bending vibration (Liu et al. 2011a). Absorbance at 828 cm−1 is attributed to the
–CH bend in aromatics (Feng et al. 2016). The absorption peaks located at approxi-
mately 828 cm−1 are also attributed to –C–N stretching vibrations of the amine
groups (Shameli et al. 2012).

Cellulose of bark

Figure 3 shows a large and broader absorption band detected in the range of
3000–3750 cm−1 assigned to the stretching vibration of O–H groups.
   This finding is supported by Sathishkumar et al. (2013), who found that the region
at approximately 3340 cm−1 is attributed to hydroxyl group (OH) activities. Sara-
vanakumar et al. (2013) also showed that the peak that appeared at 3342 cm−1 was
due to the OH stretching of alpha-cellulose. The broad band in the 3600–3100 cm−1
region, which is due to the OH stretching vibration, gives considerable information
concerning the hydrogen bands, which can be correlated with the scission of the
intra- and inter-molecular hydrogen bonds (Ciolacu et al. 2011).

Fig. 3  FTIR spectra of cellulose of L. leucocephala bark

                                                                             13
304 Wood Science and Technology (2021) 55:295–313 The peak at 2899 cm−1 is attributed to the C–H stretching vibration (Fig. 3). Ciol- acu et al. (2011) found that the presence of amorphous cellulose samples can be fur- ther confirmed by the shift of the band from 2900 cm−1, which corresponded to the C–H stretching vibration. The peak at 2848 cm−1 is associated with the CH2 groups of cellulose and hemicellulose (Fiore et al. 2014; Indran et al. 2014). In Fig. 3, the peaks appearing at 2350 cm−1 are due to the presence of carbon dioxide, while the peaks at 2129 and 2019 cm−1 are assigned to the C=C stretch vibration. The appearance of these three peaks might possibly be due to the delig- nification of bark during cellulose extraction. Li et al. (2009) believe that the peak was predominantly contributed by the aromatic C=C stretching of the aromatic ring in the lignin since this peak disappeared in the other three spectra due to the removal of lignin. The band at the 1635 cm−1 region is attributed to the adsorbed water as reported by Liu et al. (2011a) for mulberry bark. The appearance of a tiny shoulder at 1437 cm−1 and the peak at 1376 cm−1 in Fig. 3 indicates the characteristic peaks of aromatic skeletal vibration (Liu et al. 2011a; Sun et al. 2005) and methoxyl vibra- tion (Moran et al. 2008), due to the presence of small amounts of lignin. In addition, the FTIR absorption band at 1430 cm−1 was related to the symmetric C H2 bending vibration (Ciolacu et al. 2011). This band is also known as the “crystallinity band," and a decrease in its intensity reflects a reduction in the degree of crystallinity of the samples (Ciolacu et al. 2011). Subramanium et al. (2005) found that the peak at approximately 1427 cm−1 and 1371 cm−1 corresponds to C H2 and CH groups of cel- lulose (Belouadah et al. 2015). The tiny peak found at 1317 cm−1 as shown in Fig. 3, is attributed to the presence of the small amount of C–O stretching vibration of the syringyl ring units (Ghitescu et al. 2015; Shi et al. 2011; Faix 1992), while the peak at 1158 cm−1 signifies the C–O–C groups of cellulose and hemicellulose (Seki et al. 2013; Belouadah et al. 2015). The sharp tiny peak located at 1160 cm−1 is linked to the C–O–C asymmetrical stretching. Liu et al. (2010) state that the region between 1000 and 1150 cm−1 corresponds to the strength vibration and the C–O–C glycosidic bond vibration, and this is almost similar to the peak at 1160 cm−1 as evidenced in Fig. 3. The broad sharp peak absorbed at the 1017 cm−1 region as shown in Fig. 3 is attributed to the C–O stretching vibration from the cellulose, which increased the peak intensity after the removal of pectin, hemicellulose and lignin (Liu et al. 2011b). Ciolacu et al. (2011) and Li et al. (2009) confirm that 897 cm−1 is associated with the C-H rocking vibra- tions of cellulose, which appeared in all of the spectra. The features of the charac- teristic region (1700–850 cm−1) are due to the constituents of alpha-cellulose, lignin and hemicellulose (Khan et al. 2005; Miao et al. 2016). The band at 891 cm−1, shown in Fig. 3 corresponds to the C-H rocking vibrations from the cellulose. How- ever, the presence of a peak at approximately 898 cm−1 is associated with the C–O groups, which are related to the β-glycosidic linkages (Reddy et al. 2014; Seki et al. 2013). The little peaks at approximately 662 cm−1 and 588 cm−1 correspond to the C–OH bending (Fan et al. 2012; De Rosa et al. 2010). These similar peaks are also found at 655 and 582 cm−1, as illustrated in Fig. 3. 13
Wood Science and Technology (2021) 55:295–313                                    305

Fig. 4  FTIR spectra of lignin of L. leucocephala bark

Lignin of bark

Figure 4 shows the FTIR spectrum of the lignin L. leucocephala bark. The band at
3319 cm−1 is attributed to the OH groups in lignin. Guo et al. (2008) found that the
broad band at 3412 cm−1 was dominated by the stretching vibrations of aromatic and
aliphatic OH groups.
   Peaks appearing at 2927 and 2855 cm−1 could possibly correspond to the C–H
stretching in the lignin molecules. Sahoo et al. (2011) found this chemical group
at 2919 and 2849 cm−1, and Guo et al. (2008) found that the peaks at 2925 and
2849 cm−1 predominantly arose from the C–H stretching in methyl of aromatic
and methylene groups of side chains and aromatic methoxyl groups. Similar find-
ings by El Mansouri and Salvado (2007) and Gosselink et al. (2004) indicated that
C–H stretch in methyl and methylene groups is present in regions between 3000 and
2800 cm−1.
   The presence of three small peaks at 2182, 2053 and 1948 cm−1, as shown in
Fig. 4, was attributed to the appearance of NCO from isocyanate groups. Schaber
et al. (2004) found this functional group peak at 2167 cm−1. The strong and
sharp peak at 1611 cm−1 was attributed to the aldehyde group of lignin. Wahab
et al. (2010) also confirmed this group at 1616 cm−1. According to Gosselink
et al. (2004), aromatic skeletal vibration bands were observed for all lignins at
1600 and 1500 cm−1 wavenumber ranges. Thus, the medium and sharp peaks
found at 1501 cm−1 in Fig. 4 could be attributed to CH deformation (methyl and
methylene), while the peak at 1447 cm−1 band could correspond to the aromatic
skeletal vibration combined with C-H in plane deformation. The peaks at 1460,
1510 and 1600 cm−1 in the FTIR spectra are assigned to C–H deformations
(asymmetric in methyl, methylene and methoxyl group), the aromatic skeletal
vibrations coupled with C–H in plane deformations, and the aromatic skeletal
vibrations, respectively (Tian et al. 2010).

                                                                         13
306 Wood Science and Technology (2021) 55:295–313 In Fig. 4, lignin structures at 1294 and 1241 cm−1 wavenumber ranges are possibly due to the C=O stretching of syringyl and guaiacyl ring, respectively. Shi et al. (2011) confirmed this compound at 1280 and 1120 cm−1, and Guo et al. (2008) affirmed this absorption at 1329 cm−1 (syringyl) and 1217 cm−1 (guaia- cyl). The peak at 1030 cm−1 corresponded to the guaiacyl type units (Fig. 4). However, Kosikova and Slavikova (2004) found that the C–O bands at 1097 and 1035 cm−1 were connected to the secondary and primary alcohols, respectively. They do not disappear because they fall together with the C–O stretch from ali- phatic ethers and the aromatic guaiacyl type C–H, respectively, both of which were unaffected by the butyration reaction. The small peak at 822 cm−1 is attributed to the C–H stretch vibration, and two peaks appeared at 618 and 542 cm−1 band corresponding to the C–H bend, as shown in Fig. 4. Dirckx et al. (1992) and Schwanninger et al. (2004) also found that the aromatic –CH stretch vibration was detected for all wavenumbers less than 900 cm−1. Main chemical functional groups of Leucaena leucocephala stem bark Based on the results and discussion, the functional groups of extractives, cellulose and lignin of Leucaena leucocephala stem bark are summarized in Table 1. Aromatic compounds were the main functional groups (Table 1). They appear sharply at 1612, 1517 and 1442 cm−1 band, followed by methyl and methylene at 2918 and 2850 cm−1 wavenumber range, while a strong, broad and wide peak in the 3296 cm−1 region is dedicated to the hydroxyl group. The rest of the compounds, which existed as small peaks (carbonyl and ether), tiny (alkene) and very tiny shapes (alkane), appeared weak and less functional in the bark extractives. Accord- ing to Feng et al. (2016), IR spectra of all the bark are similar with respect to the IR absorbance of some typical functional groups, i.e., (a) aromatics, (b) methylene (–CH2-), (c) C–O–C and (d) Ar–CH. Table 1 also lists the carbonyl and hydroxyl groups as the main functional groups of cellulose. Carbonyl and hydroxyl possess the highest intensity and sharp peak at 1017 cm−1 and broad and wide peak at 3318 cm−1, respectively. H–O–H deforma- tion of absorbed water was observed at 1635 cm−1, while a methyl group existed in the 2899 cm−1 region. The peaks were of sharp shape and medium width. Carbon dioxide, alkyne, alkane, carbonyl and carboxyl groups, on the other hand, were pre- sent as small and tiny peaks. Apart from that, ethers, methyl and carboxyl existed as very tiny peaks and with less functionality. The formation of inter- and intra-molec- ular hydrogen bonds in the cellulose not only has a strong influence on the physi- cal properties of cellulose, including solubility (Kondo et al. 1994; Kondo 1997), hydroxyl reactivity (Kondo 1997) and crystallinity (Itagaki et al. 1997), but also plays an important role in the mechanical properties of the cellulose (Kondo et al. 1994). For lignin, carbonyl (1611 cm−1), carboxyl (1030 cm−1) and hydroxyl (3319 cm−1) were the main functional groups, where the peaks clearly appeared with broad, sharp and wide shapes (Table 1). The majority of the chemical function 13
Wood Science and Technology (2021) 55:295–313 307
Table 1 Summary of the peak location and shape of the IR bands of the main chemical functional groups
of L. leucocephala stem bark obtained from FTIR analysis
Component Peak Functional group Peak shape/size
wavenumber
(cm−1)
Extractive 3296 OH Phenolic and aliphatic structures Broad, width
2918 C–H Methylene group Broad, sharp
2850 C–H Methyl, methylene and methoxyl Medium, sharp
groups
1735 C–O Carbonyl Shoulder
1612 C=C Aromatic Broad, sharp
1517 C=C Aromatic Medium, sharp
1442 C=C Aromatic Broad, sharp
1207 C–O–C Ether Small
1062 C–O Carbonyl Small
1000 C–OH Carboxyl Very tiny
924 C–H Alkene Tiny
828 C–H Alkane Very tiny
Cellulose 3318 OH Hydroxyl group for alpha-cellulose Broad
2899 C–H Methyl group Medium
2350 –COO Carbon dioxide Small
2129 C=C Alkyne Small
2019 C=C Alkene Tiny sharp
1635 H–O-H Adsorbed water Medium
1437 CH2 Alkane Tiny
1376 C–H Alkane Tiny
1317 C–O Carbonyl Tiny sharp
1160 C–O–C Ethers Very tiny sharp
1017 C–O Carbonyl High, sharp
891 C–H Methyl Very tiny shoulder
655 C–OH Carboxyl Asymmetric tiny shoulder
582 C–OH Carboxyl Very tiny
13308 Wood Science and Technology (2021) 55:295–313
Table 1 (continued)
Component Peak Functional group Peak shape/size
wavenumber
(cm−1)
Lignin 3319 OH Aromatic and aliphatic OH groups Broad, width
2927 C–H Methyl, methylene and methoxyl Medium
groups
2855 C–H Methyl, methylene and methoxyl Very tiny
groups
2182 NCO Isocyanate groups Small sharp
2053 NCO Isocyanate groups Small sharp
1948 NCO Isocyanates groups Small sharp
1611 C=O Aldehyde groups Broad, sharp
1501 C–H C-H deformation (methyl and meth- Medium, sharp
ylene)
1447 C–H Aromatic skeletal vibration combined Medium, sharp
with C-H in plane deformation
1294 C–O C-O stretching of syringyl ring Very tiny shoulder
1241 C–O C-O stretching of guaiacyl ring Medium
1030 C–OH C–OH stretch vibration in Guaiacyl Broad
units
822 C–H C-H rock vibration Very tiny
618 C–H Alkyne Very tiny
542 C–H Alkanes Tiny sharp
of lignin spectra is attributed to the methyl, methylene and methoxyl groups (2927,
2855, 1501 and 1447 cm−1), which existed in medium sharp peaks. Isocyanate
and aromatic compounds were also detected in lignin as small, sharp and very tiny
peaks. According to Gosselink et al. (2004), the hydroxyl, methoxyl, carbonyl, and
carboxyl groups are the most important chemical functional groups in lignin, and
they can be used for its identification (Shamsuri and Abdullah, 2010). However,
lignin should be differentiated according to the hydroxyl groups and amine contents
(Sahoo et al. 2011).
Conclusion
Leucaena leucocephala barks were characterized to determine their chemical
functional groups. The extractives, cellulose and lignin of L. leucocephala bark
were extracted through separation methods before the functional groups were
determined. The research results found that the separation of the extractives from
13Wood Science and Technology (2021) 55:295–313 309
the original bark did not change the bands of the functional groups; however, the
absorbance intensity weakened in the group frequency and fingerprint regions.
Removal of extractives, pectin, hemicellulose and lignin from the original bark
contributed indirectly to the increase in the intensity absorbance of cellulose.
Broad peaks of OH stretching were found for all the spectra, which are attributed
to the presence of phenolic OH and aliphatic structures of extractives and the aro-
matic structures of lignin. This study also contributed to the abundant informa-
tion concerning hydrogen bonds, which were correlated with the scission of the
intra- and inter-molecular hydrogen bonds of cellulose. Overall, the results from
this study indicate that an aromatic compound is the main chemical functional
group of extractives, while water, carbonyl and ether are the main components of
cellulose. In addition, it was found that methyl, methylene, carbonyl and carboxyl
groups are the main chemical functional groups of lignin in L. leucocephala stem
bark.
Acknowledgements This research is supported by the UMS Great (GUG0217-1/2018). We thank
our colleagues from the Forestry Complex Laboratory, UMS, especially Mr. Airin Termin, Mr. David
Kungin, Mr. Rizan Gulam Hussein, Mr. Erwan Silin, Mr. Azli Sulid, Mr. Seliman Rajion, Mr. Rozaidi
Hassan, Mr. Ahmad Dasuki, Mdm. Nermalawati Nazri, Mdm. Valenah Lawrence and from the Science
Complex Laboratory, our appreciation goes to Mr. Taipin & Mdm. Juliana for their technical support
and expertise that greatly assisted the research. We also acknowledge the financial support awarded by
the Ministry of Higher Education Malaysia (KPT) that provides the grant and scholarship throughout the
research period.
Open Access This article is licensed under a Creative Commons Attribution 4.0 International License,
which permits use, sharing, adaptation, distribution and reproduction in any medium or format, as long as
you give appropriate credit to the original author(s) and the source, provide a link to the Creative Com-
mons licence, and indicate if changes were made. The images or other third party material in this article
are included in the article’s Creative Commons licence, unless indicated otherwise in a credit line to the
material. If material is not included in the article’s Creative Commons licence and your intended use is
not permitted by statutory regulation or exceeds the permitted use, you will need to obtain permission
directly from the copyright holder. To view a copy of this licence, visit http://creativecommons.org/licen
ses/by/4.0/.
References
Ab Rahman H, Wan Abdul Rahman WMN, Razali NA, Kassim J, Sa’ad MF, Japaruddin Y, Ogawa N
(2018) Properties of fibreboard made from cultivated Leucaena leucocephala and Rubberwood. Int
J Eng Technol 7(4.18):346–349
Ahmad Z, Wee LS, Fauzi MA (2011) Mechanical properties of wood-wool cement composite board man-
ufactured using selected Malaysian fast grown timber species. ASM Sci J 5(1):27–35
American Society for Testing Materials, ASTM D1103 (2001) Standard test method for alpha-cellulose
of wood. Annu Book ASTM Stand 4(10):173–174
American Society for Testing and Materials, ASTM D1105 (2001) Standard test method for preparation
of extractive-free wood D1105–96 (Reapproved 2001). Annu Book ASTM Stand 4(10):177–178
American Society for Testing Materials, ASTM D1106 (2001) Standard test method for acid-insoluble
lignin of wood D1106–96 (Reapproved 2001). Annu Book ASTM Stand 4(10):179–180
Babatunde A (2008) Effect of wood density on bending strength and dimensional movement of flake
boards from Gmelina arborea and Leuceana leucocephala In: Proceedings 11th Int. Organic-
bonded Fiber Composite Conference, Madrid, 2008:260–266
13310 Wood Science and Technology (2021) 55:295–313
Belouadah Z, Ati A, Rokbi M (2015) Characterization of new natural cellulosic fiber from Lygeum spar-
tum L. Carbohyd Polym 134:429–437. https://doi.org/10.1016/j.carbpol.2015.08.024
Caron A (2010) Extractives from Sitka Spruce. Dissertation, University of Glasgow, pp 161–171
Cheng SN, D’Cruz I, Yuan ZS, Wang MC, Anderson M, Leitch M, Xu CC (2011) Use of bio-crude
derived from woody biomass to substitute phenol at high-substitution level for the production of
bio-based phenolic resole resins. J Appl Polym Sci 121:2743–2751
Ciolacu D, Ciolacu F, Popa VI (2011) Amorphous cellulose-structure and characterization. Cellul Chem
Technol 45:13–21
Conde E, Cadahia E, Diez-Barra G-V, MC, (1996) Polyphenolic composition of bark extracts from
Eucalyptus camaldulensis, E. globulus and E. rudis. Holz Roh- Werkst 54:175–181. https://doi.
org/10.1007/s001070050162
De Rosa IM, Kenny JM, Puglia D, Santulli C, Sarasini F (2010) Morphological, thermal and mechani-
cal characterization of Okra (Abelmoschus esculentus) fibres as potential reinforcement in polymer
composites. Compos Sci Technol 70(1):116–122
Dirckx O, Triboulot-Trouy M, Merlin A, Deglise X (1992) Changes in the color of Abies grandis wood
exposed to sunlight. Ann For Sci 49:425–447
Eberhardt TL, Li X, Shupe TF, Hse CY (2007) Chinese Tallow Tree (Sapium sebiferum) Utilization:
characterization of extractives and cell-wall chemistry. Wood Fiber Sci 39(2):319–324
El Mansouri NE, Salvadó J (2007) Analytical methods for determining functional groups in various tech-
nical lignins. Ind Crops Prod 26(2):116–124. https://doi.org/10.1016/j.indcrop.2007.02.006
Faix O (1992) Fourier transform infrared spectroscopy. In: Lin SY, Dence CW (eds) Methods in lignin
chemistry. Springer, Berlin, pp 83–109
Fan M, Dai D, Huang B (2012). Fourier transform infrared spectroscopy for natural fibres. Fourier Trans-
form-Materials Analysis, pp 45–68
Feng SH, Yuan ZH, Leitch M, Xu CC (2014) Hydrothermal liquefaction of barks into bio-crude-effects
of species and ash content/composition. Fuel 116:214–220
Feng S, Yuan Z, Leitch M, Shui H, Xu CC (2016) Effects of bark extraction before liquefaction and liq-
uid oil fractionation after liquefaction on bark-based phenol formaldehyde resoles. Ind Crops Prod
84:330–336. https://doi.org/10.1016/j.indcrop.2016.02.022
Fengel D, Wegener G (1984) Wood: chemistry, ultrastructure reactions. Walter de Gruyter, Berlin, pp
240–265
Ferreira R, Garcia H, Sousa AF, Freire CSR, Silvestre AJD, Rebelo LPN, Pereira CS (2013) Isolation of
suberin from birch outer bark and cork using ionic liquids: a new source of macromonomers. Ind
Crops Prod 44:520–527. https://doi.org/10.1016/j.indcrop.2012.10.002
Fiore V, Scalici T, Valenza A (2014) Characterization of a new natural fiber from Arundo donax L. as
potential reinforcement of polymer composites. Carbohyd Polym 106:77–83
Ghitescu R, Volf I, Carausu C, Bühlmann A, Gilca IA, Popa VI (2015) Optimization of ultrasound-
assisted extraction of polyphenols from spruce wood bark. Ultrason Sonochem 22:535–541. https://
doi.org/10.1016/j.ultsonch.2014.07.013
Gonzalez-Vila FJ, Tinoco P, Almendros G, Martin F (2010) Pyrolysis-GC-MS analysis of the forma-
tion and degradation stages of charred residues from lignocellulosic biomass. J Agric Food Chem
49(3):1128–1131
Gosselink RJA, Abächerli A, Semke H, Malherbe R, Käuper P, Nadif A, Dam JEG, Van, (2004) Ana-
lytical protocols for characterisation of sulphur-free lignin. Ind Crops Prod 19:271–281. https://doi.
org/10.1016/j.indcrop.2003.10.008
Guo X, Zhang S, Shan X (2008) Adsorption of metal ions on lignin. J Hazard Mater 151(1):134–142.
https://doi.org/10.1016/j.jhazmat.2007.05.065
Indran S, Raj RE, Sreenivasan V (2014) Characterization of new natural cellulosic fiber from Cissus
quadrangularis root. Carbohyd Polym 110:423–429
Itagaki H, Tokai M, Kondo T (1997) Physical gelation process for cellulose whose hydroxyl groups are
regioselectively substituted by fluorescent groups. Polymer 38(16):4201–4205
Khan MA, Masudul Hassan M, Drzal LT (2005) Effect of 2-hydroxyethyl methacrylate (HEMA) on the
mechanical and thermal properties of jute-polycarbonate composite. Compos A Appl Sci Manuf
36(1):71–81
Kondo T (1997) The assignment of IR absorption bands due to free hydroxyl groups in cellulose. Cel-
lulose 4(4):281–292
Kondo T, Sawatari C, Gray MRSJ, DG, (1994) Characterization of hydrogen bonding in cellulose-syn-
thetic polymer regioselectively substituted methylcellulose. Macromolecules 27(1):210–215
13Wood Science and Technology (2021) 55:295–313 311
Košikova B, Slavikova E (2004) Biotransformation of lignin polymers derived from Beech wood pulping
by Sporobolomyces roseus isolated from leafy material. Biotech Lett 26:517–519
Kothiyal V, Raturi A, Kaler A (2012) Klason lignin estimation in Leucaena leucocephala by near infra-
red spectroscopy for selection of superior material for pulp and paper. J Indian Acad Wood Sci
9(2):105–114. https://doi.org/10.1007/s13196-012-0078-z
Lee WJ, Lan WC (2006) Properties of resorcinol–tannin–formaldehyde copolymer resins prepared
from the bark extracts of Taiwan Acacia and China Fir. Biores Technol 97:257–264. https://doi.
org/10.1016/j.biortech.2005.02.009
Li R, Fei J, Cai Y, Li Y, Feng J, Yao J (2009) Cellulose whiskers extracted from mulberry: a novel bio-
mass production. Carbohyd Polym 76(1):94–99. https://doi.org/10.1016/j.carbpol.2008.09.034
Liu L, Cao J, Huang J, Cai Y, Yao J (2010) Extraction of pectins with different degrees of esterifica-
tion from Mulberry branch bark. Biores Technol 101(9):3268–3273. https://doi.org/10.1016/j.biort
ech.2009.12.062
Liu L, Jiang T, Yao J (2011a) A two-step chemical process for the extraction of cellulose fiber and pectin
from Mulberry branch bark efficiently. Polym Environ 19:568–573. https://doi.org/10.1007/s1092
4-011-0300-x
Liu Q, Zhong Z, Wang S, Luo Z (2011b) Interactions of biomass components during pyrolysis: a TG-
FTIR study. J Anal Appl Pyrol 90:213–218. https://doi.org/10.1016/j.jaap.2010.12.009
Marzuki AR, Rahim S, Hamidah M, Ahmad Ruslan R (2011) Effects of wood: cement ratio on mechani-
cal and physical properties of three-layered cement-bonded particleboards from Leucaena leuco-
cephala. J Trop For Sci 23(1):67–72
Miao X, Lin J, Tian F, Li X, Bian F, Wang J (2016) Cellulose nanofibrils extracted from the byproduct of
cotton plant. Carbohyd Polym 136:841–850. https://doi.org/10.1016/j.carbpol.2015.09.056
Morán JI, Alvarez VA, Cyras VP, Vázquez A (2008) Extraction of cellulose and preparation of nanocel-
lulose from sisal fibers. Cellulose 15:149–159
MTIB (2017) Malaysian Timber Industry Board (MTIB). Forest Plantation Programme. Retrieved from
MTIB: http://www.mtib.gov.my/index.php?option=com_content&view=article&id=94. Accessed
3rd July 2017
Niokhor P, Stevanovic T, Cloutier A (2009) Study on chemical composition, antioxidant and anti-inflam-
matory activities of hot water extract from Picea mariana bark and its proanthocyanidin-rich frac-
tions. Food Chem 113(4):897–902. https://doi.org/10.1016/j.foodchem.2008.08.016
Pereira H, Graca J, Rodrigues JC (2003) Wood chemistry in relation to quality. In: Barnett JR, Jeron-
imidis G (eds) Wood quality and its biological basis, vol 3. CRC Press. Blackwell Publishing,
Oxford, pp 53–83
Pietarinen SP, Willfor SM, Ahotupa MO, Hemming JE, Holmbom BR (2006) Knotwood and bark
extracts: strong antioxidants from waste materials. J Wood Sci 52:436–444. https://doi.
org/10.1007/s10086-005-0780-1
Reddy KO, Ashok B, Reddy KRN, Feng Y, Zhang J, Rajulu AV (2014) Extraction and characteri-
zation of novel lignocellulosic fibers from Thespesia lampas plant. Int J Polym Anal Charact
19(1):48–61
Roggo Y, Chalus P, Maurer L, Lema-martinez C, Jent N (2007) A review of near infrared spectros-
copy and chemometrics in pharmaceutical technologies. J Pharm Biomed Anal 44:683–700.
https://doi.org/10.1016/j.jpba.2007.03.023
Rutherford DW, Wershaw RL, Rostad CE, Kelly CN (2012) Effect of formation conditions on bio-
chars: compositional and structural properties of cellulose, lignin and pine biochars. Biomass
Bioenerg 46:693–701. https://doi.org/10.1016/j.biombioe.2012.06.026
Sahoo S, Seydibeyoglu MO, Mohanty AK, Misra M (2011) Characterization of industrial lignins for
their utilization in future value added applications. Biomass Bioenerg 35:4230–4237. https://doi.
org/10.1016/j.biombioe.2011.07.009
Salim R, Asik, J, Sarjadi, MS (2019) Acidity, solubility and chemical utilization of local Leucaena
leucocephala stem bark. J Mech Eng Res Dev 42:194–201. https://doi.org/10.26480/jmerd
.05.2019.194.201
Saravanakumar SS, Kumaravel A, Nagarajan T, Sudhakar P, Baskaran R (2013) Characterization of
a novel natural cellulosic fiber from Prosopis juliflora bark. Carbohyd Polym 92(2):1928–1933.
https://doi.org/10.1016/j.carbpol.2012.11.064
Sathishkumar T, Navaneethakrishnan P, Shankar S, Rajasekar R (2013) Characterization of new cel-
lulose Sansevieria ehrenbergii fibers for polymer composites. Compos Interf 20(8):575–593
13312 Wood Science and Technology (2021) 55:295–313
Schaber PM, Colson J, Higgins S, Thielen D, Anspach B, Brauer J (2004) Thermal decomposition
(pyrolysis) of urea in an open reaction vessel. Thermochim Acta 424:131–142
Schwanninger M, Rodrigues JC, Pereira H, Hinterstoisser B (2004) Effects of short-time vibratory
ball milling on the shape of FT-IR spectra of wood and cellulose. Vib Spectrosc 36:23–40
Seki Y, Sarikanat M, Sever K, Durmus¸ Kahya C, (2013) Extraction and properties of Ferula com-
munis (chakshir) fibers as novel reinforcement for composites materials. Compos B Eng
44(1):517–523
Sen A, Miranda I, Santos S, Graca J, Pereira H (2010) The chemical composition of cork and phloem in
the rhytidome of Quercus cerris bark. Ind Crops Prod 31:417–422. https://doi.org/10.1016/j.indcr
op.2010.01.002
Shameli K, Ahmad M, Al-mulla EAJ, Ibrahim NA, Shabanzadeh P, Rustaiyan A, Zidan M (2012) Green
biosynthesis of silver nanoparticles using Callicarpa maingayi stem bark extraction. Molecules
17:8506–8517. https://doi.org/10.3390/molecules17078506
Shamsuri AA, Abdullah DK (2010) Isolation and characterization of lignin from rubber wood in ionic
liquid medium. Mod Appl Sci 4(11):19–27
Shi H, Fatehi P, Xiao H, Ni Y (2011) A combined acidification/PEO flocculation process to improve
the lignin removal from the pre-hydrolysis liquor of kraft-based dissolving pulp production process.
Biores Technol 102(8):5177–5182. https://doi.org/10.1016/j.biortech.2011.01.073
Sinha E, Rout S (2009) Influence of fibre-surface treatment on structural, thermal and mechanical proper-
ties of jute fibre and its composite. Bull Mater Sci 32(1):65–76
Soto R, Freer J, Baeza J (2005) Evidence of chemical reactions between di- and poly-glycidyl ether resins
and tannins isolated from Pinus radiata D. Don Bark Bioresour Technol 96:95–101
Subramanian K, Kumar PS, Jeyapal P, Venkatesh N (2005) Characterization of lignocellulosic seed fibre
from Wrightia Tinctoria plant for textile applications-An exploratory investigation. Eur Polymer J
41(4):853–861
Sun XF, Xu F, Sun RC, Fowler P, Baird MS (2005) Characteristics of degraded cellulose obtained from
steam-exploded wheat straw. Carbohydr Res 340:97–106
Tian M, Wen J, MacDonald D, Asmussen RM, Chen A (2010) A novel approach for lignin modifica-
tion and degradation. Electrochem Commun 12(4):527–530. https://doi.org/10.1016/j.eleco
m.2010.01.035
Tsuchikawa S (2007) A review of recent near infrared research for wood and paper. Appl Spectrosc Rev
42(1):43–71. https://doi.org/10.1080/05704920601036707
Valentín L, Kluczek-turpeinen B, Willfor S, Hemming J, Hatakka A, Steffen K, Tuomela M (2010) Scots
pine (Pinus sylvestris) bark composition and degradation by fungi: potential substrate for bioreme-
diation. Biores Technol 101(7):2203–2209. https://doi.org/10.1016/j.biortech.2009.11.052
Wahab MA, Jellali S, Jedidi N (2010) Ammonium biosorption onto sawdust: FTIR analysis, kinetics and
adsorption isotherms modeling. Biores Technol 101(14):5070–5075. https://doi.org/10.1016/j.biort
ech.2010.01.121
Wan Mohd Nazri WAR, Jamaludin K, Rudaini MN, Rahim S, Nur Yuziah MY (2009) Effect of chemical
components on properties of oriented strand board from “Leucaena leucocephala” wood. J Trop For
Sci 21(4):353–360
Williams DH, Fleming I (1989) Spectroscopic method in organic chemistry, 4th edn. McGraw Hill
Higher Education, United States, pp 85–121
Xavier D, Emmanuel F, Philippe G, Eric M (2012) Spruce bark hydrolysis to optimize phenolic content.
Cellul Chem Technol 46(9–10):541–550
Yang L, Sun X, Yang F, Zhao C, Zhang L, Zu Y (2012) Application of ionic liquids in the microwave-
assisted extraction of proanthocyanidins from Larix gmelini bark. Int J Mol Sci 13:5163–5178. https
://doi.org/10.3390/ijms13045163
Zhao Y, Yan N, Feng MW (2013) Thermal degradation characteristics of phenol-formaldehyde resins
derived from beetle infested pine barks. Thermochim Acta 555:46–52. https://doi.org/10.1016/j.
tca.2012.12.002
Publisher’s Note Springer Nature remains neutral with regard to jurisdictional claims in published
maps and institutional affiliations.
13Wood Science and Technology (2021) 55:295–313 313
Authors and Affiliations
Rafidah Md Salim1 · Jahimin Asik2 · Mohd Sani Sarjadi2
* Rafidah Md Salim
rafidahs@ums.edu.my
1
Wood Chemistry Laboratory, Forestry Complex, Faculty of Science and Natural Resources,
Universiti Malaysia Sabah, UMS Road, Kota Kinabalu, Sabah 88400, Malaysia
2
Industrial Chemistry Department, Science Complex, Faculty of Science and Natural Resources,
Universiti Malaysia Sabah, UMS Road, Kota Kinabalu, Sabah 88400, Malaysia
13You can also read