Freezing resistance evaluation of rose stems during frost dehardening using electrical impedance tomography
←
→
Page content transcription
If your browser does not render page correctly, please read the page content below
Qian et al. BMC Plant Biology    (2021) 21:199
https://doi.org/10.1186/s12870-021-02976-w

 RESEARCH ARTICLE                                                                                                                                    Open Access

Freezing resistance evaluation of rose
stems during frost dehardening using
electrical impedance tomography
Ji Qian1* , Juan Zhou2†, Ruijuan Gong3†, Yang Liu4 and Gang Zhang1

  Abstract
  Background: Electrical impedance tomography (EIT) has rarely been applied in plant science, particularly to study
  plant resistance to abiotic and biotic stresses. In this study, we evaluated the freezing resistance of floribunda roses
  (Rosa Floribunda) during frost dehardening using the EIT technique to identify a new method for rapid and non-
  destructive measurement of plant freezing resistance.
  Results: The current was the excitation source, the boundary voltage value was measured, and then the boundary
  voltage reconstructed value was formed. Using an imaging algorithm, the two-dimensional (2D) distribution of
  impedance or impedance variation was reconstructed. The EIT reconstructed values decreased obviously with the
  decline in freezing temperatures. The EIT reconstructed values of stems had the best fit to the logistic equation,
  and subsequently, the semi-lethal temperatures were calculated. The freezing resistance results evaluated using EIT
  reconstructed values were linearly correlated with the results of the traditional electrolyte leakage (EL) method (r =
  0.93, P < 0.01).
  Conclusions: In conclusion, after freezing tests, the reconstructed values of EIT images could be used to
  quantitatively evaluate the freezing resistance of floribunda rose stems. The present study provides a reference for
  the further application of the EIT technique for non-destructive and rapid detection of plant freezing resistance.
  Keywords: Electrical impedance tomography, Electrolyte leakage, Image processing, Image reconstruction, Plant
  freezing resistance

Background                                                                              species or variety and for cultivation potential evaluations.
The ability to survive sub-freezing temperatures is the single                          These methods are also needed in breeding and selection
most important factor limiting the distribution of many tree                            work and in studies of the mechanisms of frost injury, frost
species and affecting woody plant growth, development and                               hardening and dehardening. Freezing resistance is usually
many genetic, physiological and biochemical responses [1, 2].                           measured by exposing plant tissues or organs to controlled
To obtain the correct information of changes in freezing re-                            freezing temperatures and then quantifying tissue damage by
sistance in different stages of the annual growth cycle of                              one or more methods. Research on the identification and
woody plants, precise and reliable methods for the estima-                              testing of freezing resistance has so far achieved considerable
tion of freezing resistance are extremely important for a tree                          results and experience, but there is still room for progress
                                                                                        [2]. Steponkus and Lanphea [3] proposed the definition of an
* Correspondence: qianji167@163.com                                                     ideal method of testing for freezing resistance. However, ap-
†
 Juan Zhou and Ruijuan Gong contributed equally to this work.                           plication of the measures for studying, evaluating, and identi-
1
 College of Horticulture, Hebei Agriculture University, Baoding 071000, Hebei,
China
                                                                                        fying freezing resistance is constrained by many factors, such
Full list of author information is available at the end of the article                  as tree species, organs, tissue types, and physiological
                                         © The Author(s). 2021 Open Access This article is licensed under a Creative Commons Attribution 4.0 International License,
                                         which permits use, sharing, adaptation, distribution and reproduction in any medium or format, as long as you give
                                         appropriate credit to the original author(s) and the source, provide a link to the Creative Commons licence, and indicate if
                                         changes were made. The images or other third party material in this article are included in the article's Creative Commons
                                         licence, unless indicated otherwise in a credit line to the material. If material is not included in the article's Creative Commons
                                         licence and your intended use is not permitted by statutory regulation or exceeds the permitted use, you will need to obtain
                                         permission directly from the copyright holder. To view a copy of this licence, visit http://creativecommons.org/licenses/by/4.0/.
                                         The Creative Commons Public Domain Dedication waiver (http://creativecommons.org/publicdomain/zero/1.0/) applies to the
                                         data made available in this article, unless otherwise stated in a credit line to the data.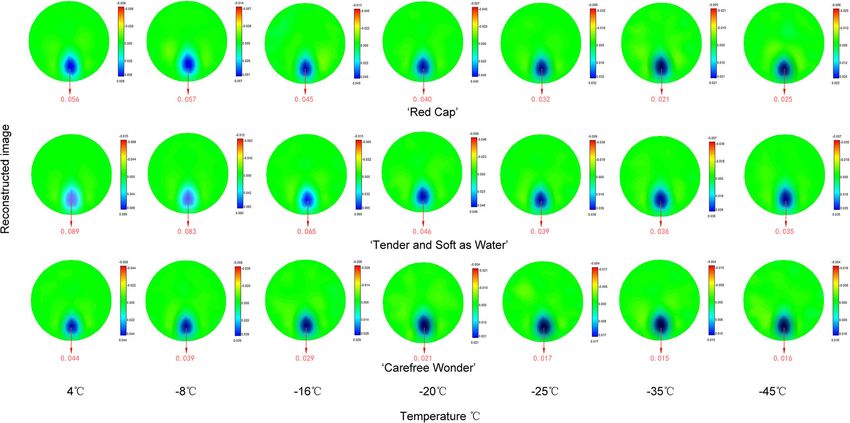
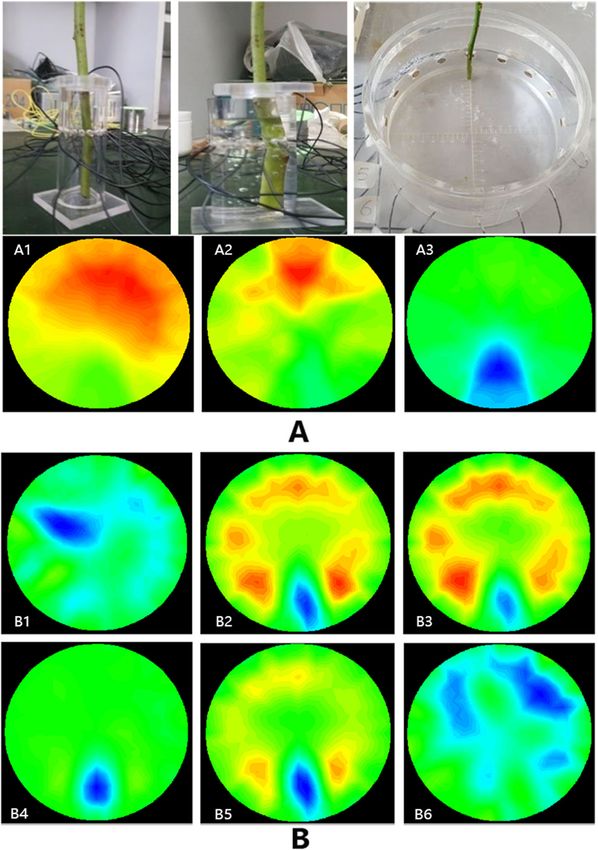
Qian et al. BMC Plant Biology   (2021) 21:199                                                                            Page 2 of 12

conditions of trees, as well as research objectives and instru-      freezing resistance in plants and for application to plant
ments. Since 19th-century studies of freezing resistance in          resistance, breeding and other fields. We hypothesized
plants, the methods to measure freezing resistance have in-          that the EIT images of plants are altered under low
volved traditional direct field observations such as visually        temperature stress. With this technique, we used the
scoring damage and using the electrolyte leakage method; In          current as the excitation, measured the boundary voltage
recent years, Aslamarz A. A. and other researchers have used         value, and then form the boundary voltage reconstructed
Triphenyl Tetrazolium Chloride Assay (TTC), Proline Ana-             value. The distribution of electrical impedance inside the
lysis and Computer Assisted Thermal Analysis (TA) to study           plant was calculated using an imaging algorithm. Then,
the cold tolerance of plants [4–7]. However, these methods           the two-dimensional (2D) distribution of impedance or
have time-consuming and laborious drawbacks, and several             impedance variation was reconstructed. Under low
days are required to complete the determination of freezing          temperature stress, the expected resistivity will decrease;
resistance. Thus far, no ideal method has been widely ac-            the freezing resistance of plants was characterized dir-
cepted as a reliable and efficient means of testing plant freez-     ectly and quantitatively by image reconstruction (Fig. 1).
ing resistance. Improving and innovating the identification
and test method of freezing resistance is essential and will pro-    Results
vide a significant direction for studies on plant freezing resist-   Evaluation of EIT reconstruction quality
ant physiology. To achieve such an ideal method, studies             Based on the brain model of the Laboratory of Biomedical En-
based on the existing method and the development of a new            gineering, the Fourth Military Medical University and com-
method are great challenges for freezing resistance                  bined with the present experimental plant material, a test
researchers.                                                         device with a plexiglass container with a radius of 2, 4 or 8 cm
   In 1978, Henderson and Webster [8] applied the Electrical         was customized at Tsinghua University, and 16 electrodes
Impedance Tomography (EIT) technique to the study of pul-            were placed equidistantly on the wall of the device (Fig. 2a).
monary oedema and generated the first impedance image. In              To determine the test parameters used for the freezing
recent years, the EIT technique has developed rapidly, some          resistance measurement, 5 different rose stem diameters
researchers have used EIT technology to study the medical            of approximately 2, 3, 4, 5, and 6 mm; 6 different excita-
field, soil properties, wood decay and phenotypic information        tion current intensities of 100, 150, 200, 250, 300, and
of plant roots [9–28]. Corona-Lopez [14] and Li, X et al. [15]       500 μA (Fig. 2b); and 4 different current frequencies of
conducted root in situ detection on the soil-root system to          1, 50, 100, and 150 kHz were applied (Fig. 3a).
obtain the sectional images of the roots of trees and seeds of         In the physical model, the experimental parameters of
Brassica napus L. (Variety Temple), and to determine the             the best reconstructed image were obtained when the
morphological information of the roots. But the EIT tech-            size and frequency of the excitation current were 250 μA
nique has rarely been applied in plant resistance to abiotic         and 1 kHz, respectively (Figs. 2, 3b, a), the inner diam-
and biotic stresses. According to Bera [21], under alternating       eter of the test device radius was 8 cm and the diameter
electrical excitation, biological tissues produce complex elec-      of the rose stems was greater than 4 mm (Figs. 3b).
trical impedance that depends on tissue composition, struc-            Serious noise occurred in the reconstructed image, and
tures, health status, and applied signal frequency, and hence        the measured stem of the rose could not be clearly distin-
the bioelectrical impedance methods can be utilized for non-         guished when the device had a radius of 2 or 4 cm (Fig. 2
invasive tissue characterization. Over the past few decades, a       A1, A2), whereas the measured stem could be distin-
number of           impedance-based non-invasive           tissue    guished in the image when the device had a radius of 8 cm
characterization techniques such as EIT have been proposed,          (Fig. 2 A3). When the electrode spacing was greater than
and numerous studies have been conducted using these                 1 cm, the stem size, shape and position could be obtained
methods for non-invasive tissue characterization and disease         from the reconstructed image shown in Fig. 2 A3.
diagnosis. Thus, EIT might be used to realize real-time mon-           When the diameter of the rose stem was 5.68 mm, i.e., lar-
itoring of plant resistance without damaging the plant.              ger than 4 mm, and the excitation current frequency was 1
   In the present study, the EIT technique was used to               kHz, the reconstructed image changed with the magnitude of
evaluate the freezing resistance of three floribunda rose            the excitation current (Fig. 2b). The reconstructed image was
(Rosa Floribunda) varieties under a controlled freezing              optimum when the excitation current was 250 μA (Fig. 2 B4).
test during frost dehardening. The semi-lethal                         When the rose stem diameter was 5.68 mm and the
temperature (LT50, temperature at which 50% of the                   excitation current was 250 μA, the reconstructed image
plants are killed) was calculated and compared with that             changed with the excitation current frequency (Fig. 3a).
obtained by the traditional electrolyte leakage (EL)                 The reconstructed image was optimum when the excita-
method. The freezing resistance among varieties was                  tion current frequency was 1 kHz (Fig. 3 A1).
analysed using EIT with the aim of identifying a new                   The different stem diameters of roses were 2.45 mm,
technique for rapid and non-destructive detection of                 3.23 mm, 4.44 mm, 5.63 mm and 6.29 mm. Each
Qian et al. BMC Plant Biology (2021) 21:199 Page 3 of 12
Fig. 1 Freezing resistance evaluation protocol of rose stems during frost dehardening using electrical impedance tomography
experiment was conducted in the same position with an ex- stage of frost dehardening (February), the order of freezing
citation current of 250 μA and an excitation frequency of 1 resistance was ‘Tender and Soft as Water’ > ‘Red Cap’ > ‘
kHz. When the stem diameter was 2.45 mm (Fig. 3 B1) and Carefree Wonder’. During the period from 14 March to 25
3.23 mm (Fig. 3 B2), the reconstructed images could not be April, the freezing resistance of each variety decreased rap-
generated because the stem diameter of the rose was too idly, and the order of freezing resistance was ‘Red Cap’ > ‘
small. When the stem diameter of the rose was larger than Tender and Soft as Water’ > ‘Carefree Wonder’. The result
4 mm (Fig. 3 B3, B4, B5), a clearer EIT image of the stem of freezing resistance on 16 May was higher than that of the
was detected, and the stem size, shape and position were other periods; however, the freezing resistance did not differ
obtained. significantly among the three varieties (Table 1).
The LT50 was well fitted by EIT reconstructed values and the
EIT image and reconstructed values of floribunda rose logistic equation (R2 > 0.90), and only two significant differences
stems during frost dehardening were detected between the LT50 obtained by the EIT recon-
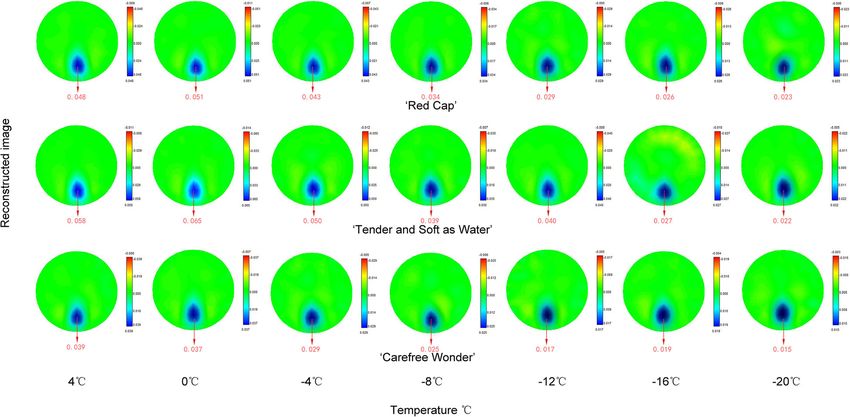
One frame of EIT images was captured at each temperature structed values and the EL method (Table 1). On 25 April, the
for each of the three floribundas rose varieties at each sam- freezing resistance of ‘Tender and Soft as Water’ was lowest at −
pling time (Figs. 4, 5). From these images, during frost dehar- 6.0 °C, whereas ‘Red Cap’ and ‘Carefree Wonder’ had the lowest
dening, the EIT imaging accurately represented the position freezing resistance on 16 May, i.e., − 7.0 °C and − 5.0 °C, respect-
and the size of the rose stems. The position of stems pre- ively. Overall, the order of freezing resistance was ‘Red Cap’ > ‘
sented blue for which the reconstructed value was greater Tender and Soft as Water’ > ‘Carefree Wonder’ (Table 1).
than 0, indicating that the resistivity of the region was in- During frost dehardening, the EIT reconstructed values
creased, and the pure blue in each EIT image corresponded could be used to obtain the freezing resistance of rose stems
to the maximum value of the reconstruction result. Clear after controlled freezing tests. Although the LT50 values of
EIT images were obtained throughout the frost dehardening stems calculated by EIT reconstructed values were higher
period. With the decrease in freezing temperature, the EIT than those obtained using the EL method, no significant dif-
reconstructed values of the stems showed a decreasing trend, ferences occurred between the results. (Table 1).
and the values of ‘Carefree Wonder’ were between 0.044 and
0.015, which were smaller than those of the other two culti- Comparison and validation of freezing resistance in stems
vars at the 5 sampling times (Fig. 6). evaluated by EIT reconstructed values with EL method
During frost dehardening, the freezing resistance
Changes in freezing resistance assessed by the EIT reconstructed values correlated sig-
Freezing resistance evaluated by means of the EIT nificantly and linearly with the traditional EL method
reconstructed values and EL method values (r = 0.93, P < 0.01; Fig. 7). According to the regression
During frost dehardening, the freezing resistance of the equation, the determination coefficient of the EIT recon-
stems of the rose varieties measured by the EL method structed value method was as high as 0.86, showing high
showed an overall decreasing trend (Table 1). In the early reliability.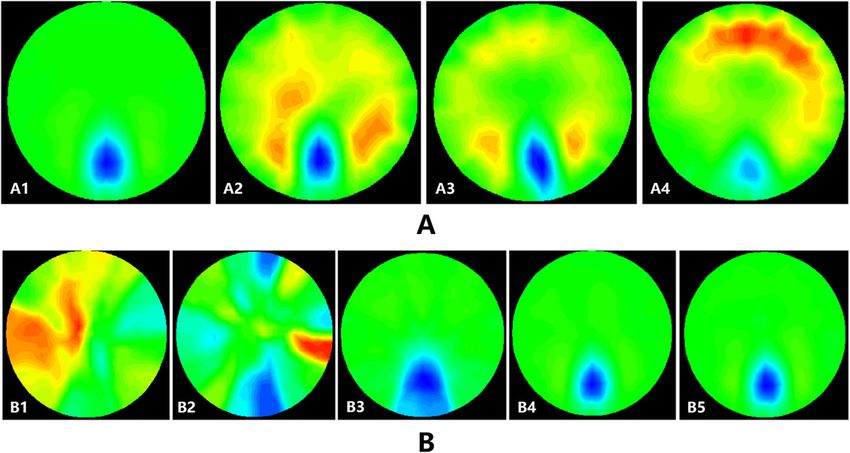
Qian et al. BMC Plant Biology     (2021) 21:199                                                                                          Page 4 of 12

 Fig. 2 a Reconstructed images with different test devices and b reconstructed images with different excitation currentsThe radius of the test
 device was 2 cm (A1), 4 cm (A2) or 8 cm (A3). The excitation current was 100 μA (B1), 150 μA (B2), 200 μA (B3), 250 μA (B4), 300 μA (B5) or 500 μA
 (B6). The diameter of the rose stem was 5.68 mm, and the excitation current frequency was 1 kHz. The excitation current was 250 μA for a, and
 the radius of the test device was 8 cm for b. The blue area on the lower part of each image represented the stem of the rose, the green area
 represented the background salt solution, and the other colours indicated that serious noise occurred.

Discussion                                                                   result in biological tissues maintaining a certain struc-
Optimum EIT parameters for measuring freezing                                ture and functional state, and changes in the physio-
resistance in stems of floribunda roses                                      logical state are reflected in electrical properties that are
EIT reconstructs the distribution of electrical parameters                   captured because of the sensitivity of the EIT system.
in biological tissues depending on the electromagnetic                       There are considerable differences between plants and
characteristics of those biological tissues. The interac-                    humans or animals in terms of cell structure, tissue ac-
tions of charged ions and ionic groups, among others,                        tive state, measured volume, and sensitivity of power
Qian et al. BMC Plant Biology     (2021) 21:199                                                                                          Page 5 of 12

 Fig. 3 a Reconstructed images with different excitation current frequencies. The frequency was 1 KHz (A1), 50 KHz (A2), 100 KHz (A3) or 150
 KHz (A4). The rose stem diameter was 5.68 mm, and the excitation current was 250 μA. b Reconstructed images with different diameters of
 rose stems. The diameter of rose stems was 2.45 mm (B1), 3.23 mm (B2), 4.44 mm (B3), 5.63 mm (B4) or 6.29 mm (B5). The excitation current was
 250 μA, the excitation frequency was 1 kHz. The radius of the test device was 8 cm. The blue area on the lower part of each image represented
 the stem of the rose, the green area represented the background salt solution, and the other colours indicated that serious noise occurred

source excitation, among other factors. When the EIT                         constructed. When the test device radius was small, ser-
technique is applied to animals or humans, the selected                      ious noise pollution affected the reconstructed image of
excitation current and frequency are higher than those                       the rose stem. In the present experimental system, the
used in plants. In terms of the physical model, because                      excitation mode was the opposite excitation and the
the diameter of tissue measured in humans and animals                        measurement mode was the adjacent measurement, the
is much larger than the diameter of a rose, a test device                    optimum EIT reconstructed image was obtained by
of organic glass with different diameters was                                selecting a rose stem diameter more than 4 mm, with an

 Fig. 4 Electrical impedance tomography (EIT) images of stems of three floribunda rose varieties after a controlled freezing test on 22 February.
 The colour bars on the right side of each image represent the reconstructed values (relative values with a range between 0 and 0.1). The red
 color numbers under each image represent the largest value of the reconstructed value on each freezing temperature. They are not in the
 original images and are inserted numbers.
Qian et al. BMC Plant Biology     (2021) 21:199                                                                                         Page 6 of 12

 Fig. 5 Electrical impedance tomography (EIT) images of stems of three floribunda rose varieties after a controlled freezing test on 16 May. The
 colour bars on the right side of each image represent the reconstructed values (relative values with a range between 0 and 0.1). The red color
 numbers under each image represent the largest value of the reconstructed value on each freezing temperature. They are not in the original
 images and are inserted numbers.

 Fig. 6 Changes in the electrical impedance tomography (EIT) reconstructed value of stems of three floribunda rose varieties after a controlled
 freezing test on 22 February a, 14 March b, 4 April c, 25 April d, and 16 May e. The reconstructed values are relative values with a range between
 0 and 0.1.
Qian et al. BMC Plant Biology         (2021) 21:199                                                                                                  Page 7 of 12

Table 1 Comparison of freezing resistance (FR, LT50) in stems of three floribunda rose varieties measured by means of relative
electrolyte leakage (REL) and electrical impedance tomography reconstructed values (EIT-RV) (The calculations of FR (LT50) by
different methods see “Freezing resistance calculation by means of EIT reconstructed values and EL method values” in detail)
Varieties              Date                 FR (LT50) (°C)
                       (Month-
                                            REL (95% Confidence interval) EIT-RV (95% Confidence interval)
                       Day)
‘Red Cap’              2–22                 −18.8                −20.36                − 17.21               − 20.1                − 24.74               − 15.42
                       3–14                 −18.4                − 20.01               − 16.85               − 14.6                −19.14                − 10.15
                       4–4                  −12.4                − 12.97               − 11.82               − 11.8                − 16.83               −6.69
                       4–25                 −8.9                 −10.06                − 7.82                − 7.3                 −32.24                17.59
                       5–16                 −9.9                 −11.08                −8.75                 − 5.0*                − 8.01                −2.01
‘Tender and            2–22                 −21.4                −22.28                − 20.51               − 16.0*               − 17.14               − 14.79
Soft as                3–14                 −17.6                − 18.79               − 16.47               − 13.6                −24.14                −3.10
Water’                 4–4                  −11.9                −12.20                − 11.53               −9.9                  − 12.61               − 7.29
                       4–25                 −8.5                 −27.28                10.19                 − 6.1                 − 12.09               − 0.05
                       5–16                 − 9.4                − 10.51               − 8.25                −8.2                  − 15.95               − 0.46
‘Carefree              2–22                 −17.3                − 18.17               −16.45                − 15.8                − 16.78               − 14.81
Wonder’                3–14                 − 17.1               − 17.98               − 16.22               − 12.7                − 18.85               − 6.51
                       4–4                  −10.5                −11.29                − 9.71                − 6.9                 − 15.12               1.30
                       4–25                 − 8.6                − 9.53                −7.67                 −6.7                  −9.05                 − 4.30
                       5–16                 −9.5                 − 10.14               −8.81                 − 5.1                 −10.74                0.44
The row data with an asterisk (*) show a significant difference (P < 0.05) in freezing resistance with result of the REL method. The differences (P < 0.05) between
each row data in freezing resistance of EIT method with results of the REL method for the semi-lethal temperature (LT50, Temperature at which 50% of the plants
or organs are killed) for each time instant were considered significant when the values of the Wald 95% confidence intervals did not overlap

8-cm inner radius of the device, an excitation current                              measuring numbers. But the measured object was usu-
frequency of 1 kHz and an amplitude of excitation                                   ally a closed domain with definite perimeter. The in-
current of 250 μA. According to the EIT measuring                                   crease in the number of electrodes would inevitably
principle, increasing the number of electrodes could in-                            reduce the electrode gap, limit the measuring current to
crease the resolution of the system and improve the im-                             penetrate into the central area, and then affect the detec-
aging quality by increasing the number of independent                               tion sensitivity of the central area or deep targets. For

  Fig. 7 Correlation of freezing resistance (FR, LT50) (LT50, Temperature at which 50% of the plants or organs are killed) in stems of floribunda roses
  measured by electrical impedance tomography reconstructed values (EIT-RV) with relative electrolyte leakage (REL) method values. The
  significance is at P < 0.01. Linear correlation coefficient r is 0.93. The data of stems were pooled data of three floribunda rose varieties (n = 15). R2
  is coefficient of determination.
Qian et al. BMC Plant Biology (2021) 21:199 Page 8 of 12
the relatively small-sized imaging objectives, too many the impedance was probably composed of extracellular re-
electrodes would reduce image quality instead in the sistance. The cell-membrane was an important medium in
case of insufficient hardware system performance. When material exchange and information transmission between
the radius of the physical model was 8 cm and the elec- cells and external environment. With the advent of freez-
trode spacing was greater than 10 mm, a clearer rose ing injury, the permeability of the cell- membrane was
stem image was detected, and the shape and location of changed, which resulted in the exudation of protoplast
the stem were also determined through reconstructed ions into the ectoplast and the enhancement of the cell
images. When rose stems were measured with different viability. Thus, there was a new steady equilibrium be-
diameters, reconstructed images could not be generated tween the ion concentrations of the symplast and the apo-
when the measured diameter was small; however, the plast and the dielectric properties of the cell-membrane
EIT images of stems could be detected clearly when the changes. With the decrease of temperature, the freezing
diameter was larger than 4 mm. Based on medical re- damaged to the stem increases while the ectoplasmic re-
search, only objects larger than a given size can be dis- sistance decreases, and this leaded to the lower resistivity
tinguished because of the difficulty given the number of than that of the control group (4 °C) and the differences in
electrodes and the measurement precision of each elec- EIT imaging results. The EIT measuring speed was about
trode [29, 30]. This finding explains the necessity of 1.25 frames per second. After inserting the rod and stabil-
highly sophisticated mathematical algorithms that ad- izing the salt solution, a clear EIT image was collected,
dress the inverse problem and the associated difficulty. and one-dimensional EIT reconstruction value was ex-
Inter- and intra-individual differences in electrode con- tracted from the image. The EIT technique was suffi-
ductivity with associated image distortion and artefacts ciently sensitive to detect the changes in the resistivity of
are further difficulties in absolute EIT. The human or stems caused by low temperatures (the electrical resistivity
animal body part of interest is rarely precisely round, changes are reflected by the reconstructed values). The
and inter-individual anatomy is variable, e.g., thorax electrical resistivity distribution of plant stems is more
shape, affecting individual electrode spacing [31], uniform than that of animal or human organs, and the
whereas the body of a rose stem is much more precisely EIT reconstructed image could accurately reflect the pos-
round. To further reduce imaging errors, the use of ac- ition of the stem with high quality. The functional imaging
tive surface electrodes could improve the signal-to-noise of ornamental plants was achieved. Application of the EIT
ratio [32]. Consequently, the reconstructed images chan- technique is increasing in medical research [22–24] and
ged with changes in the diameter of the samples, the ex- will be a type of detection method that is closely related to
citation current frequency and the magnitude of the the biological physiological functions of plants.
excitation current when other conditions remained the Plant cells are composed of intracellular fluids, cell
same. The present experiment was a further original and membranes, and a cell wall and are suspended in extra-
exploratory use of EIT in the study of plant resistance. cellular fluids [34]. EIT has the potential to visualize tis-
sue physiology and pathology in terms of tomographic
Application of EIT in evaluating freezing resistance in images of the electrical impedance distribution, provides
stems of floribunda roses more information about tissue physiology and pathology,
In the present study, the EIT reconstructed images of and hence has greater potential in several applications
floribunda rose stems were obtained under freezing tests [29, 35, 36]. EIT measures the resistance of a plant
during frost dehardening. The freezing resistance esti- cross-section, without consideration of plant length and
mated according to the EIT reconstructed values was cross-sectional area. EIT measurements are carried out
close to that measured by the conventional EL method in plant faults, and 2D measurements are used. When
with a significant linear correlation ((r = 0.90, P < 0.01). the excitation current and frequency reach a certain
After the freezing test, the stems were in different states, level, the current flux can distribute in most areas of the
which had an important effect on the conduction of the faults and improve the measurement accuracy. Another
electric current. The changes in EIT images and recon- advantage of EIT is that if the methodology allows
structed values were determined by decreasing the visualization of the internal structures of tree stems, im-
temperature step-by-step, which might be related to the portant additional information can be provided on the
damage caused to cell membranes due to the physio- damage caused by freezing. Further research should be
logical, anatomical and structural changes. Researchers continued to achieve more advantages associated with
believed that cells show high impedance to low frequen- EIT technology.
cies (f < 1 kHz), while low-frequency currents only existed
in the extracellular space, and the impedance was mainly Conclusion
composed of extracellular resistance [33]. In this study, In conclusion, in the present experiment, a new EIT
the excitation current frequency of 1 kHz was applied, and technique used in medicine was introduced for use withQian et al. BMC Plant Biology (2021) 21:199 Page 9 of 12
ornamental plants, and a functional imaging technique and 16 May for the floribunda rose varieties. Nine rose
of plants was realized. Freezing resistance was evaluated plants were selected for each variety that exhibited good
by fitting the reconstructed value with the logistic equa- growth. The location of each sampling was in the middle
tion within two days of the artificial freezing of the rose plant; four leafy branches were collected per
temperature test. The freezing resistance calculated by plant. A total of 108 branches (3 plants × 3 treatments ×
EIT reconstructed values was highly correlated with that 3 plots × 4 directions = 108) were collected [37]. Before
obtained using the traditional EL method, although it performing the freezing tests, the samples were carefully
was slightly lower than that evaluated by the EL method. rinsed with tap water 3 times and then with distilled
The reconstructed value of EIT could be used to evalu- water additional 3 times to remove surface pollutants.
ate the freezing resistance of floribunda rose stems, The plastic bags with samples were exposed to seven
showing that the EIT technique might be applied as a temperatures (six freezing temperatures plus one control
rapid and effective method to evaluate the freezing re- at 4 °C) in refrigerators (BCD-252WBCS; Haier, Qing-
sistance of trees. dao, China). These freezing temperatures ranged from
conditions that would likely kill the samples to those
Methods that would cause no damage and were chosen according
Plant materials to the freezing resistance determined by previous assess-
Two-year-old floribunda roses (Rosa hybrida ‘Flori- ments [38]. The rate of cooling was 4 °C h− 1. The sam-
bunda’) of three varieties, ‘Red Cap’, ‘Tender and Soft as ples were kept at target temperatures for 4 h and were
Water’ and ‘Carefree Wonder’, were obtained from the then moved to 4 °C to allow gradual thawing [39, 40].
Chinese Rose Base Co., Ltd. (32°98′ N, 112°53′ E) lo- Then, the samples were used for EIT, electrical imped-
cated in Nanyang City, Henan Province, was the biggest ance spectroscopy and relative EL measurements after 2
base of Chinese rose produce in China. We got the per- h of thawing.
mission to collect the plant samples from the Chinese
Rose Base Co., Ltd., and the plant materials were for- EIT image reconstruction and data acquisition
mally identified by Mr. Guoyou Zhao. The roses were For the EIT images of rose stems at different tempera-
planted in Specimen Park (38°50′ N, 115°26′ E) on the tures, the EIT image reconstruction was based on the
East Campus of Hebei Agricultural University, Baoding data acquisition system of The Fourth Military Medical
City, Hebei Province, on 31 March 2013. The experi- University [41], EIT Monitor image reconstruction soft-
mental design was a complete randomized block in ware [42], the methods of EIT as a tool for phenotyping
which 35 plants per plot were planted at a spacing of plant roots [14], and a real-time EIT imaging system
0.25 m × 0.30 m with three replications. A total of 315 based on the split augmented Lagrangian shrinkage algo-
plants were planted (35 plants/plot × 3 replications × 3 rithm [34]. The data acquisition system included a
varieties = 315). Before the roses were planted, the soil multiplexer, analogue to digital converter, and micro-
was ploughed and barnyard manure fertilizer was ap- programmed control unit, among other components
plied. After planting, in spring and autumn, the soil was [41] (see Fig. 8). The driving mode of the system was
watered one to two times per week, while during sum- quasi-opposite direction drive, the excitation source was
mer, the soil was watered according to the actual condi- produced by digital synthesis mode, the analogue-digital
tions by paying attention to the amount of rainfall, converter was integrated into the system with high speed
preventing water from accumulating in the soil. In sum- and high precision, and the USB interface between the
mer, the broad-spectrum fungicide carbendazim was system and the host computer was high-speed and was
sprayed on the rose leaves to control black spot disease easily plugged in. The software system primarily com-
(Diplocarpon rosae); diseased leaves were removed, and pleted the functions of the interface with the hardware
defoliated leaves were cleared timely. In the growing sea- system, the simulation imaging, the measured data im-
son, weeding was carried out artificially everyday during aging, the image processing, and analysis of the results,
periods of vigorous weed growth or two to three days among other functions. The weighted damped least
after watering during the rapid growth stage of roses. square algorithm was used to reconstruct EIT images
These management measures were applied to maintain [43], and 16 electrodes were used for continuous im-
consistent growth of the different rose varieties. aging. The imaging speed was approximately 1.25 frames
per second.
Freezing temperature tests A concentration of 0.9% physiological saline was used
The freezing resistance measurement experiment was as the background (impedance did not change with the
conducted from February to May 2016 during frost frequency) [43]; the rose stem was placed 20 mm from
dehardening. Five sampling times occurred at intervals the edge of the plexiglass container, and a stem length of
of 20 days, on 22 February, 14 March, 4 April, 25 April, 70–90 mm was inserted vertically. After the liquidQian et al. BMC Plant Biology (2021) 21:199 Page 10 of 12
Fig. 8 Diagram of the electrical impedance tomography (EIT) data acquisition system
surface was completely calm, approximately 10 data C 1 −C blank1
REL ¼ 100% ð1Þ
frames were collected for imaging. The boundary voltage C 2 −C blank2
was measured with current as excitation. The image was
weighted by the least square method through the bound- For the EL method, the total number of stem samples
ary voltage at different frequencies. Then the recon- used was 1680 (4 stem samples × 4 replicates × 7 tem-
structed value of boundary voltage was obtained. The peratures × 3 varieties × 5 times = 1680).
results of EIT imaging were displayed on a relative grey
scale. When the reconstructed value of the obtained Freezing resistance calculation by means of EIT
image was less than 0, the resistivity of the correspond- reconstructed values and EL method values
ing region was reduced, and in the pseudo-colour image, To determine freezing resistance, the EIT reconstructed
the side-coloured red was represented, and the pure red values and REL values were modelled using a logistic
part of the image corresponded to the minimum value sigmoid function (in Eq. 2) [44, 45] with respect to the
of the EIT reconstruction result. When the recon- tested temperatures:
structed value was greater than 0, the resistivity of the A
corresponding region was increased, with the blue- y¼ þD ð2Þ
1 þ eBðC−xÞ
coloured side represented, and the pure blue part corre-
sponded to the maximum value of the reconstruction re- where x is the tested temperature (°C), y is the EIT re-
sult. The median value of the reconstruction result constructed value (or REL value), B is the slope at the
corresponded to the pure green colour in the image. inflection point C (Ωm °C− 1), C is the inflection point of
Larger absolute reconstructed values in the same loca- the function representing the freezing resistance value
tion indicated greater variation in the resistivity in that (i.e. semi-lethal temperature LT50, °C), and A and D de-
region [37]. fine asymptotes of the function [33, 38]. A + D denotes
the EIT reconstructed value with no freezing injury (or
the maximum value of REL under freezing injury); D
Relative EL measurement represents the minimum EIT reconstructed value under
Electrolyte osmosis method (EL) was used to determine freezing injury (or the basic value of REL with no freez-
membrane permeability. After the freezing test, four ing injury) [46–48].
stems, each 10 mm in length, were cut from the middle
of the stems. Twelve millilitres of distilled water were Statistical analyses
added to each test tube, which was then shaken at room The calculation method of the EIT image reconstructed
temperature (22 °C) for 24 h before the first conductivity values was described in the section of 5.3. The relation-
measurement (C1) and the blank measurement (Cblank 1) ship of the freezing resistance in stems evaluated by the
(only distilled water was measured). The samples were EIT and EL methods after exposure to freezing tests was
then heat-killed at 100 °C for 20 min and shaken for an- studied by linear regression analysis. The original data
other 24 h before the second conductivity measurement (the means of each variety at each given time) from all
(C2) and the blank measurement (Cblank 2). The relative three varieties over the entire study period were pooled,
electrolyte leakage (REL) was defined as [44]: and linear regression curve fit was applied (SPSS v22.0Qian et al. BMC Plant Biology (2021) 21:199 Page 11 of 12
statistical software package for Windows, SPSS Inc., Chi- Received: 30 December 2020 Accepted: 14 April 2021
cago, IL, USA). For the evaluation of the reliability and
accuracy of the models, the coefficient of determination
(R2) was examined. The correlation coefficient of linear References
1. Sakai A, Weiser CJ. Freezing resistance of trees in North America with
regression (r) was also provided. Repeated measurement reference to tree regions. Ecology. 1973;54(1):118–26. https://doi.org/10.23
analysis was applied for analysing the differences in 07/1934380.
freezing resistance of stems among different methods. 2. Wang YXH, Chen Y, Zhu BH, Mohammed YF, M. D. & Sofkova, S.
Physiological mechanisms of resistance to cold stress associated with 10
The differences among different assessment methods for elite apple rootstocks. J Integr Agr. 2018;17(4):857–66. https://doi.org/10.101
the LT50 estimates for each time instant were considered 6/S2095-3119(17)61760-X.
significant when the values of the Wald 95% confidence 3. Steponkus PL, Lanphear FO. Refinement of the triphenyl tetrazolium
chloride method of determining cold injury. Plant Physiol. 1967;42(10):1423–
intervals did not overlap. The correlation of freezing re- 6. https://doi.org/10.1104/pp.42.10.1423.
sistance estimated by EIT reconstructed values with 4. Aslamarz AA, Vahdati K, Rahemi M, Hasani D. Cold-hardiness evaluation of
values of the EL method used pooled data of the three Persian walnut by thermal analysis and freezing technique. Acta Hortic.
2009;861:269–72.
varieties. 5. Aslamarz A, Vahdati K, Hasani D, Rahemi M, Leslie CA. Supercooling and
cold hardiness in the acclimated and deacclimated buds and stems of
Abbreviations Persian walnut cultivars and genotypes. HortScience. 2010;45(11):1–6.
EIT: Electrical Impedance Tomography; 2D: Two-Dimensional;; EL: Electrolyte 6. Aslamarz AA, Vahdati K, Hasani D, Rahemi M, Leslie CA. Cold hardiness and
Leakage; LT50: Semi-lethal Temperature its relationship with proline content in Persian walnut. Eur J Horticult Sci.
2011;76(3):84–90.
7. Aslamarz AA, Vahdati K. Stomatal density and ion leakage as indicators of
Acknowledgments cold hardiness in walnut. Acta Hortic. 2010;861:321–4.
We wish to thank Dr. Feng Fu and his research team members for their 8. Henderson RP, Webster JG. An impedance camera for spatially specific
excellent technical assistance. measurements of the thorax. IEEE T Bio-med. Eng. 1978;25:250–4.
9. Barber DC, Brown BH, Freeston IL. Imaging spatial distributions of resistivity
using applied potential tomography. Electron Lett. 1983;19:93–5.
Authors’ contributions 10. Brown BH, Seagar AD. The sheffield data collection system. Clin Phys Physiol
JQ and GZ planned the project and was responsible for part of the Measure. 1987;8(Suppl A):91–7.
manuscript writing and editing. JZ and RJG contributed to sample 11. Koukourlis CS, Kyriacou GA, Sahalos JN. A 32-electrode data collection
preparation and methodology, JZ and YL contributed to data analysis and system for electrical impedance tomography. IEEE T Bio-med Eng. 1995;
interpretation of the results. All authors had read and approved the 42(6):632–6. https://doi.org/10.1109/10.387203.
manuscript. 12. Yair G, Antoni I, Boris R. A new concept for medical imaging centered on
cellular phone technology. PLoS One. 2008;3:e2075.
Funding 13. Weigand M, Kemna A. Multi-frequency electrical impedance tomography as
This research was supported by grants from the National Natural Science a non- invasive tool to characterize and monitor crop root systems.
Foundation of China (31272190 awarded to G.Z.). The Financial Aid Project Biogeosciences. 2017;14(4):921–39. https://doi.org/10.5194/bg-14-921-2017.
for the Introduction of Overseas Students in Hebei Province (C201838) and 14. Corona-Lopez DD, Sommer J, Rolfe S, Podd SA, F. & Grieve, B. D. Electrical
Hebei Province Higher Education Science and Technology Research Project impedance tomography as a tool for phenotyping plant roots. Plant
(QN2019090). The funding organizations provided the financial support to Methods. 2019). https://doi.org/10.1186/s13007-019-0438-4;15(1):49.
the research projects, but were not involved in the design of the study, data 15. Li X, Cui M, Yang J, et al. Tomographic image reconstruction of plant single
collection, analysis of the data, or the writing of the manuscript. root by electrical impedance tomography. Transact Chin Soc Agricult Eng.
30; (18): 173–180. (2014). (China).
16. Basu, S. Plant flow measurement and control handbook. 1st edition. Fluid,
Availability of data and materials Solid, Slurry and Multiphase Flow. Elsevier, Academic Press. (2019).
All data sustaining the results in this study are included in this article or its 17. Mary, B., Abdulsamad, F., Saracco, G., Peyras, L., Vennetier, M., Mériaux, P.,
information files. Other datasets generated during this study are available et al. Improvement of coarse root detection using time and frequency
upon reasonable request from the corresponding author (Ji Qian). induced polarization: from laboratory to field experiments. Plant Soil. 417:
243–259. DOI: https: //doi.org/https://doi.org/10.1007/s11104-017-3255-4
(2017).
Declarations 18. Martin, T., & Günther, T. Complex resistivity tomography (CRT) for fungus
detection on standing oak trees. Eur J For Res. 132: 765–776. DOI: https:
Ethics approval and consent to participate //doi.org/https://doi.org/10.1007/s10342-013-0711-4 (2013).
Not applicable. 19. Jiao, M L., Gong, R J., Qian J., et al. Frost Hardiness Assessment of Floribunda
Roses by Means of Electrical Impedance Tomography. Sci Agricult Sinica,
Consent for publication 050(007): 1302–1316 (2017). (In Chinese).
Not applicable. 20. Guyot, A., Ostergaard, K T., Lenkopane M., et al. Using electrical resistivity
tomography to differentiate sapwood from heartwood: application to
conifers. Tree Physiol, 33; (2): 187–194. DOI: https://doi.org/110.1093/
Competing interests treephys/tps128 (2013).
The authors declare that they have no competing interests. 21. Bera, T. K. Bioelectrical impedance methods for noninvasive health
monitoring: A review. J Med Eng Volume 2014, Article ID 381251, 28 pages.
Author details (https://doi.org/10.1155/2014/381251) (2014).
1
College of Horticulture, Hebei Agriculture University, Baoding 071000, Hebei, 22. Solà J, Adler A, Santos A, Tusman G, Sipmann FS, Bohm SH. Non-invasive
China. 2College of Electrical and Mechanical Engineering, Hebei Agricultural monitoring of central blood pressure by electrical impedance tomography:
University, Baoding 071000, Hebei, China. 3College of Art, Hebei University of first experimental evidence. Med Biol Eng Comput. 2011;49(4):409–15.
Economics and Business, Shijiazhuang 050051, Hebei, China. 4Department of https://doi.org/10.1007/s11517-011-0753-z.
Software Engineering, Hebei Software Institute, Baoding 071000, Hebei, 23. Adler A, Amato M, Arnold B, Bayford JH, Bodenstein R, Böhm M, et al.
China. Whither lung EIT: where are we, where do we want to go and what do weQian et al. BMC Plant Biology (2021) 21:199 Page 12 of 12
need to get there? Physiol Meas. 2012;33(5):679–94. https://doi.org/10.1088/ 44. Zhang G, Li YQ. Assessing frost hardiness of Pinus bungeana shoots and
0967-3334/33/5/679. needles by electrical impedance spectroscopy with and without freezing
24. Gong B, Krueger-Ziolek S, Moeller K, Schullcke B, Zhao ZQ. Electrical tests. J Plant Ecol. 2010;2(4):285–93.
impedance tomography: functional lung imaging on its way to clinical 45. Repo T, Lappi J. Estimation of standard error of impedance-estimated frost
practice? Expert Rev Respir Med. 2015;9(6):721–37. https://doi.org/10.1586/1 resistance. Scand J Forest Res. 1989;4(1-4):67–74. https://doi.org/10.1080/02
7476348.2015.1103650. 827588909382547.
25. Brown B, Tidy H, Boston JA, Blackett K, Smallwood AD, R. H. & Sharp, F. 46. Rutkove SB, Kwon H, Guasch M, Wu JS, Sanchez B. Electrical impedance
Relation between tissue structure and imposed electric current flow in imaging of human muscle at the microscopic scale using a multi-electrode
cervical neoplasia. Lancet. 2000;355(9207):892–5. https://doi.org/10.1016/ needle device: A simulation study. Clin Neurophysiol. 2018;129:8.
S0140-6736(99)09095-9. 47. Zhang G, Ryyppö A, Repo T. The electrical impedance spectroscopy of scots
26. Gilad O, Holder DS. Impedance changes recorded with scalp electrodes pine needles during cold acclimation. Physiol Plantarum. 2002;115(3):385–
during visual evoked responses: implications for electrical impedance 92. https://doi.org/10.1034/j.1399-3054.2002.1150308.x.
tomography of fast neural activity. Neuroimage. 2009;47(2):514–22. https:// 48. Repo T, Zhang M, Ryyppö A, Vapaavuori E, Sutinen S. Effects of freeze-thaw
doi.org/10.1016/j.neuroimage.2009.04.085. injury on parameters of distributed electrical circuits of stems and needles
27. Zhao, Z. Q. Steinmann, D. Frerichs, Guttmanne JI. & Möller, K. PEEP titration of scots pine seedlings at different stages of acclimation. J Exp Bot. 1994;
guided by ventilation homogeneity: a feasibility study using electrical 45(6):823–33. https://doi.org/10.1093/jxb/45.6.823.
impedance tomography. Crit. Care 14, R8 (http://ccforum.com/
content/14/1/R8) (2010).
28. Hsu C, Cheng F, Lin JS, Ko WC, Cheng YF, Lin KS, et al. Electrical impedance
Publisher’s Note
Springer Nature remains neutral with regard to jurisdictional claims in
tomography monitoring in acute respiratory distress syndrome patients
published maps and institutional affiliations.
with mechanical ventilation during prolonged positive end-expiratory
pressure adjustments. J Formos Med Assoc. 2016;115(3):195–202. https://doi.
org/10.1016/j.jfma.2015.03.001.
29. Alessandrini G. Stable determination of conductivity by boundary
measurements. Appl Anal. 1988;27(1-3):153–72. https://doi.org/10.1080/0003
6818808839730.
30. Cheney M, Isaacson D. Distinguishability in impedance imaging. IEEE T Bio-
med Eng. 1992;39(8):852–60. https://doi.org/10.1109/10.148393.
31. Boyle A, Adler A. The impact of electrode area, contact impedance and
boundary shape on EIT images. Physiol Meas. 2011;32(7):745–54. https://doi.
org/10.1088/0967-3334/32/7/S02.
32. Gaggero P, Adler O, Brunner JA, Seitz P. Electrical impedance tomography
system based on active electrodes. Physiol Meas. 2012;33(5):831–47. https://
doi.org/10.1088/0967-3334/33/5/831.
33. Repo T, Zhang M, Ryyppö A, et al. Effects of freeze-thaw injury on
parameters of distributed electrical circuits of stems and needles of Scots
pine seedlings at different stages of acclimation. J Exp Botany. 45(6): 823–
833. (1994).
34. Seo J, Bera K, Kwon TK, H. & Sadleir, R. Effective admittivity of biological
tissues as a coefficient of elliptic. Computational and Mathematical Methods
in Medicine. 2013;2013:1–10. https://doi.org/10.1155/2013/353849.
35. Zhou YK, Li XQ. A real-time EIT imaging system based on the split
augmented Lagrangian shrinkage algorithm. Measurement. 2017;110:27–42.
https://doi.org/10.1016/j.measurement.2017.06.018.
36. Yang L, Xu, C. H, Fu F, Dai M, & Dong, X. Z. Quasi-static EIT algorithm based
on weighted frequency difference damped least square. Chin J Sci
Instrument 34, 1879–1885 (2013). (in Chinese).
37. Wang, L. Initial study of electrical impedance tomography (EIT) in the
hemorrhage model of piglets. Xi’an: The Fourth Military Medical University,
pp 106 (2008). (in Chinese).
38. Repo T, Zhang G, Ryyppö A, Rikala R. The electrical impedance spectroscopy
of scots pine (Pinus sylvestris L.) shoots in relation to cold acclimation. J Exp
Bot. 2000;51(353):2095–107. https://doi.org/10.1093/Ejexbot/51.353.2095.
39. Holubowicz T, Cummins JN, Forsline PL. Responses of Malus clones to
programmed low-temperature stresses in late winter. J Am Soc Hortic Sci.
1982;107:492–6.
40. McNamara S, Pellett H. Cold hardiness of weigela cultivars. J Environ Hortic.
1998;16(4):238–42. https://doi.org/10.24266/0738-2898-16.4.238.
41. Shi, X. T. Huo, X. Y. You, F. S. Fu, F. Liu, R. G. Xu, C. H. & Dong, X. Z. Electrical
impedance imaging system for intracranial hemorrhage and its preliminary
animal experiment. Space Med Med Eng 20, 24–27 (2007). (in Chinese).
42. Shuai, W, Dong, XJ Z, Fu F, You F. S, Xu, C H, Chao, Y. & Lv, X. N. Design and
implement of software system for image monitoring based on electrical
impedance tomography. China Med Devices 27, 14–16, 5 (2012). (in
Chinese).
43. Kwon, H. Guasch, M. Nagy, J. A. Rutkove, S. B. & Sanchez, B. New electrical
impedance methods for the in situ measurement of the complex
permittivity of anisotropic skeletal muscle using multipolar needles.
Scientific Reports 9, (1) (2019).You can also read