Adani Power Limited Investor Presentation - November 2019
←
→
Page content transcription
If your browser does not render page correctly, please read the page content below
Adani Power Limited

Investor Presentation
             November 2019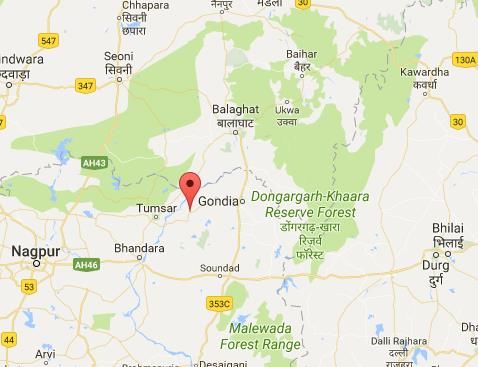
Disclaimer
 Certain statements made in this presentation may not be based on historical information or facts and may be “forward-looking
 statements,” including those relating to general business plans and strategy of Adani Power Limited (“APL”) and its subsidiaries ,
 associates, and joint ventures (combine together “Adani Thermal Power Group” or “The Group”) their future outlook and growth
 prospects, and future developments in their businesses and their competitive and regulatory environment, and statements which
 contain words or phrases such as ‘will’, ‘expected to’, etc., or similar expressions or variations of such expressions. Actual results
 may differ materially from these forward-looking statements due to a number of factors, including future changes or developments
 in their business, their competitive environment, their ability to implement their strategies and initiatives and respond to
 technological changes and political, economic, regulatory and social conditions in the country the business is. This presentation
 does not constitute a prospectus, offering circular or offering memorandum or an offer, or a solicitation of any offer, to purchase or
 sell any shares and should not be considered as a recommendation that any investor should subscribe for or purchase any of The
 Group’s shares. Neither this presentation nor any other documentation or information (or any part thereof) delivered or supplied
 under or in relation to the shares shall be deemed to constitute an offer of or an invitation by or on behalf of The Group.
 The Group, as such, makes no representation or warranty, express or implied, as to, and does not accept any responsibility or liability
 with respect to, the fairness, accuracy, completeness or correctness of any information or opinions contained herein. The
 information contained in this presentation, unless otherwise specified is only current as of the date of this presentation.
 The Group assumes no responsibility to publicly amend, modify or revise any forward looking statements, on the basis of any
 subsequent development, information or events, or otherwise. Unless otherwise stated in this document, the information contained
 herein is based on management information and estimates. The information contained herein is subject to change without notice
 and past performance is not indicative of future results. The Group may alter, modify or otherwise change in any manner the
 content of this presentation, without obligation to notify any person of such revision or changes. No person is authorized to give
 any information or to make any representation not contained in and not consistent with this presentation and, if given or made,
 such information or representation must not be relied upon as having been authorized by or on behalf of The Group.
 This presentation does not constitute an offer or invitation to purchase or subscribe for any securities in any jurisdiction, including
 the United States. No part of it’s should form the basis of or be relied upon in connection with any investment decision or any
 contract or commitment to purchase or subscribe for any securities. None of our securities may be offered or sold in the United
 States, without registration under the U.S. Securities Act of 1933, as amended, or pursuant to an exemption from registration
 therefrom.

                                                                                                                                           1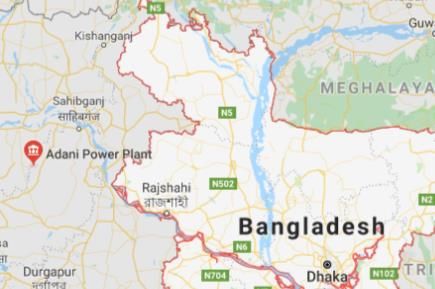
Contents
                        01    Adani Group
                        02    Overview of Adani Power Limited
                        03    Key Capabilities
                        04    ESG practices
                        05    Power Sector Updates
                        06    Regulatory Assets
                        07    Quarterly Financial Updates
                        08    Way Forward
                              Appendix: Asset Details

STRICTLY CONFIDENTIAL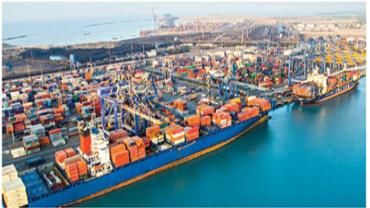
01
                        Adani Group

STRICTLY CONFIDENTIAL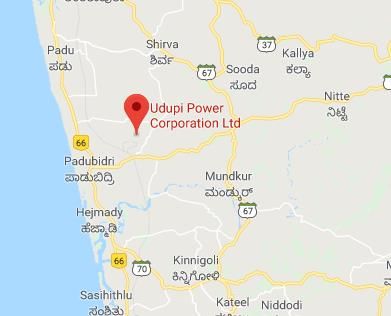
ADANI: world class infrastructure & utility portfolio
Transport & Logistics Portfolio Utility & Power Portfolio
Adani
62.3% 100% 100% 75% 75% 75% 75%
APSEZ AAPT SRPCL 75% ATL APL AGEL AGL
Port & Logistics Port Rail T&D IPP Renewables Gas DisCom
AEL
Incubator
100% 100% 100% 100%
AAHL ATrL AWL Data
Airports Roads Water Centre
~USD 24.7bn*
No 1 in Ports, T&D and IPP (Thermal and renewables) in India
Independent verticals with independent boards - Integrating ESG into value creation
Adani
Addressable utility market- 3.2 million customers in ATL & ~ 10 million in AGL
Addressable market in Airports ~125 million customers
Green colour represent public traded listed vertical * As on Sep 30, 2019
4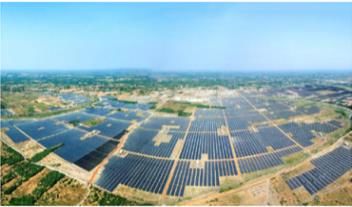
ADANI: repeatable, robust & proven model to
 deliver RoE

 Phase
 Phases
                   Origination        Development             Construction        Operations        Post Operations
                                                                                                        O&M
                Opportunity         Pipeline                EPC & Funding      Operation           Capital Mgmt

              • Analysis &        • Site acquisition    • Engineering &       • Life cycle O&M
                market            • Concessions and       design                planning
  Activity      intelligence        regulatory          • Sourcing &          • Asset
              • Viability           agreements            quality levels        Management
                analysis          • Investment case     • Equity & debt         plan
              • Strategic value     development           funding at
                                                          project
              • Redefining the    • Envisaging          •   complex          • O&M                • Ops phase funding
                space -eg           evolution of sector     developments on    optimisations eg     consistent with
                Mundra Port         eg Adani                time & budget eg   Solar plants         asset life
                                    Transmission            APL
                                                                                                   A P S E Z , AT L &
Performance                                                                                        AGEL - only
                                                                                                   Private sector
                                                                                                   I n f r a s t r u c t u re
                                                                                                   I G i s s u e rs i n
                                                                                                   India

       Low capital cost, time bound & quality completion providing long term stable cashflow & enhanced RoE

                                                                                                                          5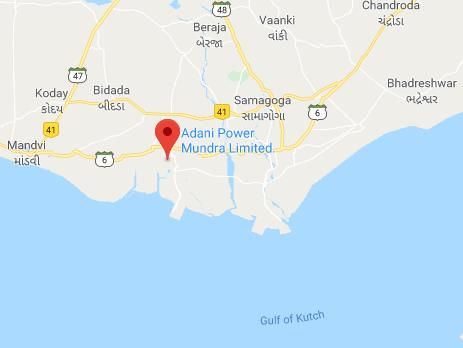
ADANI: repeatable, robust business model applied
consistently to drive value
Key Business Model Attributes Successfully applied across Infrastructure & utility platform
Development at scale & within
time and budget
India’s Largest Longest Private HVDC 648 MW Ultra Mega Largest Single Location
Commercial Port Line in Asia Solar Power Plant Private Thermal IPP
APSEZ ATL AGEL APL
Excellence in O&M – Highest Margin among Highest availability Constructed and Lowest capex / MW
benchmarked to global standards Peers in the World among Peers Commissioned 9 months among Peers
March 2016 March 2019
Bonds
14% Private Banks
Diverse financing sources – only 33%
Indian infrastructure portfolio PSU
PSU
with three (3) Investment Grade 55%
42%
(IG) issuers Private Banks
31% Bonds
25%
* Includes listed Group Companies
6
02
                        Overview of Adani Power Limited

STRICTLY CONFIDENTIAL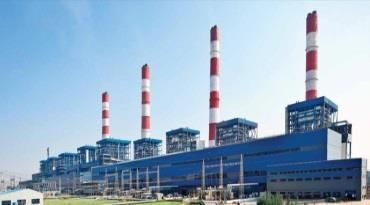
Adani Power Limited
Investment Case

                                  Largest private sector power producer with 14 GW thermal power portfolio – 12.4 GW MW operational,
                                  and 1.6 GW under construction

                                            Higher efficiency, lower emission: >75% capacity from Supercritical and Ultra-Supercritical(1)
                                            technology based units

                                               Stable and secure revenue streams: >70% of existing and upcoming gross capacity tied up in
                                               Long term PPAs, >85% of domestic coal requirement(2) already tied up through FSAs

                                            Plants located close to coal sources or ports, enabling competitive tariffs and favorable Merit
                                            Order Dispatch position

                                  Improved power sector outlook: positive regulatory orders, domestic coal availability, ongoing reforms

PPA – Power Purchase Agreement, FSA – Fuel Supply Agreement
(1) Presently under construction       (2) excluding Haryana PPA

                                                                                                                                              8
Adani Power Limited: India’s Largest Private
         Sector IPP

                                      100%                           100%                          100%                         100%                       100%                       100%
                                        Udupi                     Tiroda                      Raipur                      Raigarh                      Kawai                          Mundra
                                     (Karnataka)               (Maharashtra)               (Chhattisgarh)              (Chhattisgarh)                (Rajasthan)                     (Gujarat)
       Location                    Coastal, Utility                                    Near-Pithead Plants                                           Hinterland                       Coastal

      Highlight                       Fixed ROE                High Dispatch                    Open                          Open                 High Dispatch              High dispatch / Open

     Capacity (MW)                      1,200                       3,300                       1,370                         600                      1,320                             4,620
                                   (600MW x 2)                  (660MW x 5)                 (685MW x 2)                (600MW x 1)                 (660MW x 2)                (330MW x 4) Sub-critical /
     Technology
                                    Subcritical                 Supercritical               Supercritical               Subcritical                Supercritical             (660MW x 5) Supercritical
     COD                               Aug-12                      Oct-14                      Apr-16                       Apr-14                    Dec-13                             May-12
     LT PPA                             100%                        100%                          --                           --                      100%                               60%
                                                                                                                     Telan-         Tamil
         Counterparty          Karnataka            Punjab      Maharashtra                       --                                                 Rajasthan             Gujarat     Haryana           Others(1)
                                                                                                                     gana           Nadu
         MW                      1,080               102            3,085                         --                 110^           185^               1,200                1,200        1,424            1,734
     Fuel Arrangement
         Counterparty                 Imported               FSA with CIL subs.         FSA with CIL subs.          FSA with CIL subs.          FSA with CIL subs.          FSA with CIL subs. / Imported
         MTPA                            ~   3(3)                  10.76(2)                       --                        2.315                      4.12(2)                       6.41(2) / ~ 16(3)

                                    12,410 MW operating portfolio of six modern and efficient thermal power plants
Further, Adani Power Ltd. also has a 40 MW solar power plant at Bitta.
IPP – Independent Power Producer, MW – Mega Watt, COD – Commercial Operations Date, LT PPA – Long Term Power Purchase Agreement, FSA – Fuel Supply Agreement, MTPA – Million Tonnes per Annum, Company
Limited               ^ Medium Term PPAs of 3 years duration, allotted on 11th Sept 2019
1 – 1,734 includes merchant capacity and short/medium term PPAs with Mundra Utilities Private Limited and North Central Railways 2 – Contracted Capacity, 3 - Consumption @ 75% PLF                          9
Evolution of Adani Power Limited
Incorporated
1996
Commissioned one of the
Commissioned its first largest single location Completed acquisition of Completed
thermal power unit at thermal power plants in the Lanco’s 1,200 MW “Return acquisition of
Mundra, Gujarat of 330MW World – 4,620MW Mundra on Equity” Udupi Power GMR’s 1,370 MW
subcritical technology Power Plant plant, APL’s first ever Raipur Energen
acquisition Ltd.
2006 2009 2010 2012 2014 2015 2018 2019
Construction of the 4.6 Commissioned largest thermal Ultra-Supercritical Completed
Commissioned India’s first
GW ambitious thermal power plant of 3,300 MW in unit of 1,600 MW acquisition of
supercritical unit of 660MW
power project started Maharashtra at Tiroda under construction at Avantha’s 600
at Mundra, Gujarat
Godda MW Adani
at Mundra Commissioned 1,320 MW at
Cross – border supply Raigarh Energy
Kawai, Rajasthan
to Bangladesh Generation Ltd.
1,600
Cumulative Thermal
operational capacity 330 990 4,620 9,240 10,440 12,410
in MW
Adani Power has total of 14+ GW of Power Generation capacity
10Diversified Portfolio
Technology Split (14,0101 MW) Counterparty split2 (14,010 MW)
1,320 , 9%
3,120 ,
22%
3,300 , 24%
1,600 , 11%
120 , 1%
1,598 , 11%
1,600 ,
12%
9,290 , 2,592 , 19% 1,080 , 8%
66%
2,400 , 17%
Supercritical Ultra-Supercritical Subcritical
Maharashtra Haryana
Karnataka Gujarat^
MT PPA/ Merchant / Others* Punjab
Bangladesh Rajasthan
>75% capacity is Supercritical / Ultra
Diversified counterparty mix
supercritical
1. Including under construction assets 2 – Gross tie-up
^ Gujarat includes power supplied from Raipur Energen Ltd. under short term PPA
* MT PPAs (3 years) of 185 MW with Tamil Nadu and 110 MW with Telangana allotted to Raigarh Energy Generation on 11th Sept 2019 11Large generation assets driving scale advantage
12,410 MW Operational Assets
Total MW 1,320
1,600 MW Under Construction Assets
PPA tied up1 1,200
Coal Source FSA (4.12 MTPA), rest IPT
Kawai Total MW 1,600
Total MW 4,620 Godda
PPA tied up 1,600
PPA tied up1 2,624
Mundra Coal Source Imported
FSA (6.41 MTPA),
Coal Source Raigarh Energy Generation
Imported
Tiroda
Raipur Energen
Total MW 600
Total MW 3,300
PPA tied up 295(3)
PPA tied up1 3,085
Coal Source FSA (2.32 MTPA)
Coal Source FSA (10.76 MTPA), rest IPT
Operational
Udupi
Total MW 1,370 Under Construction
Total MW 1,200 PPA tied up1 1,000 MW2 Under Rectification
PPA tied up 1,193 FSA for Case 4 PPA, PPA counterparty states for APL
Coal Source
rest E-auction
Coal Source Imported
1 - Net of aux consumption and transmission loss , 2 - Case-4 PPA with GUVNL for 1,000 MW expiring in Sept 2019 3- Allotted on 11th Sept 2019
12At A Glance – Historical Operating Performance
PLF %
70% 76% 70% 64% 69%
55%
FY15 FY16 FY17 FY18 FY19 H1FY20
Generation (BU)
69.39
64.17
54.67 58.47
50.82
32.46
FY15 FY16 FY17 FY18 FY19 H1FY20
13At A Glance – Historical Financial Performance
Revenue (Rs Crore)
25,734 26,362
23,034
21,093
19,065
14,830
FY15 FY16 FY17 FY18 FY19 H1FY20
EBITDA (Rs Crore)
9,004
7,431
6,391 6,190
5,401 5,142
FY15 FY16 FY17 FY18 FY19 H1FY20
1403
Key Capabilities
STRICTLY CONFIDENTIALKey Capabilities
Combined experience of more than 30,000 man – years across verticals
Constructed the then world’s largest single location coal based thermal power plant at Mundra
Project
1 Commissioned India’s 1st thermal power unit based on super-critical technology
Execution
The above project also included construction of then world’s longest (989 km) private HVDC transmission system
APJL acquired more than 500 acres land for Godda under new LARR 2013 in 1.5 yrs
~ 10 yrs. experience as competitive in-house O&M service providers, operating > 18 units of which 12 units are super critical
Strong knowledge base & expertise of operating major OEM units such as Dongfang, Harbin, SEPCO, BHEL, etc.
Asset Dedicated Team of ~ 2,400 professionals consisting of domain experts in O&M, Environment & safety, protection &
2 Management metering, quality assurance & control, techno commercial, legal and other divisions
Plant Level O&M teams assisted by centralized operations and technical services, department staffed with leading experts
in O&M of thermal power plants
APL sources and transports more than 40 MTPA coal annually
3 Coal Logistics APL is the only IPP in India to have in-house coal logistics capability (mine to plant) with ~ 4,000 man-years of experience
Largest customer of Indian railways after NTPC
Domain experts with 20+ years of experience in law and power sector regulation
4 Regulatory Successfully represented Company’s case in various landmark regulatory and judicial cases, leading to Orders that are
positive not just for the organization but also for the sector
HVDC – High Voltage Direct Current, SEPCO - SEPCO Electric Power Construction Corporation, BHEL – Bharat Heavy Electricals Limited, NTPC – National Thermal Power Corporation, LARR –
Land Acquisition, Rehabilitation and Resettlement Act, OEM – Original Equipment Manufacturer
16Coal Handling and Logistics Capability
Summary Plant and Mine Locations
Only IPP in India to have in-house coal logistics capability (mine to
plant)
> 4,000 man-years of experience in coal logistics
Largest customer of Indian Railways after NTPC
Approx. 5,000 rakes loaded annually, peak capacity of 16 rakes
handled simultaneously
Developed own siding for coal movement from Korba coalfields
Developed its own state of the art coal logistics monitoring and
control system
Smooth Handling of approx. 45 MTPA of coal annually by APL
resulting in lower inventory requirement
Constitutes 6.5% of total coal consumption for thermal power
NCL
plants in India
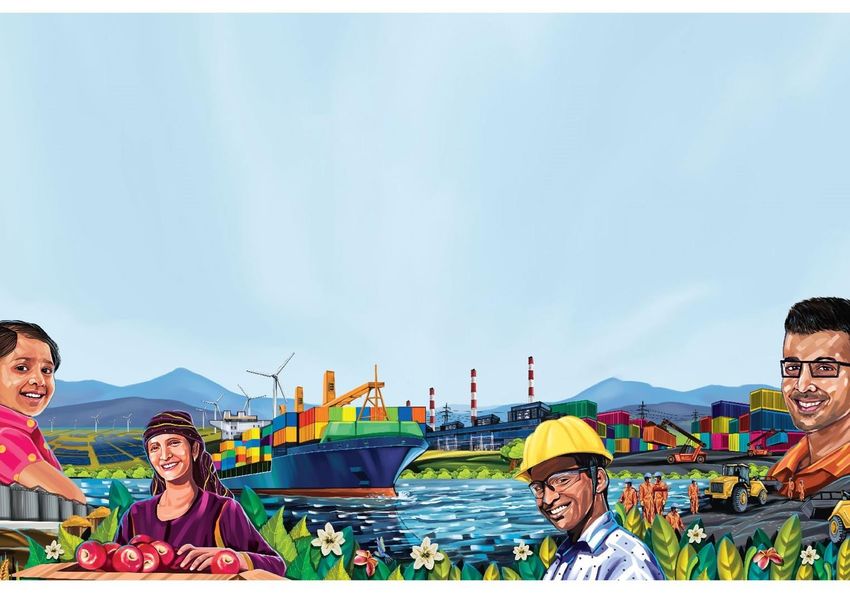
All projects have excellent infrastructure facility for faster handling of Kawai
rakes. Some Examples are as below Mundra SECL Korba Godda
Tiroda
3 wagon tipplers for handling BOXN rakes, Tilda
Dhamra
1 track hopper for handling BOBRN rakes WCL Umrer
9 lines within plant to ensure adequate rail infrastructure Tiroda SECL Korea Rewa
Kawai
MCL Talcher
2 Wagon Tipplers for handling BOXN Rakes Raigarh
1 Track Hopper for handling BOBRN Rakes
6 lines within plant to ensure adequate rail infrastructure MCL IB
REL, Tilda
APL Plants
– 3 Wagon Tipplers for handling BOXN Rake.
– 4 nos truck tippler unloading facility Udupi Mines
– 6 lines within plant to ensure adequate rail infrastructure.
– REGL, Raigarh Mangalore SCCL Port for Imported Coal
– Due to proximity of coal mines, Coal is transported through Road/RCR
PPA counterparty
mode with 2 nos truck tipplers. Railway system under commission.
states for APL
Map not to scale. For illustration purposes only, BOBRN - Bogie Open Bottom Rapid with pNeumatic door opening actuators,
WCL – Western Coalfields Limited, SCCL - Singareni Collieries Company Limited, SECL – South Eastern Coalfields Limited,
MCL – Mahanadi Coalfields Limited, NCL – Northern Coalfields Limited
17Acquisition and Turnaround Experience
Case Study - Udupi Thermal Power Plant
– 1,200 MW (2 x 600 MW) imported coal based power plant in Udupi District, Karnataka
– Acquired by APL in April 2015 from Lanco Infratech Limited
– First project in India utilizing 100% imported coal as fuel
– First acquisition by APL of an operational project
– UPCL was a stressed company with Credit Rating of D, despite being a Section 62 (cost plus tariff) power plant
– Plant had poor operational performance due to financial stress of sponsor and delays in availability of funds
– Operational performance of UPCL has improved significantly post acquisition by APL acquired UPCL
• Improved plant availability consistently higher than the normative availability (which forms the basis for fixed charge payment)
• Lesser outages and start-ups, leading to reduced secondary oil consumption
• Improved plant efficiency with reduction in station heat rate and auxiliary consumption
Improvement in operational performance post acquisition Improvement in financial performance post acquisition
Particulars Pre acquisition (FY11-15) Post acquisition (FY16-17) Pre acquisition Post acquisition
PLF % 64.1% 75.9% Particulars (FY14-15) (FY16-17)
Availability % 74.7% 87.2% Average Revenue 2,900 3,147
SOC (ml/Kwh) 0.75 0.12
Average PBT (66) 108
Aux Power (%) 6.6% 5.8%
Outages (#) 26 19 PBT % (2.3%) 3.4%
– Post acquisition, project debt was restructured under 5-25 scheme to extend repayment during PPA tenor, improving cash flow profile
PLF – Plant Load Factor; SOC – Secondary Oil Consumption; Aux Power – Auxiliary Power; SHR – Station Heat Rate
18Recent Awards & Recognitions
Sword of Honor 2019 conferred by Adani Power Rajasthan Limited (APRL)
British Safety Council (BSC) for Excellent safety standards
(October 2019)
Udupi Power Corporation Limited (UPCL)
Platinum Prize
8th FICCI Safety Systems
Excellence Awards
in Power category of the
Manufacturing Sector
(September 2019) Adani Power Maharashtra Limited (APML)
Certificate of Appreciation
5S case study competition Adani Power Mundra Limited (APMuL),
Quality Circle Forum of India APML and APRL
(September 2019) Gold (Highest level of recognition)
1904
ESG practices
STRICTLY CONFIDENTIALEnvironment, Health and Safety Practices
As India’s largest private power producer, we acknowledge our responsibility in achieving sustainable growth and
creating value for our stakeholders.
Annual publication of Sustainability Report, covering comprehensive Increasing Fly Ash Utilization
ESG performance, with external independent assurance as per GRI
Standards and IR Framework
Green Belt Development 87.9%
> 2 million saplings developed across plant locations 72.7%
65.8%
> 33 % of total land developed as Green Belt across plant locations
Water Conservation
Rain water harvesting facilities for utilization of rain water in
FY16 FY17 FY18
operations
Treated water from STPs and ETPs used in horticultural activities
and coal handling, dust suppression respectively GHG Emissions (tCO2/MWh) below grid average
Solid Waste Management
Waste management across all location as per guidelines 0.98
Hazardous waste disposed as per HW Management Rules
Storage silos for dry fly ash utilization with combined capacity of > 0.86 0.84 0.83
20,000 MT Average
Fly ash supplied to third parties for bricks and cement Emission Factor
manufacturing purpose for Grid as per
FY16 FY17 FY18 CEA was 0.98
APL also owns a 40 MW solar plant at Bitta, Gujarat tCo2/ MWh.
Sox, Nox and Particulate Matter Emissions (kg/MWh) Specific Water Consumption (m3/MWh) well below statutory limit
Sox Nox SPM 3.50
2.05 2.15
1.79
1.09 1.13 Statutory Limit is 3.5
0.77 m3/MWh. Fresh water
2.48 2.55 2.50
0.17 0.15 0.16
consumption includes
harvested rain water.
FY16 FY17 FY18 FY16 FY17 FY18
PLF – Plant Load Factor; SOC – Secondary Oil Consumption; Aux Power – Auxiliary Power; SHR – Station Heat Rate
^FY19 figures under Assurance 21Social Practices
APL has undertaken several social activities in the field of GYANODAYA Project Scholarship Distribution
education, health, etc. benefiting the society and country at
large
> 300 infrastructure projects like road construction, classroom
construction, construction of toilets, repair of hand pump,
community hall, wells etc. are being taken up as per need of the
beneficiaries for mass benefit
Some examples are as below
Education
GYANODAYA Project - equipment distributed to 137
schools to start smart class which will benefit ~ 42,000
students
SAKSHAM Project – Training classes for > 4,000 people
~ 4,600 students benefited through distribution of various
educational and sports material Mobile Health Care Training under SAKSHAM
> 1,100 meritorious students awarded scholarship
Health
Mobile Heath Care unit - > 60,000 patients treated
SuPoshan Program - >4,800 women beneficiaries
Health insurance benefits for ~ 18,000 people by issuing
health cards
> 12,500 patients have been benefitted through various
mega and specialized health camps
Every month, > 6,000 beneficiaries have been provided
with safe drinking water facility
22Strong Corporate Governance
Audit Committee Nomination & Remuneration Committee
3 member committee - consisting of 2 independent directors 3 member committee - consisting of 2 independent directors
Oversight of the company’s financial reporting process and the Formulation of the criteria for determining qualifications,
disclosure of its financial information positive attributes and independence of a director and
recommend to the Board remuneration policy of directors, key
Recommendation for appointment, remuneration and terms of
managerial personnel and other employees
appointment of auditors of the company
To extend or continue term of appointment of independent
Reviewing the annual and quarterly financial results with the
director, on the basis of performance evaluation of independent
management before board submission
directors
Approval of appointment of Chief Financial Officer after
To recommend / review remuneration of the Managing
assessing the qualifications, experience and background, etc. of
Director(s) and Whole-time Director(s) based on their
the candidate
performance and defined assessment criteria
Review and monitor the auditor’s independence and
performance, and effectiveness of audit process
Evaluation of internal financial controls, risk management
systems
Stakeholders’ Relationship Committee Sustainability and Corporate Social Responsibility Committee
3 member committee - consisting of 1 independent director
3 member committee - consisting of 2 independent directors
To formulate and recommend to the Board, a Corporate Social
Resolving the grievances of the security holders including
Responsibility Policy which shall indicate the activities to be
complaints related to transfer/transmission of shares, non-
undertaken by the company
receipt of annual report, non-receipt of declared dividends
To recommend amount of expenditure incurred on CSR activities
Reviewing of adherence to service standards adopted in respect
of various services being rendered by Registrar & Share Transfer Monitor the implementation framework of CSR Policy
Agent
2305
Power Sector Overview
STRICTLY CONFIDENTIALIndia Power Sector: Strong demand potential
Significant potential for growth of power in India Power Demand is poised to accelerate
Per Capita Consumption (kWh) Billion Units
12,962
4,240 2,047
3,927
3,030 1,566
2,578
1,143
1,181 937
India Brazil World China South Africa USA FY12 FY17 FY22E FY27E
Base load demand best served by Coal Increasing demand with moderating capacity growth
2,474 Retirement Coal Gas / Diesel Hydro Renewable
Coal Renewable Others
1,725
7 25
1,239 25
11 25
916
12
671 1,686
1,213 21 9
913
529 585 11 9 12
6 6 8
-1 -2
-4 -4 -6 -6 -6
FY07 FY12 FY17 FY22E FY27E
Source: CRISIL Research, CEA, 19th Electric Survey (2017), MNRE, CIL, Research Reports FY16 FY17 FY18 FY19 FY20E FY21E FY22E
25Significant Reforms in Recent Years
• UDAY Scheme (UDAY 2.0 in the pipeline)
• SAUBHAGYA Scheme
Distribution • Pilot Scheme for procurement of 2500 MW
• Payment Security Mechanism
• SHAKTI Policy
• Emphasis on production growth
Coal • Coal Link Rationalisation
• Rationalisation of Coal Escalation Index
• 100% FDI in coal mining, sales, and associated infrastructure
• Change in Law for domestic coal shortfall
• Change in Law for Duties & Taxes
Regulation • Carrying Costs (Principle of Economic Restitution)
• Pass Through of Imported Coal Price (HPC)
• Pass Through of Incremental costs of environmental compliance
2606
Regulatory Assets
STRICTLY CONFIDENTIALChange in Law Compensation: The Principle
Hon’ble Supreme Court Order on Compensation for High Coal Import Prices
(Energy Watchdog Judgement)
Negative: Positive:
Neither Indian Change in Law, nor Any shortfall in domestic coal availability due to change in policy should be
Force Majeure compensated for use of alternate coal
Formation of High Powered Committee Change in Law compensation granted by CERC, MERC, and RERC for
(HPC) by Gujarat Government shortfall in domestic coal under NCDP and SHAKTI
Amendment of PPAs to allow imported Grant of Carrying Cost under Principle of Economic Restitution by Hon’ble
fuel cost pass-through Supreme Court and various Regulatory Commissions
Recovery of additional interest cost on long pending receivables, as well as
Full recovery of imported fuel cost
higher cost of alternate fuel
28Mundra Power Plant: Regulatory Events
o HPC recommendation was based on sacrifices by all the stakeholders ensuring Public interest is
protected while implementing solutions for viable and sustainable operations
o Procurers: Pass through of imported coal cost based on HBA ceiling of USD 110/MT to be reviewed
every 5 years
o Developers-
HPC • Past losses prior to cut off date i.e. 15-10-2018 shall not be compensated
Recommendations • Extension of PPA tenure by another period of 10 years after the completion of the PPA tenure
(wef 15-Oct-18) of 25 years at the option of procurer
• Capacity being sold under merchant of 550 MW offered to procurers
• Sharing of profit from the Indonesian Mines with procurers subject to minimum of Rs.0.05/kwh
o Lenders-
• Reduction in debt to compensate for reduction in the capacity charges by Rs. 0.20/kwh
• Interest rate reduction on the balance debt
PPA Amendment Update
•CERC approval for Supplemental PPAs granted on 12th Apr 2019; Capacity under PPAs raised to 1,200 MW and
1,234 MW respectively
•Retrospective claims of Rs. 929 Cr. almost fully received
•Interest Rate reduction sought from Lenders
PPA Termination
•APL had appealed in Supreme Court against rejection of termination notice by the APTEL, for GUVNL Bid-02 PPA
on account of non-availability of domestic coal from GMDC
•On 2nd July 2019, Hon’ble Supreme Court has ruled that PPA is terminated from Jan 2010, directed CERC to
calculate compensation
•Petition filed with CERC for compensation claim
2907
Quarterly Financial Updates
STRICTLY CONFIDENTIALQ2 FY 2019-20: Key Highlights
Operational: Operating Q2 Q2 H1 H1
• Mundra: Phase III capacity (1,320 MW) utilized for performance* FY20 FY19 FY20 FY19
supplying power in merchant market Declared 79% 77% 84% 59%
• Tiroda: Running on 100% domestic coal Capacity (%)
• Kawai and Udupi: Lower grid demand due to extended PLF (%) 63% 65% 69% 52%
monsoons
Power 14.73 15.09 32.46 23.76
Generation
Financial: (BUs)
• Lower PLF at Udupi and lower one time recognition of
Coal 8.63 9.04 18.67 14.01
compensatory tariffs led to revenue decline
Consumed
• Recognition of carrying cost in APRL following APTEL (MMT)
order
• Lower level and utilization of debt led to reduction in
Financial Q2 Q2 H1 H1
finance cost performance FY20 FY19 FY20 FY19
Regulatory: Revenue 6,815 7,657 14,830 11,617
• Tiroda: MERC allowed compensation under change in (Rs Cr)
law for de-allocation of Lohara captive coal block Fuel cost
3,926 3,987 8,634 6,101
• Kawai: APTEL allowed compensation for change in law (Rs Cr)
for domestic coal shortfall with carrying costs EBITDA 2,248 2,806 5,142 4,095
• Mundra: SC upheld termination of GUVNL Bid-2 PPA (Rs Cr)
and directed CERC to grant compensatory tariff Finance cost
1,326 1,407 2,648 2,769
(Rs Cr)
Strategic:
PBT (Rs Cr) 158 702 36 (51)
• Acquisition of 1,370MW GMR Chhattisgarh Energy Ltd
and 600MW Korba West Power Company Ltd PAT (Rs Cr) 4 387 (260) (438)
* Excludes performance of 1,370 MW Raipur Energen Ltd. (formerly known as GMR Chhattisgarh Energy Ltd.), which was acquired in August 2019 31Q2 FY 2019-20: Revenue Mix
INR Crores
Q2 FY19 Q2 FY20 292
394
Consolidated Revenues*
736
1130 2885
1634 3108
Rs. 7,657 Cr 11% Rs. 6,815 Cr
3404
1871
APMuL APML APRL UPCL REL APMuL APML APRL UPCL REL
Q2 FY19 1007 Q2 FY20 1969
Power Sales (Mn units)
14,596 MUs 7% 13,605 MUs
13589 11636
PPA Merchant/Medium term PPA Merchant/Medium term
Avg. PPA tariff Rs. 3.86 / kWh Avg. PPA tariff Rs. 4.20 / kWh
*Consolidated revenue after
Avg. Eliminations Avg.
Merchant/Medium Rs. 4.28 / kWh Merchant/Medium Rs. 3.89 / kWh
term tariff term tariff
32H1 FY 2019-20: Revenue Mix
INR Crores
H1 FY19 H1 FY20
292
1733
Consolidated Revenues* 1567
3660
1933 2574 7367
Rs. 11,617 Cr 28% Rs. 14,830 Cr
4153
5300
APMuL APML APRL UPCL REL APMuL APML APRL UPCL REL
H1 FY19 1242 H1 FY20 2702
Power Sales (Mn units)
22,771 MUs 32% 30,122 MUs
21529 27420
PPA Merchant/Medium term PPA Merchant/Medium term
Avg. PPA tariff Rs. 3.84 / kWh Avg. PPA tariff Rs. 4.14 / kWh
*Consolidated revenue after
Avg. Eliminations Avg.
Merchant/Medium Rs. 4.28 / kWh Merchant/Medium Rs. 4.07 / kWh
term tariff term tariff
33Q2/H1 FY 2019-20: EBITDA Mix
INR Crores
Q2 FY19 Q2 FY20 2
57
273 Consolidated EBITDA* 244 323
401
475
Rs. 2,806 Cr 20% Rs. 2,248 Cr
2007 1181
APMuL APML APRL UPCL REL APMuL APML APRL UPCL REL
H1 FY19 H1 FY20 2
-125 Consolidated EBITDA*
566 899
1509
675
Rs. 4,095 Cr 26% Rs. 5,142 Cr
1607
2883
1096
APMuL APML APRL UPCL REL APMuL APML APRL UPCL REL
*Consolidated EBITDA after
Eliminations
34Q2 FY 2019-20: APL EBITDA Bridge (YoY)
INR Crores
61 192
161
292 31
2,806 227
2,248
1,068
Exceptional Income Q2FY19 Q2FY20 Change
As part of Operating
1,561 (81) (1,642)
revenue
As part of Other
220 794 574
income
Total 1,781 713 (1,068)
EBITDA Q2 Revenue of Higher Lower Fuel Lower Other Lower other Lower Lower EBITDA Q2
FY19 REL operating expense Income (Net) opex Foreign Exceptional FY20
revenue Exchange Income
impact
35Consolidated Profit and Loss statement (1/2)
INR Crores
Particulars Q2 FY20 Q2 FY19 % Change H1 FY20 H1 FY19 % Change
Operating Revenue 5,916 7,104 -17% 13,720 10,857 26%
Of which
(38) 1,394 NM 543 1,436 -62%
exceptional
Other Income 900 553 63% 1,109 759 46%
Of which
769 348 121% 865 348 149%
exceptional
Total Revenue 6,815 7,657 -11% 14,830 11,617 28%
Fuel cost 3,926 3,987 -2% 8,634 6,101 42%
Other Opex 640 864 -26% 1,053 1,421 -26%
EBITDA 2,248 2,806 -20% 5,142 4,095 26%
Recurring EBITDA 1,517 1,064 43% 3,734 2,311 62%
• Lower grid demand and lower compensatory tariff resulted in lower operating revenues in Q2 FY20
• Fuel cost reduction in line with generation in Q2FY20
• Recurring EBITDA improvement due to higher blended realizations
• Reported EBITDA dropped due to lower exceptional income recognition
36Consolidated Profit and Loss statement (2/2)
INR Crores
Particulars Q2 FY20 Q2 FY19 % Change H1 FY20 H1 FY19 % Change
EBITDA 2,248 2,806 -20% 5,142 4,095 26%
Depreciation 765 697 10% 1,455 1,377 6%
Finance cost 1,326 1,407 -6% 2,648 2,769 -4%
PBT 157 702 -78% 1,039 (51) --
Exceptional (Gain) / Loss (1) -- -- 1,003 -- --
PBT after exceptional
158 702 -77% 36 (51) --
items
Tax 154 315 -51% 296 387 -24%
PAT 4 387 -99% (260) (438) 41%
• Depreciation is higher due to the consolidation of REL and REGL during the quarter
• Finance Costs for Q2 FY20 and H1 FY20 include Rs. 63 crore towards REL and REGL
• PBT of Q2 FY20 and H1 FY20 include Rs. (106) crore and Rs. (70) crore pertaining to REGL (Korba) and
REL (GCEL)
37Consolidated Balance Sheet
INR Crores
Particulars As on 30th Sep, 2019 As on 31st Mar, 2019
Equity & Reserves 9,633 7,712
Long term borrowings incl. current maturities 43,285 39,906
Other Non-current liabilities 5,974 5,702
Short term borrowings 7,978 7,074
Trade payables 6,550 6,362
Other current liabilities 2,164 1,229
Sources of Funds 75,583 67,985
Fixed Assets 58,658 50,769
Other Non current assets 1,889 4,013
Inventories 1,803 1,224
Trade Receivables 10,431 8,551
Cash & Bank 1,160 916
Other current assets 1,643 2,512
Application of Funds 75,583 67,985
• Increase in Long Term Borrowings, Equity & Reserves, and Fixed Assets is due to consolidation of newly
acquired entities - REL and REGL
• Inventory rise is due to better coal stock position at Mundra
• Increase in receivables is due to reclassification of Unbilled receivables into Billed receivables
3808
Way Forward
STRICTLY CONFIDENTIALKey Priorities
Areas of focus
Regulatory
Receipts
Emission Integration
Control
Capex
Profitable of
Acquisitions
and
Sustainable
Growth
Operational PPA and
Efficiency FSA tie ups
40Appendix
Asset Details
STRICTLY CONFIDENTIALUdupi Power Corporation Limited
Project Overview Location
Capacity (MW) 1,200 MW ( 2 units of 600 MW each)
Acquired From Lanco Infratech Ltd in Apr 2015
Technology Sub - Critical
Location / State Udupi District, Karnataka
Status Operational
– Unit 1 – 11-Nov-10
COD
– Unit 2 – 19-Aug-12
Total Project Cost INR 6,288 cr
Equipment
Boiler Make / Type Dongfang Electric Corp.
TG Set Make Dongfang Electric Corp. – Plant is located in the Udupi District of Karnataka, 35 km
north of Mangalore
Power Purchase Agreement Karnataka – 1,080 MW, Punjab – 120 MW
Fuel Supply Agreement Imported Coal – 3.35 MTPA @ 75.0% PLF – Flanked by Konkan Railway on the west and Padubidri-
Karkala state highway on the south
Coal Transportation Captive Jetty at Mangalore Port, rail to plant
RO Plant with 10 MLD capacity for
Water Linkage
conversion of sea water to RO water
2 Hassan Line – 400 KV
Evacuation Arrangement
2 Kemar Line – 220 KV
42Adani Power Maharashtra Limited
Project Overview Location
Capacity (MW) 3,300 MW (5 units of 660 MW each)
Technology Super - Critical
Location / State Tiroda in District Gondia, Maharashtra
Status Operational
– Unit 1: 23-Sep-12
– Unit 2: 30-Mar-13
COD – Unit 3: 14-Jun-13
– Unit 4: 31-Mar-14
– Units 5: 11-Oct-14
Project Cost INR 19,788 cr
Equipment
– Plant is located at MIDC Growth Centre, Tiroda in Dist. Gondia on
Boiler Make / Type Shanghai Electric Co., China
Bhandara Gondia state highway (SH-249), at a distance of 125 kms
TG Set Make Shanghai Electric Co., China from Nagpur
Power Purchase Agreement MSEDCL – 3,085 MW – Nearest major Railhead is Gondia on Mumbai-Howrah rail route at 30
Fuel Supply Agreement FSA with SECL, MCL, WCL of 10.76 MTPA kms distance from plant
Coal Transportation Rail / Road – Reservoir with buffer capacity of 45 days of water intake available
Water Linkage Wainganga River for 70 MCM per yr
– 2 Tiroda Warora lines – 218 km, 400 KV,
3,312 Amp thermal capacity
Evacuation Arrangement
– 2 Tiroda – Koradi lines – 360 km, 765 KV,
3,940 Amp thermal capacity
MCM – Million Cubic metres
43Adani Power Rajasthan Limited
Project Overview Location
Capacity (MW) 1,320 MW (2 units of 660 MW each)
Technology Supercritical
Location / State Kawai Village, Baran District, Rajasthan
Status Operational
– Unit 1 – 31-May-13
COD
– Unit 2 – 31-Dec-13
Project Cost INR 8,773 cr
Equipment
Boiler Make / Type Shanghai Electric Corp Ltd.
TG Set Make Shanghai Electric Corp Ltd.
Power Purchase Agreement RRVUNL – 1,200 MW
– Plant is located at village Kawai, Tehsil Atru, district Baran and
Fuel Supply Agreement FSA with SECL, NCL – 4.12 MTPA
300 Km from State capital, Jaipur
Coal Transportation Rail
– Nearest railway station is Salpura, which is 3 Km from the plant.
Water Linkage Parban river of 34 MCM per yr Kota Junction is a major railway station which is 111 Km from Kawai
2 Kawai Anta Lines – 50 km, 400 KV,
3,312 Amp Thermal Capacity
Evacuation Arrangement
1 Kawai Chhabra Line – 42 km, 400 KV,
1,656 Amp Thermal Capacity
44Adani Power (Mundra) Limited
Project Overview Location
Capacity (MW) 4,620 MW (5 units of 660 MW and 4 units of 330 MW)
Technology Super - Critical
Location / State Mundra Taluka, Kutch District / Gujarat
Status Operational
– Phase 1 - Unit 1 (4-Aug-09), Unit 2 (20-Mar-10)
– Phase 2 - Unit 3 (4-Aug-10) , Unit 4 (21-Dec-10)
COD – Phase 3 - Unit 5 (1-Mar-11), Unit 6 (3-Feb-12)
– Phase 4 - Unit 7 (9-Nov-11), Unit 8 (5-Mar-12), Unit 9 (11-
May-12)
Project Cost INR 23,762 cr
Equipment – Plant is located in Mundra taluka, Kachchh District of Gujarat and is
Babcock & Wilcox Beijing Co. Ltd. (Unit 1 – 4) ~ 61 km south of Bhuj
Boiler Make / Type
Harbine Boiler Co. (Unit 5 – 9)
– Plant is near National Highway 8A
Beijing Beizhong Steam Turbine Generator Co. (Unit 1 –
– Nearest Railway station is Gandhidham located 50 km away
TG Set Make 4)
Dongfang Turbine Co. (Unit 5 – 9)
PPA 1,200 MW – Gujarat, 1,424 MW – HPPC, 90 MW - Others
FSA with MCL, SECL – 6.41 MTPA (used by APML / APRL
Fuel Arrangement under IPT)
Imported Coal – 16.4 MTPA @ 75% PLF
Coal Transportation Marine to Mundra Port, conveyer belt to plant
3 RO Plants (7 MLD, 20 MLD and 20 MLD) for conversion
Water Linkage
of sea water to RO water
Evacuation HVDC Line – 1,992 km, 500 KV DC for Haryana
Arrangement Various lines for Gujarat
IPT – Inter Plant Transfer mechanism (FSA provision allowing transfer of coal between power plants either wholly owned by the user or by its 100% subsidiaries)
45Raipur Energen Limited
Asset Details Plant Location
Capacity (MW) 1,370 MW (2 units of 685 MW each)
Acquired from GMR Group in Aug 2019
Technology Supercritical
Plant location:
Location / State Raikheda, Raipur district, Chhattisgarh Raikheda village, Raipur
district, Chhattisgarh
Status Operational
Unit 1 - 1st June 2015
COD
Unit 2 - 1st April 2016
Short term PPA with GUVNL to supply
1,000 MW power at INR 3.16/kWh under
PPA
Case-4 norms
Current PPA tenure till Dec 2019
Super critical BTG equipment supplied by
Equipment
Doosan Heavy Industries (South Korea)
Coal for GUVNL PPA available under
Case-4 from Korea Rewa and Korba Coal
fields of SECL
Fuel Supply Agreement
E-auction coal from MCL - IB Valley and
SECL Raigarh coalfields based on
proximity to the plant
BPTA signed with PGCIL for evacuation
Evacuation of 816 MW (WR – 386 MW & NR – 430
Arrangement MW) at Raipur substation through
dedicated transmission line (65 km)
Water allocation for 36 MCM approved by
Water
Government of Chhattisgarh
46Raigarh Energy Generation Limited
Asset Details Plant Location
Capacity (MW) 600 MW (1 unit of 600 MW)
Lenders under IBC debt resolution process Plant location:
Acquired from
(NCLT)
Near Villages Chote Bhandar,
Technology Sub critical Bade Bhandar, Sarvani &
Location / State Chhattisgarh Amali Bhona
Fully operational since Feb 2015, District Raigarh,
Status Due to generator failure in May 2017, plant Chhattisgarh
was shut down pending repair by BHEL
COD Apr 2014
Variable cost PPA with Chhattisgarh State
Power Trading Co. to sell 5% of power
Allotted 3 year MT PPAs of 185 MW with
PPA
Tamil Nadu and 110 MW with Telangana
Plans to secure LT PPA for plant through
Case 1 bids post restart of operations
Total coal requirement of ~2.46 MTPA for
LT PPA and CG PPA
Fuel Supply Agreement FSA with MCL (2.315 MTPA) for LT PPAs
Balance coal to be procured through
auction route
Construction of railway line from
Bhupdeopur stn. to site is under progress
Rail line construction expected to be
Coal Transportation completed in 10-12 months post taking
over operations
Coal currently transported by road from
rail station to site over a distance of 29 km
Evacuation 20 km double circuit 400 kV transmission
Arrangement line upto PGCIL substation at Kotra
47Adani Power (Jharkhand) Limited
Project Overview Location
Capacity (MW) 1,600 MW ( 2 units of 800 MW each)
Technology Ultra Super-Critical Technology
Location / State Godda District, Jharkhand
Status Under Construction
Unit 1 – Dec-2021
Expected COD
Unit 2 – Apr-2022
Project Cost INR 13,846 cr (USD 1,978 mn)
Equipment
Boiler Make / Type Babcock & Wilcox Beijing Co. Ltd.
TG Set Make General Electric
Power Purchase Agreement 100% - Bangladesh Power Development Board
Fuel Supply Agreement 100% imported Coal
– Plant is located in village Motia, district Godda in
Coal Supply on CIF basis at Dhamra Port
Coal Transportation the state of Jharkhand
Dhamra Port to plant using Indian Railways network
400 kV D/C Transmission line of approx. 106 km up – Nearest national highway NH 133 at 9.5 km,
to Indian border (part of Project) nearest railway station is Godda (6 km)
Evacuation Arrangement
Transmission line in Bangladesh of about 20 km (to
be laid by Power Grid Corporation of Bangladesh) – Nearest port is Dhamra port (695 km by rail)
Environment Clearance, Water tie up, Cross Border
trading approvals, Chimney clearances and
transmission line approvals are in place
Project Status
Land acquisition – complete
EPC Contract assigned to SEPCO III
Project finance loan sanctions received
48Godda Project Highlights
Estimated Project Cost Among India’s first Ultra-
USD 2 Billion supercritical Units Growing demand for 8th largest population
Growing market power, resource 41st largest economy
with power constraints 7% GDP growth rate
deficits
2 x 800MW Ultra- Lower emissions,
Supercritical Units higher efficiency
Per capita Aggregate installed
Healthy bilateral
consumption 326 generation capacity of
relations and
kWh/yr 20 GW
SOx and NOx emission trade
FGD and SCR equipment
reduction
Depleting gas
Unique value- 56% capacity from Natural
reserves,
Dedicated transmission No linkage with Indian accretive Gas
environmental
line ~100km to border power grid opportunity 33% from liquid fuels
concerns
49Mundra (4,620 MW) performance update
INR Crores
Historical Operating Performance
Financial Performance
94% 87%
81% 75%
62% 54% 64% 59% Particulars Q2 FY20 Q2 FY19 H1 FY20 H1 FY19
FY16 FY17 FY18 FY19
Revenues 3,108 2,885 7,367 3,660
Billed Availability PLF Of which (30) 251 563 260
Exceptional
Operating Performance
Parameters Q2 FY20 Q2 FY19 H1 FY20 H1 FY19 Fuel Cost 2,237 2,182 4,783 2,664
Billed 84% 79% 87% 49% Other Opex 547 645 1,075 1,120
Availability
PLF 73% 71% 77% 44% EBITDA 323 57 1,509 (125)
Net Units Sold 6.80 BU 6.55 BU 14.26 BU 8.10 BU PPA Tariff/u 3.80 3.36 3.89 3.27
Coal Consumed 4.06 4.03 8.47 5.06 Fuel Cost/u 3.29 3.33 3.35 3.29
(MMT)
Coal Mix (Dom : 0:100 0:100 0:100 0:100
Imp %)
• Phase III capacity (1,320 MW) utilised for supplying power in Merchant market after GUVNL Bid-02 PPA termination
• Improvement in EBITDA due to tariff revision, following signing of SPPA pursuant to HPC recommendations
50Tiroda (3,300 MW) performance update
INR Crores
Historical Operating Performance
Financial Performance
77% 69% 70% 61% 81% 75%
66% 61%
Particulars Q2 FY20 Q2 FY19 H1 FY20 H1 FY19
FY16 FY17 FY18 FY19 Revenues 1,871 3,404 4,153 5,300
Billed Availability PLF Of which (80) 1,308 (53) 1,670
Exceptional
Operating Performance
Parameters Q2 FY20 Q2 FY19 H1 FY20 H1 FY19 Fuel Cost 1,294 1,107 2,860 1,939
Billed 78% 83% 84% 72% Other Opex 102 290 197 478
Availability
PLF 71% 72% 78% 65% EBITDA 475 2,007 1,096 2,883
Net Units Sold 4.86 BU 5.44 BU 10.71 BU 9.46 BU PPA Tariff/u 3.95 3.80 3.86 3.73
Coal Consumed 3.42 3.49 7.33 6.08 Fuel Cost/u 2.66 2.04 2.67 2.05
(MMT)
Coal Mix (Dom : 100:0 98:2 100:0 97:3
Imp %)
• Billed availability lower in Q2 FY20 due to lower coal availability following heavy rains at mines
• Increase in coal cost due to arms’ length pricing of coal transferred from Mundra Ph-IV FSA
51Kawai (1,320 MW) performance update
INR Crores
Historical Operating Performance
Financial Performance
87% 81% 72%
75% 76% 66%
48% 44% Particulars Q2 FY20 Q2 FY19 H1 FY20 H1 FY19
FY16 FY17 FY18 FY19 Revenues 1,634 1,130 2,574 1,933
Billed Availability PLF
Of which 824 173 880 356
Exceptional
Operating Performance
Parameters Q2 FY20 Q2 FY19 H1 FY20 H1 FY19 Fuel Cost 390 488 857 736
Billed 78% 80% 82% 57% Other Opex 63 242 110 521
Availability
PLF 62% 67% 67% 53% EBITDA 1,181 401 1,607 675
Net Units Sold 1.69 BU 1.98 BU 3.64 BU 3.00 BU PPA Tariff/u 4.54 4.14 4.41 4.01
Coal Consumed 1.02 1.22 2.19 1.87 Fuel Cost/u 2.31 2.46 2.35 2.45
(MMT)
Coal Mix (Dom : 100:0 91:9 100:0 95:5
Imp %)
• Lower billed availability due to planned and forced outages of Units, dip in PLF due to lower grid demand
• Jump in EBITDA due to recognition of claim of Rs. 125 Cr. for coal shortfall and Rs. 722 Cr. for Carrying cost
52Udupi (1,200 MW) performance update
INR Crores
Historical Operating Performance
Financial Performance
86% 77% 85% 75% 92%
71%
59% 50% Particulars Q2 FY20 Q2 FY19 H1 FY20 H1 FY19
FY16 FY17 FY18 FY19 Revenues 394 736 1,567 1,733
Billed Availability PLF
Of which -- 48 395 102
Exceptional
Operating Performance
Parameters Q2 FY20 Q2 FY19 H1 FY20 H1 FY19 Fuel Cost 101 237 577 794
Billed 75% 89% 84% 91%
Other Opex 49 227 92 373
Availability
PLF 11% 25% 30% 44% EBITDA 244 273 899 566
Net Units Sold 0.25 BU 0.62 BU 1.48 BU 2.18 BU PPA Tariff/u 14.17 7.99 7.43 6.00
Coal Consumed 0.12 0.29 0.68 1.02 Fuel Cost/u 4.11 3.85 3.89 3.64
(MMT)
Coal Mix (Dom : 0:100 0:100 0:100 0:100
Imp %)
• Lower demand due to heavy monsoons led to Reserve Shutdowns and lower volumes
• Maintaining high levels of availability, leading to full capacity charge recovery
53You can also read