Effects of High Intakes of Fructose and Galactose, with or without Added Fructooligosaccharides, on Metabolic Factors, Inflammation, and Gut ...
←
→
Page content transcription
If your browser does not render page correctly, please read the page content below
RESEARCH ARTICLE
 www.mnf-journal.com

Effects of High Intakes of Fructose and Galactose, with or
without Added Fructooligosaccharides, on Metabolic
Factors, Inflammation, and Gut Integrity in a Rat Model
Nor Adila Mhd Omar,* Jan Frank, Johanita Kruger, Federica Dal Bello, Claudio Medana,
Massimo Collino, Galia Zamaratskaia, Karl Michaelsson, Alicja Wolk, and Rikard Landberg
 1. Introduction
 Scope: A high fructose and galactose intake show adverse metabolic effects
 in animal models and in humans, but it is yet unknown if addition of Global intake of sugar from foods
 and beverages has increased in recent
 fermentable dietary fiber can mitigate such effects. This study investigate the decades,[1,2] accompanied by increased
 effects of high intakes of fructose and galactose, with/without added incidence of obesity, diabetes, and car-
 fructooligosaccharides (FOS), on metabolic factors, inflammation, and gut diovascular disease (CVD).[3] Sugars
 integrity markers in rats. represent a direct source of energy and
 Methods and Results: Rats (n = 6/group) receive different carbohydrates at high intake of sugar can cause negative
 effects on health. Numerous studies have
 isocaloric conditions for 12 weeks as follows: 1) starch (control), 2) fructose,
 shown that large amounts of dietary sug-
 3) galactose, 4) starch + FOS (FOS control), 5) fructose + FOS, and 6) ars are associated with risk factors of car-
 galactose + FOS, together with a high amount of n-6 polyunsaturated fatty diometabolic disease, including weight
 acids (n-6 PUFA) in all diets except for in 7) starch + olive oil (negative gain, dyslipidemia, glucose intolerance,
 control). The rats fed the galactose and galactose + FOS diets exhibit lower insulin resistance, and hypertension.[4,5]
 body weight than other groups. High-galactose diets has more pronounced The term “sugars” refers to monosac-
 charides and disaccharides. Among the
 effects on metabolic factors and gut permeability than high-fructose diets. monosaccharides, glucose and fructose
 High-fructose diets show less pronounced effect on these selected markers. are the most common, and are found
 No differences in inflammatory markers are detected for any of the diets. in fruits and vegetables.[6] Galactose is
 Conclusions: The results suggest potential adverse effects of high galactose mainly found in milk and other dairy
 and fructose on metabolic factors and gut integrity markers, but not on products but can also be found in veg-
 etables and fruits such as celery and
 inflammation. However, several mechanisms are at play, and general net
 cherries.[7] Sucrose, lactose, and mal-
 effects are difficult to determine conclusively for the conditions tested. tose are the most common disaccharides
 found in most foods.[8] Glucose, fructose,

 Prof. J. Frank, Dr. J. Kruger
Dr. N. A. Mhd Omar, Prof. A. Wolk Department of Food Biofunctionality
Unit of Cardiovascular and Nutritional Epidemiology Institute of Nutritional Sciences
Institute of Environmental Medicine University of Hohenheim
Karolinska Institutet Garbenstr. 28, Stuttgart 70599, Germany
Stockholm 171 77, Sweden
 Dr. F. Dal Bello, Prof. C. Medana
Dr. N. A. Mhd Omar, Prof. R. Landberg Department of Molecular Biotechnology and Health Sciences
Department of Biology and Biological Engineering University of Turin
Division of Food and Nutrition Science Turin, Italy
Chalmers University of Technology
Gothenburg 41296, Sweden Prof. M. Collino
E-mail: adilao@chalmers.se Department of Drug Science and Technology
 University of Turin
 Turin, Italy
 Dr. G. Zamaratskaia
 Department of Molecular Sciences
 The ORCID identification number(s) for the author(s) of this article Swedish University of Agricultural Sciences
 can be found under https://doi.org/10.1002/mnfr.202001133 Uppsala 75007, Sweden
© 2021 The Authors. Molecular Nutrition & Food Research published by Prof. K. Michaelsson, Prof. A. Wolk
Wiley-VCH GmbH. This is an open access article under the terms of the Department of Surgical Sciences
Creative Commons Attribution-NonCommercial-NoDerivs License, Uppsala University
which permits use and distribution in any medium, provided the original Uppsala 75185, Sweden
work is properly cited, the use is non-commercial and no modifications Prof. R. Landberg
or adaptations are made. Department of Public Health and Clinical Medicine, Nutritional Research
DOI: 10.1002/mnfr.202001133 Umeå University
 Umeå, Sweden

Mol. Nutr. Food Res. 2021, 65, 2001133 2001133 (1 of 10) © 2021 The Authors. Molecular Nutrition & Food Research published by Wiley-VCH GmbH
www.advancedsciencenews.com www.mnf-journal.com

and galactose are mainly consumed in the form of sucrose (table inflammatory biomarkers, and gut barrier function in a 12 week
sugar), high-fructose corn syrup, and lactose.[8] Intake of sugars intervention study performed on rats.
from fruits is an unavoidable part of a healthy diet, but added
sugars can make the diet unhealthy. There is currently no clearly 2. Experimental Section
defined threshold at which sugar intake exerts negative health
effects in humans.[9] 2.1. Animals and Diets
 Both human and animal studies have shown adverse effects
of high fructose intake and increased risk of development of The intervention study was performed at the Institute of Nutri-
metabolic syndrome, type 2 diabetes, and CVD.[10,11] High fruc- tional Sciences, University of Hohenheim, Germany. All animal
tose intake leads to impairment of glucose tolerance, reduced in- procedures were carried out in accordance with the Federation
sulin sensitivity, hypertriglyceridemia, and hypertension in ani- of European Laboratory Animal Science Association (FELASA)
mal models.[3,12] High fructose intake may also result in stimu- guidelines for care and use of laboratory animals, and were ap-
lation of hepatic de novo lipogenesis, which plays a significant proved by the Regional Council Stuttgart (Baden-Württemberg,
role in the development of non-alcoholic fatty liver disease.[13,14] Germany; trial no. V 351-18 BC).
Moreover, there is evidence that high intake of fructose in- Healthy male Sprague-Dawley rats (n = 90) were purchased
creases inflammation through activation of the nuclear factor- B at 7 weeks of age from Janvier Labs and had initial body weight
(NF- B) signaling pathway and production of pro-inflammatory (BW) of 250–274 g. The rats were randomly divided into seven
cytokines, including tumor necrosis factor-alpha (TNF- ) and groups of 12 animals and one baseline control group of six an-
interleukin-6 (IL-6).[15,16] imals, and their metabolic status was assessed at the beginning
 Galactose ingested in high amounts or low galactose degra- of the experiment. Each experimental group was provided with
dation capacity is known to cause galactosemia, resulting in ox- different carbohydrates at isocaloric conditions as follows: 1)
idative stress and cognitive and motor impairment.[17,18] In ani- starch (control) (61.5 g/100 g), 2) fructose (50 g/100 g), 3) galac-
mal research, galactose-induced mimetic aging is an established tose (50 g/100 g), 4) starch + FOS (FOS control) (starch: 54
aging model. Fructose and galactose are both reducing sugars g/100 g, FOS: 15 g/100 g), 5) fructose + FOS (fructose: 50 g/100
and therefore react with amino groups, which leads to enhanced g, FOS: 15 g/100 g) and 6) galactose + FOS (galactose: 50 g/100
production and accumulation of advanced glycation end prod- g, FOS: 15 g/100 g), all together with a high amount of n-6 PUFA
ucts (AGEs) and reactive oxygen species.[19,20] Such compounds from safflower oil (6 g/100 g) (Sigma Aldrich), and 7) starch +
contribute to pathological processes of age-related diseases, olive, a negative control group that received the starch diet but
such as diabetes, atherosclerosis, and neurodegeneration.[21,22] with the n-6 component supplied as olive oil (Table 1). No infor-
Human studies have consistently demonstrated that AGEs mation was found about the exact n-6 PUFA amounts in the olive
can increase oxidative stress, impair endothelial function, and oil provided. However, many studies have reported that olive oil
trigger inflammatory responses through activation of NF-kB, contains low amounts of n-6 PUFA, typically in the range of 8–
which up-regulates TNF- , IL-6, and interleukin-1 (IL-1 ) 20%,[33,34] therefore olive oil was used as a control to assess the
expression.[23,24] effect of high n-6 PUFA.
 On the other hand, intake of complex carbohydrates, such The starch control (group 1) was used as the basic control,
as fructooligosaccharides (FOS), a fermentable dietary fiber, has since starch was added to all groups in varying amounts to ob-
been associated with improved glycemic control and reduced tain isocaloric conditions in all cases. The starch used was native
risk of chronic diseases, such as obesity, diabetes mellitus, and potato starch (The Carl Roth GmbH+Co.KG, Germany), starch
CVD.[25,26] Gut fermentation of FOS results in production of + FOS (group 4, FOS control) was used as a control for com-
short-chain fatty acids (SCFA), including acetate, propionate, and parisons of groups where FOS was added to the sugars. FOS was
butyrate.[27] Beneficial effects of SCFA on health parameters in- inulin-type (DP4-5, MW: 624–679 from chicory root with 95% pu-
clude reduced inflammation and enhanced function of immune rity, Boneo GmbH, Germany). Starch + olive (group 7) was used
cells and the intestinal barrier.[28] A Western-type diet rich in sug- as a control group to assess the effect of higher concentrations of
ars and low in dietary fiber has been shown to lead to negative n-6 PUFA, which were added as part of the fat in the diet of all
metabolic effects and increased low-grade systemic inflamma- other groups to trigger low-grade inflammation.
tion as a result of impaired gut barrier integrity.[29] The rats were housed in a climate-controlled room (20–22 °C,
 In the present study, we tested the hypothesis that intake of 50 ± 10% relative humidity) with 12-h light/12-h dark cycle and
simple sugars, such as fructose and galactose, in high amounts fed the starch diet (control) during a 2 week adaptation period.
has pro-inflammatory and adverse metabolic effects, whereas The baseline control group was sacrificed at day 0. Six out of 12
a similar diet with added FOS, which stimulates extensive fer- animals per group were fed their respective diet for 6 weeks and
mentation in the gut, could mitigate these adverse effects when the other six animals were fed for 12 weeks. Water was available
administered as part of a diet with similar macronutrient pro- ad libitum.
file. A high dose of sugars (50%), which has been shown to af- Energy intake and BW were recorded weekly. At the end of the
fect metabolic factors and inflammation in previous studies, was respective feeding period, the rats were fasted for 12 h, anes-
used [30–32] along with a high concentration of n-6 polyunsatu- thetized with carbon dioxide gas, and killed by decapitation.
rated fatty acids (n-6 PUFA) as part of fat in the diet, to trigger in- Blood was collected into heparinized monovettes (Monovette,
flammation. We investigated the impact of high-sugar diets with Sarstedt, Germany), and feces and intestinal contents into Ep-
and without additional FOS, on metabolism and low-grade sys- pendorf tubes. Tissues (liver, kidney, brain, and small and large
temic inflammation, through assessment of metabolic factors, intestines) were excised, placed in cryotubes, and snap-frozen

Mol. Nutr. Food Res. 2021, 65, 2001133 2001133 (2 of 10) © 2021 The Authors. Molecular Nutrition & Food Research published by Wiley-VCH GmbH
www.advancedsciencenews.com www.mnf-journal.com

Table 1. Macronutrient and micronutrient composition of the seven experimental diets.

 Starch + FOS Starch + olive
 Starch (control) Fructose Galactose (FOS Control) Fructose + FOS Galactose + FOS (negative control)

 g kcal g kcal g kcal g kcal g kcal g kcal g kcal

Carbohydrate
 Starch 61.5 62.0 11.5 11.6 11.5 11.6 54.0 56.5 4.0 4.2 4.0 4.2 61.5 62.0
 Fructose - - 50.0 50.4 - - - - 50.0 52.4 - - - -
 Galactose - - - - 50.0 50.4 - - - - 50.0 52.4 - -
 FOS - - - - - - 15.0 7.9 15.0 7.9 15.0 7.9 - -
 Cellulose 12.5 6.3 12.5 6.3 12.5 6.3 5.0 2.6 5.0 2.6 5.0 2.6 12.5 6.3
Protein 18.0 18.1 18.0 18.1 18.0 18.1 18.0 18.9 18.0 18.9 18.0 18.9 18.0 18.1
Fat
 Safflower oil 6.0 13.6 6.0 13.6 6.0 13.6 6.0 14.1 6.0 14.1 6.0 14.1 - -
 Olive oil - - - - - - - - - - - - 6.0 13.6
Minerals and vitamins 2.0 - 2.0 - 2.0 - 2.0 - 2.0 - 2.0 - 2.0 -
Total 100 g 100 kcal 100 g 100 kcal 100 g 100 kcal 100 g 100 kcal 100 g 100 kcal 100 g 100 kcal 100 g 100 kcal

FOS, fructooligosaccharides; kcal, kilocalorie.

in liquid nitrogen. Plasma and serum were separated from the and Nɛ-(carboxymethyl)lysine (CML), pentosidine, and lysine
blood cells as soon as possible after collection. All samples were were quantified. In brief, 50 µL of sample were hydrolyzed with
immediately stored at −80 °C until further analysis. 500 µL of 0.6 M trichloroacetic acid and 50 mL of 6 M hydrochlo-
 After 2 weeks of the 12 week intervention, the dietary regime ric acid for 2 h at 60 °C. The analyses were performed on a UH-
for the galactose and galactose + FOS groups was modified in PLC coupled to a triple quadrupole mass spectrometer (AB-Sciex
response to adverse effects (polyuria and lens opacity) observed Triple Quad 5500, Milan, Italy), equipped with a Turbo ion ESI
in the rats in these two groups. The rats in these groups were source. Analytes were separated on a reversed-phase C18 column
provided with the intervention diet for 4 days, followed by 3 days (Kinetex 100 × 2.1 mm, 1.7 µm particle size, Phenomenex) at
on starch (control) diet, from week 3 through 12 of the study. a flow rate of 0.35 µL min−1 . A gradient mobile phase compo-
During the study, only one rat (from starch + FOS group) died, sition of 95/5–40/60 over 25 min in 5 nM heptafluorobutanoic
due to volvulus. acid/acetonitrile was adopted. The liquid chromatograph column
 eluent was delivered to the Turbo ion source using nitrogen as a
2.2. Biochemical Analyses sheath (GS1) and curtain (CUR) gas, and air as reagent gas (GS2).
 The source voltage was set at 4.5 kV in positive mode, CUR 26 ar-
Plasma AGEs, uric acid, creatinine, urea, alanine aminotrans- bitrary units (arb), GS1 45 arb, and GS2 50 arb. The heated capil-
ferase (ALT), alkaline phosphatase (ALP), aspartate aminotrans- lary was maintained at 275 °C. The MRM transitions and param-
ferase (AST), triglycerides, total cholesterol, high-density lipopro- eters were as follows: Nɛ-(carboxymethyl)lysine (m/z) 205@84,
tein (HDL), low-density lipoprotein/very low-density lipoprotein declustering potential (DP) 100 V, entrance potential (EP) 7 V, col-
(LDL/VLDL), C-reactive protein (CRP), zonulin, endotoxin, and lision energy (CE) 32 V; pentosidine (m/z) 379@316, DP 120 V,
serum insulin were measured. EP 11 V, CE 33 V; and lysine (m/z) 147@84, DP 80 V, EP 8 V,
 Insulin (E-EL-R2466), CRP (E-EL-R0022), and creatinine (E- CE 21 V. Quantification of analytes was performed using CML,
EL-0058) were analyzed using commercial sandwich enzyme- pentosidine, and lysine analytical standard calibration curves at
linked immunosorbent assays (ELISA) and urea (E-BC-K183). concentrations of 10, 50, 100, 250, 300, and 500 µg L−1 . Measured
ALT (E-BC-K235), ALP (E-BC-K092), AST (E-BC-K236), uric acid concentration of analytes in samples was always within the linear
(E-BC-K016), and triglycerides (E-BC-K238) were analyzed us- range of calibration. Coefficient of variation for the above analy-
ing a colorimetric method purchased from Elabscience Biotech- ses ranged from 8% to 14%.
nology Inc., UK. Cholesterol assay kits for assessment of HDL
and LDL/VLDL colorimetric assay kits (ab65390) were pur-
chased from Abcam plc., UK. Zonulin (MBS747447) and endo- 2.3. Statistical Analysis
toxin (MBS2606662) were analyzed using ELISA (MyBiosource,
Inc., USA). All measurements were conducted according to the Statistical analysis was carried out using SAS statistical analysis
manufacturer’s instructions. Homeostasis model assessment- software (release 9.4; SAS Institute, Cary, NC, USA). Changes in
estimated insulin resistance (HOMA-IR) was calculated accord- BW over the 12 week study period were analyzed by repeated-
ing to the formula: fasting insulin (uIU dL−1 ) × fasting glucose measures analysis of variance (ANOVA). Differences between
(mg dL−1 )/405.[35] diets were evaluated by one-way ANOVA, followed by Tukey’s
 AGEs in plasma were measured by ultra high-performance multiple comparison test. Effect of diet after 12 weeks was
liquid chromatography (UHPLC)-tandem mass spectrometry,[22] the primary outcome. If effects of specific diets were observed

Mol. Nutr. Food Res. 2021, 65, 2001133 2001133 (3 of 10) © 2021 The Authors. Molecular Nutrition & Food Research published by Wiley-VCH GmbH
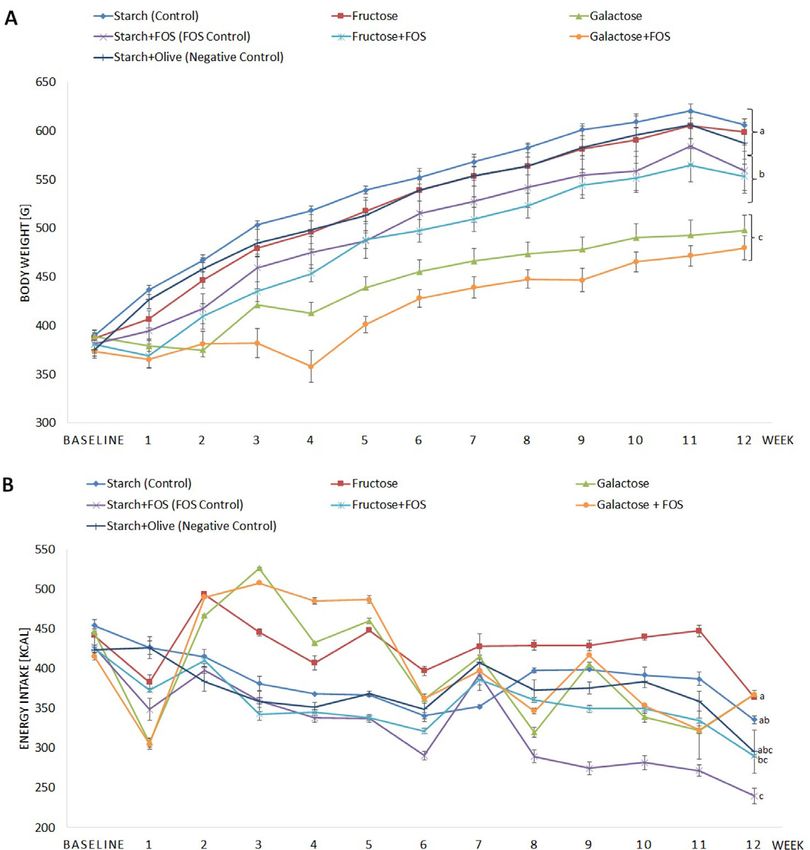
www.advancedsciencenews.com www.mnf-journal.com

Figure 1. Effects of high-carbohydrate diets (fructose and galactose), with and without fructooligosaccharides (FOS), on A) body weight (g) and B)
energy intake (kcal) in rats during the 12 week study. Body weight and energy intake analyzed by repeated-measures. ANOVA with Tukey’s test was used
to compare differences between groups. Means with different superscripts (lowercase letters) are significantly different (p < 0.05).

after 12 weeks, a secondary analysis was conducted to evalu- groups between 3 and 6 weeks (Figure 1B). Despite the higher
ate whether effects were evident already after 6 weeks. Assump- energy intake after 12 week intervention, the rats in the galactose
tion of normality and homogeneity of variance were tested using and galactose + FOS groups gained less weight than the other
the Shapiro–Wilks test. Data not normally distributed were log- groups. Moreover, higher energy intake was observed in the fruc-
transformed prior to analysis. Values of p < 0.05 were considered tose than starch + FOS (FOS control) and fructose + FOS groups,
significant. All results are presented as least square (LS) means but no significant difference was observed in BW changes.
± standard error of the mean (SEM), adjusted for baseline values
obtained from the baseline group to nullify pre-existing differ-
ences. 3.2. Effects on Blood Glucose and Insulin

3. Results No significant difference was found in blood glucose concentra-
 tion between the groups after 12 weeks. Significantly higher in-
3.1. Effects of Diet on Energy Intake and BW sulin concentration was observed in the galactose + FOS group
 compared with the starch + FOS (FOS control) group after 12
After 12 weeks of ad libitum isocaloric food intake, rats on the weeks. Insulin concentration was also higher in the galactose +
galactose and galactose + FOS diets (groups 3 and 6) had signifi- FOS group compared with the starch (control), fructose + FOS,
cantly lower BW than the other groups (Figure 1A). These differ- and starch + FOS (FOS control) groups after 6 weeks (data not
ences became evident after 3 weeks of intervention. The galactose shown). HOMA-IR concentration was significantly higher in the
and galactose + FOS groups had lower energy intake at the begin- fructose group than in all other groups except fructose + FOS
ning of the experiment, but higher energy intake than the other and galactose + FOS (Table 2).

Mol. Nutr. Food Res. 2021, 65, 2001133 2001133 (4 of 10) © 2021 The Authors. Molecular Nutrition & Food Research published by Wiley-VCH GmbH
www.advancedsciencenews.com www.mnf-journal.com

Table 2. Effects of high-carbohydrate diets (fructose and galactose), with and without additional fructooligosaccharides (FOS), on metabolic factors in
rat plasma after 12 weeks.

 Diets

 Starch Starch + olive Starch + FOS Fructose Fructose + FOS Galactose Galactose + FOS
 (control) (negative control) (FOS control)

Blood glucose [mg dL−1 ] 61.67 ± 5.70 54.17 ± 2.10 64.00 ± 7.13 73.50 ± 7.59 70.00 ± 7.39 55.00 ± 4.86 54.00 ± 3.52
 a) )
Insulin [ng mL−1 ] 6.33 ± 0.82ab 5.42 ± 0.57ab 4.50 ± 0.57b 6.62 ± 0.70ab 6.74 ± 0.79ab 6.14 ± 0.41ab 7.89 ± 0.35a
HOMA-IR [mg dL−1 ] 20.27 ± 0.98b 18.18 ± 2.23b 17.30 ± 2.33b 29.78 ± 4.02a 28.46 ± 3.86ab 20.8 ± 2.55b 25.87 ± 1.49ab
 a)
HOMA-IR, homeostasis model assessment-estimated insulin resistance. Measured in serum. Values shown are LS mean ± SEM of six rats. Groups were compared by
one-way ANOVA followed by Tukey’s test. LS mean with different superscripts (lowercase letters) differ significantly (p < 0.05).

Figure 2. Effects of high-carbohydrate diets (fructose and galactose), with and without fructooligosaccharides (FOS), on lipid profiles in rat plasma
after 12 weeks. A) Total cholesterol, B) triglycerides, C) high-density lipoprotein (HDL), and D) low-density lipoprotein/very low-density lipoprotein
(LDL/VLDL). Values shown are LS mean ± SEM of six rats. Groups were compared by one-way ANOVA followed by Tukey’s test. LS means with different
superscripts (lowercase letters) differ significantly (p < 0.05).

3.3. Effects on Lipid Profile HDL concentration with addition of FOS to the diet. However,
 a decreasing trend in LDL/VLDL concentration was seen in the
Plasma cholesterol concentrations were significantly higher in galactose + FOS group. No difference between diets was observed
the galactose and galactose + FOS groups than in the starch for triglyceride concentration after 12 weeks (Figure 2B).
+ FOS group after 12 weeks (Figure 2A). However, lower total
cholesterol concentration was observed in the galactose + FOS
and starch + olive (negative control) groups than in other groups 3.4. Effects on Inflammatory Biomarkers
at 6 week (data not shown).
 Plasma HDL concentration was significantly higher in the No significant differences between the diets were found for any
galactose + FOS group compared with the starch + FOS (FOS of the inflammation biomarkers analyzed, i.e., CRP, TNF- , IL-6,
control) after 12 weeks (Figure 2C). Significantly higher HDL and IL-1 , after 12 weeks (Figure 3).
concentration was also observed in the galactose and galactose
+ FOS groups than in all other groups except fructose group at
6 week (data not shown). Moreover, LDL/VLDL concentration 3.5. Effects of Diet on AGEs—Inflammation-Related Markers
was significantly higher in the fructose + FOS and galactose
groups than in the starch + FOS (FOS control) group (Figure 2D). Plasma concentrations of CML were significantly higher in the
At 6 week, LDL/VLDL concentration was significantly higher in galactose and starch + olive (negative control) groups than in
the galactose group than in the other groups (data not shown). In the starch (control), starch + FOS (FOS control), and fructose
general, no clear pattern was observed for total cholesterol and + FOS groups after 12 weeks. Significantly higher pentosidine

Mol. Nutr. Food Res. 2021, 65, 2001133 2001133 (5 of 10) © 2021 The Authors. Molecular Nutrition & Food Research published by Wiley-VCH GmbH
www.advancedsciencenews.com www.mnf-journal.com

Figure 3. Effects of high-carbohydrate diets (fructose and galactose), with and without fructooligosaccharides (FOS), on pro-inflammatory biomarkers
in rat plasma after 12 weeks. A) C-reactive protein (CRP), B) tumor nuclear factor-alpha (TNF- ), C) interleukin-6 (IL-6), and D) interleukin-1 (IL-1 ).
Values shown are LS mean ± SEM of six rats. Groups were compared by one-way ANOVA followed by Tukey’s test. LS means with different superscripts
(lowercase letters) differ significantly (p < 0.05).

concentration was found in the galactose group compared with 12 week intervention. A high amount of the omega-6 linoleic
the starch (control), starch + FOS (FOS control), and fructose acid was added in all diets except starch + olive (negative con-
+ FOS groups. Moreover, both CML and pentosidine concentra- trol), to elicit low-grade inflammation.[36] Numerous studies have
tions were significantly higher in the starch + FOS (FOS control) investigated the effects of diets rich in simple carbohydrates on
group than in other groups at 6 week (data not shown). In gen- metabolic factors and inflammation.[37] To our knowledge, this is
eral, lower CML and pentosidine concentration were observed in the first animal study to evaluate the impact of high-fructose and
both the fructose and galactose groups after treatment with FOS high-galactose diets to which FOS had been added to mitigate
(Figure 4A,B). the adverse effects of these simple sugars. In general, the inter-
 Lysine concentration was significantly higher in the galactose vention diets affected several metabolic factors and gut integrity
+ FOS group compared with all other groups except starch + olive markers, but no significant changes in inflammatory markers
(negative control) and starch + FOS (FOS control) (Figure 4C). At were found.
6 week, lysine concentration was significantly higher in the starch The results showed that a high-galactose diet (with or without
+ olive (negative control) group than in all other groups except FOS) resulted in a smaller increase in BW between weeks 3 and
starch + FOS (data not shown). Overall, lysine concentration in- 12 of intervention than the other diets tested. In addition, clinical
creased for the fructose and galactose diets with added FOS. symptoms were manifested in rats in the galactose and galactose
 + FOS groups, with most rats in these two groups displaying
3.6. Effects on Intestinal Permeability Parameters polyuria and lens opacity after 2 weeks of intervention. Similarly,
 previous studies have shown that rats fed galactose doses corre-
Significantly higher zonulin concentration was observed in the sponding to 50% of total energy in the diet did not gain weight
galactose + FOS group compared with the fructose and starch normally.[38,39] The dose fed in those studies and in the present
+ olive (negative control) groups after 12 weeks. Endotoxin con- study (50%E) might have been high enough to induce a toxic
centration was significantly lower in the galactose group than in effect of galactose,[40,41] which could have affected measurement
the starch (control) and starch + olive (control) groups (Figure 5). of metabolic markers in our intervention. Another study found
At 6 week, zonulin concentration was significantly higher in the that intake of galactose at 12% of total energy for 3 weeks caused
galactose and galactose + FOS groups than in the starch (con- lower BW in rats, which was alleviated when galactose was
trol), starch + FOS (FOS control), and fructose groups, whereas reduced to 10% of total energy in the diet.[39] High intake of
endotoxin concentration was significantly lower in the galactose galactose is reported to result in a significant proportion of the
+ FOS than fructose + FOS group (data not shown). galactose being excreted with the urine,[38,42] causing the rats
 fed the galactose and galactose + FOS diets in the present study
4. Discussion to drink large amounts of water and to develop polyuria, due
 to the osmotic effect of galactose.[38,39] It has been shown that a
This study investigated the effects of high intake of fructose and high dose of galactose increases hepatic uridylation of galactose,
galactose, with and without additional FOS, on metabolic fac- leading to hypergalactosemia and loss of galactose into the
tors and inflammatory and gut integrity markers in rats after a urine.[43] The unmetabolized galactose is then converted into

Mol. Nutr. Food Res. 2021, 65, 2001133 2001133 (6 of 10) © 2021 The Authors. Molecular Nutrition & Food Research published by Wiley-VCH GmbH
www.advancedsciencenews.com www.mnf-journal.com

 Figure 5. Effects of high-carbohydrate diets (fructose and galactose), with
 and without fructooligosaccharides (FOS), on A) zonulin and B) endotoxin
 in rat plasma after 12 weeks. Values shown are LS mean ± SEM of six
 rats. Groups were compared by one-way ANOVA followed by Tukey’s test.
 LS means with different superscripts (lowercase letters) differ significantly
 differ (p < 0.05).

 mal and human studies have shown that intake of fructose, com-
 pared with glucose, sucrose, and lactose, has only minor effects
 on blood glucose and insulin.[47] Similarly, little effect on fast-
 ing blood glucose was observed in rats fed the fructose diet that
 may be due to slow absorption rate and because fructose is first
 converted to glucose in the liver.[47] Galactose also has little im-
 pact on blood glucose due to hepatic metabolism and interference
Figure 4. Effects of high-carbohydrate diets (fructose and galactose), with with glucose release from the liver, inducing hypoglycemia.[47,48]
and without fructooligosaccharides (FOS), on advanced glycation end
products (AGEs) in rats. A) Nɛ-(carboxymethyl)lysine (CML), B) pentosi-
 However, high insulin concentration was observed in rats fed the
dine, and C) lysine after 12 weeks. Values shown are LS mean ± SEM of six galactose + FOS diet and it could be explained by the incretin
rats. Groups were compared by one-way ANOVA followed by Tukey’s test. effect, i.e., insulin secretion induced by glucagon-like peptide-
LS means with different superscripts (lowercase letters) differ significantly 1 (GLP-1) and/or glucose-dependent insulinotrophic polypeptide
(p < 0.05). (GIP).[49] It has been shown that galactose stimulates GIP secre-
 tion, and subsequently insulin secretion, in humans.[49,50] A diet
 with additional FOS could also contribute to increased incretin
galactitol by aldose reductase, which causes cataracts in animal secretion, through gut fermentation.[51] Gut fermentation of FOS
models.[17,39,42] leads to increased SCFA production, which has been shown to
 Energy intake in the galactose and galactose + FOS groups was enhance GLP-1 and GIP secretion by intestinal L-cells.[51] We
lower than in the other groups at the beginning of the interven- measured the HOMA-IR index to assess insulin resistance.
tion. However, after modification of the feeding plan for these two We expected the diets high in sugar to alter concentrations
groups, the energy intake increased to reach a level similar to that of blood lipids, including total cholesterol, HDL, LDL/VLDL,
of the other groups after 5 weeks. This may reflect the adaptation and triglycerides, as reported in previous studies.[52,53] For ex-
period of the galactose-fed rats to a new dietary regime.[38,44] ample, it has been shown that a high-fructose diet may re-
 Adverse metabolic effects of high-sugar diets, particularly fruc- sult in acute and chronic alteration of blood lipids,[54] and
tose and galactose, have been reported previously.[45,46] Both ani- that a diet containing higher fructose than glucose can cause

Mol. Nutr. Food Res. 2021, 65, 2001133 2001133 (7 of 10) © 2021 The Authors. Molecular Nutrition & Food Research published by Wiley-VCH GmbH
www.advancedsciencenews.com www.mnf-journal.com

lipid abnormalities, including increased total cholesterol, LDL, and CML in the brain.[65] Previous studies have suggested that
and triglyceride concentrations.[52] D-galactose treated mice have high fructose and glucose concentrations also play an important
also been reported to demonstrate an increase in cholesterol role in facilitating the accumulation of pentosidine in the skin,
concentration.[55] In line with previous findings, we observed aortic tracheal, and tendon tail collagen in rodents.[66,67] Lysine
higher total cholesterol concentration in rats fed the galactose and arginine are major sites of glycation in many proteins, in-
and galactose + FOS diets than the starch + FOS (FOS control) cluding hemoglobin and albumin. Antiglycation activity is usu-
diet. In other studies on both humans and animals, FOS has been ally assessed through estimation of carbonyl content and free
reported to reduce cholesterol concentration,[56] so the increase lysine.[68] Significantly higher lysine concentration was found in
we observed in total cholesterol concentration in the galactose + the galactose + FOS group in this study. Overall, the analysis of
FOS group after the 12 week intervention remains unexplained. AGE concentrations in groups of rats receiving different types of
Many studies have reported decreases in HDL concentration af- carbohydrates demonstrated a lowering of CML and pentosidine
ter high fructose or high galactose intake.[52,55] In contrast, we concentrations with added FOS.
observed a similar response in HDL as in total cholesterol con- The intestinal barrier plays a vital role in regulation of host
centration after high intake of fructose and galactose, for under- immune function and health.[69] Zonulin, a protein involved
lying reasons that are still unclear. Our results are in agreement in regulation of epithelial tight junctions in the small and
with previous studies reporting unfavorable effects of high sugar large intestine, has been proposed as a biomarker of intestinal
intake in increasing LDL cholesterol [57] after a few weeks of high permeability.[70] Higher expression of zonulin has been found
fructose and galactose intake.[57,58] Higher LDL/VLDL concentra- in the early stage of disease.[71] Higher expression of endo-
tions were observed in rats fed the fructose + FOS and galactose toxin in the blood indicates epithelial barrier dysfunction and
diets than the starch + FOS (FOS control) diet. Overall, a decreas- promotes inflammatory processes.[72] Endotoxin, also known as
ing trend in LDL/VLDL concentration was observed in rats fed lipopolysaccharides (LPS), is a major component of the outer
the galactose + FOS diet. Although numerous studies on rodents membrane of Gram-negative bacteria. Fructose malabsorption
report higher plasma triglycerides due to lipogenesis induced by promotes gut permeability, and higher fructose intake promotes
fructose intake,[54,59] our study did not support these findings. gut inflammation and an accompanying rise in blood endotoxin
Reduced triglyceride concentration after ingestion of FOS and concentrations due to endothelial dysfunction and decline of
oligofructose due to inhibition of hepatic de novo fatty acid syn- tight-junction proteins.[29,73] In this study, inconsistent changes
thesis [56] could explain the trend for a lowering in triglyceride in zonulin concentrations were observed in response to endo-
concentration observed after intake of FOS in this study. toxin expression in the plasma.
 The major AGEs from exogenous sources are methylglyoxal- One potential reason for lower expression of zonulin and en-
hydroimidazole (MG-H1), CML, carboxyethyl-lysine, pentosi- dotoxin after the 12 week intervention may be a protective effect
dine, and pyrraline.[60] CML and pentosidine are commonly used of intestinal alkaline phosphatase (IAP). Emerging studies on the
as biomarkers of glycation processes.[61] Numerous studies have favorable effects of IAP in different organs in humans and ani-
suggested that diets high in fructose and galactose increase AGE mals have found that animal ALP consists of two classes: 1) tissue
accumulation in different tissues.[19,62] Direct comparison of dif- non-specific ALP, expressed in liver, kidney, bone, and plasma
ferent carbohydrate dietary regimens on systemic AGE concen- and 2) tissue-specific isozymes, including IAP, which play an im-
trations was performed for the first time in the present study. portant role in intestinal homeostasis and health through inter-
The results showed a tendency for higher concentrations of AGEs action with gut microbiota, diet, and gut.[74] In the intestine, IAP
in rats exposed to the galactose diet compared with the fruc- detoxifies endotoxin and protects the host from bacterial inva-
tose diet, despite lower weekly exposure to simple sugar in the sion by dephosphorylation of bacterial-derived LPS and is sug-
galactose groups compared with the fructose groups. These find- gested to be a potential intestinal microbiota regulator.[75] More-
ings may suggest higher reactivity of galactose in terms of evok- over, IAP is expressed and secreted by intestinal epithelium and
ing protein glycation compared with fructose in our experimen- remains biologically active in the intestinal lumen and mucosal
tal conditions. However, we cannot exclude the possibility that membrane.[74] We analyzed ALP concentrations in plasma, and
the high AGE concentrations detected in the galactose groups not in the intestine, and were therefore unable to confirm pre-
were a consequence of the toxic impact of galactose, which would vious findings (Table S1, Supporting Information). However, it
confirm the role of AGEs as early biomarkers of sugar-induced has been reported that around 1–2% of IAP is secreted into the
changes in health status. We observed an increase in CML con- blood circulation, which may widen its activity towards systemic
centrations in the galactose and starch + olive (negative control) infections.[74] Dietary fermentable fiber, including FOS, galac-
groups compared with the starch (control), starch + FOS (FOS tooligosaccharides, and raffinose, also increases colonic and in-
control), fructose, and fructose + FOS groups, where systemic testinal activity.[76]
CML concentrations reached their highest level after 12 weeks. Our study has several limitations. First, the high dose of
Pentosidine, a fluorescent lysine-arginine cross-linked AGE com- fructose and galactose used may have caused a mild toxic effect
pound derived from pentose, was present at higher concentra- on the rats. Second, slight changes in the study design due to
tions in plasma of the galactose group than in other groups in clinical symptoms as demonstrated in the rats fed the galactose
this study. Accumulation of both CML and pentosidine has been and galactose + FOS diets made the interpretation of the results
linked with pathological development such as chronic kidney dis- more challenging. Third, the results from the present rat study
ease and Alzheimer’s disease.[63,64] Although pentosidine is typi- cannot be directly translated to humans. Nevertheless, this study
cally formed from a pentose, treatment with D-galactose in mice has also several strengths. First, the study was large and com-
for 8 weeks has demonstrated an accumulation of pentosidine pared the effects of different sugars with and without added fiber

Mol. Nutr. Food Res. 2021, 65, 2001133 2001133 (8 of 10) © 2021 The Authors. Molecular Nutrition & Food Research published by Wiley-VCH GmbH
www.advancedsciencenews.com www.mnf-journal.com

under isocaloric conditions. Second, three control groups were Keywords
included that allowed us to evaluate the effects of the sugars,
sugar with added FOS, and the impact of added n-6 to evoke fructooligosaccharides, fructose, galactose, gut integrity, inflammatory
 markers
inflammation. Third, by using a rat model, we could control the
conditions to minimize the environmental conditions that may
 Received: December 17, 2020
otherwise have affected the results. Published online: February 25, 2021
 In summary, type of carbohydrate in the diet affects metabolic
effects in a complex way and the net effects are difficult to pre-
dict. The results in the present study indicated that high-galactose
and galactose + FOS diets have more severe adverse effects on [1] K. J. Newens, J. Walton, J. Hum. Nutr. Diet. 2016, 29, 225.
metabolic factors, lipid profiles, AGEs, and intestinal permeabil- [2] M. B. Vos, J. E. Kimmons, C. Gillespie, J. Welsh, H. M. Blanck, Med-
ity than high-fructose and fructose + FOS diets. However, the ef- scape J. Med. 2008, 10, 160.
fects obtained for the galactose and galactose + FOS groups may [3] W. C. Dornas, W. G. de Lima, M. L. Pedrosa, M. E. Silva, Adv. Nutr.
 2015, 6, 729.
have been confounded by the clinical symptoms manifested in
 [4] A. H. Malik, Y. Akram, S. Shetty, S. S. Malik, V. Y. Njike, Am. J. Cardiol.
these groups at the beginning of the intervention. We found no 2014, 113, 1574.
clear benefits of added FOS in the diet as a strategy to mitigate [5] K. L. Stanhope, J. M. Schwarz, P. J. Havel, Curr. Opin. Lipidol. 2013,
the adverse effects of high fructose and high galactose intake. Fur- 24, 198.
ther studies should seek to determine the threshold dietary dose [6] J. Lunn, J. L. Buttriss, Nutr. Bull. 2007, 32, 21.
of galactose to avoid manifestation of clinical symptoms and the [7] C. A. Williams, in “Galactose,” in Encyclopedia of Food Sciences and
optimal dose for FOS to obtain significant beneficial effects. Mea- Nutrition, (Ed: B. Caballero), 2nd ed., Academic Press, Oxford, UK
surement of IAP concentration could be included in future stud- 2003 pp. 2843–2846.
ies, as IAP plays an essential role in gut integrity, inflammation, [8] J. H. Cummings, A. M. Stephen, Eur. J. Clin. Nutr. 2007, 61, S5.
and microbiota composition. [9] J. M. Rippe, T. J. Angelopoulos, Adv. Nutr. 2015, 6, 493S.
 [10] V. S. Malik, B. M. Popkin, G. A. Bray, J.-P. Després, F. B. Hu, Circulation
 2010, 121, 1356.
 [11] R. Mastrocola, M. Collino, C. Penna, D. Nigro, F. Chiazza, V. Fracasso,
Supporting Information
 F. Tullio, G. Alloatti, P. Pagliaro, M. Aragno, Oxid. Med. Cell Longev.
Supporting Information is available from the Wiley Online Library or from 2016, 2016, 3480637.
the author. [12] B. Maiztegui, M. I. Borelli, M. A. Raschia, H. Del Zotto, J. J.
 Gagliardino, J. Endocrinol. 2009, 200, 139.
 [13] M. R. Taskinen, C. J. Packard, J. Boren, Nutrients 2019, 11, 1987.
Acknowledgements [14] R. Mastrocola, M. Collino, M. Rogazzo, C. Medana, D. Nigro, G. Boc-
 cuzzi, M. Aragno, Am. J. Physiol.-Gastr. L. 2013, 305, G398.
The authors thank Nadine Sus for excellent technical support and coor- [15] M. B. Pektas, H. B. Koca, G. Sadi, F. Akar, Biomed Res. Int. 2016, 2016,
dination of the rat experiment. This study was funded by grants from the 8014252.
Swedish Research Council (Dnr 2017-05840; Formas Dnr 2016-003114) [16] O. G. Yildirim, E. Sumlu, E. Aslan, H. B. Koca, M. B. Pektas, G. Sadi,
and was supported by a starting grant of Professor Rikard Landberg from
 F. Akar, Toxicol Mech. Methods 2019, 29, 224.
the Chalmers University of Technology Foundation. N.A.M.O. was funded
 [17] A. Flynn. Encyclopedia of Dairy Sciences, 2nd ed., Academic Press, San
by a scholarship from the Ministry of Higher Education Malaysia and Uni-
 Diego 2011.
versiti Malaysia Pahang.
 [18] F. Ullah, T. Ali, N. Ullah, M. O. Kim, Neurochem. Int. 2015, 90, 114.
 [19] X. Song, M. Bao, D. Li, Y. M. Li, Mech. Ageing Dev. 1999, 108, 239.
 [20] M. Collino, World J. Diabetes 2011, 2, 77.
Conflict of Interest [21] J. W. Baynes, Exp. Gerontol. 2001, 36, 1527.
The authors declare no conflict of interest. [22] R. Mastrocola, D. Nigro, F. Chiazza, C. Medana, F. Dal Bello, G. Boc-
 cuzzi, M. Collino, M. Aragno, Free Radic. Biol. Med. 2016, 91, 224.
 [23] J. Y. Woo, W. Gu, K. A. Kim, S. E. Jang, M. J. Han, D. H. Kim, Anaerobe
Author Contributions 2014, 27, 22.
 [24] R. Gill, A. Tsung, T. Billiar, Free Radic. Biol. Med. 2010, 48, 1121.
N.A.M.O. designed and conducted the experiments, performed sampling [25] R. E. Post, A. G. Mainous, D. E. King, K. N. Simpson, J. Am. Board
and statistical analysis, interpreted the results, and wrote the manuscript. Fam. Med. 2012, 25, 16.
J.F. contributed to designing the study, conducting the experiments, and [26] D. E. King, Mol. Nutr. Food Res. 2005, 49, 594.
interpretation of results, and participated in manuscript writing. J.K. con- [27] M. Rossi, C. Corradini, A. Amaretti, M. Nicolini, A. Pompei, S. Zanoni,
tributed to conducting the experiments. F.D.B. and C.M. contributed to S. D. Matteuzzi, Appl. Environ. Microbiol. 2005, 71, 6150.
sample analysis and interpretation of results. M.C. contributed to sample
 [28] M. A. R. Vinolo, H. G. Rodrigues, R. T. Nachbar, R. Curi, Nutrients
analysis, interpretation of results, and manuscript writing. G.Z., K.M., and
 2011, 3, 858.
A.W. contributed to designing the experiments and critically reviewed the
 [29] V. Volynets, S. Louis, D. Pretz, L. Lang, M. J. Ostaff, J. Wehkamp, S.
manuscript. R.L. conceived the present study, contributed to interpreta-
tion of results and manuscript writing, and had overall responsibility for C. Bischoff, J. Nutr. 2017, 147, 770.
the study. [30] K. Dziadek, A. Kopeć, E. Piatkowska,
 ˛ T. Leszczyńska, Nutrients 2019,
 11, 2638.
 [31] S. K. Wong, K.-Y. Chin, F. H. Suhaimi, A. Fairus, S. Ima-Nirwana, Nutr.
Data Availability Statement Metab. 2016, 13, 65.
 [32] C. Bo-Htay, S. Palee, N. Apijai, S. C. Chattipakorn, N. Chattipakorn,
Data available on request from the authors. J. Cell. Mol. Med. 2018, 22, 1392.

Mol. Nutr. Food Res. 2021, 65, 2001133 2001133 (9 of 10) © 2021 The Authors. Molecular Nutrition & Food Research published by Wiley-VCH GmbH
www.advancedsciencenews.com www.mnf-journal.com

[33] M. El Riachy, A. Hamade, R. Ayoub, F. Dandachi, L. Chalak, Front Nutr. [57] J. J. DiNicolantonio, S. C. Lucan, J. H. O’Keefe, Prog. Cardiovasc. Dis.
 2019, 6, 64. 2016, 58, 464.
[34] A. Yorulmaz, H. Erinc, A. Tekin, J. Am. Oil Chem. Soc. 2013, 90, 647. [58] S. Szanto, J. Yudkin, Postgrad. Med. J. 1969, 45, 602.
[35] A. Ahangarpour, A. A. Oroojan, M. Badavi, Pathobiol. Aging Age Relat. [59] G. Livesey, R. Taylor, Am. J. Clin. Nutr. 2008, 88, 1419.
 Dis. 2018, 8, 1418593. [60] M. W. Poulsen, R. V. Hedegaard, J. M. Andersen, B. de Courten, S.
[36] J. K. Innes, P. C. Calder, Prostaglandins Leukot. Essent. Fatty Acids 2018, Bugel, J. Nielsen, L. H. Skibsted, L. O. Dragsted, Food Chem. Toxicol.
 132, 41. 2013, 60, 10.
[37] A. E. Buyken, J. Goletzke, G. Joslowski, A. Felbick, G. Cheng, C. [61] J. Uribarri, M. D. del Castillo, M. P. de la Maza, R. Filip, A. Gugliucci, C.
 Herder, J. C. Brand-Miller, Am. J. Clin. Nutr. 2014, 99, 813. Luevano-Contreras, M. H. Macias-Cervantes, D. H. Markowicz Bas-
[38] N. Bank, M. Coco, H. S. Aynedjian, Am. J. Physiol. Cell Physiol. 1989, tos, A. Medrano, T. Menini, M. Portero-Otin, A. Rojas, G. R. Sampaio,
 256, F994. K. Wrobel, K. Wrobel, M. E. Garay-Sevilla, Adv. Nutr. 2015, 6, 461.
[39] L. Ji, C. Li, N. Shen, Y. Huan, Q. Liu, S. Liu, Z. Shen, Int. J. Clin. Exp. [62] M. Aragno, R. Mastrocola, Nutrients 2017, 9, 385.
 Med. 2015, 8, 12874. [63] X. Gironès, A. Guimerà, C. Z. Cruz-Sánchez, A. Ortega, N. Sasaki, Z.
[40] K. Lai, L. J. Elsas, K. J. Wierenga, IUBMB Life 2009, 61, 1063. Makita, J. V. Lafuente, R. Kalaria, F. F. Cruz-Sánchez, FreeRadic. Biol.
[41] J. C. Haworth, J. D. Ford, M. K. Younoszai, Pediatr. Res. 1969, 3, 441. Med. 2004, 36, 1241.
[42] J. W. Patterson, Am. J. Physiol. 1954, 177, 541. [64] A. Machowska, J. Sun, A. R. Qureshi, N. Isoyama, B. Anderstam, O.
[43] C. B. Niewoehner, B. Neil, Am. J. Physiol. 1992, 263, E42. Heimburger, P. Barany, P. Stenvinkel, B. Lindholm, PLoS One 2016,
[44] W. B. Lorentz, Jr., Z. K. Shihabi, N. Weidner, Clin. Physiol. Biochem. 11, e0163826.
 1987, 5, 261. [65] S. J. Tsai, M. C. Yin, Food Chem. Toxicol. 2012, 50, 3198.
[45] K. L. Stanhope, Crit. Rev. Clin. Lab. Sci. 2016, 53, 52. [66] L. B. Lingelbach, A. E. Mitchell, R. B. Rucker, R. B. McDonald, J. Nutr.
[46] L. A. Te Morenga, A. J. Howatson, R. M. Jones, J. Mann, Am. J. Clin. 2000, 130, 1247.
 Nutr. 2014, 100, 65. [67] K. Mikulíková, A. Eckhardt, J. Kunes, J. Zicha, I. Miksík, Physiol. Res.
[47] X. Qi, R. F. Tester, Clin. Nutr. ESPEN 2019, 33, 18. 2008, 57, 89.
[48] J. T. Gonzalez, C. J. Fuchs, J. A. Betts, L. J. C. van Loon, Nutrients 2017, [68] K. M. Abdullah, F. A. Qais, I. Ahmad, H. Hasan, I. Naseem, Int. J Biol
 9, 344. Macromol. 2018, 120, 1734.
[49] N. Ercan, F. Q. Nuttall, M. C. Gannon, J. B. Redmon, K. J. Sheridan, [69] M. Vancamelbeke, S. Vermeire, Expert Rev. Gastroenterol. Hepatol.
 Metabolism 1993, 42, 1560. 2017, 11, 821.
[50] F. Q. Nuttall, M. C. Gannon, Diabetes Care 1991, 14, 824. [70] C. Sturgeon, A. Fasano, Tissue Barriers 2016, 4, e1251384.
[51] C. Le Bourgot, E. Apper, S. Blat, F. Respondek, Nutr. Metab. 2018, 15, [71] A. Fasano, T. Not, W. Wang, S. Uzzau, I. Berti, A. Tommasini, S. E.
 9. Goldblum, Lancet 2000, 355, 1518.
[52] E. J. Schaefer, J. A. Gleason, M. L. Dansinger, J. Nutr. 2009, 139, [72] S. S. Ghosh, J. Wang, P. J. Yannie, S. Ghosh, J. Endocr. Soc. 2020, 4,
 1257S. bvz039.
[53] E. Sonestedt, N. C. Overby, D. E. Laaksonen, B. E. Birgisdottir, Food [73] J. Lambertz, S. Weiskirchen, S. Landert, R. Weiskirchen, Front. Im-
 Nutr. Res. 2012, 56, 19104. munol. 2017, 8, 1159.
[54] B. Hieronimus, K. L. Stanhope, Curr. Opin. Lipidol. 2020, 31, 20. [74] M. Estaki, D. DeCoffe, D. L. Gibson, World J. Gastroenterol. 2014, 20,
[55] S. Y. Zhu, N. Jiang, J. Tu, J. Yang, Y. Zhou, Biomed. Environ Sci. 2017, 15650.
 30, 623. [75] J. M. Bates, J. Akerlund, E. Mittge, K. Guillemin, Cell Host Microbe
[56] G. T. Costa, G. C. Abreu, A. B. Guimaraes, P. R. Vasconcelos, S. B. 2007, 2, 371.
 Guimaraes, Acta Cir. Bras. 2015, 30, 366. [76] Y. Okazaki, T. Katayama, Br. J. Nutr. 2019, 121, 146.

Mol. Nutr. Food Res. 2021, 65, 2001133 2001133 (10 of 10) © 2021 The Authors. Molecular Nutrition & Food Research published by Wiley-VCH GmbH
You can also read