L-Dopa and Fluoxetine Upregulate Astroglial 5-HT2B Receptors and Ameliorate Depression in Parkinson's Disease Mice - MDPI
←
→
Page content transcription
If your browser does not render page correctly, please read the page content below
neuroglia

Article
L -Dopaand Fluoxetine Upregulate Astroglial 5-HT2B
Receptors and Ameliorate Depression in Parkinson’s
Disease Mice
Dan Song 1,† , Kangli Ma 1,† , Alexei Verkhratsky 2,3    ID
                                                              and Liang Peng 1, *
 1   Laboratory of Metabolic Brain Diseases, Institute of Metabolic Disease Research and Drug Development,
     China Medical University, 110122 Shenyang, China; sd_nature@hotmail.com (D.S.);
     springlili233@163.com (K.M.)
 2   Faculty of Biology, Medicine and Health, The University of Manchester, Manchester, M13 9PT, UK;
     Alexej.Verkhratsky@manchester.ac.uk
 3   Achucarro Center for Neuroscience, IKERBASQUE, Basque Foundation for Science, 48011 Bilbao, Spain
 *   Correspondence: sharkfin039@163.com
 †   These authors contributed equally to this work.

 Received: 19 March 2018; Accepted: 13 April 2018; Published: 23 April 2018

 Abstract: Here, we report the association between depressive behavior (anhedonia) and astroglial
 expression of 5-hydroxytryptamine receptor 2B (5-HT2B ) in an animal model of Parkinson’s disease,
 induced by bilateral injection of 6-hydroxydopamine (6-OHDA) into the striatum. Expression
 of the 5-HT2B receptor at the mRNA and protein level was decreased in the brain tissue of
 6-OHDA-treated animals with anhedonia. Expression of the 5-HT2B receptor was corrected by four
 weeks treatment with either L-3,4-dihydroxyphenylalanine (L-dopa) or fluoxetine. Simultaneously,
 treatment with L-dopa abolished 6-OHDA effects on both depressive behavior and motor activity.
 In contrast, fluoxetine corrected 6-OHDA-induced depression but did not affect 6-OHDA-induced
 motor deficiency. In addition, 6-OHDA downregulated gene expression of the 5-HT2B receptor
 in astrocytes in purified cell culture and this downregulation was corrected by both L-dopa and
 fluoxetine. Our findings suggest that 6-OHDA-induced depressive behavior may be related to the
 downregulation of gene expression of the 5-HT2B receptor but 6-OHDA-induced motor deficiency
 reflects, arguably, dopamine depletion. Previously, we demonstrated that fluoxetine regulates gene
 expression in astrocytes by 5-HT2B receptor-mediated transactivation of epidermal growth factor
 receptor (EGFR). However, the underlying mechanism of L-dopa action remains unclear. The present
 work indicates that the decrease of gene expression of the astroglial 5-HT2B receptor may contribute
 to development of depressive behavior in Parkinson’s disease.

 Keywords: 5-HT2B receptor; astrocytes; depressive behavior; Parkinson’s disease; fluoxetine

1. Introduction
     Parkinson’s disease (PD) is characterized by a progressive degeneration of dopaminergic midbrain
neurons in the substantia nigra pars compacta (SNpc) [1] and becomes clinically manifest when more
than 50% of SNpc neurons are lost. In addition to motor symptoms, which include resting tremor,
slowness of movement, rigidity, and postural instability, the non-motor symptoms, such as cognitive
deficits and behavioral abnormalities, have been recognized as integral part of the clinical presentation
of PD [2]. Depression is the frequent psychiatric signature of the PD and it is one of the most significant
factors affecting the quality of life of patients [3]. Whether L-3,4-dihydroxyphenylalanine (L-dopa)
treatment improves depression in PD is controversial (see [4] for review). Nevertheless, the serotonergic

Neuroglia 2018, 1, 48–62; doi:10.3390/neuroglia1010006                        www.mdpi.com/journal/neuroglia
Neuroglia 2018, 1 49
system is affected in PD patients and in some animal models [4], while 5-hydroxytryptamine (5-HT)
depletion may contribute to motor and non-motor symptoms of PD [5].
The role of astroglia in pathological evolution of PD remains to be revealed in detail, although both
astroglial reactivity and astrodegeneration with loss of function and compromised neuroprotective
capacity are documented [6,7]. It is generally acknowledged that the morbid changes associated
with depression include profound remodeling of neuroglia, and furthermore, the contribution
of astrocytes to the pathogenesis of various neuropsychiatric disorders is well appreciated [8,9].
Previously, we reported that fluoxetine, a selective serotonin reuptake inhibitor (SSRI) activates
astroglial 5-hydroxytryptamine receptor 2B (5-HT2B ) receptors which results in transactivation of
epidermal growth factor receptor (EGFR) [10]. We also found that expression of 5-HT2B receptors as
well as other signaling molecules is suppressed in astrocytes but not in neurons in the cerebral cortex
of anhedonic animals, which experienced chronic mild stress (CMS) [11,12]. Chronic treatment with
fluoxetine eliminated both decrease in expression of astroglial 5-HT2B receptors and anhedonia [11].
These findings corroborate the role for astrocytic 5-HT2B receptor in depressive behavior. Recently,
we also found a decrease in gene expression of astrocytic but not neuronal 5-HT2B receptor in animals
that received 1-methyl-4-phenyl-1,2,3,6-tetrahydropyridine (MPTP) and became anhedonic. Fluoxetine
corrected MPTP-induced decrease of 5-HT2B receptor expression and depressive behavior [13].
These findings indicate that changes in gene expression of 5-HT2B receptors in astroglia may be
associated with pathophysiological evolution of depression in PD.
Another animal model of PD is induced by a bilateral injection of 6-hydroxydopamine (6-OHDA)
into the striatum. 6-Hydroxydopamine has high affinity to dopamine transporter and the structure of
6-OHDA is similar to that of dopamine, but the presence of an additional hydroxyl group makes it toxic
to dopaminergic neurons [14]. Injection of 6-OHDA into the striatum induces retrograde degeneration
of tyrosine hydroxylase (TH)-positive terminals in the striatum which instigated death of TH positive
neurons in the SNpc, similarly to PD in humans [14]. Using the 6-hydroxydopamine animal model
of PD, this study aimed to examine effects of L-dopa and fluoxetine on the gene expression of the
5-HT2B receptor in primary cultures of astrocytes and in the brain of animals treated with 6-OHDA
and correlates these changes with the depressive behavior and motor deficits.
2. Materials and Methods
All experimental techniques were essentially similar to those employed in our previous studies
of astroglial 5-HT2B receptors [11–13]. All experiments were carried out in accordance with the USA
National Institutes of Health Guide for the Care and Use of Laboratory Animals (NIH Publication
No. 8023) and its 1978 revision, and all experimental protocols were preregistered and approved by
the Institutional Animal Care and Use Committee of China Medical University.
2.1. Animals
CD-1 mice (Charles River, Beijing, China), weighing 30–40 g, male C57BL/6 mice (Chang Sheng
Biotechnology, Benxi, China), weighing 22–26 g and mice with fluorescently tagged astrocytes
and neurons (males FVB/NT-g(GFAP-GFP)14Mes/J or B6.Cg-Tg(Thy1-YFPH)2 Jrs/J, respectively;
the Jackson Laboratory, Bar Harbor, ME, USA), weighing 20–25 g were kept at standard housing
conditions with light/dark cycle of 12 h. Water and food were provided at libitum.
2.2. 6-OHDA Treatment
C57BL/6 mice were anesthetized with pentobarbital and mounted in a stereotaxic frame.
Each mouse received a bilateral injection of 1 µL 6-OHDA (5 µg/µL in saline containing 0.02%
ascorbic acid) into the dorsal-lateral striatum, according to the following coordinates (mm):
antero-posterior + 0.5, medio-lateral ± 2, and dorso-ventral −3. Control sham-lesioned mice were
injected with the same volume of vehicle (saline). After surgery, the animals were allowed to recover
for three weeks.Neuroglia 2018, 1 50
2.3. Drug Treatment
After three-week recovery from the 6-OHDA lesions, anhedonic mice were daily injected
intraperitoneally with fluoxetine (10 mg/kg/d dissolved in saline) or L-dopa (20 mg/kg/d in saline
and combined with 12 mg/kg/d of benserazide) for four weeks. In the present study, mice were
separated into six groups: (1) sham-lesioned animals treated with saline (Control); (2) sham-lesioned
animals treated with fluoxetine (Flu); (3) sham-lesioned animals treated with L-dopa (L-dopa);
(4) 6-OHDA-lesioned animals treated with saline (6-OHDA); (5) 6-OHDA-lesioned animals treated with
fluoxetine (6-OHDA + Flu); (6) 6-OHDA-lesioned animals treated with L-dopa (6-OHDA + L-dopa).
Prior to surgery, three and seven weeks thereafter, mice underwent behaviour tests for
motor function and mood. After three weeks of 6-OHDA treatment, only mice with depressive
behavior (around 60%) were selected for L-dopa or fluoxetine treatment for another four weeks.
At the end of the experiments (seven weeks), mice were sacrificed and cerebral cortex was
dissected out for gene expression analysis of 5-HT2B receptor. FVB/NT-g(GFAP-GFP)14Mes/J or
B6.Cg-Tg(Thy1-YFPH)2 Jrs/J mice were sacrificed after three-week recovery from the 6-OHDA lesions.
2.4. Behavioral Tests
Several behavioral tests were applied to 6-OHDA-treated mice to assess motor activity (pole test
and rotarod test) and depression behavior (sucrose preference test, forced swim, tail suspension and
open field tasks).
The pole test was performed as previously described [15] with minor modifications. The mouse
was placed head-upward on the top of a vertical rough-surfaced pole (diameter 1 cm; height 55 cm).
The time to turn downward from the top (T-turn time) and to descend to the floor (locomotor activity
time, T-LA time) were measured. The total time was recorded with a maximum duration of 30 s.
Motor coordination was assessed with rotarod test. Mice were positioned on a rotating bar set
to a rotation speed of up to 18 rpm during the test. The time spent on the rotating bar, known as the
latent period, was recorded. Latency to fall was recorded with a stopwatch, with a maximum of 90 s.
The test was repeated twice and mean latencies were analyzed.
The depressive behavior was assessed with despair-based tests represented by the tail suspension
test and forced swimming test, as well as with anxiety-based open field test. In tail suspension test
mice were individually suspended from their tails at the height of 20 cm using a piece of adhesive
tape wrapped around the tail 2 cm from the tip. Behavior was videotaped for 6 min. The duration
of immobility was measured by an observer blinded to the treatment groups. Mice were considered
immobile only when completely motionless and mice that climbed their tails were excluded from
the data.
In the forced-swimming test, animals were dropped into glass cylinders (20 × 20 cm) containing
20 cm deep water maintained at 25 ± 1 ◦ C and kept in water for 6 min. The time of immobility was
recorded during the last 4 min of the 6 min testing period, followed by 2 min of habituation.
In the open field test, mice were placed in the central square of the open field box (60 × 60 × 40 cm)
divided in to nine squares. Behavior was videotaped for 5 min. The parameters used for analysis
included number of squares crossed, frequency of rearing, and time spent in the central area.
The sucrose preference test is a reward-based test and provides a measure of anhedonia, the lack
of interest in pleasant activities. Anhedonia is a characteristic symptom of major depression [11].
Baseline sucrose preference was measured before lesion. After 20 h of food and water deprivation,
mice were placed in individual cages and presented with two pre-weighted bottles, one containing 2.5%
sucrose solution and another filled with water for 2 h. Percent preference was calculated according to
the following equation: % preference = (sucrose intake/(sucrose + water intake)) × 100. A decrease of
sucrose preference below 65% was taken as the criterion for anhedonia. This criterion was based on
the fact that none of the control mice exhibited less than or equal to 65% preference for sucrose at that
time point of the experiment.Neuroglia 2018, 1 51
2.5. Acute Isolation of Cells
For identification of acutely isolated cells, we used transgenic mice expressing a fluorescent
marker under control of a cell-specific promoter (glial fibrillary acidic protein (GFAP) for astrocytes or
cell surface glycoprotein Thy1 for neurons) thus allowing fluorescence-activated sorting of specified
cell fractions; for detailed description of the technique see [12,16,17]. After isolation, cells were sorted
by fluorescence-activated cell sorting (FACS) using the BD FACSAria Cell Sorting System (35 psi
sheath pressure, FACSDiva software S/W 2.2.1; BD Biosciences, San José, CA, USA). Cell identity and
purity were verified by mRNA expression of cell markers of astrocytes, neurons, and oligodendrocytes,
analyzed by reverse-transcription polymerase chain reaction (RT-PCR), in astrocytic and neuronal cell
preparations. As shown previously [17], there is no contamination with neuronal or oligodendrocytic
genes in the samples of astrocytes or of astrocytic or oligodendrocytic genes in the neuronal samples.
2.6. Primary Cultures of Astrocytes
Primary cultures of mouse astrocytes were prepared from the neopallia of the cerebral hemispheres
of newborn CD-1 mice as previously described [18,19], sparsely seeded and grown in Dulbecco’s
minimum essential medium (DMEM) with 7.5 mM glucose. After two weeks in vitro, 0.25 mM
dibutyryl cyclic adenosine monophosphate (dBcAMP) was included in the medium. These cultures
are highly enriched in astrocytes as assessed by GFAP and glutamine synthetase expression [20].
Incubation with dBcAMP promotes morphological and functional differentiation as evidenced by the
extension of cell processes and increases in several metabolic and functional activities characteristic of
astrocytes in situ [21]. 6-Hydroxydopamine at 20 µM was added to the culture after three weeks of
culturing and continued for 6, 12, 24, and 48 h.
2.7. Reverse Transcription-Polymerase Chain Reaction
For determination of the mRNA expression of the 5-HT2B receptor by RT-PCR, all samples from
the cerebral cortex or astrocyte cultures were homogenized in Trizol (Invitrogen, Carlsbad, CA, USA).
The RNA pellet was precipitated with isopropanol, washed with 75% ethanol, and dissolved in 10 µL
sterile, distilled water and an aliquot was used for determination of the amount of RNA [22].
Reverse transcription was initiated by a 5 min incubation at 65 ◦ C of 1 µg RNA extract
with Random Hexamer (TaKaRa, Daliang, China) at a final concentration of 12.5 ng/L and
deoxy-ribonucleoside triphosphates (dNTPs) at a final concentration of 0.5 mM. The mixture was
rapidly chilled on ice and briefly spun and 4 µL 5 × First-Strand Buffer, 2 µL 0.1 M dithiotreitol and
1 µL RNaseOUT Recombinant RNase Inhibitor (40 U/µL) (TaKaRa) were added. After the mixture
had been incubated at 42 ◦ C for 2 min, 1 µL (200 U) of Superscript II was added and the incubation at
42 ◦ C continued for another 50 min. Subsequently the reaction was inactivated by heating to 70 ◦ C for
15 min and the mixture was chilled and briefly centrifuged.
Polymerase chain reaction amplification was performed in a Robocycler thermocycler
(Biometra, Westburg, The Netherlands) with 0.2 µM of sense or antisense and 0.375 U
of Taq polymerase for 5-HT2B receptor (forward, 50 -CTCGGGGGTGAATCCTCTGA-30 ;
reverse, 50 -CCTGCTCATCACCCTCTCTCA-30 ) [22], for TATA box-binding protein (TBP),
used as a housekeeping gene (forward, 50 -CCACGGACAACTGCGTTGAT-30 ; reverse,
50 -GGCTCATAGCTACTGAACTG-30 ) [23]. Initially, the template was denatured by heating
to 94 ◦ C for 2 min, followed by 2.5 min amplification cycles, each consisting of two 45 s periods and
one 60 s period, the first at 94 ◦ C, the second at 61 ◦ C for 5-HT2B receptor and at 55 ◦ C for TBP and the
third at 72 ◦ C. The final step was extension at 72 ◦ C for 10 min. The PCR products were separated
by 1% agarose gel electrophoresis, stained with 0.5 µg/mL ethidium bromide, and captured by
Fluorchem 5500 (Alpha Innotech Corporation, San Leandro, CA, USA). The sizes of the PCR product
of 5-HT2B receptor was 370 bp and that of TBP 236 bp.Neuroglia 2018, 1 52
2.8. Western Blotting
Protein content was determined by the Lowry method [24], using bovine serum albumin as the
standard. Samples containing 50 µg protein were applied on slab gels of 10% polyacrylamide and
electrophoresed. After transfer to polyvinylidene fluoride (PVDF) membranes, the samples were
blocked by 5% skim milk powder in TBS-T (30 mM Tris-HCl, 125 mM NaCl, 0.1% Tween 20) for
1 h. The PVDF membranes were incubated with the primary antibody, specific to 5-HT2B receptor
overnight at 4 ◦ C or β-actin for 2 h at room temperature. After washing, the blots were incubated with
peroxidase-conjugated affinity-purified goat anti-rabbit or goat anti-mouse horseradish peroxidase
(HRP) antibody for 2 h. Staining was visualized by enhanced chemiluminescence (ECL) detection
reagents. Digital images were obtained using Gel-Imaging System (Tanon 4200, Shanghai, China).
Optical density for each band was assessed using the Window AlphaEase TM FC 32-bit software
(Genetic Technologies, Miami, FL, USA). Ratios were determined between scanned 5-HT2B receptor
and β-actin, the latter used as housekeeping protein.
2.9. Statistics
Differences between multiple groups were evaluated by two-way analysis of variance (ANOVA)
followed by Fisher’s least significant difference (LSD) multiple comparison test for unequal replications.
The level of significance was set at p < 0.05.
2.10. Materials
Most chemicals, including 6-OHDA, fluoxetine, L-dopa, benserazide, DNase I, propidium iodide,
6,7-dinitroquinoxaline-2,3-dione (DNQX), 2-amino-5-phosphonovalerate (APV), and first antibodies
and the first β-actin antibody were purchased from Sigma (St. Louis, MO, USA). BD Biosciences
(Franklin Lakes, NJ, USA) supplied the first antibody, raised against 5-HT2B receptor. The second
antibody goat anti-mouse IgG HRP conjugate was from Promega (Madison, WI, USA) and goat
anti-rabbit IgG HRP conjugate from Santa Cruz Biotechnology (Santa Cruz, CA, USA). Enhanced
chemiluminescence detection reagents were from Amersham Biosciences (Buckinghamshire, UK).
Random Hexamer, deoxyribonucleotide triphosphates (dNTPs) and Taq-polymerase for RT-PCR were
purchased from TaKaRa Biotechnology Co., Ltd. and Superscript II from Gibco Life Technology
Invitrogen (Grand Island, NY, USA). Chemicals for preparation of culturing medium were purchased
from Sigma and horse serum from Invitrogen.
3. Results
3.1. Depressive Behavior
Intrastriatal injection of 6-OHDA resulted in development of depressive behavior in mice.
The consumption of sucrose, indicative of 6-OHDA-induced anhedonia, is presented in Figure 1A.
In the three weeks after 6-OHDA treatment, sucrose consumption decreased significantly, reflecting
progressive anhedonia. (Figure 1A; Control: 72.14 ± 2.23%, n = 18; 6-OHDA: 55.05 ± 3.43%,
n = 18; p < 0.05). Glucose consumption was further decreased after seven weeks (Figure 1A; Control
72.79 ± 1.33%, n = 6; 6-OHDA: 51.68 ± 3.37%, n = 6; p < 0.05). Administration of fluoxetine and
L -dopa for four weeks ameliorated 6-OHDA-induced decrease of sucrose consumption, albeit only
partially (Flu: 76.05 ± 4.55%, n = 6; 6-OHDA + Flu: 65.18 ± 3.17%, n = 6; L-dopa: 75.43 ± 2.74%, n = 6;
6-OHDA + L-dopa: 63.03 ± 3.95%, n = 6; p < 0.05).Neuroglia 2018, 1 53
Neuroglia 2018, 1, x FOR PEER REVIEW 6 of 15
Figure
Figure 1.1. Effects
EffectsofofLL-dopa
-dopaandand fluoxetine
fluoxetine on on depressive
depressive behavior
behavior (sucrose
(sucrose preference
preference test,
test, tail
tail
suspension
suspensiontest,
test,and
andforced
forcedswimming
swimmingtest) test)induced
inducedby by6-Hydroxydopamine
6-Hydroxydopamine(6-OHDA). (6-OHDA).After Afterthree
three
weeks
weeksrecovery
recoveryfromfromthethe6-OHDA
6-OHDAlesions,
lesions,mice
micewithwithanhedonia
anhedoniawere weredaily
dailyinjected
injectedintraperitoneally
intraperitoneally
with
with fluoxetine
fluoxetine (10 mg/kg/d) ororLL-dopa
(10 mg/kg/d) -dopa (20(20 mg/kg/d
mg/kg/dininsaline salineand
andcombined
combined with with 1212 mg/kg
mg/kg of of
benserazide)
benserazide)for forfour
fourweeks.
weeks.Behavior
Behaviortests
testswere
wereperformed
performedjust justbefore
beforeor or after
after LL-dopa
-dopaor orfluoxetine
fluoxetine
treatment.
treatment.(A)(A)Percentage
Percentageof ofsucrose
sucrosepreference
preferencein insucrose
sucrosepreference
preferencetest.
test.Values
Valueswerewereexpressed
expressedas as
the mean ± standard error of the mean (SEM). * Indicates statistically significant (p < 0.05) difference
the mean ± standard error of the mean (SEM). * Indicates statistically significant (p < 0.05) difference
from other groups
from other groupsatat thethe
samesame treatment
treatment period.period. ** Indicates
** Indicates statistically
statistically significantsignificant
(p < 0.05)(pdifference
< 0.05)
difference from
from control, control, fluoxetine
6-OHDA, 6-OHDA, (Flu)fluoxetine (Flu) and
and L-dopa groupL-dopa
after group after treatment
four-weeks four-weeks of treatment
fluoxetineof or
fluoxetine
L-dopa. (B) orThe
L-dopa. (B) The
duration duration of
of immobility immobility
in tail suspension in tail
test.suspension test. Values
Values are expressed asare
the expressed
mean ± SEM. as
the mean ± SEM.
* Indicates * Indicates
statistically statistically
significant significant
(p < 0.05) difference(pNeuroglia 2018, 1 54
corrected 6-OHDA-induced increase of time of immobility (Flu: 52.00 ± 9.99 s, n = 6; 6-OHDA + Flu:
Neuroglia 2018, 1, x FOR PEER REVIEW 7 of 15
67.80 ± 7.59 s, n = 6; L-dopa: 52.80 ± 5.23 s, n = 6; 6-OHDA + L-dopa: 65.67 ± 8.71 s, n = 6; p < 0.05).
The results of time spent in the central area in the open field test are presented in Figure 2A.
The results of time spent in the central area in the open field test are presented in Figure 2A.
Three and seven weeks after exposure to 6-OHDA, there was no change in time spend in the central
Three and seven weeks after exposure to 6-OHDA, there was no change in time spend in the central
in open field. However, the drug decreased the number of squares crossed (three weeks: Control:
in open field. However, the drug decreased the number of squares crossed (three weeks: Control:
85.12 ± 15.27, n = 18; 6-OHDA: 51.53 ± 5.44, n = 18; p < 0.05; seven weeks: Control: 46.60 ± 5.96, n = 6;
85.12 ± 15.27, n = 18; 6-OHDA: 51.53 ± 5.44, n = 18; p < 0.05; seven weeks: Control: 46.60 ± 5.96, n = 6;
6-OHDA: 27.00 ± 3.69, n = 6; p < 0.05) and frequency of rearing (three weeks: Control: 15.11 ± 2.24,
6-OHDA: 27.00 ± 3.69, n = 6; p < 0.05) and frequency of rearing (three weeks: Control: 15.11 ± 2.24, n =
n = 185; 6-OHDA: 10.79 ± 1.44, n = 18; p < 0.05; seven weeks: Control: 14.40 ± 1.86, n = 6; 6-OHDA:
185; 6-OHDA: 10.79 ± 1.44, n = 18; p < 0.05; seven weeks: Control: 14.40 ± 1.86, n = 6; 6-OHDA: 8.20 ±
8.20 ± 0.97, n = 6; p < 0.05) after three and seven weeks of treatment (Figure 2B,C). Administration
0.97, n = 6; p < 0.05) after three and seven weeks of treatment (Figure 2B,C). Administration of
of fluoxetine and L-dopa for four weeks corrected 6-OHDA-induced decrease of square crossed (Flu:
fluoxetine and L-dopa for four weeks corrected 6-OHDA-induced decrease of square crossed (Flu:
46.00 ± 4.46, n = 6; 6-OHDA + Flu: 45.00 ± 6.27, n = 6; L-dopa: 44.00 ± 3.22, n = 6; 6-OHDA + L-dopa:
46.00 ± 4.46, n = 6; 6-OHDA + Flu: 45.00 ± 6.27, n = 6; L-dopa: 44.00 ± 3.22, n = 6; 6-OHDA + L-dopa:
44.80 ± 8.41, n = 6; p < 0.05) and frequency of rearing (Flu: 14.40 ± 1.17, n = 6; 6-OHDA + Flu:
44.80 ± 8.41, n = 6; p < 0.05) and frequency of rearing (Flu: 14.40 ± 1.17, n = 6; 6-OHDA + Flu: 15.00 ±
15.00 ± 2.24, n = 6; L-dopa: 13.80 ± 1.85, n = 6; 6-OHDA + L-dopa: 15.80 ± 2.71, n = 6; p < 0.05).
2.24, n = 6; L-dopa: 13.80 ± 1.85, n = 6; 6-OHDA + L-dopa: 15.80 ± 2.71, n = 6; p < 0.05).
Figure
Figure2.2.Effects of Lof
Effects -dopa and and
L -dopa fluoxetine on open
fluoxetine field field
on open test intest
micein treated with 6-OHDA.
mice treated After
with 6-OHDA.
three-weeks recovery from the 6-OHDA lesions, mice with anhedonia
After three-weeks recovery from the 6-OHDA lesions, mice with anhedonia were daily injected were daily injected
intraperitoneally
intraperitoneallywith withfluoxetine
fluoxetine (10(10
mg/kg/d)
mg/kg/d)or L-dopa (20 mg/kg/d
or L-dopa in salineinand
(20 mg/kg/d combined
saline with 12
and combined
mg/kg
with 12of mg/kg
benserazide) for four weeks.
of benserazide) Behavior
for four weeks.tests were performed
Behavior just before just
tests were performed or after L-dopa
before or
or after
fluoxetine treatment. (A) The time spent in the central square in the open field test. The
L-dopa or fluoxetine treatment. (A) The time spent in the central square in the open field test. The values values are
expressed as the
are expressed as mean ± SEM.
the mean (B) The
± SEM. number
(B) The numberof squares crossed
of squares crossedin in
open
openfield
fieldtest.
test.The
Thevalues
valuesare
are
expressed
expressed as the mean
as the mean±± SEM.SEM.* Indicates
* Indicates statistically
statistically significant
significant (p < (p < 0.05)
0.05) difference
difference from groups
from other other
groups at thetreatment
at the same same treatment
period. (C)period. (C) Frequency
Frequency of rearingofinrearing in open
open field field
test. The test. are
values Theexpressed
values areas
expressed
the mean ± SEM. * Indicates statistically significant (p < 0.05) difference from other groups at theother
as the mean ± SEM. * Indicates statistically significant (p < 0.05) difference from same
groups at the
treatment same treatment period.
period.
3.2. Motor Activity
In the rotarod performance test, the latency of fall (Figure 3A) in mice treated with 6-OHDA
was significantly shorter than in control groups after three weeks (Control: 69.30 ± 4.27 s, n = 18;Neuroglia 2018, 1 55
3.2. Motor Activity
In the rotarod performance test, the latency of fall (Figure 3A) in mice treated with 6-OHDA
Neuroglia 2018, 1, x FOR PEER REVIEW 8 of 15
was significantly shorter than in control groups after three weeks (Control: 69.30 ± 4.27 s, n = 18;
6-OHDA: 57.13
6-OHDA: 57.13 ± 4.58 s,
± 4.58 s, nn ==18;
18; pp 0.05) andweeks
seven(Control: 1.62 ± 0.32
weeks (Control: n =0.32
1.62s,± 6; 6-OHDA: 1.80 ± 0.13
s, n = 6; 6-OHDA: s, n±=0.13
1.80 6; p s,
>
0.05). However, the time taken by the mice to reach the floor (Figure 3C; T-LA time)
n = 6; p > 0.05). However, the time taken by the mice to reach the floor (Figure 3C; T-LA time) was was significantly
increased after three (Control: 17.36 ± 1.32 s, n =18; 6-OHDA: 23.92 ± 0.99 s, n = 18; p < 0.05) and seven
weeks (Control: 15.75 ± 2.56 s, n = 6; 6-OHDA: 27.33 ± 1.36 s, n = 6; p < 0.05). Again, L-dopa corrected
6-OHDA-induced increase of T-turn time after seven weeks, but fluoxetine had no effect (Flu: 16.50 ±
3.13 s, n = 6; 6-OHDA + Flu: 26.70 ± 1.76 s, n = 6; L-dopa: 16.80 ± 2.44 s, n = 6; 6-OHDA + L-dopa: 18.90
± 2.83 s, n = 6; p < 0.05).Neuroglia 2018, 1 56
significantly increased after three (Control: 17.36 ± 1.32 s, n =18; 6-OHDA: 23.92 ± 0.99 s, n = 18;
p < 0.05) and seven weeks (Control: 15.75 ± 2.56 s, n = 6; 6-OHDA: 27.33 ± 1.36 s, n = 6; p < 0.05).
Again, L-dopa corrected 6-OHDA-induced increase of T-turn time after seven weeks, but fluoxetine
had no effect (Flu: 16.50 ± 3.13 s, n = 6; 6-OHDA + Flu: 26.70 ± 1.76 s, n = 6; L-dopa: 16.80 ± 2.44 s,
n = 6; 6-OHDA + L-dopa: 18.90 ± 2.83 s, n = 6; p < 0.05).
3.3. Expression of mRNA and Protein of 5-HT2B Receptor
In cerebral tissue of mice treated with 6-OHDA, the mRNA level of 5-HT2B receptor decreased to
43.8 ± 4.7% of control groups (n = 3, p < 0.05) and protein expression to 67.3 ± 4.3% (n = 3, p < 0.05)
seven weeks after lesion (Figure 4A,B). Experiments with freshly isolated astrocytes and neurons
from transgenic mice demonstrated that the decrease of 5-HT2B receptor mRNA expression in the
in vivo brain was confined to astrocytes and was not detected in neurons (Figure 4C). However,
this downregulation was corrected by L-dopa (Figure 4A,B) or fluoxetine (Figure 4D,E) that was
injected three weeks after 6-OHDA treatment and continued for four weeks.
Figure 4. Effects of L -dopa and fluoxetine on expression of mRNA and protein of 5-HT2B receptor
in brains of anhedonia mice induced by 6-OHDA. After three-weeks recovery from the 6-OHDA
lesions, mice with anhedonia were daily injected intraperitoneally with fluoxetine (10 mg/kg/d)
1
or L -dopa (20 mg/kg/d in saline and combined with 12 mg/kg/d of benserazide) for four weeks.Neuroglia 2018, 1 57
In some experiments, (C) freshly isolated astrocytes and neurons from transgenic mice were used for
determination of 5-HT2B receptor mRNA expression. (A,C,D) mRNA expression measured by reverse
transcription-polymerase chain reaction (RT-PCR) of (A) 5-HT2B receptor in cerebral cortex in vivo
from anhedonia mice treated with L-dopa for four weeks, (C) in freshly isolated astrocytes and neurons
from transgenic mice, or (D) in cerebral cortex in vivo from anhedonia mice treated with fluoxetine
for four weeks. A representative experiment showing mRNA for 5-HT2B receptor and for TATA
box-binding protein (TBP), as a housekeeping gene. The size of PCR product of 5-HT2B receptor is
370 bp and that of TBP 236 bp. Similar results were obtained in three independent experiments. Average
mRNA expression was quantified as the ratio between 5-HT2B receptor and the housekeeping TBP gene.
Ratios between 5-HT2B receptor and TBP in control group were designated a value of one. Standard
error of the mean (SEM) values are indicated by vertical bars. * Indicates statistically significant
(p < 0.05) difference from all other groups. (B,E) Protein expression measured by immunoblotting of
5-HT2B receptor in cerebral cortex in vivo from anhedonia mice treated with (B) L-dopa or fluoxetine
Neuroglia 2018, 1, x FOR PEER REVIEW 10 of 15
(E) for four weeks. Immunoblots from representative experiments. Bands of 55 kDa and 42 kDa
vivo from
represent 5-HT anhedonia(5-HT
2B receptor mice treated withβ-actin,
2B R) and L-dopa forrespectively.
four weeks, (C)Similar
in freshlyresults
isolatedwere
astrocytes and in three
obtained
independent neurons from transgenic
experiments. mice,protein
Average or (D) inlevel
cerebral
wascortex in vivo from
quantified anhedonia
as ratios betweenmice5-HT
treated with
2B R and β-actin.
fluoxetine for four weeks. A representative experiment showing mRNA for 5-HT2B receptor and for
Ratios between 5-HT2B receptor and β-actin in control group were designated a value of one. Standard
TATA box-binding protein (TBP), as a housekeeping gene. The size of PCR product of 5-HT2B
error of the meanisvalues
receptor 370 bp are
and indicated
that of TBPby236vertical bars.
bp. Similar * Indicates
results statistically
were obtained in three significant
independent (p < 0.05)
difference experiments.
from all other Average mRNA expression was quantified as the ratio between 5-HT2B receptor and the
groups.
housekeeping TBP gene. Ratios between 5-HT2B receptor and TBP in control group were designated a
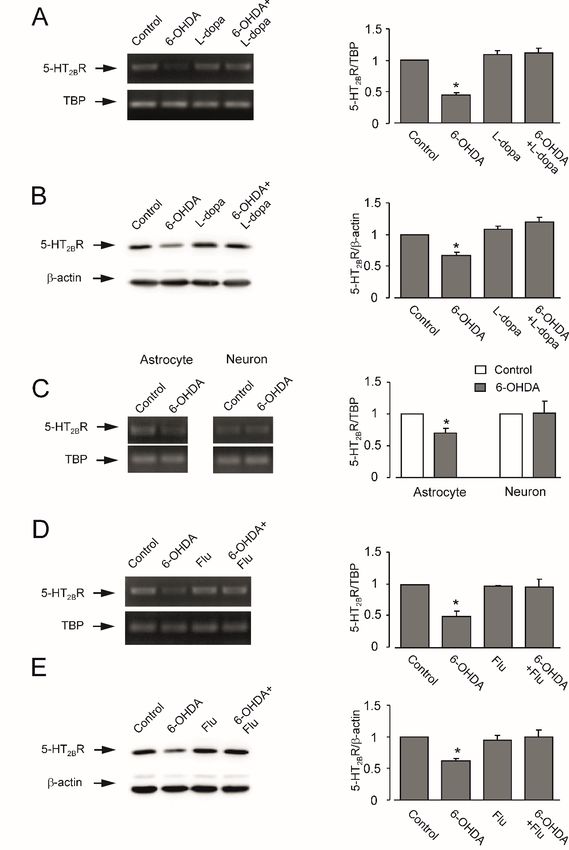
The time value
course of one. Standard error of the mean (SEM) values are indicated by vertical bars. * Indicates
of expression of 5-HT2B receptor mRNA during 6-OHDA treatment in cultured
statistically significant (p < 0.05) difference from all other groups. (B,E) Protein expression measured
astrocytes is shown on Figure of5A.
by immunoblotting 5-HTAt2B 6receptor
h andin12 h, there
cerebral was
cortex no difference
in vivo from anhedoniain mice
5-HT 2B receptor
treated with expression
in control and(B) L-dopa or groups.
6-OHDA fluoxetine (E) for four weeks.
However, afterImmunoblots from representative
24 h treatment, mRNAexperiments.
of 5-HT2BBands of
receptor decreased
to 64.7 ± 6.2%55ofkDa and 42groups
control kDa represent
(n = 5-HT
3, p2BNeuroglia 2018, 1 58
Cells were treated with L-dopa (10 µM) for two weeks after 24 h 6-OHDA exposure. (C) Effects of
fluoxetine on 6-OHDA induced downregulation of expression of mRNA and protein of 5-HT2B receptor
in primary cultures of astrocytes. Cells were treated with fluoxetine (1 µM) for two weeks after 24 h
6-OHDA exposure. Representative experiments show mRNA expression for 5-HT2B receptor and for
TBP, as a housekeeping gene (top panels). The size of PCR product of 5-HT2B receptor is 370 bp and
that of TBP 236 bp. Similar results were obtained in three independent experiments. Average mRNA
expression was quantified as ratio between 5-HT2B receptor and the housekeeping TBP gene. Ratios
between 5-HT2B receptor and TBP in control group were designated a value of one. Immunoblots
show bands of 55 kDa and 42 kDa representing 5-HT2B receptor and β-actin, respectively. Similar
results were obtained in three independent experiments. Average protein level was quantified as ratios
between 5-HT2B R and β-actin. Ratios between 5-HT2B receptor and β-actin in the control group were
designated a value of one. Standard error of the mean values are indicated by vertical bars. * Indicates
statistically significant (p < 0.05) difference from other groups at the same treatment period.
4. Discussion
Astrocytes, being intimately associated with synaptic structures, regulate neurotransmission,
synaptic plasticity, and integration in neuronal networks through multiple mechanisms that control
synaptogenesis, maintain ion and neurotransmitter homeostasis in the synaptic cleft, provide neuronal
terminals with neurotransmitter precursors, and contribute to synaptic extinction [25–29]. Pathological
changes to astroglia, therefore, may significantly affect brain function and lead to neurological
disorders [30]. In particular, astrocytopathies, mainly in the form of atrophy, decrease in astroglial
densities, and possibly loss in astroglia homeostatic function, contribute to major neuropsychiatric
diseases such as major depression and schizophrenia [8,9,31,32]. Expression of astroglial serotonin
receptors, which mediate neuronal–glial interactions, are modified in major depression and bipolar
disorders; and antidepressants correct these pathological changes [33,34].
Previously, we reported that the decrease of gene expression of astrocytic 5-HT2B receptor parallels
the development of depressive behavior in the MPTP mouse model of PD, while fluoxetine ameliorates
both the decrease in 5-HT2B receptor expression and anhedonia [13]. In this study, we describe
similar results obtained in 6-OHDA mouse model of PD. These new findings further corroborate the
notion that the decrease in gene expression of astroglial 5-HT2B receptors may be associated with
pathophysiological evolution of PD-associated depression.
The MPTP is a lipidophilic compound able to penetrate the blood–brain barrier (BBB).
Consequently, MPTP can be injected systemically to induce a bilateral parkinsonism, or, when infused
through the carotid artery, to induce hemiparkinsonism [35]. In the latter settings, contralateral
hemisphere can be used as control [36]. After crossing the BBB, MPTP (which by itself is non-toxic)
is accumulated in astrocytes, where monoaminoxidase-B converts it to the toxic metabolite, MPP+.
The latter is released from astrocytes and is accumulated by dopaminergic neurons through the
dopamine transporter. In neurons, the MPP+ inhibits mitochondrial complex I, thus affecting adenosine
triphosphate (ATP) synthesis, boosting production of reactive oxygen species (ROS), and leading to
cell death [37]. After intraperitoneal injection (which we used in a previous study), MPTP spreads
throughout the brain. Astrocytes thus may be affected directly by the drug as we have seen in
cultured astrocytes [13], irrespective to the deficiency of dopaminergic system. In this study, we used
6-OHDA, a compound that cannot cross the BBB. 6-Hydroxydopamine enters dopaminergic neurons
by dopamine transporter and thereafter triggers the production of neurotoxic ROS [36]. In contrast to
MPTP, which is converted in neurotoxic agent by astrocytes, 6-OHDA enters neurons causing their
demise. The usage of the 6-OHDA model therefore excludes possible direct damage to astrocytes
which might be present in MPTP-treated animals. 6-Hydroxydopamine induces nigral dopamine
cell loss and dopamine depletion. However, it does not seem to affect other brain regions, such as
olfactory structures, lower brain stem areas, or locus coeruleus [14]. Therefore, the decrease of
5-HT2B receptor in the brain in vivo may be related to the aberrations in serotonergic, adrenergic,
or dopaminergic neurotransmission [38], although we cannot exclude the possibility of direct drugNeuroglia 2018, 1 59
effect on astrocytes in cerebral hemispheres since 6-OHDA also decreases gene expression of 5-HT2B
receptor in cultured astrocytes.
L -Dopa is a precursor of dopamine; L -dopa crosses the BBB and is converted to dopamine
by aromatic amino acid decarboxylase [39]. In the clinical treatment of PD, L-dopa is used to
replenish dopamine pool and is therapeutically effective in both PD patients and animal models of the
disease [40]. However, it is controversial whether L-dopa has effect on PD depression. The clinical data
show that L-dopa has no effect or accelerates depression or anxiety (see [4] and references therein).
Similar results were obtained from animal models of PD [4]. Our data show that treatment with L-dopa
for four weeks ameliorates both 6-OHDA-induced decrease of 5-HT2B receptor expression in the brain
in vivo and 6-OHDA-induced depressive behavior, suggesting the link between 5-HT2B receptors
and 6-OHDA-induced depression. Astrocytes express neutral amino acid transporter (LAT/SLC7A5)
and dopamine transporter (DAT/SLC6A3) [41–45]; astroglia mainly function as a reservoir of L-dopa
that regulates the uptake or release of L-dopa depending on extracellular L-dopa concentration,
but are less capable of converting L-dopa to dopamine [46]. The effect L-dopa on ROS production is
debatable. When L-dopa is decarboxylated to dopamine (DA) by aromatic L-amino acid decarboxylase
(AADC), ROS are generated that could ultimately lead to cell death [47]. Nevertheless, L-dopa in some
in vivo and in vitro experiments had no toxic effects, or even showed antioxidant capabilities [48–51].
Oxidative stress in peripheral blood mononuclear cells from patients with PD is negatively correlated
with L-dopa dosage [48]. Experiments with catecholaminergic human neuroblastoma cells showed that
L -dopa may have a protective effect on dopaminergic cells [49]. Similar results were also obtained in
PC12 cells [52]. In the perinatal 6-OHDA lifelong model of PD, elevated basal levels of ROS occurring
in denervated dopaminergic striatum are suppressed by L-dopa treatment [50]. L-Dopa in follicular
fluid is an antioxidant factor and exerts positive influences on cultured human granulosa cells, whereas
DA derived from L-dopa has opposite actions [51]. In the present work, we have found that L-dopa
corrects 6-OHDA-induced decrease of 5-HT2B receptor in astrocytes in primary cultures, suggesting
L -dopa that may protect cells by its antioxidant effects.
In contrast to L-dopa, fluoxetine has no effect on 6-OHDA-induced motor deficiency, suggesting
the effect of L-dopa on motor activity is dependent on DA replenishment. However, the effect
of fluoxetine on depressive behavior develops in parallel with its effect on the gene expression
of the 5-HT2B receptor [10]. The effects of fluoxetine on astrocytes are mediated by the 5-HT2B
receptor. The affinity 5-HT to the astroglial 5-HT2B receptor is substantially higher than to 5-HT2C
receptor [53]. Different SSRIs bind to and activate astroglial 5-HT2B receptors, which induce EGFR
transactivation [54]. Stimulation of EGFR-dependent signaling cascades regulates expression of
multiple genes (for a review, see [55,56]). In mice that develop anhedonia following chronic stress,
expression of astroglial 5-HT2B receptor is significantly suppressed; at the same time, expression of
5-HT2B receptor does not change in mice which do not develop anhedonia [11]. Chronic treatment with
fluoxetine rescues this deficit and increases expression of 5-HT2B receptors in astrocytes in the brains
of anhedonic animals [12]. Similarly, astrocytic 5-HT2B receptor is downregulated only in anhedonic
mice, but not in those that do not develop anhedonia in MPTP-induced PD model animals. This is in
agreement with our present findings that astrocytic 5-HT2B receptor is decreased in depressed animals
in 6-OHDA PD model.
Pathophysiology of depression associated with PD is not clear. We have shown that
downregulation of the gene expression of 5-HT2B receptors occurs specifically in astrocytes in parallel
with the development of depressive behavior in both 6-OHDA and MPTP animal models of PD.
The relevance of 5-HT2B receptors to depression is corroborated by (1) the decrease of its gene
expression in the nervous tissue of animals developing depressive behavior under the CMS [11,57],
in the MPTP PD animal model [13], and in the 6-OHDA PD animal model; (2) the upregulation of
5-HT2B receptor gene expression by chronic treatment with fluoxetine in astrocytes in cultures and
freshly isolated from the in vivo brains [11,57]; and (3) the dependence of antidepressant effect of
fluoxetine on 5-HT2B receptors in vivo [58]. Since both drugs directly decrease expression of 5-HT2BNeuroglia 2018, 1 60
receptors in cultured astrocytes, there is still a possibility that this phenomenon may only occur in PD
animal models. To make a conclusion, postmortem examination of 5-HT2B receptors in PD patients’
brains is needed.
Acknowledgments: This study was supported by Grant No. 31400925 to D.S. from the National Natural Science
Foundation of China.
Author Contributions: L.P. conceptualized the study and supervised experimental work; D.S. and K.M. performed
the experiments and analyzed the data; A.V. and L.P. wrote the paper.
Conflicts of Interest: The authors declare no conflict of interest.
References
1. Hornykiewicz, O.; Kish, S.J. Biochemical pathophysiology of Parkinson’s disease. Adv. Neurol. 1987, 45,
19–34. [PubMed]
2. Chiu, W.H.; Depboylu, C.; Hermanns, G.; Maurer, L.; Windolph, A.; Oertel, W.H.; Ries, V.; Höglinger, G.U.
Long-term treatment with L-DOPA or pramipexole affects adult neurogenesis and corresponding non-motor
behavior in a mouse model of Parkinson’s disease. Neuropharmacology 2015, 95, 367–376. [CrossRef] [PubMed]
3. Costa, F.H.; Rosso, A.L.; Maultasch, H.; Nicaretta, D.H.; Vincent, M.B. Depression in Parkinson’s disease:
Diagnosis and treatment. Arq. Neuropsiquiatr. 2012, 70, 617–620. [CrossRef] [PubMed]
4. Eskow Jaunarajs, K.L.; Angoa-Perez, M.; Kuhn, D.M.; Bishop, C. Potential mechanisms underlying anxiety
and depression in Parkinson’s disease: Consequences of L-DOPA treatment. Neurosci. Biobehav. Rev. 2011, 35,
556–564. [CrossRef] [PubMed]
5. Fox, S.H.; Chuang, R.; Brotchie, J.M. Serotonin and Parkinson’s disease: On movement, mood and madness.
Mov. Disord. 2009, 24, 1255–1266. [CrossRef] [PubMed]
6. Booth, H.D.E.; Hirst, W.D.; Wade-Martins, R. The role of astrocyte dysfunction in Parkinson’s disease
pathogenesis. Trends Neurosci. 2017, 40, 358–370. [CrossRef] [PubMed]
7. Verkhratsky, A.; Steardo, L.; Parpura, V.; Montana, V. Translational potential of astrocytes in brain disorders.
Prog. Neurobiol. 2016, 144, 188–205. [CrossRef] [PubMed]
8. Verkhratsky, A.; Rodríguez, J.J.; Steardo, L. Astrogliopathology: A central element of neuropsychiatric
diseases? Neuroscientist 2014, 20, 576–588. [CrossRef] [PubMed]
9. Verkhratsky, A.; Parpura, V. Astrogliopathology in neurological, neurodevelopmental and psychiatric
disorders. Neurobiol. Dis. 2016, 85, 254–561. [CrossRef] [PubMed]
10. Li, B.; Zhang, S.; Zhang, H.; Nu, W.; Cai, L.; Hertz, L.; Peng, L. Fluoxetine-mediated 5-HT2B receptor
stimulation in astrocytes causes EGF receptor transactivation and ERK phosphorylation. Psychopharmacology
2008, 201, 443–458. [CrossRef] [PubMed]
11. Li, B.; Dong, L.; Wang, B.; Cai, L.; Jiang, N.; Peng, L. Cell type-specific gene expression and editing responses
to chronic fluoxetine treatment in the in vivo mouse brain and their relevance for stress-induced anhedonia.
Neurochem. Res. 2012, 37, 2480–2495. [CrossRef] [PubMed]
12. Dong, L.; Li, B.; Verkhratsky, A.; Peng, L. Cell type-specific in vivo expression of genes encoding
signalling molecules in the brain in response to chronic mild stress and chronic treatment with fluoxetine.
Psychopharmacology 2015, 232, 2827–2835. [CrossRef] [PubMed]
13. Zhang, X.; Song, D.; Gu, L.; Ren, Y.; Verkhratsky, A.; Peng, L. Decrease of gene expression of astrocytic
5-HT2B receptors parallels development of depressive phenotype in a mouse model of Parkinson’s disease.
Front. Cell. Neurosci. 2015, 9, 388. [CrossRef] [PubMed]
14. Blesa, J.; Phani, S.; Jackson-Lewis, V.; Przedborski, S. Classic and new animal models of Parkinson’s disease.
J. Biomed. Biotechnol. 2012, 2012, 845618. [CrossRef] [PubMed]
15. Matsuura, K.; Kabuto, H.; Makino, H.; Ogawa, N. Pole test is a useful method for evaluating the mouse
movement disorder caused by striatal dopamine depletion. J. Neurosci. Methods 1997, 73, 45–48. [CrossRef]
16. Lovatt, D.; Sonnewald, U.; Waagepetersen, H.S.; Schousboe, A.; He, W.; Lin, J.H.; Han, X.; Takano, T.;
Wang, S.; Sim, F.J.; et al. The transcriptome and metabolic gene signature of protoplasmic astrocytes in the
adult murine cortex. J. Neurosci. 2007, 27, 12255–12266. [CrossRef] [PubMed]
17. Fu, H.; Li, B.; Hertz, L.; Peng, L. Contributions in astrocytes of SMIT1/2 and HMIT to myo-inositol uptake at
different concentrations and pH. Neurochem. Int. 2012, 61, 187–194. [CrossRef] [PubMed]Neuroglia 2018, 1 61
18. Hertz, L.; Peng, L.; Lai, J.C. Functional studies in cultured astrocytes. Methods 1998, 16, 293–310. [CrossRef]
[PubMed]
19. Hertz, L.; Bock, E.; Schousboe, A. GFA content, glutamate uptake and activity of glutamate metabolizing
enzymes in differentiating mouse astrocytes in primary cultures. Dev. Neurosci. 1978, 1, 226–238. [CrossRef]
20. Hertz, L.; Juurlink, B.H.J.; Szuchet, S. Cell cultures. In Handbook of Neurochemistry; Lajtha, A., Ed.; Plenum
Press: New York, NY, USA, 1985.
21. Meier, E.; Hertz, L.; Schousboe, A. Neurotransmitters as developmental signals. Neurochem. Int. 1991, 19,
1–15. [CrossRef]
22. Kong, E.K.; Peng, L.; Chen, Y.; Yu, A.C.; Hertz, L. Up-regulation of 5-HT2B receptor density
and receptor-mediated glycogenolysis in mouse astrocytes by long-term fluoxetine administration.
Neurochem. Res. 2002, 27, 113–120. [CrossRef] [PubMed]
23. El-Marjou, A.; Delouvée, A.; Thiery, J.P.; Radvanyi, F. Involvement of epidermal growth factor receptor
in chemically induced mouse bladder tumour progression. Carcinogenesis 2000, 21, 2211–2218. [CrossRef]
[PubMed]
24. Lowry, O.H.; Rosebrough, N.J.; Farr, A.L.; Randall, R.J. Protein measurement with the Folin phenol reagent.
J. Biol. Chem. 1951, 193, 265–275. [PubMed]
25. Verkhratsky, A.; Nedergaard, M. Astroglial cradle in the life of the synapse. Philos. Trans. R. Soc. Lond. B Biol.
Sci. 2014, 369, 20130595. [CrossRef] [PubMed]
26. Verkhratsky, A.; Nedergaard, M. Physiology of astroglia. Physiol. Rev. 2018, 98, 239–389. [CrossRef]
[PubMed]
27. De Pitta, M.; Brunel, N.; Volterra, A. Astrocytes: Orchestrating synaptic plasticity? Neuroscience 2016, 323,
43–61. [CrossRef] [PubMed]
28. Dallerac, G.; Rouach, N. Astrocytes as new targets to improve cognitive functions. Prog. Neurobiol. 2016, 144,
48–67. [CrossRef] [PubMed]
29. Zorec, R.; Horvat, A.; Vardjan, N.; Verkhratsky, A. Memory formation shaped by astroglia.
Front. Integr. Neurosci. 2015, 9, 56. [CrossRef] [PubMed]
30. Pekny, M.; Pekna, M.; Messing, A.; Steinhäuser, C.; Lee, J.M.; Parpura, V.; Hol, E.M.; Sofroniew, M.V.;
Verkhratsky, A. Astrocytes: A central element in neurological diseases. Acta Neuropathol. 2016, 131, 323–345.
[CrossRef] [PubMed]
31. Rajkowska, G.; Stockmeier, C.A. Astrocyte pathology in major depressive disorder: Insights from human
postmortem brain tissue. Curr. Drug Targets 2013, 14, 1225–1236. [CrossRef] [PubMed]
32. Niciu, M.J.; Henter, I.D.; Sanacora, G.; Zarate, C.A., Jr. Glial abnormalities in substance use disorders and
depression: Does shared glutamatergic dysfunction contribute to comorbidity? World J. Biol. Psychiatry 2014,
15, 2–16. [CrossRef] [PubMed]
33. Peng, L.; Verkhratsky, A.; Gu, L.; Li, B. Targeting astrocytes in major depression. Expert Rev. Neurother. 2015,
15, 1299–1306. [CrossRef] [PubMed]
34. Peng, L.; Li, B.; Verkhratsky, A. Targeting astrocytes in bipolar disorder. Expert Rev. Neurother. 2016, 16,
649–657. [CrossRef] [PubMed]
35. Bankiewicz, K.S.; Oldfield, E.H.; Chiueh, C.C.; Doppman, J.L.; Jacobowitz, D.M.;
Kopin, I.J. Hemiparkinsonism in monkeys after unilateral internal carotid artery infusion of
1-methyl-4-phenyl-1,2,3,6-tetrahydropyridine (MPTP). Life Sci. 1986, 39, 7–16. [CrossRef]
36. Bové, J.; Perier, C. Neurotoxin-based models of Parkinson’s disease. Neuroscience 2012, 211, 51–76. [CrossRef]
[PubMed]
37. Meredith, G.E.; Totterdell, S.; Potashkin, J.A.; Surmeier, D.J. Modeling PD pathogenesis in mice: Advantages
of a chronic MPTP protocol. Parkinsonism Relat. Disord. 2008, 14 (Suppl. S2), S112–S115. [CrossRef] [PubMed]
38. Ossowska, K.; Lorenc-Koci, E. Depression in Parkinson’s disease. Pharmacol. Rep. 2013, 65, 1545–1557.
[CrossRef]
39. Mura, A.; Jackson, D.; Manley, M.S.; Young, S.J.; Groves, P.M. Aromatic L-amino acid decarboxylase
immunoreactive cells in the rat striatum: A possible site for the conversion of exogenous L-DOPA to
dopamine. Brain Res. 1995, 704, 51–60. [CrossRef]
40. Nagatsua, T.; Sawadab, M. L-Dopa therapy for Parkinson’s disease: Past, present and future.
Parkinsonism Relat. Disord. 2009, 15 (Suppl. 1), S3–S8. [CrossRef]Neuroglia 2018, 1 62
41. Inyushin, M.Y.; Huertas, A.; Kucheryavykh, Y.V.; Kucheryavykh, L.Y.; Tsydzik, V.; Sanabria, P.; Eaton, M.J.;
Skatchkov, S.N.; Rojas, L.V.; Wessinger, W.D. L-DOPA uptake in astrocytic endfeet enwrapping blood vessels
in rat brain. Parkinson’s Dis. 2012, 321406. [CrossRef] [PubMed]
42. Kim, D.K.; Kim, I.J.; Hwang, S.; Kook, J.H.; Lee, M.C.; Shin, B.A.; Bae, C.S.; Yoon, J.H.; Ahn, S.G.; Kim, S.A.
System L-amino acid transporters are differently expressed in rat astrocyte and C6 glioma cells. Neurosci. Res.
2004, 50, 437–446. [CrossRef] [PubMed]
43. Tsai, M.J.; Lee, E.H. Characterization of L-DOPA transport in cultured rat and mouse astrocytes.
J. Neurosci. Res. 1996, 43, 490–495. [CrossRef]
44. Inazu, M.; Kubota, N.; Takeda, H.; Zhang, J.; Kiuchi, Y.; Oguchi, K.; Matsumiya, T. Pharmacological
characterization of dopamine transport in cultured rat astrocytes. Life Sci. 1999, 64, 2239–2245. [CrossRef]
45. Inazu, M.; Takeda, H.; Ikoshi, H.; Uchida, Y.; Kubota, N.; Kiuchi, Y.; Oguchi, K.; Matsumiya, T. Regulation of
dopamine uptake by basic fibroblast growth factor and epidermal growth factor in cultured rat astrocytes.
Neurosci. Res. 1999, 34, 235–244. [CrossRef]
46. Asanuma, M.; Miyazaki, I.; Murakami, S.; Diaz-Corrales, F.J.; Ogawa, N. Striatal astrocytes act as a reservoir
for L-DOPA. PLoS ONE 2014, 9, e106362. [CrossRef] [PubMed]
47. Stansley, B.J.; Yamamoto, B.K. L-Dopa-induced dopamine synthesis and oxidative stress in serotonergic cells.
Neuropharmacology 2013, 67, 243–251. [CrossRef] [PubMed]
48. Prigione, A.; Begni, B.; Galbussera, A.; Beretta, S.; Brighina, L.; Garofalo, R.; Andreoni, S.; Piolti, R.;
Ferrarese, C. Oxidative stress in peripheral blood mononuclear cells from patients with Parkinson’s disease:
Negative correlation with levodopa dosage. Neurobiol. Dis. 2006, 23, 36–43. [CrossRef] [PubMed]
49. Colamartino, M.; Padua, L.; Meneghini, C.; Leone, S.; Cornetta, T.; Testa, A.; Cozzi, R. Protective effects of
L -dopa and carbidopa combined treatments on human catecholaminergic cells. DNA Cell Biol. 2012, 31,
1572–1579. [CrossRef] [PubMed]
50. Kostrzewa, J.P.; Kostrzewa, R.A.; Kostrzewa, R.M.; Brus, R.; Nowak, P. Perinatal 6-hydroxydopamine to
produce a lifelong model of severe Parkinson’s disease. Curr. Top. Behav. Neurosci. 2015. [CrossRef]
51. Blohberger, J.; Buck, T.; Berg, D.; Berg, U.; Kunz, L.; Mayerhofer, A. L-DOPA in the human ovarian follicular
fluid acts as an antioxidant factor on granulosa cells. J. Ovarian Res. 2016, 9, 62. [CrossRef] [PubMed]
52. Zhong, S.Y.; Chen, Y.X.; Fang, M.; Zhu, X.L.; Zhao, Y.X.; Liu, X.Y. Low-dose levodopa protects nerve cells
from oxidative stress and up-regulates expression of pCREB and CD39. PLoS ONE 2014, 9, e95387. [CrossRef]
[PubMed]
53. Li, B.; Zhang, S.; Li, M.; Hertz, L.; Peng, L. Serotonin increases ERK1/2 phosphorylation in astrocytes by
stimulation of 5-HT2B and 5-HT2C receptors. Neurochem. Int. 2010, 57, 432–439. [CrossRef] [PubMed]
54. Zhang, S.; Li, B.; Lovatt, D.; Xu, J.; Song, D.; Goldman, S.A.; Nedergaard, M.; Hertz, L.; Peng, L. 5-HT2B
receptors are expressed on astrocytes from brain and in culture and are a chronic target for all five
conventional ‘serotonin-specific reuptake inhibitors’. Neuron Glia Biol. 2010, 6, 113–125. [CrossRef] [PubMed]
55. Peng, L.; Huang, J. Astrocytic 5-HT2B receptor as in vitro and in vivo target of SSRIs. Recent Pat. CNS
Drug Discov. 2012, 7, 243–253. [CrossRef] [PubMed]
56. Hertz, L.; Rothman, D.L.; Li, B.; Peng, L. Chronic SSRI stimulation of astrocytic 5-HT2B receptors change
multiple gene expressions/editings and metabolism of glutamate, glucose and glycogen: A potential
paradigm shift. Front. Behav. Neurosci. 2015, 9, 25. [PubMed]
57. Li, B.; Zhang, S.; Li, M.; Hertz, L.; Peng, L. Chronic treatment of astrocytes with therapeutically
relevant fluoxetine concentrations enhances cPLA2 expression secondary to 5-HT2B -induced,
transactivation-mediated ERK1/2 phosphorylation. Psychopharmacology 2009, 207, 1–12. [CrossRef]
[PubMed]
58. Diaz, S.L.; Doly, S.; Narboux-Nême, N.; Fernández, S.; Mazot, P.; Banas, S.M.; Boutourlinsky, K.; Moutkine, I.;
Belmer, A.; Roumier, A.; et al. 5-HT2B receptors are required for serotonin-selective antidepressant actions.
Mol. Psychiatry 2012, 17, 154–163. [CrossRef] [PubMed]
© 2018 by the authors. Licensee MDPI, Basel, Switzerland. This article is an open access
article distributed under the terms and conditions of the Creative Commons Attribution
(CC BY) license (http://creativecommons.org/licenses/by/4.0/).You can also read