Modelling the Global Air Quality Conditions in Perspective of COVID-19 Stimulated Lockdown Periods Using Remote Sensing Data
←
→
Page content transcription
If your browser does not render page correctly, please read the page content below
Modelling the Global Air Quality Conditions in
Perspective of COVID-19 Stimulated Lockdown
Periods Using Remote Sensing Data
Swapan Talukdar
University of Gour Banga
Susanta Mahato
University of Gour Banga
Swades Pal ( swadeshpal82@gmail.com )
University of Gour Banga
Sandipta Debanshi
University of Gour Banga
Shahfahad
Jamia Millia Islamia
Priyanka Das
Malda Women's College
Atiqur Rahman
Jamia Millia Islamia
Research Article
Keywords: COVID-19, Lockdown effects, Air quality state (AQS), Air quality components, Aerosol optical depth
(AOD), Global air quality state
DOI: https://doi.org/10.21203/rs.3.rs-70252/v1
License: This work is licensed under a Creative Commons Attribution 4.0 International License. Read
Full License
Page 1/22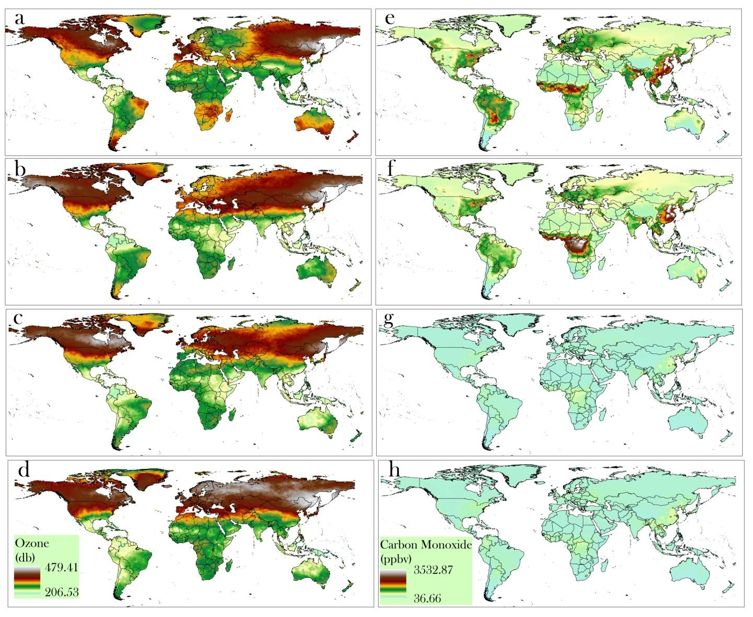
Abstract
COVID-19 outbreak across the world has invited forced lockdown conditions, which causes a huge economic
landslide. But it has brought an opportunity for restoring the environment of its own which may cause
ecosystem well-being. Focusing on the second issue, the present work has intended to explore the streams of
air quality change based on some quality components and develop a multi-date air quality state (AQS) model
for the world in consequence of emergency lockdown. It is very clear from the result that amid lockdown
aerosol optical depth (AOD), sulfur dioxide (SO2), ozone, carbon monoxide (CO), particulate matter (PM2.5),
and black carbon (BC) concentration level have been signi cantly reduced in fully lockdown countries. AQS is
considerably improved amid lockdown. Hotspots of COVID-19 were under unhealthy, very unhealthy air quality
class in pre lockdown condition, but amid lockdown, these countries have been shifted to good and moderate
healthy air quality classes

Summary
COVID-19 stimulated lockdown improves the air quality index signi cantly. Several air quality components
concentration levels have been signi cantly reduced in fully lockdown countries.

1. Introduction
On December 31, 2019, World Health Organization (WHO) rst informed about the infection of pneumonia-like
unknown disease from a seafood market in Wuhan city of Hubei province, China (Neradi et al., 2020). A
guideline was issued by WHO for the countries to develop their ability to detect the unknown virus-like to
another coronavirus (CoV) like Severe Acute Respiratory Syndrome (SARS) and the provisional name was
given like SARS-CoV-2 or novel coronavirus (2019-nCoV) (Ahmed et al., 2020; Bherwani et al., 2020) on 10th of
January, 2020. Con rmation of the spreading of novel coronavirus outside China came into the front on 13th
January 2020. The 2019-nCoV was then found to be rapidly spreading disease-carrying by man (Hui et al.,
2020), and reportedly 1320 of con rmed, 1965 of suspect cases were found till 25th January 2020, out of
which 237 were poorly sick and 41 died (World Health Organization, 2020a). A few days later (30th of January,
2020), WHO declared a public health emergency of international concern regarding the outbreak of 2019-nCoV.

This disease was given an o cial name as 2019- coronavirus disease (COVID-19) on 11th February 2020
(Shereen et al., 2020), without referring to any particular geographical location (World Health Organization,
2020b). Later on, the rapid outbreak of this disease called for the issuance of several health emergency
guidelines regarding the mass gathering, carrying of ill travelers, massive preparedness activities, be a ready
campaign (Bherwani et al., 2020), and nally on 11th March 2020, WHO characterized COVID-19 as pandemic
(World Health Organization, 2020b). Meanwhile, the virus kept spreading and 3,244,586 people got infected
and 229,182 people died to date (30th April 2020) with multiple epicenters around the world, such as Italy, Iran,
Spain, France, USA, UK, Turkey, Belgium, and Brazil, etc (Gautam and Trivedi, 2020). This explosion of COVID-
19 cases around the world led many countries to adopt dramatic measures, like restricting physical human
interaction, encouraging social distancing and self-isolation, strict enforcement of quarantine, withdrawal of
public transportation and restriction on private roaming, closer of markets/supermarkets, closers of

                                                    Page 2/22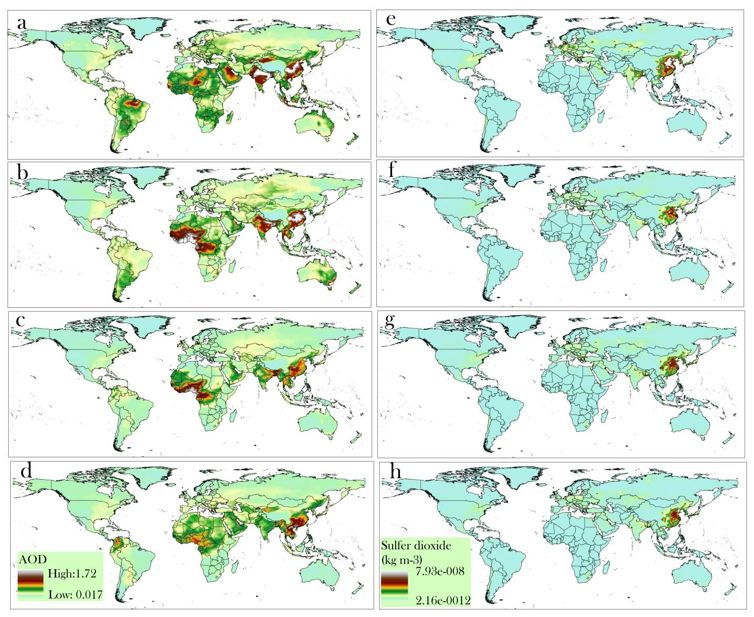
educational institutes, colleges, and other institutions, embargoing on public gathering even at private places,
declaration of voluntary curfew, even partial or total lockdown of the entire city, district, state or country (Bera
et al., 2020; Bherwani et al., 2020; Lin et al., 2020). China rst imposed a partial lockdown on January 23,
2020, and with time several other countries from different parts of the world imposed partial or total
countrywide lockdown responding to a severe outbreak of the disease (table 1).

All these aforesaid steps have been taken as preventive measures to withhold the spread of the virus and
control the death rate (Saadat et al., 2020; Chinazzi et al., 2020). Such an unusual situation of the past few
months has exceptionally changed the world with some unexpected consequences (Harapan et al., 2020).
Among them, the lockdown effect has almost stopped all the economic activities, absolutely contributed to
improving the environmental quality, which may offset the economic losses to some extent (Chakraborty and
Maity, 2020; Muhammad et al., 2020). During the lockdown, the production interregnum of industries,
restriction on transportation and public traveling system, and shut down of other business have resulted in a
sharp and sudden drop in global carbon emission (Wang and Su, 2020; Chakraborty and Maity, 2020; Saadat
et al., 2020). It has also been seen that due to production, manufacturing, and transportation break during the
lockdown global demand for oil and coal has declined to its lowest level (Wang and Su, 2020; Muhammad et
al., 2020). Therefore, not only the carbon emission, but also the release of some other severely pollutant e.g.
Greenhouse Gases (GHG) and substances like Nitrogen Dioxide (NO2), Sulfur Dioxide (SO2), Methane (CH4),
and Particulate Matter 2.5 (PM2.5) have dramatically decreased (Bera et al., 2020; NASA, 2020). For example,
since people were told to stay inside, a 25% reduction in CO2 is observed in the emission data of China which
means about 1million tons reduction in the substantial carbon emission (Wang and Su, 2020).

The emission of NO2 from the heavy industrial area of North and Northeast China was signi cantly reduced
just after the rst week of lockdown (European Space Agency, 2020). Almost 50% drop in air pollution in New
York City (USA) was observed at the same time last year after the measures were implemented to control the
spread of the virus (Saadat et al., 2020).

The emission of NO2 has reduced in different countries of Europe, like the UK, Spain, and Italy as captured by
satellite images (Ficetola and Rubolini, 2020). A signi cant reduction in the concentration of PM2.5, PM10, CO2,
and NO2 by 43%, 31%, 10%, and 18%, respectively compared to the previous year can be seen in over 22 cities
from different parts of India (Sharma et al., 2020).

Several studies have already taken the initiative to show the changes in air quality due to the restriction posed
to anthropogenic activities during the COVID-19 lockdown. Gupta et al., (2020) analyzed the impact of air
pollution level on the Covid-19 lethality in the nine selected metropolitan cities of Asia paci c region.
Muhammad et al. (2020) showed the decrease of mean tropospheric NO2 density over China and different
countries of Europe and the USA after the enforcement of lockdown compiling the environmental data
released by National Aeronautics and Space Agency (NASA) and European Space Agency (ESA). Wang and Su
(2020) analyzed the air quality index of China using air quality data and extracting the concentration of NO2,
PM2.5, and PM10 from the earth observation made by NASA and ESA. Tobías et al. (2020) used the recorded
atmospheric pollutant data at the tra c air quality monitoring station of urban background to describe
changes in pollution levels in Barcelona. The concentration of PM2.5, PM10, CO2, NO2, ozone (O3), and SO2 of

                                                      Page 3/22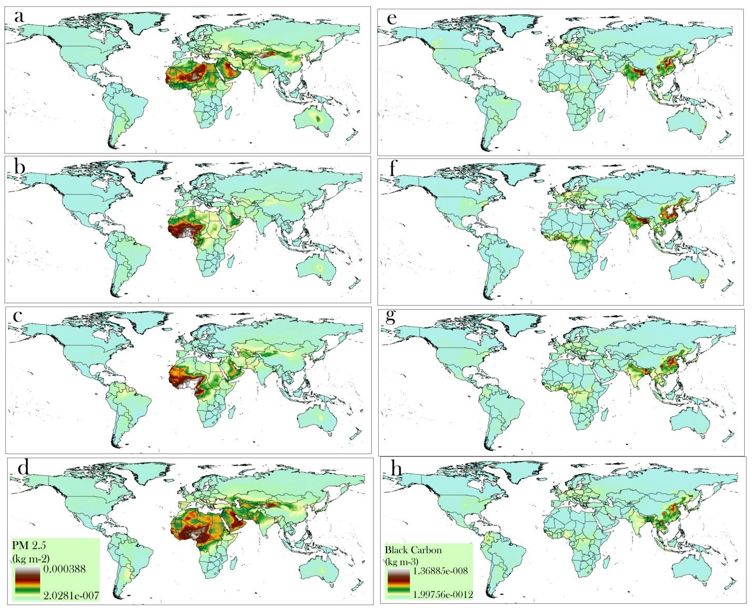
22 Indian cities on mid-March and April 2020 were compared with the same time of 2017 by Sharma et al.
(2020) to show the improvement of air quality in different parts of India. After going through all such kinds of
literature, some research gaps have been identi ed. Most of the studies show the changes in air quality and
pollution levels by considering one or two indicators like NO2 or carbon monoxide. Some other studies
considered multiple indicators of air quality and pollution, but these are mainly focused on some isolated
regions or within the country. Here a need for a comprehensive multi-parametric global scale study arises to
evaluate the overall air quality status of the entire world. Though the existing multi-parametric study
intensively investigated the component-speci c variation of air quality in pre and amid lockdown periods and
analyzed the trend, there was a lack of air quality assessment by integrating the criteria of pollution and air
quality degradation. In the present study, the lacks are focused with the critical air quality data regarding AOD,
PM2.5, SO2, O3, BC, and CO derived from Modern Era Retrospective-Analysis for Research and Applications,
version 2 (MERRA-2) (Song et al., 2018) and Atmospheric Infrared Sounder (AIRS) (Zhang et al., 2020) to
explore how far this incident can be able to improve the air quality state (AQS) across the world. It is also
investigated in full edged or partial lockdown can bring any difference in the degree of AQS.

Table1: list of the countries with complete, partial or no lockdown

                                                     Page 4/22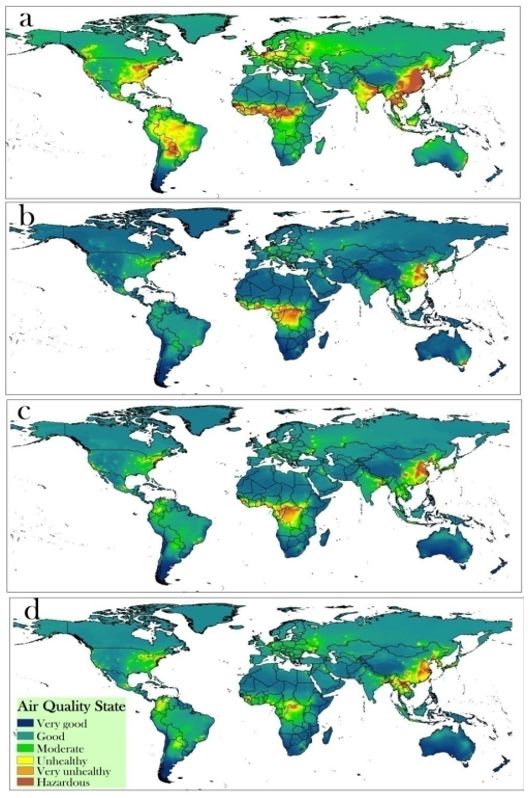
Complete lockdown                      Partial lockdown                      No lockdown

S.   Country        Starting   No of   S.    Country      Starting   No of   S.   Country
No                  date       Weeks   No.                date       Weeks   No

1    South          26-Mar     3       1     China        23-Jan     Up to   1    USA
     Africa                                                          20-
                                                                     Mar

2    New            25-Mar     4       2     Saudi        25-Mar     -       2    Brazil
     Zealand                                 Arabia

3    India          25-Mar     3       3     Columbia     24-Mar     -       3    Sweden

4    United         23-Mar     -       4     Australia    23-Mar     -       4    Pakistan
     Kingdom

5    Jordan         25-Mar     -       5     Israel       19-Mar     -       5    Canada

6    Argentina      21-Mar     3       6     European     16-Mar     -       6    North Korea
                                             Union

7    Belgium        17-Mar     4       7     Czech        16-Mar     -       7    Ukraine
                                             Republic

8    Germany        20-Mar     4       8     Morocco      15-Mar     -       8    Indonesia

9    Malaysia       16-Mar     4       9     Kenya        15-Mar     -       9    Croatia

10   France         16-Mar     4       10    Poland       13-Mar     -       10   Turkmenistan

11   Spain          14-Mar     -       11    Qatar        26-Mar     -       -    -

12   Kuwait         13-Mar     2       12    UAE          31-Mar

13   Ireland        27-Mar     2       13    Panama       25-Mar

13   Norway         12-Mar     4       14    Peru         16-Mar

15   Denmark        11-Mar     4       15    Russia       30-Mar

16   Italy          10-Mar     -       16    Serbia       15-Mar

17   Iran           28-Mar     -       17    Uzbekistan   24-Mar

18   Dubai          4-Apr      2       18    Kazakhstan   18-Mar

19   El Salvador    22-Mar     4       19    Chile        23-Mar

20   Rwanda         21-Mar     4       -     -            -

21   Portugal       20-Mar     4

22   Austria        16-Mar     4

23   The            22-Mar     6
     Netherlands

25   Slovenia       20-Mar     -
                                             Page 5/22
26 Sudan 2-Apr 4
27 Singapore 3-Apr 4
28 Mexico 2-Apr 4
2. Materials And Methodology
2.1 Materials
2.1.1 MERRA-2 data
The MERRA-2 is a NASA atmospheric reanalysis data that was launched in 1980 replacing original MERRA
(Rienecker et al., 2011), and uses the data assimilation system of upgraded version of Goddard Earth-
observing System Model, Version-5 (GEOS-5) (Randles et al., 2017). GEOS-5 is a weather and climate capable
model that is composed of oceanic and land components and circulation of the atmosphere (Song et al.,
2018). While assimilating atmospheric data GEOS-5 uses grid-points based interpolation of GIS algorithms
which can combine both in-situ and remote sensing data (Buchard et al., 2016). This study particularly
employed MERRA-2 reanalyzed AOD, PM2.5, SO2, O3, black carbon. MERRA-2 is the rst one multi-temporal
reanalysis system, which contained the meteorological aerosol observations assimilated with the global
assimilation system (Randles et al., 2017). GEOS-5 is radiatively combined with Goddard Chemistry, Aerosol,
Radiation, and Transport (GOCART) provided aerosol module to produce companion gridded dataset of
aerosol. Aerosol species are considered to be non-interactive with each other. Emissions of both dust and sea
salt are dependent on the speed of surface wind whereas the sulfate and carbonaceous are principally emitted
from the combustion of fossil fuel and burning of biomass, additionally standard inventories are prescribed as
the sources of black carbon (Randles et al., 2017). The Emission Database for Global Atmospheric Research
4.1 (EDGAR) inventory is attached for prescribing SO2 emission from anthropogenic sources (Buchard et al.,
2014). The corresponding resolution of MERRA-2 and its outputs are on regular 0.625̊ x 0.5̊ longitude by
latitude grid with 72 vertical layers extended up to 80 km from the ground.
2.1.2 AIRS data
The AIRS was launched in 2002 is a high-spectral-resolution infrared sounder onboard aqua satellite
consisting of a total of 2378 channels which cover 3.7-15.4 µm wavelength with the spectral resolution of that
provides global observation of a 40 km vertical atmospheric pro le (Zhang et al., 2020). AIRS measures CO
concentration with a 45 km spatial resolution at nadir and 1650 km of the cross-track swath (Chahine et al.,
2006). Due to having the advantage long term high spatial coverage AIRS have been used by several
researchers in previous years (Fisher et al., 2010; Xiong et al., 2013; Xiong et al., 2014; Field et al., 2016; Wu et
al., 2017). Over the last few years the retrieval algorithm for extracting data from the AIRS has been developed
(Suskind et al., 2014) and the CO data has achieved researcher con dence for studying tropospheric CO
(McMillan et al., 2005; McMillan et al., 2011; Warner et al., 2010; Warner et al., 2014). Unlike other satellite data
regarding CO, AIRS has the cloud cleaning capacity that provides up to 80% cloud-free data with daily 70% of
Page 6/22global coverage (Han et al., 2018). Besides, the long historical records are the reason behind the use of ARIS
CO data in this study.
2.2 Method for preparation of air quality state (AQS)
A global AQS model has been developed to assess the status of overall air quality. The air quality is assessed
based on the concentration level of the pollutants which may harm human life due to high toxicity (Olvera-
Garcia et al., 2016). For ful lling the present purpose six major air quality indicators, as well as pollutants,
have been considered namely AOD, PM2.5, SO2, O3, black carbon and CO. Concentration of all these pollutants
has been investigated based on their toxic capacity and negative impact to the good air quality. Integrated
AQS maps have been classi ed into six classes denoting very good to hazardous following World Air Quality
Project (WAQP) (https://waqi.info/).
2.2.1 Fuzzy logic and its application
A fuzzy set is a semi-quantitative method based on the training and membership weighting technique which
was developed by Zadeh (1996) for the modeling of an uncertain and nonlinear complex system (Sowlat et al.,
2011). In the present context, a fuzzy logic system was used to integrate causative air pollutants. As this
approach works based on training and membership weighting techniques, here membership value indicates
the intensity of the effect of the quantity (Agarwal et al., 2017). In such a semi-quantitative approach, the
fuzzy membership value ranges from 0 to 1 where values trending toward 0 indicate a lesser degree of fuzzy
relation and trending toward 1 indicate a greater degree of fuzzy relation (Saha and Pal, 2019). This approach
is not bound to any universal approach of weight determination for the fuzzy membership (Li and Ma, 2007).
Therefore, any suitable and best tting approach may produce an accurate result. For AQS assessment
several researchers have used different knowledge-based approaches to assign fuzzy membership value
(Sowlat et al., 2011; Agarwal et al., 2017; Carbajal-Hernández et al., 2012; Olvera-Garcia et al., 2016). This
membership system allows us to signify a high concentration of pollutants and determine the successive
degree of AQS. Following this rule, the membership values of the pollutants (x) and were assigned from 0 to 1
and with varying degree of con dence (f(x)) and the fuzzy set can be formulated as (eq. 1)-
where A represents the fuzzy set, x is the element of universal set R, and f(x) signi es the membership
function of fuzzy.
2.3 Time progressive change of air quality state
To evaluate the change of AQS in comparison to the previous date of lockdown enforcement and its change
during lockdown implementation time progress change rate of AQS has been calculated. In this computation,
the AQS of December is considered a pre-lockdown enforcement reference date, and the change rate is
calculated for January, February, and March (Alemayendu, 2016). The following equation (Eq. 2) shows the
mathematical formulation of this change estimation.
Page 7/22where CAQS is the calculated Time progressive change of AQS; PvAQS and PrAQS are the AQS of respectively in
pre and during lockdown implementation. The result will lie between 0 to ±100 where negative and positive
values show respectively degradation and improvement of AQS and 0 indicates no change.
3. Results And Discussion
3.1 Change in pollution parameters
Country-wise spatiotemporal distribution of the major pollution indicating parameters have been illustrated in
gure 1(a-h)-3(a-h). The monthly average state of the parameters since the beginning of the outbreak of
COVID-19 in China to present has been depicted in the maps. From the time series maps, it is quite clear that
before the outbreak of these fatal diseases and imposing partial and fully edged lockdown across the world
pollution level was high in most parts of the world which are highly affected by the COVID-19. But just after
initiation of lockdown at different dates of the respective nations the pollution level is reduced signi cantly
and it continued with the continuation of lockdown. At the very initial stage, a lockdown was announced in
parts of China (23 January 2020) and it led to improvement in air pollution level (AOD was 1.72 in January
and reduced to 1.21 in February and 0.65 in March) (Fig. 1c, d), but in other parts of the world, the situation
was as usual in the case of January and February months of 2020 (Fig. 1b, c). After announcing lockdown in
European countries like Italy, France, Germany, Spain, the UK in March 2020, and onward, the situation of
pollution level has been qualitatively upgraded. For instance, CO was 123-205 ppb, and it is reduced to 59-101
PPV in European countries (Fig. 2e-h). In the case of ozone, countries like the USA, Canada, West European
countries and parts of Russia had recorded 312-405db in December 2019 (Fig. 2a) and it is reduced 306-
347db in March 2020 (Fig. 2d). Figure 3a has reported that India, China, Arabian Peninsula countries, West
African Countries like Senegal, Mali were registered at a high rate of PM2.5 in December 2019 and it is
signi cantly reduced in February and March 2020 (Fig. 3c-d). In African countries, a higher rate of PM2.5 is
observed in March 2020. The South and South East Asian countries like India, Bangladesh, Pakistan,
Myanmar, Thailand, and Indonesia have experienced a huge reduction of black carbon between the periods of
December 2019 to March 2020 (Fig. 3e-h). The rate of decline was faster immediately after experiencing
lockdown and it has been decelerated over the progress of the lockdown period. The countries that used to
witness high pollution levels triggered by a very high energy footprint have undergone a massive decrease in
pollution level. Some city level studies in India, China, and USA also have identi ed similar results (Mahato et
al., 2020; Muhammad et al., 2020).
3.2 Changing air quality state (AQS)
Integrated air quality parameters in the name of AQS in four months across the world are portrayed in gure 4
(a-d). The qualitative pollution state has been categorized into six classes following the World Air Quality
Page 8/22Project (WAQP) (https://waqi.info/). These classes have indicated the possible exposure level. In the month of
December 2019 and January 2020, the overall pollution level is found to be high in all the highly urbanized
and industrialized nations like India, China, Bangladesh, West African countries, South American Countries,
and some of the western European countries. Earlier pollution reports and studies have exhibited the same
situation (Tilt, 2019; North et al., 2019; Li et al., 2019). But after implementation of lockdown in different
countries to stop COVID 19, the different parts of the world have experienced an improvement in air quality
(Dutheil et al., 2020; Mahato et al., 2020; Muhammad et al., 2020). As all the nations have not announced a
lockdown on the same date and the nature of lockdown is either partial or full- edged, all countries have not
experienced a uniform improvement in air quality from a speci c date and the degree of improvement is also
not uniform. For example, in China, as the lockdown was announced at the earliest (23 January 2020). AQS
was found good in late January, February, and March. AQS had started to deteriorate in successive periods
( g. 4). The hotspot of COVID-19 has then shifted to some European nations like Italy, Spain, France, UK,
Germany, etc. To prevent the situation, they have imposed lockdown March onward and improvement in AQS
was observed in successive periods. The rate of improvement was found high within one to two weeks after
commencing lockdown. AQS in a regulated situation has come under the ambient air quality category. If this
state is judged in reference to WAQP forwarded exposure level scale, then it can be stated that China, India,
Bangladesh, West African countries, some parts of USA, Argentina, Brazil, Thailand, Malaysia, etc. countries
were under hazardous to unhealthy AQS category in the pre-lockdown period, and all these countries have
shifted to good to very good AQS category during lockdown (February-March, 2020). With the continuation of
the lockdown, the gradual improvement of AQS is noticed in all the respective countries (Table 2). In the
countries, where lockdown was partial, the degree of quality improvement of air is relatively less than the
countries have undergone into full edged lockdown. Tobias et al (2020), Muhammad et al. (2020) have also
found a declining trend of pollution level in Barcelona (Spain) and some other major cities of Italy, China, and
the USA.
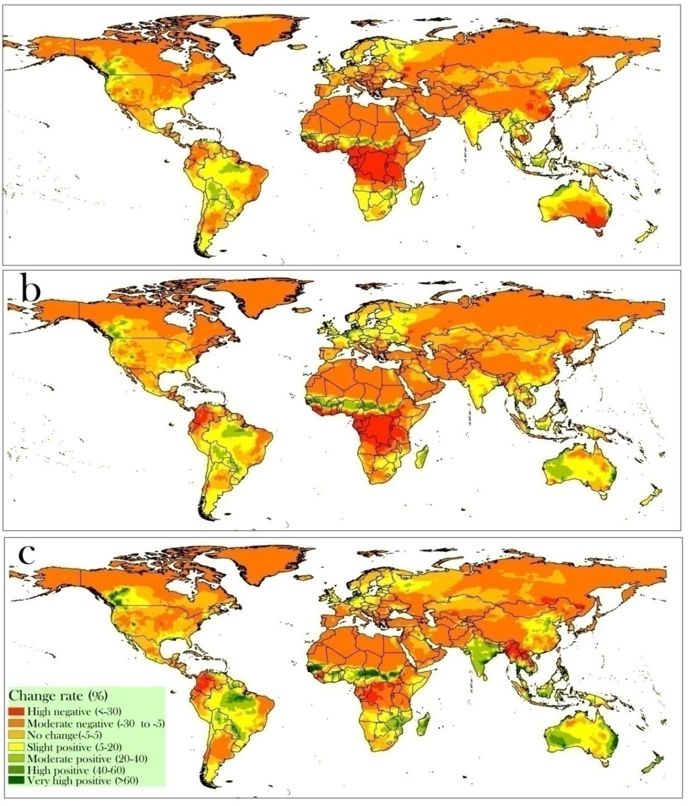
3.3 Rate of change in AQS with the continuation of lockdown condition
Figure 5(a-c) shows the percentage of change of AQS from December month of 2020 to successive other
months. In China, AQS is improved by 10% between December 2020 to February 2020. This rate is found high
(>20%) in European countries like Italy, Spain, France, Germany, Denmark, UK in between December 2020 to
March 2020 (Table 2). Extension of the hotspot to the USA with the casualty of about 54000 deaths and
lockdown situations has shown quality improvement of air in the USA. Russia, Latin American countries, and
counties of the Middle East are also identi ed under this category. Over the progress of time more, a number
of countries have included ambient AQS (Fig. 5a-c). The rate of change is recorded higher in the countries
which have experienced full- edge lockdown than countries with partial lockdown with almost the same
tenure of lockdown. A wider part of the developing and underdeveloped countries has recorded qualitative
degradation as an annual cycle of pollution level where lockdown has not been implemented. In some
countries where lockdown is applied in some speci c cities or regions, the average AQS of the entire country
does not provide any signi cant change. But this effect is clear in those areas where it is implemented.
Page 9/22Table 2 Worldwide air quality state change rate between 1st month (December) to third month (February), 1st
month to 4th month (March) and analyze based on the date of lockdown
Change Lockdown 1st to 3rd month 1st to 4th month
Status
Slight Partial Finland (7.83%), Brazil
Positive lockdown (15.37%), United Kingdom
change (14.19%), Ireland (8.16%), Sweden (2.35%)
(60%) Full Senegal (89.31%), Madagascar (61.22%),
lockdown Bolivia (64.39%)
3.4 AQS of selected cities based on lockdown implementation
As few cities were already identi ed as a hotspot of COVID-19 as per the records of very high death counts
and count of infected people, this section has inspected the AQS condition with special emphasis with some
less or non-affected cities. In Wuhan, the rst hotspot of this virus, AQS was improved substantially just after
starting lockdown. New York, Barcelona, Venice, London, Paris, Brussels, Berlin, Sydney, Amsterdam, Sao
Paulo, and other cities of European and American countries have also witnessed a remarkable improvement in
Page 10/22AQS as the regions have implemented full- edge lockdown (Table 3). Wuhan, Sydney, and Amsterdam cities
have implemented partial lockdown and consequently, the air quality improvement rate is not detected so high
(Table 3). New York, Washington DC and Islamabad cities have not experienced any such discernible change
in AQS as these areas have not experienced lockdown. In lockdown conditions as most of the sources of air
pollution like industries, transport, agriculture farms have been regulated, the pollution level is consequently
reduced. The nding of the study is not any discrete event. A few studies have already been done in
environmental perspective (Saadat et al, 2020; Sharma et al, 2020; Wang and Su, 2020; Wang et al, 2020;
Tobias et al, 2020) also have reported a similar result. Tobias et al (2020) have reported that lockdown in
Spain on 15th March 2020 has reduced NO2 level by 51%, PM10 by 31%, O3 level has increased by 33-57% in
Barcelona city and adjacent areas. Muhammud et al, (2020) have documented that pollution level in some
epicenters of COVID- 19 across Italy, Spain, the USA has reduced by 30%. Shereen et al (2020) have found a
strong association between a change of air quality and climate indicators stating the fact that lockdown has
also impacted the climate indicators like air temperature, land surface temperature, wind movement, etc.
Previous studies by Anderson and Nässén (2016), Jerez et al (2018), Manabe (2019) have also reported that a
high concentration of greenhouse gases may enhance the temperature and related other climatic components
like fog, dew, and precipitation, etc. Similarly, Aydın et al., (2020) noted that the ozone level has increased
signi cantly during the Covid-19 lockdown than pre-lockdown period which has increased the sunlight
penetration. They also pointed that the increase in ozone is associated with the decline in PM2.5
concentration. Thus it can be concluded that the drastic changes in atmospheric elements and pollutants
have been observed due to the Covid-19 lockdown and each of the atmospheric changes are associated with
each other.
Table 3 Analyzing the AQS of selected cities based on lockdown implementation
Page 11/224. Conclusion
The present study has clearly explored that around the world the AQS has improved in COVID -19 persuaded
lockdown period. The degree of improvement is regulated by the nature of lockdown policies. The full- edge
lockdown has exerted a greater impact on the degree of AQS improvement than partial and no lockdown state.
The present study is con ned up to March 2020 but the threat of COVID-19 has been accelerating over time in
different countries of the world. So, lengthening of lockdown is expected to further improve the environmental
quality. Certainly, this incident has brought colossal economic failure, millions of people are facing even food
scarcity and more people may face severe starvation in the coming days in consequence of this but from an
environmental and ecosystem point of view, this incident has extended an opportunity to restore the decaying
quality of nature. The result has clearly noted that within a very short period nature has started to restore
Page 12/22herself. It is really good for not only environmental health but also the health and well-being of the human
being. The increase of ozone will obviously provide better security to the entire ecosystem. Pollution free-
breathing not only refreshes our mind and body but also gives temporary relief to the millions of people who
are suffering from air pollution-related diseases. However, amid curse, some blessing is there with this
lockdown compulsion. When the entire world is worried about how to control pollution and paying huge
amounts of money to abate this problem, this unfortunate incident has vividly pointed out that the temporary
lockdown would be a good alternative to minimize pollution levels and its consequences.
Declarations
Con ict of Interest
The authors declare that they have no con ict of interest on any issue.
Acknowledgement
The authors would like to thank Mr. Ghulam Sarwar, Centre for Coaching and Career Planning, Jamia Millia
Islamia for helping to correct the grammatical errors from this research paper.
References
Aggarwal, A., Choudhary T. and Kumar, P., 2017. “A fuzzy interface system for determining air quality index,” In
Proceedings of the 2017 International Conference on Infocom Technologies and Unmanned Systems, Dubai,
UAE, 18–20 December 2017; pp. 786–790.
Ahmed, W., Angel, N., Edson, J. et al., 2020. First con rmed detection of SARS-CoV-2 in untreated wastewater
in Australia: A proof of concept for the wastewater surveillance of COVID-19 in the community. Science of The
Total Environment. https://doi.org/10.1016/j.scitotenv.2020.138764
Aydın, S., Nakiyingi,, B.A., Esmen, C., Güneysu, S. and Ejjada, M., 2020. Environmental impact of coronavirus
(COVID-19) from Turkish perceptive. Environment, Development and Sustainability.
https://doi.org/10.1007/s10668-020-00933-5
Alemayehu, F., 2016. Land use and land cover change in the coastal area of WatamuMida Creek, Kenya. Open
Journal of Forestry, 6(4), 230-242.
Andersson, D., and Nässén, J., 2016. Should environmentalists be concerned about materialism? An analysis
of attitudes, behaviors, and greenhouse gas emissions. Journal of Environmental Psychology, 48, 1-11.
Bera, B., Bhattacharjee, S., Shit, P.K., Sengupta, N. and Saha, S., 2020. Signi cant impacts of COVID-19
lockdown on urban air pollution in Kolkata (India) and amelioration of environmental health. Environment,
Development and Sustainability. https://doi.org/10.1007/s10668-020-00898-5
Bherwani, H., Anjum, S., Kumar, S., Gautam, S., Gupta, A., Kumbhare, H., Anshul, A. and Kumar, R., 2020.
Understanding COVID-19 transmission through Bayesian probabilistic modeling and GIS-based Voronoi
Page 13/22approach: a policy perspective. Environment, Development and Sustainability.
https://doi.org/10.1007/s10668-020-00849-0
Buchard, V., Da Silva, A.M., Calarco, P., Krotkov, N., Dickerson, R.R., Stehr, J.W., Mount, G., Spenei, E., Arkinson,
H.L. and He, H., 2014. Evaluation of GEOS-5 Sulfur Dioxide Simulations during the Frostburg, MD 2010 Field
Campaign. Atmospheric Chemistry and Physics, 14, 1929–1941.
Buchard, V., da Silva, A.M., Randles, C.A., Colarco, P., Ferrare, R., Hair, J., Hostetler, C., Tackett, J., Winker, D.,
2016. Evaluation of the surface PM2.5 in version 1 of the NASA MERRA aerosol reanalysis over the United
States. Atmospheric Environment, 125, 100–111.
Carbajal-Hernández, J.J., Sánchez-Fernández, L.P., Carrasco-Ochoa, J.A. and Martínez-Trinidad, J.F., 2012.
Assessment and prediction of air quality using fuzzy logic and autoregressive models. Atmospheric
Environment, 60, 37-50.
Chahine, M.T., Pagano, T.S., Aumann, H.H., et al. 2006. "AIRS: Improving weather forecasting and providing
new data on greenhouse gases." Bulletin of the American Meteorological Society, 87(7), 911-926.
Chinazzi, M., Davis, J.T., Ajelli, M., Gioannini, C., Litvinova, M., Merler, S., y Piontti, A.P., Mu, K., Rossi, L., Sun, K.
and Viboud, C., 2020. The effect of travel restrictions on the spread of the 2019 novel coronavirus (COVID-19)
outbreak. Science, 368(6489), 395-400.
Chakraborty, I. and Maity, P., 2020. COVID-19 outbreak: Migration, effects on society, global environment and
prevention. Science of The Total Environment, 728, 138882. https://doi.org/10.1016/j.scitotenv.2020.138882
Dutheil, F., Baker, J.S. and Navel, V., 2020. COVID-19 as a factor in uencing air pollution? Environmental
Pollution, 263, 114466. https://doi.org/10.1016/j.envpol.2020.114466
European Space Agency. 2020. COVID-19: nitrogen dioxide over China.
https://www.esa.int/Applications/Observing_the_Earth/Copernicus/Sentinel-5 P/COVID
19_nitrogen_dioxide_over_China.
Ficetola, G.F. and Rubolini, D., 2020. Climate affects global patterns of COVID-19 early outbreak
dynamics. medRxiv. https://doi.org/10.1101/2020.03.23.20040501
Field, R.D., Van Der Werf, G.R., Fanin, T., Fetzer, E.J., Fuller, R., Jethva, H., Levy, R., Livesey, N.J., Luo, M., Torres,
O. and Worden, H.M., 2016. Indonesian re activity and smoke pollution in 2015 show persistent nonlinear
sensitivity to El Niño-induced drought. Proceedings of the National Academy of Sciences, 113(33), 9204-9209.
Fisher, J.A., Jacob, D.J., Purdy, M.T. et al., 2010. Source attribution and interannual variability of Arctic
pollution in spring constrained by aircraft (ARCTAS, ARCPAC) and satellite (AIRS) observations of carbon
monoxide. Atmospheric Chemistry and Physics, 10, 977–996.
Gautam, S. and Trivedi, U., 2020. Global implications of bio-aerosol in pandemic. Environment, Development
and Sustainability, 22, 3861–3865.
Page 14/22Gupta, A., Bherwani, H., Gautam, S., Anjum, S., Musugu, K., Kumar, N., Anshul, S. and Kumar, R., 2020. Air
pollution aggravating COVID-19 lethality? Exploration in Asian cities using statistical models. Environment,
Development and Sustainability. https://doi.org/10.1007/s10668-020-00878-9
Han, H., Liu, J., Yuan, H., Jiang, F., Zhu, Y., Wu, Y., Wang, T. and Zhuang, B., 2018. Impacts of synoptic weather
patterns and their persistence on free tropospheric carbon monoxide concentrations and out ow in eastern
China. Journal of Geophysical Research: Atmospheres, 123(13), 7024-7046.
Harapan, H., Itoh, N., Yu ka, A., Winardi, W. et al., 2020. Coronavirus disease 2019 (COVID-19): A literature
review. Journal of Infection and Public Health. https://doi.org/10.1016/j.jiph.2020.03.019
Hui, D.S., Azhar, E.I., Madani, T.A., Ntoumi, F. et al., 2020. The continuing 2019-nCoV epidemic threat of novel
coronaviruses to global health — The latest 2019 novel coronavirus outbreak in Wuhan, China. International
Journal of Infectious Diseases, 91, 264–266.
Jerez, S., López-Romero, J.M., Turco, M., Jiménez-Guerrero, P., Vautard, R. and Montávez, J.P., 2018. Impact of
evolving greenhouse gas forcing on the warming signal in regional climate model experiments. Nature
communications, 9(1), 1-7.
Li, X., Jin, L. and Kan, H., 2019. Air pollution: a global problem needs local xes. Nature, 570, 437-439.
Li T. and Ma J., 2007. Fuzzy Approximation Operators Based on Coverings. In: An A., Stefanowski J., Ramanna
S., Butz C.J., Pedrycz W., Wang G. (eds) Rough Sets, Fuzzy Sets, Data Mining and Granular Computing.
RSFDGrC 2007. Lecture Notes in Computer Science, vol 4482. Springer, Berlin, Heidelberg.
Lin, Q., Zhao, S., Gao, D. et al., 2020. A conceptual model for the coronavirus disease 2019 (COVID-19)
outbreak in Wuhan, China with individual reaction and governmental action. International Journal of
Infectious Diseases, 93, 211-216.
Mahato, S., Pal, S. and Ghosh, K.G., 2020. Effect of lockdown amid COVID-19 pandemic on air quality of the
megacity Delhi, India. Science of The Total Environment. https://doi.org/10.1016/j.scitotenv.2020.139086
Manabe, S., 2019. Role of greenhouse gas in climate change. Tellus A: Dynamic Meteorology and
Oceanography, 71(1), 1-13.
McMillan, W.W., Barnet, C., Strow, L., Chahine, M.T., McCourt, M.L., Warner, J.X., Novelli, P.C., Korontzi, S.,
Maddy, E.S. and Datta, S., 2005. Daily global maps of carbon monoxide from NASA's Atmospheric Infrared
Sounder. Geophysical Research Letters, 32(11), L11801.
McMillan, W.W., Evans, K.D., Barnet, C.D., Maddy, E.S., Sachse, G.W. and Diskin, G.S., 2011. Validating the AIRS
Version 5 CO retrieval with DACOM in situ measurements during INTEX-A and-B. IEEE transactions on
geoscience and remote sensing, 49(7), 2802-2813.
Muhammad, S., Long, X. and Salman, M., 2020. COVID-19 pandemic and environmental pollution: A blessing
in disguise? Science of The Total Environment, 728, 138820. https://doi.org/10.1016/j.scitotenv.2020.138820
Page 15/22NASA. 2020. Airborne Nitrogen Dioxide Plummets Over China.
https://earthobservatory.nasa.gov/images/146362/airborne- nitrogen-dioxide-plummets-over-china.
(Accessed on 28 April 2020).
Neradi, D., Hooda, A., Shetty, A., Kumar, D., Salaria, A.K. and Goni, V., 2020. Management of Orthopaedic
Patients During COVID‐19 Pandemic in India: A Guide. Indian Journal of Orthopaedics.
https://doi.org/10.1007/s43465-020-00122-6
North, C.M., Rice, M.B., Ferkol, T., Gozal, D., Hui, C., Jung, S.H., Kuribayashi, K., McCormack, M.C., Mishima, M.,
Morimoto, Y. and Song, Y., 2019. Air pollution in the Asia-Paci c region. A joint Asian Paci c Society of
Respirology/American Thoracic Society perspective. American journal of respiratory and critical care
medicine, 199(6), 693-700.
Olvera-García, M.Á., Carbajal-Hernández, J.J., Sánchez-Fernández, L.P. and Hernández-Bautista, I., 2016. Air
quality assessment using a weighted Fuzzy Inference System. Ecological informatics, 33, 57-74.
Randles, C.A., da Silva, A.M., Buchard, V., Colarco, P.R., Darmenov, A., Govindaraju, R., Smirnov, A., Holben, B.,
Ferrare, R., Hair, J., Shinozuka, Y., Flynn, C.J., 2018. The merra-2 aerosol reanalysis, 1980 onward. part I:
system description and data assimilation evaluation. Journal of Climate, 30, 6823–6850.
Rienecker, M.M., Suarez, M.J., Gelaro, R. et al., 2011. MERRA - NASA's Modern-Era Retrospective Analysis for
Research and Applications. Journal of Climate, 24, 3624-3648.
Saadat, S., Rawtani, D. and Hussain, C.M., 2020. The environmental perspective of COVID-19. Science of The
Total Environment, 728, 138870. https://doi.org/10.1016/j.scitotenv.2020.138870
Saha, T.K. and Pal, S., 2019. Exploring the physical wetland vulnerability of the Atreyee river basin in India and
Bangladesh using logistic regression and fuzzy logic approaches. Ecological indicators, 98, 251-265.
Sharma, S., Zhang, M., Gao, J., Zhang, H. and Kota, S.H., 2020. Effect of restricted emissions during COVID-19
on air quality in India. Science of The Total Environment, 728, 138878.
https://doi.org/10.1016/j.scitotenv.2020.138878
Shereen, M.A., Khan, S., Kazmi, A., Bashir, N. and Siddiqui, R., 2020. COVID-19 infection: Origintransmission,
and characteristics of human coronaviruses. Journal of Advanced Research, 24, 91-98.
Song, Z., Fu, D., Zhang, X., Wu, Y., Xia, X., He, J., Han, X., Zhang, R. and Che, H., 2018. Diurnal and seasonal
variability of PM2. 5 and AOD in North China plain: Comparison of MERRA-2 products and ground
measurements. Atmospheric Environment, 191, 70-78.
Sowlat, M.H., Gharibi, H., Yunesian, M., Mahmoudi, M.T. and Lot , S., 2011. A novel, fuzzy-based air quality
index (FAQI) for air quality assessment. Atmospheric Environment, 45(12), 2050-2059.
Susskind, J., Blaisdell, J.M. and Iredell, L., 2014. Improved methodology for surface and atmospheric
soundings, error estimates, and quality control procedures: the atmospheric infrared sounder science team
version-6 retrieval algorithm. Journal of Applied Remote Sensing, 8(1), 084994.
Page 16/22Tilt, B., 2019. China’s air pollution crisis: Science and policy perspectives. Environmental science & policy, 92,
275-280.
Tobías, A., Carnerero, C., Reche, C., Massagué, J., Via, M., Minguillón, M.C., Alastuey, A. and Querol, X., 2020.
Changes in air quality during the lockdown in Barcelona (Spain) one month into the SARS-CoV-2
epidemic. Science of The Total Environment, 726, 138540. https://doi.org/10.1016/j.scitotenv.2020.1385400
Wang, P., Chen, K., Zhu, S., Wang, P. and Zhang, H., 2020. Severe air pollution events not avoided by reduced
anthropogenic activities during the COVID-19 outbreak. Resources, Conservation and Recycling, 158, 104814.
https://doi.org/10.1016/j.resconrec.2020.104814
Wang, Q. and Su, M., 2020. A preliminary assessment of the impact of COVID-19 on the environment–A case
study of China. Science of The Total Environment, 728, 138915.
https://doi.org/10.1016/j.scitotenv.2020.138915
Warner, J.X., Wei, Z., Strow, L.L., Barnet, C.D., Sparling, L.C., Diskin, G. and Sachse, G., 2010. Improved
agreement of AIRS tropospheric carbon monoxide products with other EOS sensors using optimal estimation
retrievals. Atmospheric Chemistry and Physics, 10, 9521–9533.
Warner, J.X., Yang, R., Wei, Z., Carminati, F., Tangborn, A., Sun, Z., Lahoz, W.A., Attié, J.L., El Amraoui, L. and
Duncan, B.N., 2014. Global carbon monoxide products from combined AIRS, TES and MLS measurements on
A-train satellites. Atmospheric Chemistry and Physics, 14, 103–114.
World Health Organization, 2020a. Novel Coronavirus (2019-nCoV) Situation Report – 5, 25 January 2020.
https://www.who.int/docs/default-source/coronaviruse/situation-reports/20200125-sitrep-5-2019-ncov.pdf?
sfvrsn=429b143d_8. (Accessed 30 April 2020).
World Health Organization, 2020b. Rolling updates on coronavirus disease (COVID-19) Updated 28 April 2020.
https://www.who.int/emergencies/diseases/novel-coronavirus-2019/events-as-they-happen (Accesses 30
April 2020).
Wu, Y., Han, Y., Voulgarakis, A., Wang, T., Li, M., Wang, Y., Xie, M., Zhuang, B. and Li, S., 2017. An agricultural
biomass burning episode in eastern China: Transport, optical properties, and impacts on regional air
quality. Journal of Geophysical Research: Atmospheres, 122(4), 2304-2324.
Xiong, X., Barnet, C., Maddy, E., Wofsy, S.C., Chen, L., Karion, A. and Sweeney, C., 2013. Detection of methane
depletion associated with stratospheric intrusion by atmospheric infrared sounder (AIRS). Geophysical
Research Letters, 40(10), 2455-2459.
Xiong, X., Maddy, E.S., Barnet, C., Gambacorta, A., Patra, P.K., Sun, F. and Goldberg, M., 2014. Retrieval of
nitrous oxide from Atmospheric Infrared Sounder: Characterization and validation. Journal of Geophysical
Research: Atmospheres, 119(14), 9107-9122.
Zadeh, L.A., 1965. Fuzzy sets. Information and control, 8(3), 338-353.
Page 17/22Zhang, X., Wang, H., Che, H.Z., Tan, S.C., Shi, G.Y. and Yao, X.P., 2020. The impact of aerosol on MODIS cloud
detection and property retrieval in seriously polluted East China. Science of The Total Environment, 711,
134634. https://doi.org/10.1016/j.scitotenv.2019.134634
Figures
Figure 1
Spatio-temporal mapping of monthly averaged aerosol optical depth and sulfur dioxide for (a), (e) December
of 2019; (b), (f) January of 2020; (c), (g) February of 2020; and (d) , (h) March of 2020. Note: The designations
employed and the presentation of the material on this map do not imply the expression of any opinion
whatsoever on the part of Research Square concerning the legal status of any country, territory, city or area or
of its authorities, or concerning the delimitation of its frontiers or boundaries. This map has been provided by
the authors.
Page 18/22Figure 2
Spatio-temporal mapping of monthly averaged ozone and carbon dioxide for (a), (e) December of 2019; (b), (f)
January of 2020; (c), (g) February of 2020; and (d), (h) March of 2020. Note: The designations employed and
the presentation of the material on this map do not imply the expression of any opinion whatsoever on the
part of Research Square concerning the legal status of any country, territory, city or area or of its authorities, or
concerning the delimitation of its frontiers or boundaries. This map has been provided by the authors.
Page 19/22Figure 3
Spatio-temporal mapping of monthly averaged PM2.5 and black carbon for (a), (e) December of 2019; (b), (f)
January of 2020; (c), (g) February of 2020; and (d), (h) March of 2020. Note: The designations employed and
the presentation of the material on this map do not imply the expression of any opinion whatsoever on the
part of Research Square concerning the legal status of any country, territory, city or area or of its authorities, or
concerning the delimitation of its frontiers or boundaries. This map has been provided by the authors.
Page 20/22Figure 4
Air quality state modeling for (a) December of 2019, (b) January of 2020, (c) February of 2020, and (d) March
of 2020. Note: The designations employed and the presentation of the material on this map do not imply the
expression of any opinion whatsoever on the part of Research Square concerning the legal status of any
country, territory, city or area or of its authorities, or concerning the delimitation of its frontiers or boundaries.
This map has been provided by the authors.
Page 21/22Figure 5
Change rate of air quality state between (a) December of 2019 and January of 2020, (b) December of 2019
and February of 2020, (c) December of 2019 and March of 2020. Note: The designations employed and the
presentation of the material on this map do not imply the expression of any opinion whatsoever on the part of
Research Square concerning the legal status of any country, territory, city or area or of its authorities, or
concerning the delimitation of its frontiers or boundaries. This map has been provided by the authors.
Page 22/22You can also read