Rethinking London's Red Routes: From red to green - Global ...
←
→
Page content transcription
If your browser does not render page correctly, please read the page content below
Rethinking London’s Red Routes:
From red to green
New health index highlights need to tackle air pollution
from major roads

Araceli Camargo, Lab Director & Co-Founder, Centric Lab
Oliver Lord, Head of Policy and Campaigns, Environmental Defense Fund Europe
About Environmental Defense Fund Europe
One of the world’s leading international nonprofit organizations, Environmental Defense Fund
(edf.org; globalcleanair.org) creates transformational solutions to the most serious
environmental problems. To do so, EDF links science, economics, law, and innovative private-
sector partnerships. With more than 2.5 million members and offices in the United States,
China, Mexico, the United Kingdom and the European Union, EDF’s scientists, economists,
attorneys and policy experts are working in 23 countries and across the E.U. to turn our
solutions into action.

About Centric Lab
Centric Lab (thecentriclab.com) works as a research & data-driven lab to help organisations
make effective decisions for supporting mental and physical health, specifically for communities
that are the most susceptible to poor health outcomes. Our lab focuses the stress response,
which is a whole human system response (brain and body). This allows us to understand how
the places people interact with affect their health outcomes through their exposure to
environmental and psycho-social stressors.

                                                    Rethinking London’s Red Routes: From red to green 1
Summary
A swathe of regulations and investment, or lack there of, over a long period of time have
prioritised motor traffic in London. In the 1990s, the Government introduced its ‘Red Routes’
policy to designate ’clearways’ in the capital on which through traffic movements would gain
greater priority over local journeys. The Red Routes – also known as the Transport for London
road network (TLRN) – cut across the capital and carry up to a third of traffic on a typical day.

The prioritisation of motor traffic significantly impacts London’s environment and creates
health inequities in the city. Motor vehicle dependency remains high amongst residents and the
number of miles driven by commercial vans has risen exponentially in recent years. Moreover,
the Red Routes network was established in a time mostly unrecognisable today – when diesel
did not have a prominent use, estimates of how the city would grow were more conservative and
e-commerce deliveries were unheard of.

Londoners living, working, visiting and going to school near to a busy road are exposed to far
greater levels of air pollution than elsewhere in the capital. This is a particular case for the Red
Routes, where, in comparison to an average road in London levels of nitrogen dioxide (NO2)
pollution are estimated to be 57% higher and levels of fine particulate matter (PM2.5) are
estimated to be 35% higher.1 The Red Routes will also likely be some of the last areas in the UK
to meet air quality thresholds as recommended by the World Health Organization.

In December 2020, an inquest in London recorded what is thought to be the world’s first case of
air pollution listed as a direct cause of death. Nine-year old Ella Adoo-Kissi-Debra, who had
persistent asthma attacks in the last two years of her life, had grown up only 25 metres from the
South Circular, a busy Red Route. This case highlights the consequences of health inequities;
Ella was a young Black girl and research has shown that people who are racialised as Black are
disproportionately exposed to higher levels of air pollution.2 Additionally, the legal implications
of this case are groundbreaking for moving air pollution policy forward.

The health impacts of transport-related air pollution are multifactorial and systemic. To
understand the full extent of how air pollution impacts a person’s life, proximity to pollution
sources must be considered alongside other pollution types (e.g., noise and light), as well as

1
 https://www.globalcleanair.org/edf-europe-methods-rethinking-the-red-routes/
2
 https://www.london.gov.uk/sites/default/files/impact_of_les_-
_addendum_ethnicity_and_exposure_ammendedfeb21.pdf

                                                          Rethinking London’s Red Routes: From red to green 2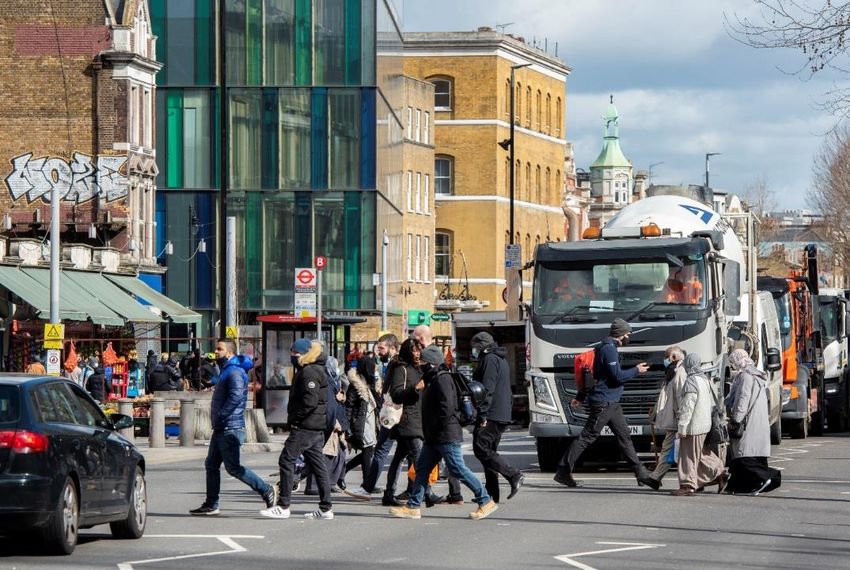
intervening social and behavioural stressors. Examples of these stressors include feeling
physiologically safe, legibility and socio-economic differences.

Air pollution and environmental stressors from the Red Routes network are affecting
Londoners’ health in different ways. Data analysis is needed to better understand these impacts
and to identify who is at greatest risk. Environmental Defense Fund Europe commissioned
Centric Lab to undertake a health assessment of the Red Routes network. The findings from this
assessment are presented in this paper, alongside a data matrix available for download.3

The health assessment brings to light people’s lived experience along the Red Routes. For
example, it identified how the A12 between Poplar and Bromley By Bow is a particular concern
for the neurodiverse community (e.g., people on the autism spectrum or with dyslexia), as air
pollution impacts are compounded by complex, disorganised and noisy environments. Similarly,
the A13 between Whitechapel and Limehouse can be overbearing for children owing to
environmental stressors and high levels of air pollution affecting their early stages of
development. The assessment concluded all parts of the Red Routes are a priority for
intervention and action should be taken to make them significantly healthier and safer.

As the capital strives for cleaner air and considers a firm action plan to decarbonise the city, data
suggests the Red Routes policy is ripe for a review. Red Routes continue to be designated
primarily areas for motor movement, conflicting with the growing number of people who live
and conduct daily activities by these roads. Policymakers must come together to assess whether
the network is still fit for purpose so that we make London healthier and more equitable.

                   Figure 1 Pollution zone sign by Choked Up

3
    https://www.edf.org/content/edf-europe-centric-lab-health-assessment-matrix

                                                               Rethinking London’s Red Routes: From red to green 3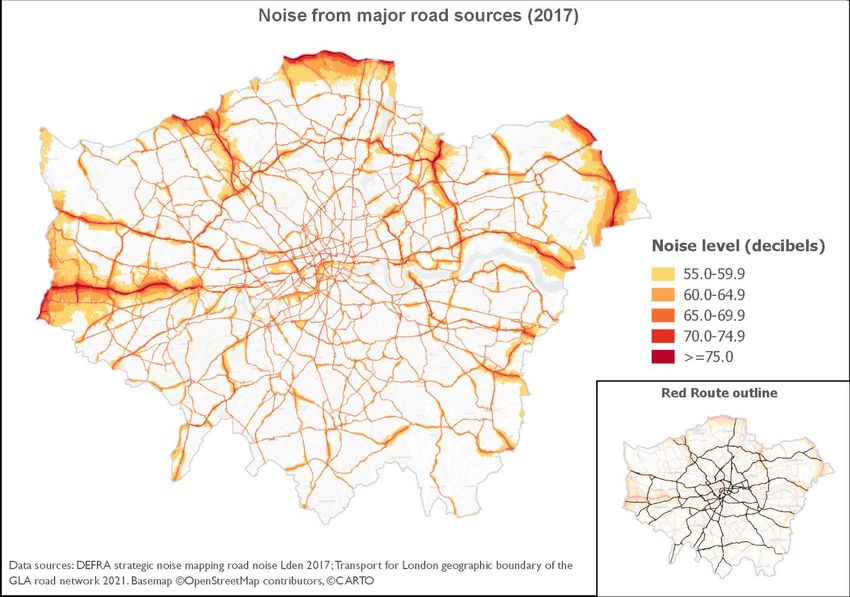
Contents

Current policy ................................................................................................................................ 5
Air pollution on the Red Routes ............................................................................................... 11
Linking air pollution with other environmental stressors ...................................................... 14
A health assessment of the Red Routes ................................................................................ 16
   Health impact scenarios ........................................................................................................ 17
   Understanding the lived experience .................................................................................... 20
Time for change.......................................................................................................................... 21
   Policy considerations ............................................................................................................. 22
   Further research ..................................................................................................................... 24
Appendix 1: Summary of health impact scenarios................................................................ 25
Appendix 2: Examples in other global cities .......................................................................... 26
Appendix 3: How to use the data matrix ................................................................................. 28

                                                                              Rethinking London’s Red Routes: From red to green 4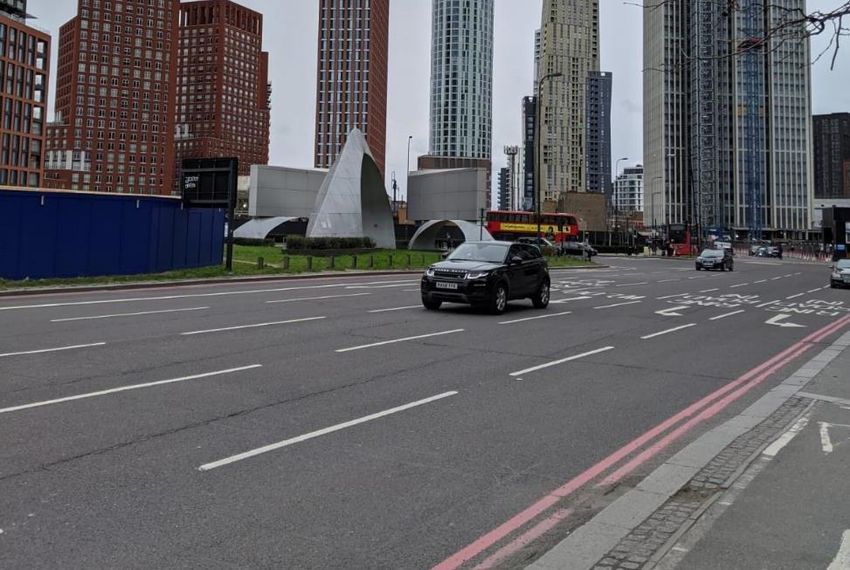
Current policy
For decades, planners have sought to prioritise or protect space
for motor traffic in cities. For example, legislation previously
safeguarded almost 900 miles of roads in London for widening
so the city could continue to accommodate traffic growth.4

In the 1990s, policymakers acknowledged the negative impact
that widening and building new roads in cities could have (i.e.
by encouraging more traffic), but still wanted to keep traffic
moving. Also, London’s roads had become heavily congested,
partly owing to the lack of a direct authority covering traffic
after the Greater London Council was abolished.

As a result, the Government initiated in 1991 London’s ‘Red Routes,’ a network of major priority
roads cutting across the city. The roads aimed to reduce congestion and encourage traffic flow,
enabling freight and other vehicles to move freely across the city. Single or double red lines were
painted on the routes to signify restrictions to vehicles waiting, parking and loading. Traffic flow
on these roads has been heavily prioritised ever since.

Today the Red Routes make up only 5% of all the capital’s roads but carry a third of London’s
traffic on an average day. In addition to dangerous levels of air pollution (see next section),
funneling traffic on these roads has unfair economic consequences for local high streets and
town centres, often severed by six lanes of traffic running through them (e.g., Holloway Road in
Islington). The setup creates a high level of road danger – around 29% of all collisions and 37%
of all road traffic fatalities in London occur on the Red Routes.5

    The Red Routes are more than ‘roads’

    According to Transport for London, a Red Route is a major ‘road.’ A road in the urban
    lexicon is defined as an essential highway whose main function is to accommodate
    movement of motor traffic. On the other hand, streets are those for ‘place’ or living;
    motor traffic movement becomes less of a priority in this demarcation.

    These distinctions have been used to justify sustaining traffic on big roads including Red
    Routes. Yet the Red Routes are often places where people live and dwell, and near which
    up to 50,000 children go to primary school. By failing to acknowledge that Red Routes
    are also residential areas, policies continue to contribute to health inequities.

4
    https://www.roads.org.uk/ringways/the-end
5
    https://content.tfl.gov.uk/vision-zero-action-plan.pdf

                                                             Rethinking London’s Red Routes: From red to green 5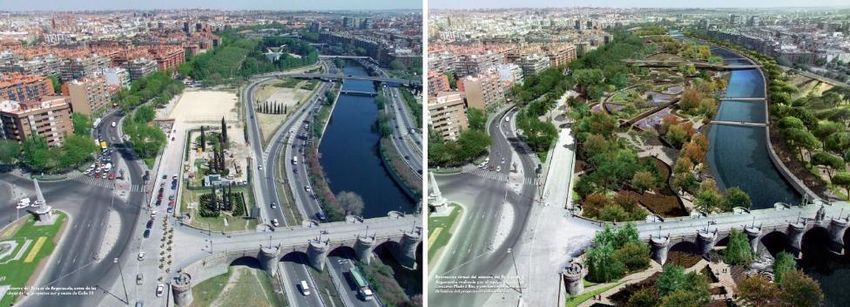
After the establishment of the Greater London Authority, the management of the Red Routes
was handed to Transport for London (TfL) as the strategic highways authority. TfL oversees the
day-to-day management of the Red Routes (the TfL Road Network) and any improvements on
behalf of the Mayor of London, rather than the local authority. Local authorities have
responsibility over the majority of roads in the capital, spanning from quiet cul-de-sacs to busier
A-roads. Unsurprisingly, residents’ complaints often get bounced as a blame game between
authorities.

               Figure 2 A tweet from Islington Council regarding a resident's concern along a Red Route

Thirty years since the introduction of the Red Routes network, little has changed in terms of
how the network operates. They are often hostile environments for anyone walking and cycling
and a major source of air and noise pollution, alongside other social and behavioral stressors.

               Figure 3 A resident’s tweet regarding the lack of progress or change along a Red Route

                                                                Rethinking London’s Red Routes: From red to green 6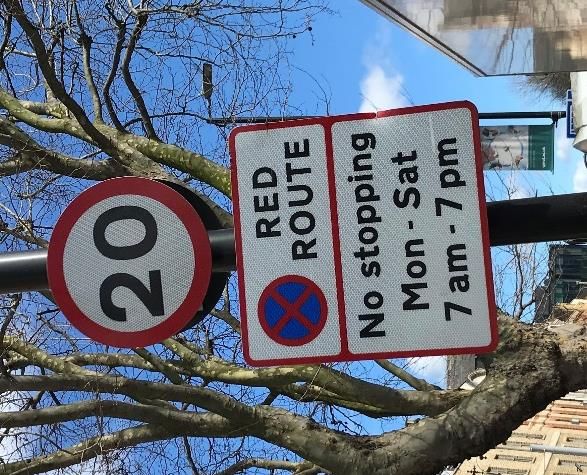
Recently, the increase of Low Traffic Neighbourhoods – a Government policy to discourage
drivers taking shortcuts on smaller roads and to enable walking and cycling – has led to
concerns about traffic and congestion on the main roads. Low Traffic Neighbourhoods have
exposed a vacuum in policy to actively reduce traffic on the busier roads, especially the Red
Routes. Reducing traffic on smaller roads and main roads must go hand-in-hand.

Even where improvement schemes exist, there is often very slow progress. For example, current
plans to transform the one-way, six-lane Vauxhall system and improve the area for pedestrians
and cyclists will not be complete until 2025 – ten years after an initial consultation.6

                   Figure 4 The six-lane one-way system along a Red Route in Vauxhall

The Red Routes are challenging to address because of the broad policy to prioritise vehicle
traffic along these roads. They are often excluded when developing progressive policy, such as
Low Traffic Neighbourhoods or Zero Emission Zones. Recent schemes to address rising traffic
levels have often been targeted on already less congested roads. This cannot be the only
intervention as it doesn’t solve the air pollution equitability problem and in some circumstances
has put more of a health burden on residents living on Red Routes.

A comprehensive plan and clear targets to reduce traffic across the city, particularly on Red
Routes, is critical. Vehicle use continues to increase – in 2019, there were 3.9 billion more miles
driven on London's roads than in 2009.7 A TfL Liveable Neighbourhoods programme has

6
    https://tfl.gov.uk/travel-information/improvements-and-projects/vauxhall-gyratory
7
    https://roadtraffic.dft.gov.uk/regions/6

                                                                   Rethinking London’s Red Routes: From red to green 7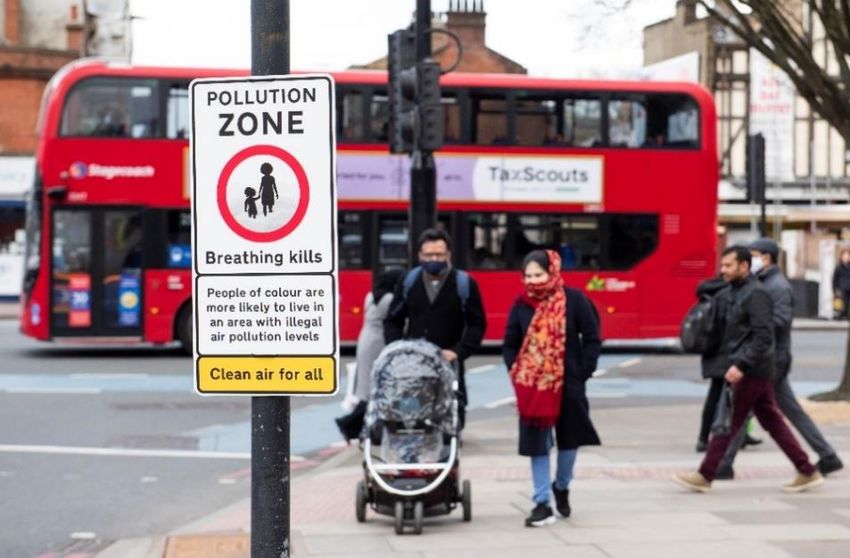
started some projects that include action on main roads and Red Routes, but progress has been
very slow. Moreover, a mere reduction in traffic doesn’t necessarily equate to quantifiably
cleaner air. Action is needed to address the health burden that air pollution is putting on all
Londoners.

Taking a closer look at the Red Routes network, there are key pressures that need be addressed:

    1) Goods and services – with rising numbers of delivery vans and construction vehicles
        on the streets, there is an urgent need to work with industry and consider more efficient
        ways for goods and services to enter the city. It is also important that local high streets
        fulfill the necessary needs and demands of local communities. As currently planned, the
        Red Routes network conveniently enables road transport freight to move across the city.
        Meanwhile, more and more goods are being made available for delivery within 24 hours
        at very low cost – providing an incentive to stay home rather than visit the local high
        street.

        A TfL study has shown that 39% of vans driving across London are only a quarter full,8
        leaving plenty of space to optimise efficiency. Figure 4 demonstrates how the total
        number of kilometres driven by commercial vehicles – Heavy Good Vehicles (HGVs) like
        lorries and Light Goods Vehicles (LGVs) like vans combined – has risen in London.

Freight and servicing vehicles kilometres in Greater London, indexed against 2009 levels

        Figure 5 A chart from the Mayor of London and TfL's 2019 Freight and servicing action plan

8
  http://content.tfl.gov.uk/technical-note-05-what-are-the-main-trends-and-developments-affecting-van-
traffic.pdf

                                                                  Rethinking London’s Red Routes: From red to green 8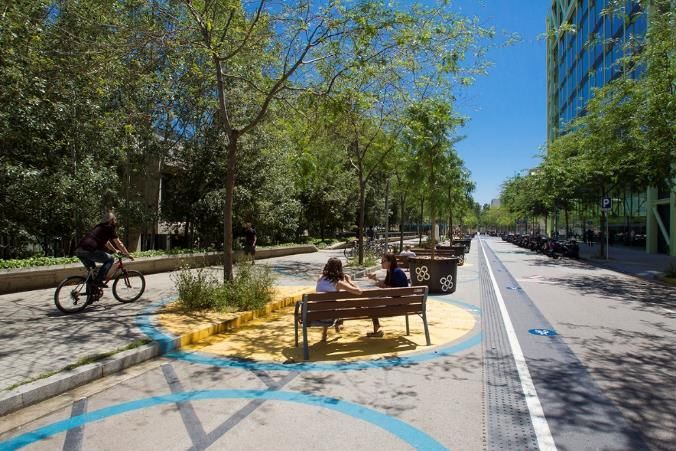
2) Car use and ownership – with 2.6 million cars registered in London,9 more efforts
          are needed to raise awareness on the need to reduce redundant and unneccessary car
          journeys. However, to do this, it is important to introduce equitable mobility zones. This
          means that a wider transport infrastructure must be considered to reduce the need for a
          car. Cars can be a tool for equitable mobility, especially for those with mobility
          challenges, which needs to be highlighted and supported. It is also important to avert a
          car-led recovery from the pandemic, the consequences of which will last generations. The
          number of miles driven by cars in London increased nearly 20% – by 2.6 billion miles –
          between 2009 and 2019, which is a phenomena that is worth addressing to understand
          how to create meaningful and equitable solutions.10 Increased car traffic can lead to
          congestion (and subsequently air pollution) as well as delays to bus passengers, which
          makes public transport less convenient. This is a big issue given that public transport
          accessibility is critical to reducing overall car ownership levels – Figure 5 demonstrates a
          clear association between the two.

          Figure 6 A chart from EDF Europe’s Cleaner Car Index depicting the link between public transport accessibility and car
          ownership in London

9
    https://www.edfeurope.org/news/2020/14/10/revealed-best-and-worst-parts-london-green-cars
10
     https://roadtraffic.dft.gov.uk/regions/6

                                                                     Rethinking London’s Red Routes: From red to green 9
3) Walking, wheeling and cycling (active transport) – there is huge potential to
create urban affordances that support people in adopting healthier, safer, quicker and
more affordable ways to get around the city. The safety issues are especially important
considering many marginalised communities (women, LGBTQ+, disabled, neurodiverse)
are not objectively safe using current active transport options. Nearly 50% of car trips
made by London residents could be cycled in around 10 minutes and a third made by
drivers or passengers could be walked in under 25 minutes.11 It is important to note that
this is a passive statistic that does not necessarily reflect the lived experience. For
example, out of the 50% that could be a cycle ride – the decision could have been
significantly impacted by safety, weather or a change in personal mobility, for example.
Therefore, research into the lived experience and behavior aspects of car use is
paramount in helping the equitable, fair and safe transition from the car. In 2021 the
charity Sustrans has stated the vast majority of Red Routes are currently ‘not safe for
people to walk or cycle on,’ despite often being the most direct route from A to B.12 For
example, they do not meet the safety criteria TfL have set out in the Cycle Route Quality
Criteria and Healthy Streets Indicators. Additionally, there is a link between car
ownership and physical activity, as demonstrated in Figure 6.
Figure 7 A chart from EDF Europe’s Cleaner Car Index depicting the link between car ownership and physical activity
11
http://content.tfl.gov.uk/healthy-streets-for-london.pdf
12
https://www.sustrans.org.uk/campaigns/our-manifesto-for-london-2021
Rethinking London’s Red Routes: From red to green 10Air pollution on the Red Routes
Air pollution across London is harming people’s health. An estimated 4,000 deaths in London
were attributable to toxic air in 2019,13 and many more people continue to suffer from daily
impacts of lung and heart disease. Taking a closer look at the major roads, exposure to air
pollution from living near these busy roads, like the Red Routes, is estimated to stunt lung
growth in children and to increase the risk of heart attack.14
Ruth Fitzharris, a London mother of a young son, has felt these dangerous impacts first-hand.
In the past few years her son had 12 asthma attacks, two of them life-threatening. Ruth says she
was informed by the head of a severe asthmatic clinic that air pollution was a significant
contributory factor to her son’s condition. Additionally, her consultant pediatrician with
specialism in respiratory medicine advised her to avoid main roads when possible.
Channeling large volumes of vehicles, especially diesel, through the Red Routes every day means
these roads are likely to be some of the last areas in the UK to meet air quality thresholds as
recommended by the World Health Organization. It is also a legal matter. In March 2021, the
Court of Justice of the EU ruled that the UK has persistently broken legal limits on air pollution
for a decade.15 Levels of NO2 were illegally high in 75% of towns and cities, including along the
Red Routes in London.16 Hanger Lane, Brixton Road and Marylebone Road are all examples of
Red Routes that recorded unsafe and illegal levels of NO2 in 2019 and 2020.17
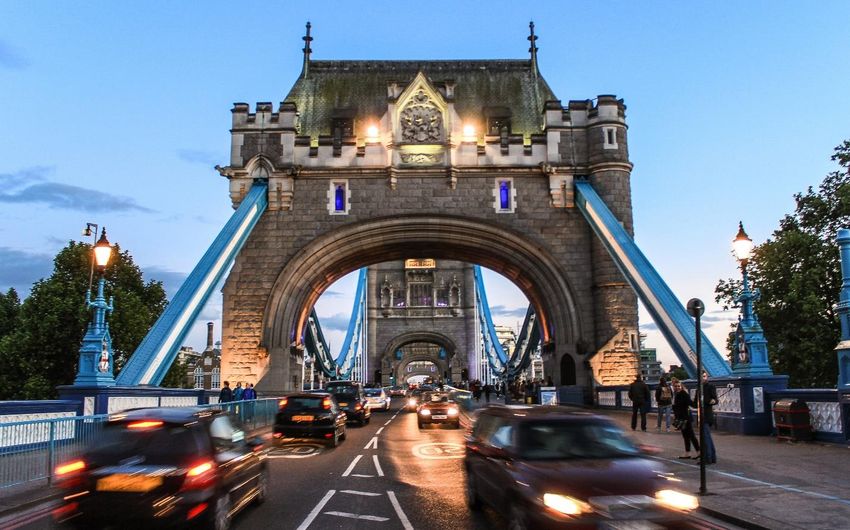
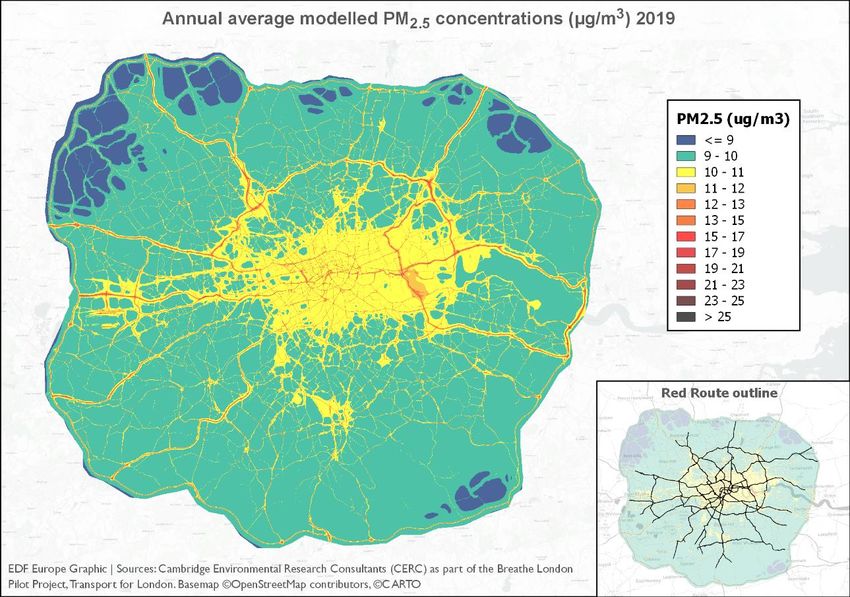
These roads clearly stand out when London’s NO2 and PM2.5 air pollution is modelled and
mapped (see Figures 7 and 8).
The Red Routes contribute to the unequal health burden of air pollution in London. Recent
analysis shows that Londoners living and working on or near Red Routes are exposed to higher
levels of air pollution – and therefore greater health risks – than people on quieter roads.
Analysis of modelled pollution levels produced by Cambridge Environmental Research
Consultants as part of the Breathe London pilot project found that on average, Red Routes have
57% more NO2 and 35% more PM2.5 pollution than an average road in London (see Figures 9
and 10).18
13
http://erg.ic.ac.uk/research/home/resources/ERG_ImperialCollegeLondon_HIA_AQ_LDN_11012021.pdf
14
https://www.kcl.ac.uk/news/living-near-a-busy-road-can-stunt-childrens-lung-growth
15
https://www.clientearth.org/latest/press-office/press/top-court-confirms-uk-has-broken-air-pollution-law/
16
https://www.clientearth.org/latest/press-office/press/new-data-shows-75-of-uk-zones-illegally-polluted-don-t-
pause-action-now-say-lawyers/
17
https://londonair.org.uk/LondonAir/Default.aspx
18
https://www.globalcleanair.org/edf-europe-methods-rethinking-the-red-routes/
Rethinking London’s Red Routes: From red to green 11Figure 8 A map of modelled NO2 pollution concentrations across London
Figure 9 A map of modelled PM2.5 pollution concentrations across London
Rethinking London’s Red Routes: From red to green 12Figure 10 A chart depicting average NO2 pollution levels by road type
Figure 11 A chart depicting average PM2.5 pollution levels by road type
The impact is felt amongst the most vulnerable populations:19
• Children at primary schools near a Red Route are exposed to 17% higher levels of
NO2 and 5% higher PM2.5 than primary schools not near Red Routes. And nearly all
primary schools in areas exceeding legal limits are on or near a Red Route.
• Patients in hospitals near a Red Route are exposed to 32% higher levels of NO 2 and
7% higher PM2.5 than hospitals not near Red Routes.
• Residents of care homes near a Red Route are exposed to 22% higher levels of NO 2
and 12% higher PM2.5 than care homes not near Red Routes.
Whilst levels of air pollution have fallen over the past few years, the Red Routes policy means
there will continue to be large differences in the amount of air pollution – and therefore health
inequities – that people experience in the city. It is also important to note that the World Health
Organization has said that there are no safe levels of PM2.5 air pollution.
19
https://www.globalcleanair.org/edf-europe-methods-rethinking-the-red-routes/
Rethinking London’s Red Routes: From red to green 13Linking air pollution with other environmental stressors
Air pollution is one of the most insidious environmental stressors facing modern urban life.
Air pollution affects our health through two biological pathways. The first affects the function of
our organs directly. Air pollution comes into our body through our inhalation, then it travels
from our lungs to our cardiovascular system, which then moves the particles into the
bloodstream. Through the bloodstream air pollution particles travel to all of our tissues,
affecting the function of every single organ.
The second pathway is systemic, as a person inhales pollution particles, first contact sets off a
biological relay of stress responses to adapt and heal the body from the stressor. This process is
called allostasis – over time and with continual exposure, a person will begin to experience a
“wear and tear” or allostatic overload. This load on the body causes dysregulation to various
biological systems, which in turn is one of the main pathologies to disease, such as diabetes,
obesity and depression.
Air pollution also affects the body directly. Particles circulate to every organ and blood stream,
meaning they can affect every single biological system in the body. As a result, air pollution is
linked to almost every major disease including cancer, dementia and Parkinson’s.
The health impacts of air pollution are multifactorial and systemic. A person’s proximity to
pollution sources is instrumental to their levels of physiological exposure. However, there are
intervening social and behavioural stressors that must also be considered to understand the true
extent of its impact.
Sources of air pollution Social and behavioural stressors
• Road material, quality and design • Feeling physiologically and
• Vehicle traffic physically safe
• Domestic woodburning • Caretaking duties
• Heating and cooling systems • Legibility and wayfinding
• Construction • Mental illness
• Industrial plants • Mobility differences
• Aviation and river vessels • Socio-economic differences
• Agriculture • Time poverty
• Lack of green space
Rethinking London’s Red Routes: From red to green 14The combination of the level of exposure to air pollution and a person’s lived experience often
leads to the greatest health inequities. This is a particular concern for the Red Routes network
given the high levels of air pollution and the hostile environment caused by vehicle traffic, such
as perceived road danger and finding it difficult to hold a conversation.
For example, levels of noise pollution from major road sources including the Red Routes are
high, which is often overlooked despite causing psychological and physiological distress (see
Figure 11). Guidelines developed by the World Health Organization strongly recommend
reducing noise levels produced by road traffic below 53 decibels LDEN, as road traffic noise above
this level is associated with adverse health effects.20
Figure 12 A map of modelled noise pollution concentrations across London
20
https://www.euro.who.int/__data/assets/pdf_file/0008/383921/noise-guidelines-eng.pdf
Rethinking London’s Red Routes: From red to green 15A health assessment of the Red Routes
An initial health assessment of London’s Red Routes was undertaken by Centric Lab so
authorities can begin to understand the health burden experienced by people living on the Red
Routes network. The outcome of this work and data analysis is intended to provide a snapshot of
the lived experience along these roads and to inform future policy thinking.
The health assessment acknowledges three key factors:
1. Although they are strategic roads, Red Routes are also residential streets with
communities who live there.
2. It is essential to acknowledge the communities that reside on Red Routes,
understand their lived experience and platform their concerns.
3. It is essential to go beyond single datasets; identifying the different experiences,
compounding stressors and other drivers beyond traffic pollution that are affecting
people’s health.
The objective was to gain the clearest and most inclusive representation of the lived experience
along the Red Routes. Centric Lab used a matrix method21 rather than a scoring system (i.e.
from best to worst) to create flexibility and accuracy. The matrix allows users to look at
‘scenarios’ to showcase the range of inequalities that can put people at risk of poor health
outcomes.
Seeing the city as one macrocosm can lead to blanket one-size-fits-all policies, such as when the
Red Routes were introduced, which may not reflect the variability of the lived experience, nor
the local context. The difference between the North and South Circular roads is a case in point.
The matrix provides an in-depth and nuanced lens to make more informed decisions and policy
recommendations.
Using multiple factors helps to build a wide picture of different experiences on the Red Routes.
These various filters (data points) were identified as being the most relevant to health and
inequity determinants.
Looking beyond air pollution data is important because air pollution is highly prevalent across
the network and therefore not as useful of a discriminating factor. The following datasets were
used to inform the assessment:
21
https://www.edf.org/content/edf-europe-centric-lab-health-assessment-matrix
Rethinking London’s Red Routes: From red to green 16• Index of Multiple Deprivation (IMD) – a measure that incorporates a broad range of
living conditions, including income, health, and access to resources
• Street Risk Score (SRS) – a measure that looks at air, light, noise and thermal
conditions
• Population (elderly / young)
• Public Transport Accessibility Levels (PTAL) – a measure that considers accessibility
to the public transport network from any point in London, considering both walk
access time and service availability
• Population density
• Proportion of Black, Asian and Minority Ethnic residents
• Car ownership levels
The assessment recognised the way people use roads and vehicles is driven by social and
behavioural stressors, like those listed earlier. More detail on the can be found in Appendix 3.
Health impact scenarios
Users of the data matrix can create different ‘scenarios’ to understand the different types of
health impacts and inequities occurring on the Red Routes. A summary of the scenarios and
datasets can be found in Appendix 1.
For this health assessment, Centric Lab adopted a data-led approach to identify five scenarios
with priority segments of the network requiring intervention. Looking at Google Streetview, the
built environment on these segments has hardly changed at all over the past decade:
Neurodiversity
The A12 between Poplar and Bromley By Bow (segment RR12) was identified to be especially
challenging for people in the neurodiversity community, which can include being on the autism
spectrum, dyslexia, tourettes and dyspraxia.
This community is made vulnerable through complex, disorganised, noisy environments as
experienced in very dense places. In turn this can drive people in the neurodiversity community
indoors, which takes away their agency and ability to find a job, as well as increases loneliness.
Rethinking London’s Red Routes: From red to green 172008 2020
Dataset: Population density x Stress Risk Score x IMD
Mobility equity
The assessment identified A312 between Northolt and Cranford (RR82) as lacking in mobility
equity, where it is difficult for people to be able to get around in a safe and healthy way.
This scenario considers how mobility exposes people to stressors. For example, long commutes
to work can lead to greater exposure to air pollution. The longer a person must wait for public
transport can elongate exposure and stress.
Poor transport links can also pose a physical and psychological hazard to those in marginalised
communities such as transgender people, Muslim women, young people, parents and the
elderly. This hazard can be categorised as a psychosocial stressor.
2012 2020
Dataset: Level of public transport accessibility x Stress Risk Score x IMD
Susceptibility
This scenario looks at people who are most at risk of poor health outcomes. The assessment
identified A3220 between Chelsea and Pimlico (RR113) to be particularly problematic for the
dense population of elderly people living nearby. The elderly are vulnerable owing to their
systems having far less capacity to adapt to environmental stressors, which can be exacerbated
by comorbidities such as dementia, Parkinson’s or cardiovascular problems. The elderly may
Rethinking London’s Red Routes: From red to green 18also walk slower and feel safer on busier roads where more people are visible, which exposes
them to environmental stressors for longer, including air pollution.
2008 2020
The assessment identified A13 between Whitechapel and Limehouse (RR7) as particularly
problematic for the population density of children living nearby. Children’s systems are in early
development alongside air pollution exposure, which means allostatic load can set in at a very
early age. In turn this leaves a person susceptible to poor health outcomes at a later stage in life.
2008 2020
Dataset: Population density of age groups (0 – 15 and 65+) x Stress Risk Score x IMD
Race-based inequity
This scenario seeks to highlight how Black, Asian and minority ethnic communities are
marginalised and to ensure that the impacts of structural racism are considered in decision
making. The assessment identified A13 between Limehouse and Poplar (RR9) as an area for
priority intervention.
Rethinking London’s Red Routes: From red to green 192008 2020
Dataset: Proportion of Black, Asian and minority ethnic residents x Stress Risk Score x IMD
Car ownership
This scenario looked at the relationship between car ownership, environmental stressors and
deprivation, which is relevant to ensuring equitable mobility. The assessment results for this
scenario were not as linear as others; however, there was a clear narrative where areas of high
deprivation and high environmental stressors have significantly lower than average car
ownership. The reverse is also shown. This points to how those who own cars are often not the
people dealing with the impacts of air pollution and environmental stressors.
The assessment identified A3 between Elephant and Castle and Kennington (RR108) as an area
for priority intervention.
2008 2020
Dataset: Index of Multiple Deprivation x Stress Risk Score x Car ownership levels
Understanding the lived experience
To provide a more lived-experience lens, the health assessment includes three day-in-the-life
personas that are presented at the end of the whitepaper. These personas are intended to help
decision makers understand the multifactorial impact of the Red Routes on different
communities.
Rethinking London’s Red Routes: From red to green 20Time for change
Prioritising roads and traffic over space for people and other modes of transport has a long
history in the UK. Even today, the Government has set aside a controversial fund of £27 billion
for building new road capacity or enhancing existing road schemes, and the Mayor of London is
progressing the controversial Silvertown Tunnel under the Thames.
As the 30th anniversary of the Red Routes policy approaches, the decision to prioritise traffic
flow in London now seems shortsighted and outdated. At the time, policymakers failed to
explore more ambitious scenarios that could have created a healthy way for people to live in and
move around the city for generations to come.
There is a malaise in London that nothing can be done to transform these roads for the better.
And to put matters in more urgent terms, this year the city is entering the rehabilitation stage of
the pandemic, especially for those experiencing long COVID-19. These individuals will require
the support of healthy habitats to shorten recovery time and lessen the symptomology. In a
similar vein, local businesses impacted by the pandemic restrictions and blighted by the Red
Routes will need more support than ever to invite customers.
This initial health assessment of the Red Routes network has presented scenarios of a damaging
interaction between environmental stressors and high levels of air pollution, supporting the
need to act and adopt a 21st century approach to these roads. Maintaining the status quo does a
disservice to the health of all Londoners and especially those that live, work and go to school by
these roads.
Rethinking London’s Red Routes: From red to green 21London also needs much firmer action to decarbonise these roads if it is to achieve its climate
goals. Vehicle trips on the Red Routes are also estimated to account for nearly a third of all the
capital’s CO2 emissions from road transport.22
Transforming the Red Routes will not suit a one-size-fits-all approach and must form part of a
green recovery that undoes decades of damage. A clear traffic reduction plan is necessary – one
in which polluting lorries can no longer cut across the city and parking for cars becomes parks
for people.
A framework for action was started in 2012, when the previous Mayor of London established an
industry-wide Roads Task Force to adopt new approaches to London’s road network.23 The Task
Force:
• Reported on the need to deliver ‘more people-focused, inclusive places’ and to
‘transform conditions for more sustainable modes of transport;’
• Required ‘a truly transformative change’, with ‘at least £30bn of investment over the
next 20 years or so;’ and
• Gave specific regard to London needing a plan for the Inner Ring Road (e.g., Euston
Road) to be ‘developed as a matter of urgency.’
Ten years on, it is difficult to see how much of this ambition has been taken forward.
Policy considerations
Rethinking the Red Routes will require:
• Introducing short-term changes to improve health of those living, working and going to
school on Red Routes, such as more greenery, sustainable drainage and climate
resilience, converting car parking into more walkway or parklets, and potentially
pollution or noise barriers as a temporary mitigation.
• Prioritising healthier alternatives to the car by delivering safer walking and cycling
infrastructure across the network, reducing speed limits, better public transport
connectivity and bus priority (including 24 hour bus lanes as default). The London
22
https://www.globalcleanair.org/edf-europe-methods-rethinking-the-red-routes/
23
https://tfl.gov.uk/corporate/publications-and-reports/roads-task-force
Rethinking London’s Red Routes: From red to green 22Assembly recently found that 261 signalised junctions in London only have signals for
motor traffic, and not for people to cross roads; many of these were on Red Routes.24
• Reevaluating the size of the network, especially in central London to ensure it remains
globally competative, where there is potential to reallocate more space for people and to
‘deprioritise’ motor traffic, such as happened in Trafalgar Square. See Appendix 2 for an
example along the Seine in Paris.
• Prioritising cleaner and quieter vehicles, including rolling out zero-emission buses where
they are needed most urgently to protect health.
• Implementing new approaches for freight and ensuring industry works closer together.
This may include a better use of strategic industrial land to consolidate deliveries,
helping to support more cargo bikes and electric deliveries, and measures that limit
movements at certain hours to reclaim road space only used at peak times.
• Helping to broaden the base of London’s commercial activities, which are currently
highly centralised and often contribute to a large proportion of traffic being driven
through Inner London neighbourhoods.
• Creating a longer-term vision to transform the most archaic sections of the network,
especially the most destructive infrastructure like flyovers through town centres, as seen
in Hammersmith. See Appendix 2 for an example in Seoul, which removed a city centre
flyover.
• Establishing new funding streams to pay to maintain and transform the Red Routes,
including developing a fairer road pricing system. TfL currently allocates revenue from
public transport to help maintain and upgrade the Red Routes network25 that could be
otherwise spent on improving public transport accessibility, walking and cycling. A
particular challenge is that London does not benefit from any of the £500 million vehicle
excise duty paid by Londoners, which the Government allocates to road improvements
elsewhere in England.26
• Reestablishing and/or reforming the Roads Task Force with specific traffic and pollution
reduction targets for the Red Routes and to determine which policy changes at which
levels are necessary to achieve targets. This may also require a review on the purpose of
24
https://www.london.gov.uk/press-releases/assembly/all-junction-crossings-must-be-safe
25
http://content.tfl.gov.uk/tfl-business-plan-2019-24.pdf
26
https://www.london.gov.uk/press-releases/mayoral/mayor-ministers-must-play-fair-by-london
Rethinking London’s Red Routes: From red to green 23London’s main roads, and who should control them (e.g., the discussion following the
Royal Borough of Kensington and Chelsea’s decision to remove a pop-up cycle lane).
Further research
In order to meet health and equitable mobility needs for Londoners, further research is needed.
What are the lived experience factors that contribute to car use? The lived experience is often
not reflected in the conversation about car use. It is important to identify the factors that
contribute to a person’s perceived need for a car, which could include poor transport links, shift
work, mobility challenges, weather or various levels of convenience. What are the most effective
equitable mobility infrastructural affordances needed to reduce air pollution?
In order for people to actively engage with the urban realm, they have to be given the
affordances. If the city wants people to walk, pavements and crossing need to be equipped to
safely and comfortably accommodate more foot traffic. A multifactorial approach is needed,
which requires research into what are the most effective factors that will afford people the ability
to use active transport.
Identifying air pollution as a hazard
This is the next step in the legal and policy side of air pollution. There are no safe levels of air
pollution and in many cases even a reduction in overall air pollution (average) does not have the
desired health effect. Therefore, we need to define air pollution as a hazard to health, not a risk
to health. This is analogous to asbestos, which were legally deemed a hazard, meaning that the
construction industry can no longer construct with this material. Labeling air pollution a hazard
would make a difference in current policy and set a new mental understanding of the danger air
pollution presents to people and the environment.
Road analysis
A detailed analysis into road quality, materiality, greening, lights, traffic distribution, and
scheduling should be considered to ensure that Red Routes are operating with more efficiency –
reducing traffic and noise. There are multiple factors that contribute to traffic not just quantity
of cars.
London must start this conversation now. Unless leaders at every level, including this
Government, quickly work together to adopt a bold vision for the Red Routes, the capital is at
risk of being left behind in a global movement to transform polluted roads to improve people’s
health and protect the climate.
Rethinking London’s Red Routes: From red to green 24Appendix 1: Summary of health impact scenarios
Health impact Description Dataset Priority Red
scenario Routes segment
for intervention
Neurodiversity This scenario looks at people who may be in the neurodiverse Population Between Poplar
community. This can include being on the autism spectrum, density and Bromley-by-
dyslexia, tourettes, to dyspraxia. This community is made Bow
vulnerable through complex, disorganised, noisy SRS (RR12)
environments as experienced in very dense places. In turn
this can drive them indoors, which takes away their agency, IMD
ability to find a job, and increase loneliness.
Mobility equity This scenario looks at how easy it is for people to be able to Level of public Between
get around in a safe and healthy way. It considers how transport Northolt and
mobility exposes people to stressors. For example, long accessibility Cranford
commutes to work can lead to greater exposure to air (RR82)
pollution. The longer a person must wait for public transport SRS
can elongate stress.
IMD
Poor transport links can also pose a physical and
psychological hazard to those in marginalised communities
such as transgender people, Muslim women, young people,
parents and the elderly. This hazard can be categorised as a
psychosocial stressor.
Susceptibility This scenario looks at people who are most at risk of poor Population For children:
health outcomes. density of age
groups (0 – 15 Between
The elderly are vulnerable owing to their systems having far and 65+) Whitechapel and
less capacity to adapt to environmental stressors. This is Limehouse
exacerbated by comorbidities such as dementia, Parkinson’s SRS (RR7)
or cardiovascular problems. The elderly may also walk slower
and feel safer on busier roads, which exposes them to IMD For elderly:
environmental stressors for longer, including air pollution.
Between Chelsea
For children, their systems are in early development and Pimlico
alongside air pollution exposure, which means allostatic load (RR113)
can set in at a very early age. In turn this leaves a person
susceptible to poor health outcomes at a later stage in life.
Race-based This scenario seeks to highlight how Black, Asian and Proportion of Between
inequity minority ethnic communities are marginalised and to ensure Black, Asian Limehouse and
that the impacts of structural racism are considered in and minority Poplar
decision making. ethnic (RR9)
residents
SRS
IMD
Car ownership This scenario looks at the relationship between car Stress Risk Between
ownership, environmental stressors and deprivation. This is Score Elephant and
relevant to ensuring equitable mobility. The assessment Castle and
results for this scenario were not as linear as others, however, Car ownership Kennington
there is a clear narrative where areas of high deprivation and levels (RR108)
high environmental stressors have significantly lower than
average car ownership. The reverse is also shown. This points IMD
to how those creating the stressors are often not those dealing
with the impacts.
Rethinking London’s Red Routes: From red to green 25Appendix 2: Examples in other global cities
In 2016, the Mayor of Paris declared ‘the end of the urban motorway’ in the city and introduced
a scheme along the River Seine that restricted access to motor traffic. Photo source.
The Poblenou Superblock in Barcelona began a programme of work in the past few years to
reclaim roadspace in the city that helps to either limit or slow down motor traffic. Photo source.
Rethinking London’s Red Routes: From red to green 26In Madrid, a busy road was tunneled underground and opened in 2015 to create ten kilometres
of long parkland area connecting people to the river. Photo source.
Around 15 years ago the Mayor of Seoul partly demolished an elevated road to restore a stream
running through the city and elsewhere being turned into a skygarden. Photo sources.
Rethinking London’s Red Routes: From red to green 27Appendix 3: How to use the data matrix
The data matrix is available for download here.
The matrix can be used to create different “scenarios” to understand various types of inequities
that are occurring on the Red Routes. Within each scenario, there is a rating for comparative
reasons.
In the identification of the different scenarios, the matrix can be used to make decisions around
areas to prioritise in relation to specific challenges. Seeing the city as one macrocosm can often
lead to blanket one-size-fits-all policies, which may not reflect the variability of the lived
experience.
The goal of this work is to provide an in-depth and more nuanced lens to make more informed
decisions and policy recommendations.
LIMITATIONS
1. It is important to state that there are always limitations when using data. Data is not a
substitute to actual lived experience and if there was a need for more nuanced information, it
would be our recommendation to follow up this work with a survey.
2. Technically all areas on Red Routes are priority and it is recommended that within ten years
they become significantly healthier and safer.
3. References to priority means prioritising specific health needs for specific communities along
the Red Routes based on the recommended scenarios.
ETHICS OF USE
1. It is important for this work to comply within an antiracist/ classist framework. This means
acknowledging the intersection between structural racism, poverty and health within urban
environments.
2. The matrix format can only be used within the context of Red Routes and its health
implications. It cannot be used in the context of any other assessment.
Rethinking London’s Red Routes: From red to green 28You can also read