WMO AIR QUALITY AND CLIMATE BULLETIN - GLOBAL ATMOSPHERE WATCH - World ...
←
→
Page content transcription
If your browser does not render page correctly, please read the page content below
WEATHER CLIMATE           WATER

                                                                        GLOBAL
                                                                        ATMOSPHERE
                                                                        WATCH
                                                                                                                     No. 1 – SEPTEMBER 2021

WMO AIR QUALITY AND
     CLIMATE BULLETIN
Introduction                                                                    gas emissions will also reduce air pollutants associated
                                                                                with that activity, such as ozone and nitrate aerosols.
Ongoing climate change, caused by the accumulation of                           Policies to reduce particulate matter pollution to protect
greenhouse gases in the atmosphere, is happening on                             human health may remove the cooling effect of sulfate
a timescale of decades to centuries and is driving envi-                        aerosols or the warming effect of black carbon (soot
ronmental changes worldwide. In contrast, the impacts                           particles). Finally, changes in climate can influence
of air pollution occur near the surface, on timescales of                       pollution levels directly. For example, the increased
days to weeks, and across spatial scales that range from                        frequency and intensity of heatwaves may lead to the
local (for example, urban centres, see the photo below)                         additional accumulation of pollutants close to the surface.
to regional. Despite these wide-ranging differences, air
quality and climate change are strongly interconnected
(Fiore et al., 2012; West et al., 2013; IPCC, 2021). The new
WMO Air Quality and Climate Bulletin will report annually
on the state of air quality and its connections to climate
change, reflecting on the geographical distribution of
and changes in traditional pollutants.

Traditional pollutants include short-lived reactive gases
such as ozone – a trace gas that is both a common
air pollutant and a greenhouse gas that warms the
atmosphere – and particulate matter – a wide range of
tiny particles suspended in the atmosphere (commonly
referred to as aerosols), which are detrimental to human
health and whose complex characteristics can either
cool or warm the atmosphere.

Air quality and climate are interconnected because the
chemical species that affect both are linked, and because
changes in one inevitably cause changes in the other.
Human activities that release long-lived greenhouse
gases into the atmosphere also enhance the concen-
trations of shorter-lived ozone and particulate matter in
the atmosphere. For example, the combustion of fossil
fuels (a major source of carbon dioxide (CO2)) also emits
nitrogen oxide (NO) into the atmosphere, which can lead
to the photochemical formation1 of ozone and nitrate
aerosols. Similarly, agricultural activities (which are major
sources of the greenhouse gas methane) emit ammonia,
which then forms ammonium aerosols (Pye et al., 2009).

Policy changes that seek to improve air quality thus
have repercussions on those policies that seek to limit                         Combo shows the India Gate war memorial on October 17, 2019 (top)
climate change, and vice versa. For instance, a drastic                         and after air pollution levels started to drop during a 21-day nationwide
reduction in fossil fuel combustion to reduce greenhouse                        lockdown in New Delhi, India, April 8, 2020 (bottom). Improvement in air
                                                                                quality can be driven by many processes, including emission reduction
1   Photochemical formation is a chemical reaction in which a molecule is       and changes in meteorological conditions as explained in this Bulletin.
    formed in the presence of light.                                            Source: Reuters/Anushree Fadnavis/Adnan Abidi

                                                                            1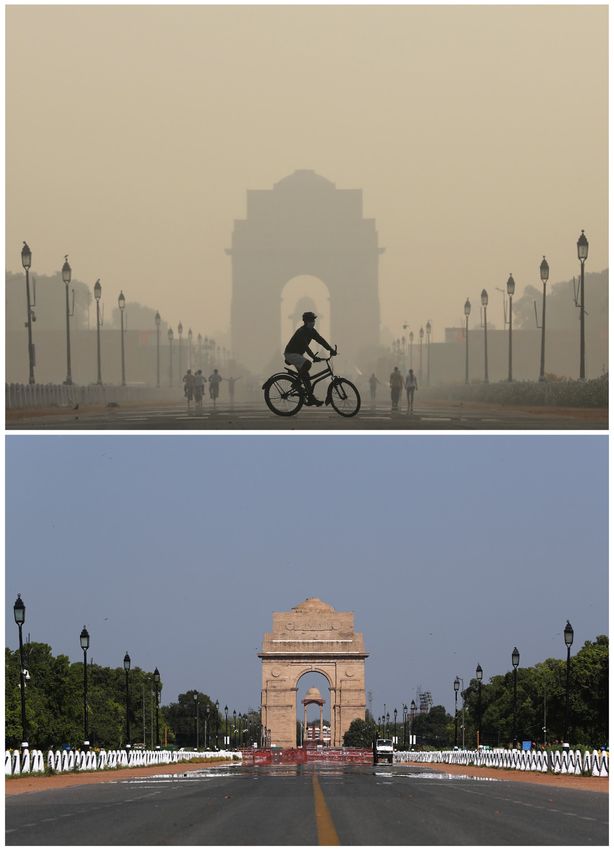
This issue of the WMO Air Quality and Climate Bulletin                                   Weaker-than-usual dust emissions also occurred in the
provides an update on the current global distribution                                    desert regions of northern China and Mongolia. For
of particulate matter, highlighting the contributions of                                 details, please refer to the WMO Airborne Dust Bulletin.
extreme wildfire events in the year 2020. 2020 was also
notable for the spread of a new coronavirus (SARS-CoV-2),                                Aerosols originating from human activity have the largest
which causes the respiratory illness known as COVID-19.                                  impact on human health because they contribute most
The ensuing COVID-19 pandemic triggered a worldwide                                      to PM2.5 in highly populated areas. In 2020, there was an
economic downturn in 2020, which led to reduction                                        unprecedented reduction in certain human activities, such
of the emissions of air pollutants, yielding a range of                                  as vehicle transport and aviation, due to the economic
impacts on surface and free tropospheric 2 levels of                                     downturn associated with the COVID-19 pandemic. In ar-
ozone and particulate matter (Gkatzelis et al., 2021;                                    eas such as China, Europe and North America, short-term
Steinbrecht et al., 2021). This Bulletin reviews many                                    COVID-related reductions in emissions coincided with
new and important scientific findings on the impact                                      long-term emission-mitigation measures that led to lower
of COVID-19 on air quality around the world, based on                                    PM2.5 concentrations in 2020 compared to previous years.
long-term measurements taken at certain WMO Global                                       The increase in PM2.5 over India was less pronounced than
Atmosphere Watch (GAW) stations. It ends with a recent                                   in previous years. A better understanding of the multiple
update on the global health impact of long-term exposure                                 natural and anthropogenic sources of emissions and the
to ozone and particulate matter pollution.                                               meteorological influences on emissions and on the spread
                                                                                         of the resulting pollution are critical for advancing our
                                                                                         modelling of atmospheric composition and its changes.
Global particulate matter concentrations
in 2020 recorded by the Copernicus
Atmosphere Monitoring Service                                                            CAMS methodology

Inhaling particulate matter smaller than 2.5 micrometres                                 Combining computer models with near-real-time obser-
(PM2.5) over long periods is a severe health hazard.                                     vations – a process known as data assimilation – has been
Human and natural sources contribute to PM2.5 pollution
in varying proportions at the global scale. Using the
PM2.5 data from the Copernicus Atmosphere Monitoring
Service (CAMS) re-analysis, Figure 1 shows the average
PM2.5 surface concentrations for 2003–2019 and the
anomalies (absolute differences) in 2020 compared with
the mean values for 2003–2019.

Intense wildfires generated anomalously high PM2.5
concentrations in several parts of the world that were
unusually dry and hot in 2020. In January and the preced-
ing December, southwestern Australia was affected by
widespread wildfires, which exacerbated air pollution
(see also WMO Aerosol Bulletin 2021). Smoke from the                                            –25.52     –17.02     –8.51     0.00      8.51     17.02     25.52
Australian fires also led to temporary cooling across                                                                           μg/m3
the southern hemisphere, comparable to that caused
by ash from a volcanic eruption (Fasullo et al., 2021).
Enhanced wildfire activity also occurred in the Yakutia
region of Siberia, in the US state of California and many
other regions of the western United States of America.
Regularly occurring wildfires in central South America
and central Africa were also higher than the 2003–2019
average. The lower-than-average PM2.5 concentrations
over western Canada, Indonesia and northern Australia
were caused by below-average wildfire activity in the
respective regions.

The variability of PM2.5 due to desert dust is evident                                    0.2        7.5       13.9      25.7      47.5     87.8     162.3      300.0
above large desert areas and the adjacent outflow                                                                               μg/m3
regions. While the eastern Sahara had lower surface
                                                                                         Figure 1. Anomaly (absolute difference) of the mean PM 2.5 surface
PM2.5 concentrations than usual, more frequent dust
                                                                                         concentrations (μg/m 3 ) in 2020 of the CAMS re-analysis (top panel)
transport events, including the exceptionally strong                                     compared to the average for the period 2003–2019 (bottom panel). The
Godzilla dust storm in June 2020, led to increased PM2.5                                 CAMS re-analysis assimilated aerosol optical depth (AOD) retrievals
over the North Atlantic Ocean (Chakraborty et al., 2021).                                from a Moderate Resolution Imaging Spectroradiometer (MODIS) and
                                                                                         an Advanced Along-Track Scanning Radiometer (AATSR) and used
2   The troposphere is the lowest part of the atmosphere. It begins at the Earth’s       Global Fire Assimilation System (GFAS) wildfire emissions.
    surface and reaches an altitude of 6–15 km, depending on the latitude.               Source: ECMWF/CAMS

                                                                                     2
a major factor behind advances in numerical weather
prediction in recent decades (Bauer et al., 2015). The
European Centre for Medium-Range Weather Forecasts
(ECMWF) has extended this approach to forecasts
around the globe for air quality, dust and fire plumes,
stratospheric ozone and greenhouse gases as part of
the Copernicus Atmosphere Monitoring Service, which
the Centre implements on behalf of the European Union
(Innes et al., 2019).
Computer-simulated fields corrected by observations
are known as analyses corrected by observations are
known analyses. Analyses are considered to be more
accurate than model simulations, because systematic
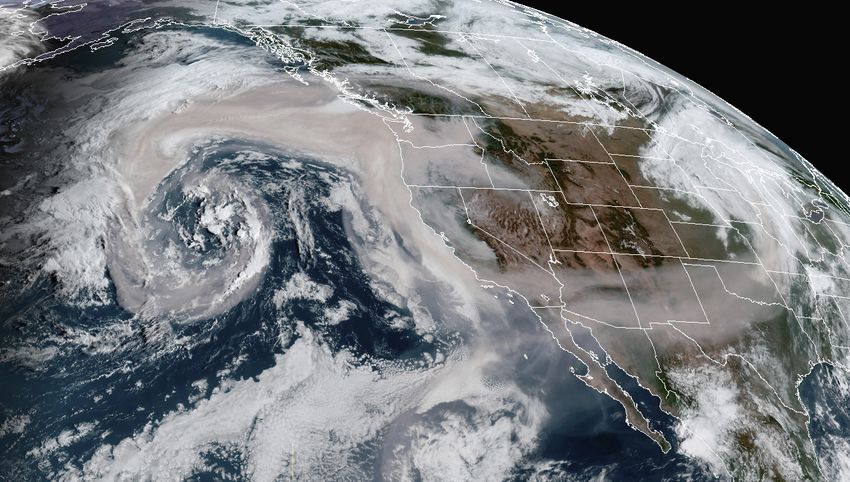
Figure 2. NOAA GOES-West satellite image taken on 12 September
corrections based on observations from satellites,
2020, showing the entrainment of an unusually large and dense smoke
ground stations, aircraft and weather balloons ensure
plume from wildfires in the Pacific Northwest into a mid-latitude cyclone
more comprehensive coverage than observational data above the eastern North Pacific Ocean, and a second plume extending
sets alone (“maps with no gaps”). The analyses are used from the Desert Southwest into another mid-latitude cyclone above
as initial conditions for the daily CAMS forecasts and the upper Midwest. This image was generated by the Colorado State
for the retrospective study of atmospheric composition Satellite Loop Interactive Data Explorer in Real-time (SLIDER; http://
for understanding the spatial distribution, trends and rammb-slider.cira.colostate.edu, Micke, 2018).
variability of trace gases and aerosols. Source: CSU/CIRA and NOAA/NESDIS
Fire Weather Index (FWI) Anomaly
Interplay between climate, fires and
air quality in 2020 15
To acquire a better understanding of how anthropo- 10
genic and natural emissions influence weather and
air pollution, scientists at the NASA Global Modeling 5
and Assimilation Office (https://gmao.gsfc.nasa.gov)
combine a rich set of data sources with numerical models 0
that represent physical and chemical processes occur-
–5
ring in the atmosphere. Models such as the Goddard
Earth Observing System (GEOS) (Gelaro et al., 2017; –10
Randles et al., 2017; Buchard et al., 2017; Keller et al.,
2021; Molod et al., 2015) are powerful tools that can be –15
used to complement sparse observational networks and
create a comprehensive digital record of events such June - September
as the intense wildfire season in 2020.
Fine particulate matter (PM2.5)
The Global Modeling and Assimilation Office used
satellite retrievals of fire locations and intensity to analyse 150
wildfires in the extratropical regions of Eurasia and North
100
America in 2020. The 2020 wildfire season was marked
70
by extreme fires in Siberia and the western United States
and uncharacteristically weak fire activity in Alaska and 48
Canada, compared with the situation in previous decades. 33
Comparisons with estimates of historical fire emissions 23
(2003–2019) indicated that 2020 was an exceptional 16
year in terms of total pyrogenic carbon released into 11
the atmosphere by wildfires in Siberia and the western
7
United States, with extremely dense and expansive
5
smoke plumes visible from space (Figure 2). The Fire
Weather Index(FWI; Wagner, 1987), a commonly used μg/m3
measure of fire intensity and potential, provided further
insights into the anomalous fire season by quantifying Figure 3. Top: Map of Fire Weather Index seasonal anomalies (2020 minus
how much influence key meteorological parameters the mean of 2003–2019 for the period June–September). The higher
such as temperature, wind, precipitation and humidity the positive anomaly, the greater the increased fire potential;
had on fire danger. The GEOS-based MERRA-2 analysis the lower the negative anomaly, the greater the reduced fire potential;
(Gelaro et al., 2017) was used to create a map that shows a bottom: Map of estimated fine particulate matter (PM 2.5 ) from fires on
substantially higher FWI in Siberia and the western United 13 September 2020, corresponding to the smoke plumes visible in Figure 2.
States, collocated with the observed fires (Figure 3). Source: NASA
3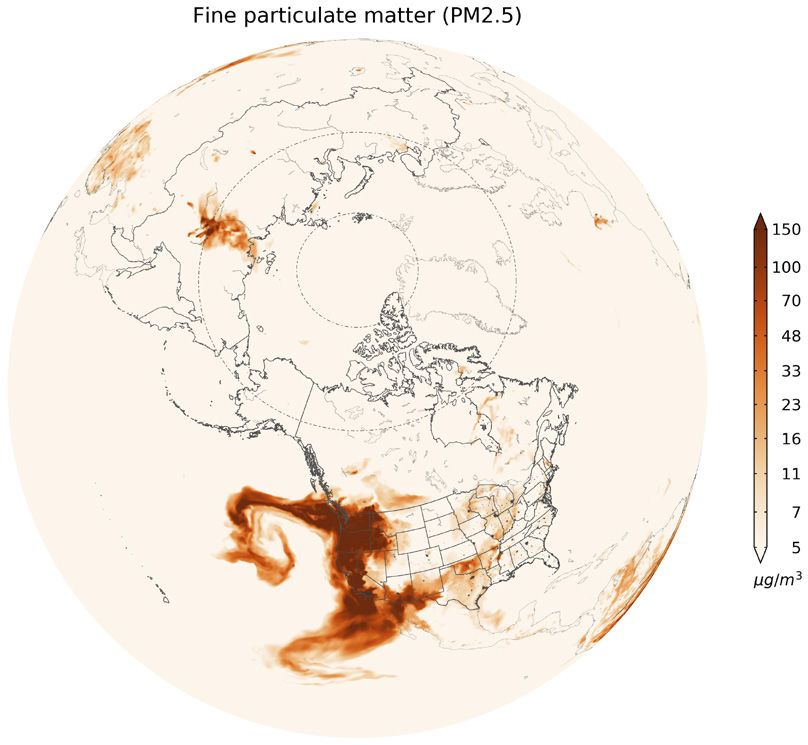
500

                                                                                                                   Health risk
                                                                                                                   Very high
                                   400
                                                                                                                      High
                                                                                                                   Moderate
          Population in millions

                                                                                                                      Low
                                   300

                                   200

                                   100                              Uncharacteristically intense wildfires
                                               Increased air pollution and health risk

                                     0

                                         Aug                  Sep                                 Oct                             Nov

Figure 4. Air Quality and Health Index levels for people in North America during the 2020 wildfire season, based on air pollution caused by
anthropogenic and natural sources.
Source: The Global Modeling and Assimilation Office, NASA

The strong relationship between negative departures                                The impact of COVID-19 on air quality
from the FWI climatology and reduced potential for fires
was also evident in Canada and Alaska. The behaviour                               Many governments around the world responded to the
of the fires in the major burning regions in the northern                          COVID-19 pandemic by restricting gatherings, closing
hemisphere extratropics can therefore be at least partly                           schools and imposing lockdowns. These stay-at-home
attributed to persistent weather patterns in the boreal                            policies led to an unprecedented decrease in pollutant
summer of 2020, for example, a historic high-latitude                              emissions. A study coordinated by the WMO/GAW
heatwave in Siberia.                                                               examined the behaviour of key air-pollutant species
                                                                                   during the COVID-19 pandemic (Sokhi et al., 2021).
These conclusions are concerning because they may
reflect a strengthening signal of changing climate on                              Using a consistent approach, the study looked at the
weather-induced mechanisms that alter fire behaviour                               data from in situ ground-based air-quality observations
and pollutant emissions on large scales. Several publi-                            from over 540 traffic, background and rural stations, in
cations have pointed out that extreme heatwaves and                                and around 63 cities from 25 countries located in seven
dry spells are projected to be exacerbated by climate                              geographical regions of the world. The data were used
change (IPCC, 2021); one study concluded that the                                  to analyse changes in air quality for the main pollutants,
prolonged Siberian heatwave of 2020 would have been                                such as particulate matter (PM2.5, PM10, coarse fraction
almost impossible without human influence (Ciavarella                              of PM) sulfur dioxide (SO 2), nitrogen oxides (NO x ),
et al., 2021).                                                                     carbon monoxide (CO) and ozone (O3), as well as for the
                                                                                   total gaseous oxidant 3 (OX = NO2 + O3). The changes
To assess the impact of the fires on outdoor air pollu-                            were examined for different lockdown stages, namely
tion across North America, the Global Modeling and                                 pre-lockdown, partial lockdown, full lockdown and two
Assimilation Office estimated how many people were                                 periods of relaxed restrictions between January and
exposed to varying levels of pollutants (Stieb et al., 2008).                      September 2020. The observational study investigated
Using data from the multi-pollutant Air Quality and                                how changes in air quality were affected by emissions
Health Index, the Office found that the number of people                           and regional and local meteorology in 2020 compared
who likely experienced unhealthy levels of air pollution                           with the period 2015–2019.
increased during the fire season and peaked in the second
week of September, when most of the intense fires                                  During the various lockdown stages, emissions of air
occurred in the western United States. For more than a                             pollutants fell drastically across the globe due to travel
week, 20–50 million people – mostly in the western United
States but also in regions downwind – were classified                              3   An oxidant is a chemical substance that can oxidize other substances,
as having a “High” or “Very High” health risk (Figure 4).                              which means it can accept the electrons of other substances.

                                                                               4
a)     PM2.5       b)        PM10           c)        PMC         d)        NO2           e)        O3           f)        CO           g)        SO2

           Africa
        Asia-East
      Asia-South
        Australia
          Europe
   North America
   South America

    South Africa
           China
    South Korea
            India
        Australia
          Cyprus
           Spain
          Greece
             Italy
       Germany
          France
     Netherlands
        England
          Russia
         Estonia
         Sweden
         Finland
          Mexico
             USA
         Canada
            Chile
           Brazil
             Peru
        Ecuador
       Colombia
                  -80 -40   0   40   80 -80 -40    0     40   80 -80 -40   0   40   80 -80 -40   0     40   80 -80 -40   0    40   80 -80 -40   0    40   80 –80 –40   0     40   80
                                                                                          Change (%)

Figure 5. Continental/countrywide average changes in air pollution (in %) shown as bar plots for the full lockdown period for (a) PM 2.5 , (b) PM10 ,
(c) PMC (coarse fraction of PM), (d) NO 2 , (e) O 3 , (f) CO and (g) SO 2 .
Source: Modified from Sokhi et al., 2021

restrictions imposed to stem the spread of COVID-19.                                         at urban locations were greater than the O3 production,
A positive correlation was observed between reductions                                       whereas at background sites, OX was mostly driven by
in NO 2 and NO x concentrations and a reduction in                                           the regional contributions rather than local NO2 and
people’s mobility for most cities. No clear indication                                       O3 concentrations. SO2 concentrations were between
was observed for other pollutants, which suggests that                                       ~25% to 60% lower in 2020 than during 2015–2019
sources other than vehicle emissions also contributed                                        for all regions. CO levels were lower for all regions,
substantially to the change in air quality.                                                  with the largest decrease for South America, of up to
                                                                                             approximately 40%.
Analysis showed (Figure 5) decreases of up to approx-
imately 70% in mean NO2 and 30%–40% in mean PM2.5                                            This unplanned air-quality experiment can serve as a
concentrations during full lockdown in 2020 compared                                         benchmark for policymakers to understand whether
with the same periods in 2015–2019. PM2.5, however,                                          existing air-quality regulations would protect public health.
exhibited complex behaviour even within the same                                             While lockdowns had a clear impact on air quality in urban
region, with increases in some Spanish cities, for                                           areas, the spatial and temporal extent of that impact, the
instance, which were attributed mainly to the long-                                          specific role of meteorology and of episodic contributions
range transport of African dust and/or biomass burning.                                      (e.g. from dust, domestic and agricultural biomass burning
Some Chinese cities showed similar increases in PM2.5                                        and crop fertilization), and the cascade responses from
during the lockdown periods, probably due to secondary                                       indirect and non-linear effects are far from being fully
PM formation. Changes in ozone concentrations varied                                         understood. It is still necessary to better understand
greatly among regions, ranging from no overall change                                        changes in how secondary pollutants chemically respond
to small increases (as was the case for Europe) and larger                                   to emission changes under complex conditions and how
increases (+25% in East Asia and +30% in South America).                                     socioeconomic drivers may affect future air quality. The
Colombia showed the largest increase, at around 70%.                                         implications for regional and global policies are also
Under certain polluted conditions, an increase in ozone                                      significant, as the Sokhi et al., 2021 study indicates that,
might be expected, with decreases in its precursors,                                         in many parts of the world, PM2.5 concentrations would
due to the complexities of ozone chemistry. Analysis of                                      be unlikely to meet World Health Organization guidelines,
the total oxidant showed that primary NO2 emissions                                          despite drastic reductions in mobility.

                                                                                         5
Low ozone values observed at GAW
background stations                                                                                         80          Barrow, AK trend 1973-2020: 0.06±0.04 ppb/yr, p=0.00
                                                                                                                        Mauna Loa trend 1973-2020: 0.14±0.05 ppb/yr, p=0.00
                                                                                                            70
Figure 6 shows the long-term ozone concentration
variability at three very remote locations. North of                                                        60
the Arctic Circle, the Barrow Atmospheric Baseline

                                                                                               Ozone, ppb
Observatory on the northern shore of Alaska, shows                                                          50
ozone concentration has increased by 11% since records
                                                                                                            40
began in 1973. Ozone concentration in the tropical
North Pacific Ocean has increased by 17% since 1973, as                                                     30
observed at Mauna Loa Observatory, located at 3 400 m
above sea level on the island of Hawaii. Historical data                                                    20
from Mauna Loa show that ozone concentration has
                                                                                                            10
increased by approximately 50% since the late 1950s.
                                                                                                                        South Pole trend 1975-2020: 0.04±0.03 ppb/yr, p=0.02
At the South Pole Observatory, as far away from human                                                           0
                                                                                                                        1960 1965 1970 1975 1980 1985 1990 1995 2000 2005 2010 2015 2020
activity as possible, ozone concentration has increased
                                                                                                                                                    Year
by 6% since 1975. All three sites show a strong seasonal
cycle, but the timing of the annual maximum varies
                                                                                               Figure 6. Monthly ozone values at three GAW global background
due to differences in photochemistry and the weather                                           monitoring sites: Barrow Atmospheric Baseline Observatory, Alaska
patterns that transport ozone to these remote sites                                            (11 m elevation); Mauna Loa Observatory, Hawaii (3 397 m elevation),
(Cooper et al., 2020).                                                                         and the South Pole Observatory (2 837 m elevation). Also shown are the
                                                                                               monthly ozone values near the summit of Zugspitze (2 800 m elevation)
Figure 6 also shows the long-term changes in ozone                                             on the southern border of Germany (orange).
concentration near the Alpine summit of Zugspitze in                                           ppb (parts per billion) is the number of molecules of the gas per billion
southern Germany (2 800 m elevation). Depending on                                             (10 9) molecules of dry air
highly variable weather patterns, these ozone values                                           Source: Modified from Cooper et al., 2020.
can be representative of air that originates within the
polluted boundary layer4 of Europe or air that originates
beyond western Europe. Ozone concentration increased                                           Monte Cimone – the highest mountain in the northern
during the period from when records began (1978) until                                         Apennines of Italy – has a WMO/GAW station at its
the late 1990s. Since 2000, ozone concentration has                                            summit. A recent study has shown that ozone levels at
changed relatively little, although levels have decreased                                      Monte Cimone were unusually low in the boreal spring
slightly during the warm months of May-September,                                              and summer of 2020, likely due to reduced European
when Zugspitze is most frequently affected by regional                                         emissions during the COVID-19 economic downturn
European pollution (Cooper et al., 2020).                                                      (Cristofanelli et al., 2021). Similar reductions are seen
                                                                                               at Zugspitze, 350 km to the north (Figure 7). Low ozone
4   The planetary boundary layer is the lowest part of the troposphere and                     values in May, June and July were also observed at
    strongly influenced by surface turbulence.                                                 the hilltop site of Hohenpeissenberg, Germany, but the

                                 Zugspitze (2656 m)                                Mt. Cimone (2165 m)                                                Hohenpeissenberg (985 m)
                                  nighttime ozone                                    nighttime ozone                                                       daytime ozone

                    70                                                70                                                                 70

                    60                                                60                                                                 60
       Ozone, ppb

                    50                                                50                                                                 50

                    40                                                40                                                                 40

                    30                                                30                                                                 30

                    20                                                20                                                                 20
                         1   2   3   4   5   6   7   8   9 10 11 12        1   2   3   4   5   6            7       8     9 10 11 12          1   2    3   4   5   6   7   8   9 10 11 12
                                                                                           Month

Figure 7. Left: Night-time monthly mean ozone at Zugspitze, Germany for 2020 (orange) compared with individual years from 2002 to 2019 (light
blue) and the mean of the years 2002–2019 (dark blue). Centre: Night-time monthly mean ozone at Monte Cimone, Italy. Right: Daytime mean
ozone at Hohenpeissenberg, Germany.
Source: Drawn by Owen Cooper

                                                                                           6
reductions relative to multi-year average were not as low pollution, ambient particulate matter (in particular PM2.5)
as those observed at Zugspitze, 40 km to the south. The and household (indoor) particulate matter (http://www.
spring and summer ozone reductions at Monte Cimone healthdata.org/gbd/about).
and Zugspitze are highly unusual and are lower than
anything observed over the past two decades. These GBD quantifies global-scale exposure to ambient ozone
reductions are even greater than those observed in pollution by combining observations from thousands of
the free troposphere across the northern hemisphere surface-air-quality monitoring stations worldwide with
mid-latitudes by weather balloons, lidar (laser instrument) output from atmospheric chemistry models (Schultz et al.,
and commercial aircraft in 2020 (Steinbrecht et al., 2021; 2017; Chang et al., 2019; DeLang et al., 2021). Similarly,
Clark et al., 2021), indicating that the COVID-19 economic exposure to PM2.5 is based on observations at thousands
downturn had a broad impact on ozone production of monitoring stations worldwide combined with global
across Europe. satellite observations of column particulate matter
and output from an atmospheric chemistry model
(van Donkelaar et al., 2017). Global exposure maps of
Global mortality estimates for ambient and ambient ozone and ambient PM2.5 were produced for
household air pollution the years 1990–2019, which allowed GBD scientists to
estimate annual mortality due to long-term exposure
The Global Burden of Disease (GBD) initiative provides (Murray et al., 2020).
regular updates (two-year cycle) on premature death and
disability from 369 diseases and injuries in 204 countries Figure 8 shows ambient air-pollution mortality estimates
and territories (Murray et al., 2020), from 1990 to the from the latest GBD assessment (Murray et al., 2020).
present, including environmental health threats such Global mortality due to ambient air pollution is dominated
as poor air quality due to ambient (outdoor) ozone by particulate matter with 4.1 million deaths in 2019,
Total mortality Mortality rate
Mortality rate (deaths per hundred thousand)
400 20
due to ambient due to ambient
350 ozone exposure 18 ozone exposure
Total annual mortality (thousands)
16
300
14
250 12
200 10
150 8
6
100
4
50 2
0 0
1990 1995 2000 2005 2010 2015 2020 1990 1995 2000 2005 2010 2015 2020
Year Year
100
Mortality rate (deaths per hundred thousand)
4000 due to ambient PM2.5 due to ambient PM2.5
Total annual mortality (thousands)
3500
80
3000
2500 60
2000
40
1500
1000
20
500
0 0
1990 1995 2000 2005 2010 2015 2020 1990 1995 2000 2005 2010 2015 2020
Year Year
Global Central Europe, Eastern Europe, and Central Asia
South Asia Latin America and Caribbean
High-income North Africa and Middle East
Sub-Saharan Africa Southeast Asia, East Asia, and Oceania
Figure 8. Global Burden of Disease 2019 mortality estimates. Note that the total mortality values along the PM 2.5 y-axis are a factor of 10 greater
than the values along the ozone y-axis, and the mortality rate values along the PM 2.5 y-axis are a factor of 5 greater than the values along the
ozone y-axis. Data are displayed for the seven super-regions created by GBD and based on two criteria: epidemiological similarity and geographic
closeness. The “High-income” region includes the United States, Canada, Chile, Argentina, Uruguay, Western Europe, Israel, Australia, New
Zealand, Japan and Republic of Korea. A map of the super-regions is available at http://www.healthdata.org/gbd/faq.
Source: Murray et al., 2020.
7
compared with 365 000 deaths due to ambient ozone                three times the rate due to ambient particulate matter.
exposure. These estimates are not exact and the uncer-           An in-depth analysis of global mortality due to ambient
tainty (95% uncertainty interval) on these values is ±20%        and household air pollution can be found in the State of
for ambient particulate matter, and ±50% for ambient             Global Air 2020 (Health Effects Institute, 2020).
ozone (Health Effects Institute, 2020). In total, global
mortality increased from 2.3 million in 1990 (91% due
to particulate matter, 9% due to ozone) to 4.5 million in        Conclusions
2019 (92% due to particulate matter, 8% due to ozone).
Regionally, present-day total mortality is greatest in the       In conclusion, this issue of the WMO Air Quality and
super-region of Southeast Asia, East Asia and Oceania            Climate Bulletin highlights the critical role that obser-
(1.8 million total deaths; 94% due to particulate matter,        vations play in monitoring the state of the atmosphere.
6% due to ozone), followed by the South Asia super-region        Long-term, consistent measurements enable the com-
(1.4 million total deaths; 86% due to particulate matter,        munity to understand how conditions have changed
14% due to ozone). The global mortality rate (deaths per         relative to the past and empower air quality and climate
100 000) due to ambient ozone pollution has decreased            models to improve simulations of the atmosphere. There
by 13% since 2010, and the global mortality rate due to          is still room for improvement – model predictions will
ambient particulate matter has decreased by 4%.                  always be somewhat uncertain – but in times of rapid
                                                                 shifts in human activity (as was the case in 2020), filling
Another major cause of premature mortality is household          observational gaps for key species will greatly improve
particulate matter, which is caused by the burning of            our ability to model atmospheric changes as they occur.
solid and liquid fuels for cooking and home heating.             The WMO Global Atmosphere Watch (WMO/GAW, 2014;
GBD assesses mortality due to the burning of solid fuel          Schultz et al., 2015) supports atmospheric composition
for cooking and estimates that there were 2.3 million            measurements, analysis and research, including the
(uncertainty of ±30%) premature deaths in 2019 (Health           linkages between air quality and climate. Many pollutants
Effects Institute, 2020). Therefore, the GBD estimate of         (reactive gases and aerosols) are part of the extensive
total global mortality due to ambient and household              measurement programmes carried out at GAW stations
air pollution for the year 2019 is 6.8 million, of which         around the world. These data provide a unique record
34% is due to cooking-related household particulate              of Earth’s changing atmospheric chemical composition.
matter. The great majority of deaths associated with             GAW stations provide valuable data for assessing global
household particulate matter occur in the super-regions          ozone and aerosol trends (Tarasick et al., 2019, Collaud
of South Asia, Sub-Saharan Africa, and Southeast Asia,           Coen et al., 2020), conducting climate-change research
East Asia and Oceania. While total mortality due to              (Hartmann et al., 2013, Laj et al., 2020), evaluating global
household particulate matter has steadily decreased in           and regional climate-chemistry models (Mortier et al.,
these regions since 2010, mortality rates remain high,           2020, Gliß et al., 2021) and quantifying the global im-
especially in sub-Saharan Africa, where the mortality            pact of ozone on human health (Chang et al., 2019;
rate due to household particulate matter is roughly              DeLang et al., 2021).

                                                             8
References                                                      Fiore, A. M.; Naik, V.; Spracklen, D. V. et al. Global Air
                                                                     Quality and Climate. Chem. Soc. Rev. 2012, 41 (19),
Bauer, P.; Thorpe, A.; Brunet, G. The Quiet Revolution               6663–6683. https://doi.org/10.1039/C2CS35095E.
    of Numerical Weather Prediction. Nature 2015, 525           Gelaro, R.; McCarty, W.; Suárez, M. J. et al. The
    (7567), 47–55. https://doi.org/10.1038/nature14956.              Modern-Era Retrospective Analysis for Research
Buchard, V.; Randles, C. A.; Silva, A. M. da et al. The              and Applications, Version 2 (MERRA-2). Journal
    MERRA-2 Aerosol Reanalysis, 1980 Onward.                         of Climate 2017, 30 (14), 5419–5454. https://doi.
    Part II: Evaluation and Case Studies. Journal                    org/10.1175/JCLI-D-16-0758.1.
    of Climate 2017, 30 (17), 6851–6872. https://doi.           Gkatzelis, G. I.; Gilman, J. B.; Brown, S. S. et al.
    org/10.1175/JCLI-D-16-0613.1.                                    The Global Impacts of COVID-19 Lockdowns
Chakraborty, S.; Guan, B.; Waliser, D. E. et al.                     on Urban Air Pollution: A Critical Review and
    Extending the Atmospheric River Concept                          Recommendations. Elementa: Science of the
    to Aerosols: Climate and Air Quality                             Anthropocene 2021, 9 (1). https://doi.org/10.1525/
    Impacts. Geophysical Research Letters                            elementa.2021.00176.
    2021, 48 (9), e2020GL091827. https://doi.                   Gliß, J.; Mortier, A.; Schulz, M. et al. AeroCom Phase
    org/10.1029/2020GL091827.                                        III Multi-Model Evaluation of the Aerosol Life
Chang, K.-L.; Cooper, O. R.; West, J. J. et al.                      Cycle and Optical Properties Using Ground- and
    A New Method (M3Fusion v1) for Combining                         Space-Based Remote Sensing as Well as Surface
    Observations and Multiple Model Output for an                    in Situ Observations. Atmospheric Chemistry and
    Improved Estimate of the Global Surface Ozone                    Physics 2021, 21 (1), 87–128. https://doi.org/10.5194/
    Distribution. Geoscientific Model Development                    acp-21-87-2021.
    2019, 12 (3), 955–978. https://doi.org/10.5194/             Hartmann, D.L., Klein Tank, A.M.G., Rusticucci, M. et al.
    gmd-12-955-2019.                                                 Chapter 2. Observations: Atmosphere and Surface.
Ciavarella, A.; Cotterill, D.; Stott, P. et al. Prolonged            In:Climate Change 2013: The Physical Science
    Siberian Heat of 2020 Almost Impossible without                  Basis. Contribution of Working Group I to the Fifth
    Human Influence. Climatic Change 2021, 166 (1), 9.               Assessment Report of the Intergovernmental
    https://doi.org/10.1007/s10584-021-03052-w.                      Panel on Climate Change, Stocker, T.F. et al.,
Clark, H.; Bennouna, Y.; Tsivlidou, M. et al. The Effects            (eds.), Cambridge University Press, Cambridge,
    of the COVID-19 Lockdowns on the Composition of                  United Kingdom and New York, 2013. https://www.
    the Troposphere as Seen by IAGOS. Atmospheric                    ipcc.ch/site/assets/uploads/2017/09/WG1AR5_
    Chemistry and Physics Discussions 2021, 1–33.                    Chapter02_FINAL.pdf.
    https://doi.org/10.5194/acp-2021-479.                       Health Effects Institute. State of Global Air 2020.
Collaud Coen, M.; Andrews, E.; Alastuey, A. et al.                   Special Report. 2020. Boston, MA: Health Effects
    Multidecadal Trend Analysis of in Situ Aerosol                   Institute. https://www.stateofglobalair.org/sites/
    Radiative Properties around the World.                           default/files/documents/2020-10/soga-2020-
    Atmospheric Chemistry and Physics 2020,                          report-10-26_0.pdf.
    20 (14), 8867–8908. https://doi.org/10.5194/                Inness, A.; Ades, M.; Agustí-Panareda, A.; Barré, J.
    acp-20-8867-2020.                                                et al. The CAMS Reanalysis of Atmospheric
Cooper, O. R.; Schultz, M. G.; Schröder, S. et al.                   Composition. Atmospheric Chemistry and Physics
    Multi-Decadal Surface Ozone Trends at Globally                   2019, 19 (6), 3515–3556. https://doi.org/10.5194/
    Distributed Remote Locations. Elementa: Science                  acp-19-3515-2019.
    of the Anthropocene 2020, 8 (23). https://doi.              IPCC. Climate Change 2021: The Physical Science
    org/10.1525/elementa.420.                                        Basis. Contribution of Working Group I to the Sixth
Cristofanelli, P.; Arduni, J.; Serva, F. et al. Negative             Assessment Report of the Intergovernmental Panel
    Ozone Anomalies at a High Mountain Site in                       on Climate Change. 2021. (Masson-Delmotte, V.
    Northern Italy during 2020: A Possible Role of                   et al., Eds.). https://www.ipcc.ch/report/
    COVID-19 Lockdowns? Environ. Res. Lett. 2021,                    sixth-assessment-report-working-group-i/.
    16 (7), 074029. https://doi.org/10.1088/1748-9326/          Kaiser, J. W.; Heil, A.; Andreae, M. O. et al. Biomass
    ac0b6a.                                                          Burning Emissions Estimated with a Global Fire
DeLang, M. N.; Becker, J. S.; Chang, K.-L. et al.                    Assimilation System Based on Observed Fire
    Mapping Yearly Fine Resolution Global Surface                    Radiative Power. Biogeosciences 2012, 9 (1),
    Ozone through the Bayesian Maximum Entropy                       527–554. https://doi.org/10.5194/bg-9-527-2012.
    Data Fusion of Observations and Model Output                Keller, C. A.; Knowland, K. E.; Duncan, B. N. et al.
    for 1990–2017. Environ. Sci. Technol. 2021, 55 (8),              Description of the NASA GEOS Composition
    4389–4398. https://doi.org/10.1021/acs.est.0c07742.              Forecast Modeling System GEOS-CF v1.0.
Fasullo, J. T.; Rosenbloom, N.; Buchholz, R. R. et al.               Journal of Advances in Modeling Earth Systems
    Coupled Climate Responses to Recent Australian                   2021, 13 (4), e2020MS002413. https://doi.
    Wildfire and COVID-19 Emissions Anomalies                        org/10.1029/2020MS002413.
    Estimated in CESM2. Geophysical Research                    Laj, P.; Bigi, A.; Rose, C. et al. A Global Analysis of
    Letters 2021, 48 (15), e2021GL093841. https://doi.               Climate-Relevant Aerosol Properties Retrieved
    org/10.1029/2021GL093841.                                        from the Network of Global Atmosphere Watch

                                                            9
(GAW) near-Surface Observatories. Atmospheric Anthropogenic Emission Conditions. Environment
Measurement Techniques 2020, 13 (8), 4353–4392. International 2021, 157, 106818. https://doi.
https://doi.org/10.5194/amt-13-4353-2020. org/10.1016/j.envint.2021.106818.
Micke, K. Every Pixel of GOES-17 Imagery at Your Steinbrecht, W.; Kubistin, D.; Plass-Dülmer, C. et al.
Fingertips. Bulletin of the American Meteorological COVID-19 Crisis Reduces Free Tropospheric Ozone
Society 2018, 99 (11), 2217–2219. https://doi. Across the Northern Hemisphere. Geophysical
org/10.1175/BAMS-D-17-0272.1. Research Letters 2021, 48 (5), e2020GL091987.
Molod, A.; Takacs, L.; Suarez, M. et al. Development https://doi.org/10.1029/2020GL091987.
of the GEOS-5 Atmospheric General Circulation Stieb, D. M.; Burnett, R. T.; Smith-Doiron, M. et al.
Model: Evolution from MERRA to MERRA2. A New Multipollutant, No-Threshold Air Quality
Geoscientific Model Development 2015, Health Index Based on Short-Term Associations
8 (5), 1339–1356. https://doi.org/10.5194/ Observed in Daily Time-Series Analyses.
gmd-8-1339-2015. Journal of the Air & Waste Management
Mortier, A.; Gliß, J.; Schulz, M. et al. Evaluation of Association 2008, 58 (3), 435–450. https://doi.
Climate Model Aerosol Trends with Ground- org/10.3155/1047-3289.58.3.435.
Based Observations over the Last 2 Decades – an Tarasick, D.; Galbally, I. E.; Cooper, O. R. et al.
AeroCom and CMIP6 Analysis. Atmospheric Tropospheric Ozone Assessment Report:
Chemistry and Physics 2020, 20 (21), 13355–13378. Tropospheric Ozone from 1877 to 2016, Observed
https://doi.org/10.5194/acp-20-13355-2020. Levels, Trends and Uncertainties. Elementa:
Murray, C. J. L.; Aravkin, A. Y.; Zheng, P. et al. Global Science of the Anthropocene 2019, 7 (39). https://
Burden of 87 Risk Factors in 204 Countries and doi.org/10.1525/elementa.376.
Territories, 1990–2019: A Systematic Analysis for van Donkelaar, A.; Martin, R. V.; Brauer, M. et al.
the Global Burden of Disease Study 2019. The Global Estimates of Fine Particulate Matter Using
Lancet 2020, 396 (10258), 1223–1249. https://doi. a Combined Geophysical-Statistical Method with
org/10.1016/S0140-6736(20)30752-2. Information from Satellites, Models, and Monitors.
Pye, H. O. T.; Liao, H.; Wu, S. et al. Effect of Changes Environ. Sci. Technol. 2016, 50 (7), 3762–3772.
in Climate and Emissions on Future Sulfate- https://doi.org/10.1021/acs.est.5b05833.
Nitrate-Ammonium Aerosol Levels in the Wagner, C. E. V. Development and Structure of the
United States. Journal of Geophysical Research: Canadian Forest Fire Weather Index System;
Atmospheres 2009, 114 (D1). https://doi. Forestry technical report; Canada Communication
org/10.1029/2008JD010701. Group Publ: Ottawa, 1987.
Randles, C. A.; Silva, A. M. da; Buchard, V. et al. The West, J. J.; Smith, S. J.; Silva, R. A. et al. Co-Benefits
MERRA-2 Aerosol Reanalysis, 1980 Onward. of Mitigating Global Greenhouse Gas Emissions
Part I: System Description and Data Assimilation for Future Air Quality and Human Health. Nature
Evaluation. Journal of Climate 2017, 30 (17), 6823– Clim Change 2013, 3 (10), 885–889. https://doi.
6850. https://doi.org/10.1175/JCLI-D-16-0609.1. org/10.1038/nclimate2009.
Schultz, M. G.; Akimoto, H.; Bottenheim, J. et al. World Meteorological Organization (WMO), WMO
The Global Atmosphere Watch Reactive Gases Aerosol Bulletin. No. 4, 2021. https://library.wmo.
Measurement Network. Elementa: Science of int/index.php?lvl=notice_display&id=21886#.
the Anthropocene 2015, 3 (000067). https://doi. YS421tMzZGw.
org/10.12952/journal.elementa.000067. World Meteorological Organization (WMO), WMO
Schultz, M. G.; Schröder, S.; Lyapina, O. et al. Airborne Dust Bulletin. No. 5, 2021. https://library.
Tropospheric Ozone Assessment Report: wmo.int/index.php?lvl=notice_display&id=19826#.
Database and Metrics Data of Global Surface YS42btMzZGw.
Ozone Observations. Elementa: Science of the WMO/GAW. The Global Atmosphere Watch
Anthropocene 2017, 5 (58). https://doi.org/10.1525/ Programme: 25 Years of Global Coordinated
elementa.244. Atmospheric Composition Observations and
Sokhi, R. S.; Singh, V.; Querol, X. et al. A Global Analyses. WMO Report. WMO-No. 1143. https://
Observational Analysis to Understand Changes library.wmo.int/doc_num.php?explnum_id=7886.
in Air Quality during Exceptionally Low
10Acknowledgements and links (University of Iowa, United States), Anton Darmenov
(NASA, United States), Paolo Laj (Université Grenoble
Data for aerosols and reactive gases collected within Alpes, France, and University of Helsinki, Finland) and
the GAW Programme with support from WMO Members John Liggio (Environment and Climate Change Canada).
and contributing networks are available from the World
Data Centre for Aerosols and Reactive Gases, which
is supported by the Norsk Institutt for Luftforskning, All authors in alphabetic order:
Norway. Carbon monoxide data are available from the
World Data Centre for Greenhouse Gases, which is Maria de Fatima Andrade (Universidade de São Paulo,
supported by the Japan Meteorological Agency. GAW Brazil), Greg Carmichael (University of Iowa, United
stations are described in the GAW Station Information States), Owen R.Cooper (CIRES University of Colorado
System (https://gawsis.meteoswiss.ch/), which is sup- Boulder/NOA A CSL, United States), Cedric Couret
ported by MeteoSwiss. (German Environment Agency (UBA), Germany), Paolo
Cristofanelli (Institute of Atmospheric Sciences and
All data from the Copernicus Atmosphere Monitoring Climate (CNR-ISAC), Italy), Anton Darmenov (NASA,
Service are freely available from the Atmosphere Data United States), Sandro Finardi (ARIANET, Italy), Johannes
Store: https://ads.atmosphere.copernicus.eu. Flemming (ECMWF), Rebecca M. Garland (Council for
Scientific and Industrial Research, North-West University
This Bulletin contains contributions from the WMO/GAW and University of Pretoria, South Africa), Shaofei Kong
Scientific Advisory Group on Aerosols, the Scientific (China University of Geosciences, China), Dagmar
Advisory Group on Applications, the Scientific Advisory Kubistin (Deutscher Wetterdienst, Germany), Paolo Laj
Group for GAW Urban Research Meteorology and (Université Grenoble Alpes, France, and University of
Environment, the Scientific Advisory Group for Reactive Helsinki, Finland), John Liggio (Environment and Climate
Gases and the Steering Committee of Global Air Quality Change Canada, Canada), Jordi Massagué (Institute
Forecasting and Information System. of Environmental Assessment and Water Research,
Spanish Research Council and Universitat Politècnica
GBD mortality estimates due to ambient and household de Catalunya, Spain), Julie M. Nicely (University of
air pollution can be downloaded from https://www. Maryland and NASA, United States), Radenko Pavlovic
stateofglobalair.org/. (Environment and Climate Change Canada, Canada),
Irina Petropavlovskikh (CIRES University of Colorado
Boulder/NOAA GML , United States), Vincent-Henri Peuch
Editorial Board (ECMWF), Xavier Querol (Institute of Environmental
Assessment and Water Research, Spanish Research
Owen. R. Cooper (CIRES University of Colorado Boulder/ Council, Spain), Samuel Rémy (HYGEOS), Vikas Singh
NOAA CSL, United States of America), Ranjeet. S. Sokhi (National Atmospheric Research Laboratory, India),
(University of Hertfordshire, United Kingdom of Great Ranjeet S. Sokhi (University of Hertfordshire, United
Britain and Northern Ireland), Julie. M. Nicely (University Kingdom), Admir Créso Targino (Federal University of
of Maryland and NASA, United States), Greg Carmichael Technology, Brazil).
Contacts
World Meteorological Organization World Data Centre for Greenhouse Gases
Atmospheric Environment Research Division Japan Meteorological Agency, Tokyo
Science and Innovation Department, Geneva, Email: wdcgg@met.kishou.go.jp
Switzerland Website: https://gaw.kishou.go.jp/
Email: gaw@wmo.int
Website: https://community.wmo.int/activity-areas/gaw
World Data Centre for Reactive Gases & World Data
Centre for Aerosols
Norwegian Institute for Air Research (NILU), Kjeller,
Norway
Email: kt@nilu.no
Website: https://www.gaw-wdcrg.org/
https://www.gaw-wdca.org/
JN 211148
11You can also read