Fair distributions of carbon dioxide removal obligations and implications for effective national net-zero targets
←
→
Page content transcription
If your browser does not render page correctly, please read the page content below
LETTER • OPEN ACCESS

Fair distributions of carbon dioxide removal obligations and implications
for effective national net-zero targets
To cite this article: Kaylin Lee et al 2021 Environ. Res. Lett. 16 094001

View the article online for updates and enhancements.

                                This content was downloaded from IP address 69.112.175.8 on 31/08/2021 at 15:31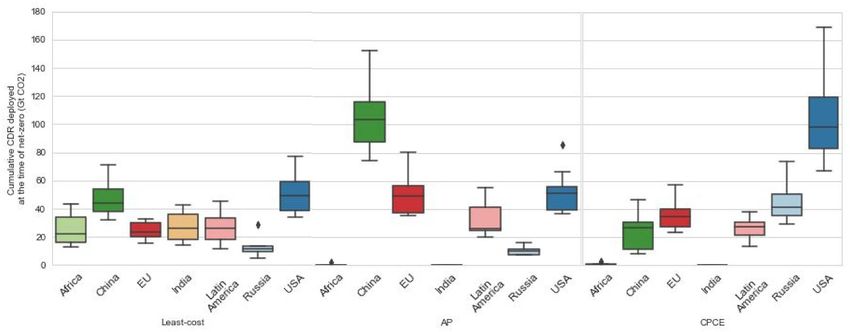
Environ. Res. Lett. 16 (2021) 094001 https://doi.org/10.1088/1748-9326/ac1970
LETTER
Fair distributions of carbon dioxide removal obligations and
OPEN ACCESS
implications for effective national net-zero targets
RECEIVED
14 December 2020 Kaylin Lee1,2, Claire Fyson1 and Carl-Friedrich Schleussner1,3,∗
REVISED 1
28 July 2021 Climate Analytics, Berlin, Germany
2
Technical University, Berlin, Germany
ACCEPTED FOR PUBLICATION 3
Integrative Research Institute on Transformations of Human-Environment Systems (IRI THESys), Humboldt-Universität zu Berlin,
30 July 2021
Berlin, Germany
PUBLISHED ∗
Author to whom any correspondence should be addressed.
12 August 2021
E-mail: carl-friedrich.schleussner@hu-berlin.de
Original content from Keywords: Paris Agreement, market mechanisms, Article 6, carbon dioxide removals, negative emissions, burden sharing, net-zero
this work may be used
under the terms of the
emissions
Creative Commons Supplementary material for this article is available online
Attribution 4.0 licence.
Any further distribution
of this work must
maintain attribution to Abstract
the author(s) and the title
of the work, journal
Achieving net-zero emissions at the global level, as required to limit warming to 1.5 ◦ C, means
citation and DOI. both rapid emissions reductions across all sectors as well as a scaling-up of carbon dioxide removal
(CDR). As a growing number of countries bring forward national net-zero targets, the questions of
how much CDR each nation holds responsibility for, whether CDR transfers should be possible
under the Paris Agreement market mechanisms, and how this might affect the years in which
different countries should achieve net-zero, become increasingly important. Here we show that,
depending on the normative assumptions underlying a CDR burden-sharing system, the adjusted
net-zero date for big emitting countries could shift forward by up to 15 years (EU, based on gross
domestic product) to 35 years (Russia, based on cumulative per capita emissions) compared with
what is modeled domestically in global least-cost scenarios. This illustrates a challenge of using
least-cost model scenarios as a basis for setting and evaluating net-zero targets. We also evaluate the
potential risk of carbon loss associated with CDR transfers of such a magnitude, and consider how
a discount factor could help address carbon loss risks and contribute to overall mitigation. Our
results highlight the need for clear guidelines to ensure that international CDR transfers do not
obscure urgently-needed domestic emission reductions efforts by big emitters, while promoting a
fair and equitable distribution of the CDR burden inflicted by insufficient near-term mitigation.
We find a separate mechanism or accounting for CDR obligations to be the most promising avenue
to deliver on these objectives.
1. Introduction With increasing popularity of the concept, poten-
tial pitfalls of net-zero and the need for transpar-
In order to hold global temperature rise to ‘well ent targets and good practices have become ever
below 2 degrees Celsius above pre-industrial levels more clear (Rogelj et al 2021, Smith 2021). Specific-
and to pursue efforts to limit the temperature ally, the accounting of removals or ‘offsets’ towards
increase to 1.5 degrees Celsius above pre-industrial net-zero targets requires a critical assessment. This
levels’, the Paris Agreement sets out to achieve does not only apply to real world policy targets,
net-zero greenhouse gas (GHG) emissions in ‘the but also to assessments of net-zero targets derived
second half of the century’ (UNFCCC 2015). The from energy-economic integrated assessment mod-
concept of ‘net-zero’ has since risen in promin- els (IAMs). Most net-zero emission studies based on
ence and an increasing number of countries and IAMs have so far focused on the global level, although
non-state actors have come forward with net- they depict various net-zero timelines for countries
zero targets. As of today, more than two-thirds of and regions (van Soest et al 2021).
global emissions are covered by a net-zero target While achieving the 1.5 ◦ C limit requires first
(CAT 2021). and foremost a sharp decrease in carbon emissions
© 2021 The Author(s). Published by IOP Publishing Ltd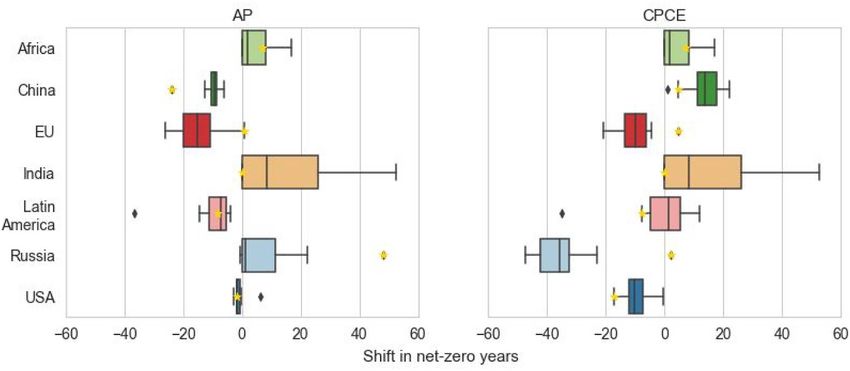
Environ. Res. Lett. 16 (2021) 094001                                                                      K Lee et al

in order to achieve global net-zero CO2 emissions         considerations could shift responsibilities in the order
around mid-century (IPCC 2018), most energy-              of hundreds of Gt CO2 from low emitting (with large
economic pathways that limit end-century warming          CDR potentials in IAMs) to high emitting countries
to 1.5 ◦ C deploy carbon dioxide removal methods          (Fyson et al 2020, Pozo et al 2020).
(hereafter ‘CDR’) at different scales later in the cen-        How to account global CDR obligations towards
tury (Fuss et al 2018, Haszeldine et al 2018). Many       national net-zero targets is an open question that
studies highlight the important role of negative CO2      needs to be considered when assessing whether net-
emissions (used here interchangeably with CDR) in         zero targets can be deemed to be fair and adequate
compensating for residual emissions CO2 and other         (Rogelj et al 2021). An assumption that all countries
GHGs from difficult to decarbonize sectors (Azar et al    have equal obligations to achieve net-zero GHG emis-
2010, Mintenig et al 2017, Rogelj et al 2018). Achiev-    sions at the same time, or that countries and regions
ing net-zero GHG emissions as outlined in Article 4 of    should deploy CDR consistently with global least-cost
the Paris Agreement therefore requires at least a lim-    pathways, would not be in line with the principles
ited amount of CDR.                                       of ‘common but differentiated responsibilities’ and
    The amount of CDR deployment varies widely            ‘respective capabilities’ that the Paris Agreement rests
across scenarios, mainly depending on the stringency      upon. Following those principles, countries with high
of near-term emissions reductions and the desire to       historical responsibilities and/or capabilities might
lower warming levels in the latter part of the cen-       need to achieve net-zero before the global average
tury (Rogelj et al 2019). Emissions pathways from         and/or set themselves net negative targets in order to
IAMs aimed at limiting end-century warming to             make a fair contribution.
1.5 ◦ C deploy a cumulative amount of CDR, includ-             There are in principle two options for countries to
ing afforestation and reforestation (A/R) and bioen-      fulfill their CDR obligations: they could deploy CDR
ergy with carbon capture and storage (BECCS), of          domestically (which may not be the globally least-
up to 1000 Gt CO2 over the 21st century (Fuss             cost approach, but may be more sustainable), or they
et al 2014, Boysen et al 2016, Honegger and Reiner        could pay for CDR abroad. Inclusion of CDR in the
2018, Masson-Delmotte et al 2018). Other tech-CDR         Paris Agreement’s Article 6 market mechanisms as
options like direct air capture with carbon stor-         a tool for addressing equity in the large-scale CDR
age (DACCS) are anticipated to emerge and become          deployment foreseen to meet the Paris Agreement
available, but they have not yet been widely incorpor-    temperature goal has already been discussed (Kachi
ated into IAMs (see Stler et al 2018 for an example       et al 2019, Fajardy and Mac Dowell 2020).
that does).                                                    A key challenge for the setting of and tracking pro-
    The question of how these globally envisaged          gress against net-zero targets is the manifold uncer-
CDR amounts are to be achieved and by whom                tainties and governance challenges associated with
is a question of equity and fairness. Effort shar-        CDR deployment (Mace et al 2021). These include
ing approaches have been widely applied to GHG            measurement uncertainties (in particular in where
emissions and emission reductions, highlighting the       land-based approaches are used), risks of imperman-
importance of equity in setting and implementing          ence and leakage from pipelines and storage reser-
emission reduction targets (Höhne et al 2014, Pan         voirs, indirect land-use changes caused by elevated
et al 2017, van den Berg et al 2019). However, with       competition for land, uncertainties over potential
ongoing discussion on the role of CDR in net-zero         future deployment, and the risk that mitigation activ-
targets and 1.5 ◦ C compatible pathways, which could      ities are delayed or deterred because of the prom-
present significant costs to current and future gen-      ise of CDR. For these reasons, scholars have argued
erations, specific attention to what an equitable dis-    for a distinction to be maintained between mitiga-
tribution of CDR might look like is warranted. The        tion targets for reducing emissions and those for CDR
need for CDR is a result of past and current inaction     (McLaren 2020), or between approaches for address-
on reducing emissions by major emitters, and tech-        ing emissions from fossil fuels and those for emis-
nological CDR (the focus of this analysis) is costly—     sions and removals from land-use activities (Fyson
the deployment of currently discussed options would       and Jeffery 2019). In the case of including CDR
require substantial financial, environmental and/or       in an international market mechanism, there is an
energy resources, in addition to funding for develop-     additional risk of potential carbon loss stemming
ment and demonstration. Furthermore, while many           from an inadequately designed system. For example,
emissions reduction options can entail co-benefits        the lack of a uniform, systemic accounting frame-
for sustainable development, there is limited evid-       work that covers the emissions produced through-
ence of such co-benefits from technological CDR           out the entire lifecycle of a CDR project, or the lack
options, and deployment at large-scale could gener-       of an oversight mechanism for addressing the uncer-
ate adverse impacts, especially from a full life-cycle    tainties outlined above, could allow emissions to go
perspective (Honegger and Reiner 2018, Terlouw et al      uncounted.
2021). Compared with the deployment of CDR in                  Such deficiencies arising from market mechan-
global least-cost scenarios produced by IAMs, equity      isms could derail efforts to achieve the global net-zero

                                             2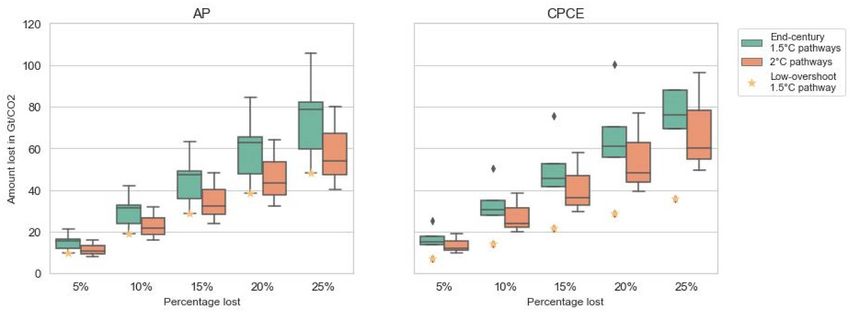
Environ. Res. Lett. 16 (2021) 094001                                                                      K Lee et al

goal and undermine the integrity of the Paris Agree-        range of narratives specified by the shared socioeco-
ment. One option to tackle these risks is via a dis-        nomic pathways (SSPs): SSP1 as an optimistic scen-
counting of international transfers, whereby a portion      ario where sustainable development is prioritized,
(in %) of transferred units are not counted towards         SSP2 as a world where the socio-economic and tech-
the buyer country’s mitigation achievement. Such            nological trends follow the historical patterns, and
a discounting approach has been proposed by vul-            SSP5 as a world in which the economy is fueled by
nerable nations during the negotiations of the Art-         exploitation of fossil fuels (Riahi et al 2017).
icle 6 market mechanisms as a means of mobilizing                We apply two approaches used by Fyson et al
additional mitigation efforts beyond those contained        (2020), namely the ‘ability to pay’ and ‘cumulative per
in existing national targets (termed ‘overall mitiga-       capita emissions’ approaches (hitherto referred to as
tion in global emissions’, or OMGE) (Schneider et al        AP and CPCE) to modeled CDR deployment in each
2018b). In the context of CDR, a higher discount rate       emission pathway, in order to derive what could be
may be required than for transfers involving emis-          considered as ‘fair shares’ of CDR for major coun-
sions reductions, as the carbon loss risks associated       tries and regions. These approaches were selected
with CDR would need to be compensated for.                  because they cover three widely applied equity prin-
     This paper looks at the implications that an equity    ciples (responsibility, equality, and capability), and
perspective could have on national and regional             are relatively simple to operationalize. They do not
obligations for negative emissions and the respect-         represent an exhaustive coverage of possible equity-
ive timings of net-zero targets. We then assess the         based approaches. However, they are useful for illus-
implications of allowing the international transfer of      trating the potential impact of applying alternative
CDR among regions, and show that net-zero targets           normative assumptions to mitigation scenarios, for
still need to be adjusted substantially if such trans-      comparison with the modeled ‘least-cost’ distribution
fers could be used to achieve them. We also illustrate      that minimizes overall mitigation costs but does not
the potential carbon losses an inadequately designed        take equity into account.
market could engender by assuming five different                 Seven countries and regions, comprising China,
levels of loss. Through this analysis, we highlight the     the USA, India, Russia, members of the EU, Latin
risks for global efforts to limit warming if market         America, and Sub-Saharan Africa excluding South
rules, modalities and procedures are not adequately         Africa, are selected and are analyzed in detail. We
designed to safeguard against the loss of carbon, and       assume that emissions reductions remain in a least-
if a distinction between domestic emissions reduc-          cost distribution, as our assessment is focused on
tions, domestic removals and removals purchased             equity as it applies to CDR; sharing the emissions
from abroad is not provided in national targets.            reduction burden is more complex given the align-
                                                            ment in many contexts between mitigation activ-
2. Methods                                                  ities and sustainable development objectives. This
                                                            approach implicitly assumes that finance flows from
We use modeled pathways from two IAMs, IMAGE                wealthier countries to those that need support to
and REMIND, to assess how a change in CDR deploy-           achieve the necessary rapid decarburization of their
ment from a least-cost approach to an equity-based          economies (Bauer et al 2020).
approach could affect the timing at which different              We take the amount of bioenergy in combination
countries achieve net-zero, and to consider the risks       with carbon capture and storage (BECCS) deployed
and challenges of fair share CDR deployment through         in each pathway as a proxy for the amount of techno-
market mechanisms. Eight mitigation pathways used           logical CDR (hereafter ‘tech-CDR’). BECCS is avail-
in the analysis consist of three scenarios that limit the   able as a predominant CDR technology in both mod-
temperature increase to below 2 ◦ C and five scen-          els, accounting for more than 80% of the total CDR
arios to 1.5 ◦ C in 2100; we here include both so-          mix at the end of the century. The pathways used
called low or no overshoot scenarios, which are as          in this analysis show an increasing level of BECCS
likely as not to temporarily exceed the 1.5 ◦ C before      deployment after 2030, reaching an annual BECCS
returning back below in 2100, and so-called high over-      deployment of 2.1–16.1 (median: 8.4) Gt CO2 yr−1
shoot scenarios that are in fact likely to exceed the       by 2050 and 11.0–22.5 (median: 15.0) Gt CO2 yr−1
1.5 ◦ C limit temporarily in the 21st century before        by 2100. This level is higher than that of other models
bringing temperatures back below this level, assum-         where the contribution from A/R to the overall CDR
ing very large amounts of CDR as a result. Although         is higher. The amount of BECCS in some of these
these high overshoot, like the below 2 ◦ C, pathways        pathways exceeds sustainability thresholds identified
may not be considered compatible with the Paris             in the literature (de Coninck et al 2018). Our analysis
Agreement (Schleussner and Fyson 2020), they still          should not be taken as an endorsement of unsustain-
provide an illustration of the volume of CDR that is        able deployment rates or large-scale deployment of
deployed in model pathways and the potential risks          CDR more generally. Rather, we use the full range of
that a delay in near-term emissions reductions could        BECCS in these models to illustrate the implications
entail, and are therefore included here. We consider a      of such extreme rates from an equity perspective.

                                               3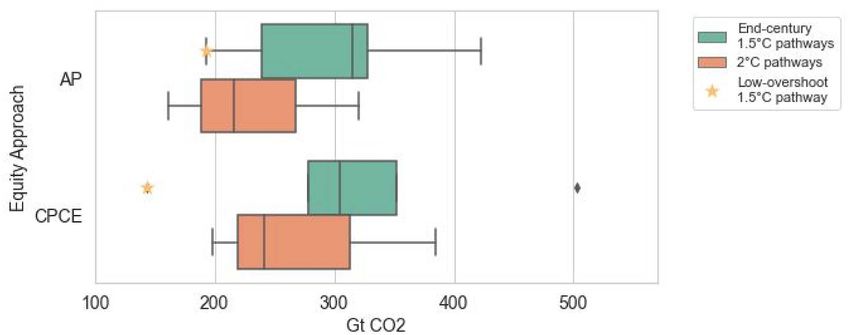
Environ. Res. Lett. 16 (2021) 094001                                                                                            K Lee et al

   Figure 1. Cumulative amounts of technological CDR (BECCS) deployment at the time of global net-zero for end-century 1.5 ◦ C
   and 2 ◦ C pathways. Least-cost (left) shows the CDR distribution at the time of global net-zero as modeled in the scenarios. AP
   (center) and CPCE (right) respectively depict the regional distributions of cumulative CDR calculated based on the AP and the
   CPCE approaches, also at the time of global net-zero. Middle bars indicate median values, colored boxes and whiskers indicate
   25th and 75th percentiles and 5th and 95th percentiles, respectively. See supplementary table 3 (available online at stacks.iop.org/
   ERL/16/094001/mmedia).

     We exclude biological CDR options, such as A/R,                   to the lack of safeguard measures in the market. We
from our analysis not only due to their limited                        consider hypothetical loss rates of 5%–25%, a range
contribution to CDR in the assessed scenarios, but                     that is loosely based on the estimated leakage rates
also because they are widely acknowledged to be                        of the Clean Development Mechanism (CDM) of the
unsuited for inclusion in the Article 6 market mech-                   Kyoto Protocol, which usually refer to the positive
anisms, given their monitoring and accounting chal-                    change in GHG emissions due to other GHG emit-
lenges (Schneider et al 2018a, Kachi et al 2019).                      ting events that are triggered by the market activities
Land-based removal options are highly vulnerable                       (Kuosmanen et al 2004). Finally, we assess the poten-
to reversal or the displacement of emitting activities                 tial role of unit discounting in preventing carbon loss
elsewhere, measurement uncertainties of land-based                     and achieving an OMGE, as mandated by Article 6.1.
emissions fluxes are high, and it is difficult to distin-              We do not take into account the potential effects of
guish anthropogenic drivers from natural ones (IPCC                    this method on the price of CDR units.
2019). As a result, land-based mitigation is poorly
characterized in the nationally determined contri-                     3. Results
butions (NDCs) and should not be considered fun-
gible with mitigation in other sectors (Mackey et al                   3.1. Equitable contributions of tech-CDR by the
2013, Fyson and Jeffery 2019). Nevertheless, support                   time of global net-zero
for and regulation of land-based CDR is likely to be                   Similar to the findings of Fyson et al (2020), our
required, and questions of equity in this context merit                results show that some regions and countries would
consideration.                                                         have to deploy significantly more negative emissions
     We first look at the effect of achieving CDR fair                 according to the applied burden sharing schemes at
shares on the effective GHG net-zero years of coun-                    the time of global net-zero. The timing of global
tries and regions with large responsibilities if negative              net-zero varies across different scenarios, the selected
emissions were to be counted towards their net-zero                    scenarios show that global GHG emissions are projec-
goals, while domestic mitigation remains unchanged.                    ted to reach net-zero between 2054 and 2076 in 1.5 ◦ C
We consider the modeled least-cost distribution of                     scenarios and 2077 and 2087 in 2 ◦ C scenarios (sup-
CDR as a baseline that reflects the domestic availab-                  plementary table 2). Under the AP scheme, China’s
ility of CDR, noting that this does not account for                    tech-CDR contribution to global net-zero would be
sustainability constraints or the potential availability               significantly higher than in the global least-cost scen-
of CDR options not yet included in models. In order                    ario initially modeled (figure 1). China and the EU
to fulfill their fair shares, countries and regions pur-               would contribute the respective tech-CDR amounts
chase the respective amounts of tech-CDR that exceed                   of 104 Gt CO2 and 49 Gt CO2 (scenario median) to
their least-cost shares from those with less respons-                  reach global net-zero, which are more than double
ibility but larger domestic potential. Then, we estim-                 their least-cost contributions of 44 Gt CO2 and 23 Gt
ate the potential magnitudes of the market, expressed                  CO2 (supplementary table 3). Contributions of Latin
by cumulative trading volumes, to evaluate the risk                    America, Russia, and the USA show slight differ-
of potential carbon loss from the market, which we                     ences from the least-cost scenario. The USA’s fair
define as the negative emissions not materialized due                  share shows little increase from its least-cost share

                                                        4
Environ. Res. Lett. 16 (2021) 094001 K Lee et al
Figure 2. Changes in the net-zero years (least-cost regional net-zero—adjusted net-zero for both equity approaches) for all
represented countries and regions, if the CDR fair shares were counted towards their domestic emission reduction efforts.
Negative differences signify earlier net-zero due to higher CDR use towards net-zero. Star markers indicate the regional shifts in
net-zero years for the low-overshoot scenario (IMAGE SSP1-19-SPA0-V17). Middle bars show median values, colored boxes and
whiskers indicate 25th and 75th percentiles and 5th and 95th percentiles, respectively. See supplementary table 4.
because its population is significantly lower than that 9 years (all scenario median), respectively. China and
of China, despite its initially higher per capita GDP. Latin America would be able to achieve their net-
Under the CPCE scheme, the contribution of Rus- zero emissions respectively 24 and 8 years earlier in
sia, the country whose cumulative per capita emis- the 1.5 ◦ C low-overshoot scenario. Under the CPCE
sions are projected to increase steeply and exceed scheme, the adjusted net-zero timelines of Russia, EU,
those of the USA in the second half of the century, to and USA would move forward, with Russia showing
the total CDR deployment increases almost fourfold almost 36 years of shift (all scenario median). How-
(from 12 Gt CO2 to 41 Gt CO2 ). The USA contrib- ever, in the 1.5 ◦ C low-overshoot scenario assessed
utes nearly double the amount shown in the least-cost here, the USA would see the biggest shift of 17 years,
scenario, increasing from 49 Gt CO2 to 98 Gt CO2 . followed by Latin America’s 8 years (supplementary
However, China’s tech-CDR share would decrease by table 4). A large shift in net-zero timing tends to occur
17 Gt CO2 (from 44 Gt CO2 to 27 Gt CO2 ) due either when a country receives a much larger CDR
to its relatively low cumulative emissions per capita. burden than in the least-cost case (e.g. the USA and
Under both schemes, Africa and India would deploy Russia under CPCE), or when the country’s residual
little to no CDR until the time of global net-zero emissions before net-zero are already relatively low,
due to their relatively low GDP and historical and meaning that the net-zero timing is highly sensitive to
future emissions. Despite some variations between a change in the CDR allocation (e.g. Latin America for
pathways, there is a consistent trend in which cer- some scenarios). Figure 3 illustrates how the deploy-
tain countries and regions are distributed more CDR ment of CDR fair shares shifts the net-zero timelines
obligations for each burden sharing principle. of nations with large CDR responsibilities (China,
EU, USA and Russia) forward, for the middle-of-the-
3.2. Shifts in national and regional net-zero years road scenario (REMIND SSP2-19).
Achieving these CDR fair shares, either through inter-
national trading or domestically, would change the 3.3. Addressing the risks of a large CDR market
timelines of regional net-zero emissions. In the case We assume least-cost tech-CDR deployment to rep-
where Article 6 were used, the application of cor- resent the amount of tech-CDR available domestic-
responding adjustments to transferred units would ally in the selected countries and regions (the limit-
mean that countries acquiring units could reach net- ations of this assumption are discussed in section 4).
zero emissions sooner than if they only counted Should negative emission units be traded on a mar-
domestic emissions and removals. Meanwhile, net- ket for countries and regions to fulfill their CDR fair
zero years of countries with negative CDR obligations shares, we find that by 2100, cumulative amounts of
would effectively be delayed if they transfer CDR to tech-CDR traded on the market would range from
other countries. 210 Gt CO2 to 322 Gt CO2 under the AP scheme and
We refer to the timeframe for reaching net-zero 231 Gt CO2 to 360 Gt CO2 under the CPCE scheme
emissions through tech-CDR transfers as ‘adjusted (25–75 percentiles, figure 4). The potential volumes
net-zero’. Under the AP scheme, the net-zero timing of CDR traded on the market account for significant
of the EU and China could move forward by 15 and portions of about 35%–40% of the total cumulative
5Environ. Res. Lett. 16 (2021) 094001 K Lee et al
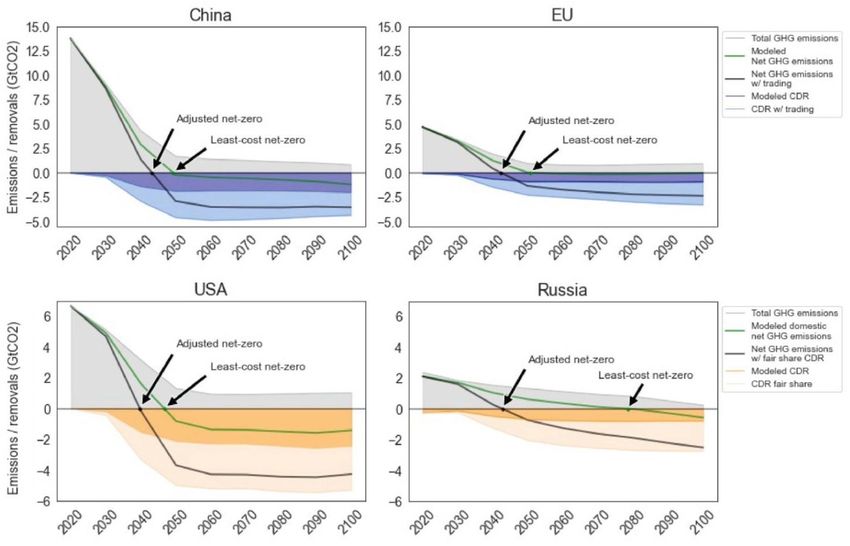
Figure 3. REMIND’s ‘middle-of-the-road’ (SSP2-19-SPA2-V17) scenario projects China and the EU to achieve net-zero in 2049
and 2050, respectively, as indicated by ‘least-cost net-zero.’ If they fulfill their CDR fair shares (AP) through transfers, their
respective timings of net-zero would become 2043 and 2042. Under the same scenario, if the United States and Russia fulfill their
CDR fair shares (CPCE), their respective timings of net-zero achievement shift forward from 2046 to 2039 and 2078–2042. Note
the differences in the y-axis. See supplementary tables 5(a) and (b) for detail.
Figure 4. Cumulative CDR deployment transferred by 2100 based on the AP (top) and CPCE schemes (bottom). The results for
the low-overshoot 1.5 ◦ C pathway are marked in yellow. See supplementary table 6 for more detail.
CDR requirements. Here, we present only the mar- pathways, AP: 216 Gt CO2 , CPCE: 241 Gt CO2 ) con-
ket magnitude in 2100, rather than 2050, as projec- sistently across burden sharing schemes (figure 2,
ted CDR deployment increases dramatically in the supplementary table 6). However, the trading volume
second half of the century in the assessed scenarios. If of the only scenario that limits warming to 1.5 ◦ C
negative emission units were to be traded at the car- with no or limited overshoot is at the lowest end of
bon price projected by the models at each time point, the market size spectrum of the end-century 1.5 ◦ C
the market could entail a financial flow amounting pathways, and moreover on the lower side of the
to around $250 trillion (median AP: $250 trillion, 2 ◦ C pathway spectrum. Different socioeconomic
median CPCE: $248 trillion). The pathways that limit assumptions (SSPs) and mitigation policy assump-
end-century warming to 1.5 ◦ C (AP: 315 Gt CO2 , tions (SPAs) also affect the potential market size, with
CPCE: 305 Gt CO2 ) show bigger trading volumes SSP5 scenarios showing the biggest volume traded
than the pathways that limit warming to 2 ◦ C (2 ◦ C among pathways with the same temperature limit.
6Environ. Res. Lett. 16 (2021) 094001 K Lee et al
Figure 5. Cumulative carbon loss of assumed 5%, 10%, 15%, 20%, 25% of the total volume traded by 2100 for both equity
approaches. The results for the low-overshoot 1.5 ◦ C pathway are marked in yellow. See supplementary tables 7(a) and (b) for
more detail.
As demonstrated by the emission trading mar- supplementary method). Discount factors are slightly
kets currently in place, such as the Clean Develop- larger than respective carbon losses in order to make
ment Mechanism (CDM), trading units do not always up for losses from both the principal CDR units and
achieve the amount of emission reductions promised the additional units imposed by the discount factor.
(Kuosmanen et al 2004). Based on such premises, we Theoretically, establishing and enforcing a discount
assume a non-perfect CDR market where the amount factor higher than our results would mobilize addi-
of CDR that the units promise are not fully delivered tional deployment of negative emissions beyond the
and thus result in carbon loss of a certain percent- amount required by the pathways and direct it toward
age. Our analysis shows that each additional 5% loss OMGE. The effective discount rate would need to
would result in up to 25 Gt CO2 (AP: 8–21 [14], be revisited and set based on a more comprehensive
CPCE: 9–25 [15]; figure 5. See supplementary tables and accurate quantification of possible carbon losses
7(a) and (b)) of unfulfilled negative emissions over if CDR were to be included in Article 6.
the century, equivalent to about five times the 2018
CO2 emissions of the United States. If a quarter of 4. Discussion and conclusion
transferred removals is not delivered, global emis-
sions would increase by up to 126 Gt CO2 (AP: 40– As net-zero targets that combine both emissions
106 [69], CPCE: 36–126 [73]). reduction and CDR gain increasing attention, the dis-
If not accounted for, carbon loss on this order cussion of ‘what is a fair net-zero target’ becomes
of magnitude would delay global net-zero emissions more critical. This study has shown that under differ-
by several years, causing global average temperature ent normative assumptions regarding what could be
to peak later, potentially leading to a prolonged or considered a fair deployment of CDR versus what is
permanent temperature overshoot above 1.5 ◦ C. At a cost-optimal, net-zero targets could be shifted earlier
25% loss, the world would effectively achieve global for many countries. The same is true when fair share
net-zero emissions 3 years later in 2065 compared principles are applied to both emissions reductions
with 2062 for the median of our selected end-century and CDR (Robiou du Pont et al 2017, van Soest et al
1.5 ◦ C scenarios, and almost 4 years later in 2087 com- 2021). Whether or not countries can achieve these
pared with 2083 in our selected 2 ◦ C scenarios (sup- equitable targets purely based on domestic mitiga-
plementary table 8). Similarly, regions and individual tion and removal capacity is not certain and merits
countries would experience a shift in their adjusted further evaluation. For example, the EU’s cumulative
net-zero timeframes. CDR burden by the time of global net zero (median
This risk can be minimized by establishing safe- 49 Gt CO2 under the AP scheme, up to a maximum
guard measures, such as early identification and of around 56 Gt CO2 ) implies a much larger level
quantification of carbon losses and discounting from of tech-CDR deployment by mid-century than envis-
the benefits or achievements. Here we consider the aged under the European Commission’s ‘tech’ scen-
application of a discount factor to acquired units as ario (∼0.5 Gt CO2 yr−1 in 2050), and would already
one tool that can help generate additional mitiga- use up most of the EU’s geological carbon storage
tion (Schneider et al 2018b), and specifically in this potential estimated by Pozo et al (2020). On the
case, additional CDR. Our calculations suggest that other hand, there are CDR technologies other than
5%, 10%, 15%, 20%, and 25% of carbon loss would DACCS or BECCS that require less geological stor-
require respective default discounting factors of 5%, age and land, which are important considerations for
11%, 18%, 25%, and 30% to counteract the loss (see domestic CDR requirements.
7Environ. Res. Lett. 16 (2021) 094001 K Lee et al
Inclusion of CDR in Article 6 has been dis- We do not attempt to make prognoses for oper-
cussed as an option that could facilitate equit- ationalizing Article 6 for CDR, nor do we make
able deployment of CDR by accelerating technology a prescriptive analysis on the necessary amount of
transfer and providing a source of international fin- CDR deployment and transfer. The feasibility of the
ance for CDR deployment in countries with less scales of CDR deployed in IAMs is often questioned
responsibility or capability, while at the same time because of sustainability concerns (e.g. competition
incentivizing more ambitious CDR contributions for land, impact on soil degradation, biophysical lim-
from major emitters (Kachi et al 2019, Fajardy and its of storage) and interactions with energy or agri-
Mac Dowell 2020, Fyson et al 2020, Pozo et al 2020). culture model outputs for BECCS deployment are not
Our study highlights two potential risks of an inad- yet represented comprehensively (Kraxner et al 2015,
equately designed market used for such purposes. Masson-Delmotte et al 2018, Köberle 2019). Further-
First, our results pave the way for a discussion of more, there are social and political barriers as well
what national targets based on equitable principles as substantial governance gaps that remain for CDR
could be and highlight the need for appropriate target deployment at scale (Mace et al 2021). Our results
setting. If countries were to use CDR units to reach only show the cost burden of CDR, but not its side
their net-zero targets without shifting their targets effects. It is also important to highlight that model
forward in time, essential domestic emission reduc- assumptions tend to favor CDR deployment later
tions could be compromised. Cancelling out fossil in the century because of poor characterizations of
fuel emissions with removals can lead to carbon lock- renewable energy cost declines, discounting of future
in that sustains the use of fossil fuels and discourages costs, configurations to limit end-century rather than
investments in clean energy (McLaren et al 2019). If peak warming, and an exponentially increasing car-
such risks are not addressed in Article 6, CDR trans- bon price (Rogelj et al 2019, Creutzig et al 2021, Stler
fer could act as mitigation deterrence, in which pro- et al 2021). There are low or no overshoot 1.5 ◦ C emis-
spective carbon removals reduce or delay imminent sion pathways that do not rely on any BECCS, albeit
emissions reductions (McLaren 2020). deploying land-based removal options (Grubler et al
Second, international CDR transfers on a large- 2018) that come with their own governance chal-
scale come with a risk of substantial carbon loss. The lenges (Jeffery et al 2020, Mace et al 2021).
results imply that any market that includes CDR must In our analysis we have only considered BECCS
be designed and implemented so that it incentiv- as a proxy for the amount of tech-CDR that may
izes ambitious planning for and investment in CDR be required, and remain neutral as to the port-
without compromising emissions reductions efforts, folio of tech-CDR options that could be available
and safeguards against carbon loss through adequate for use in international cooperation. However, the
measurement and monitoring. availability of alternative CDR options in existing
These risks could be reduced by accounting for mitigation pathways is limited, hence the domestic
CDR separately from emissions reductions, with a tech-CDR potentials represented in the least-cost
market for tech-CDR that is managed separately from scenarios largely reflect assumed BECCS availability.
the market for emission cuts. Such separation could The assumptions underlying modeled BECCS poten-
prevent mitigation deterrence by requiring separate tials can be questioned; the potentials depicted in the
targets for CDR and emissions abatement, while at the IAMs do not accurately reflect those from regional
same time incentivizing CDR deployment and invest- assessments (Fajardy and Mac Dowell 2020), and
ment (Kachi et al 2019, McLaren et al 2019, Pozo et al when BECCS is reallocated based on the production
2020). potential, rather than carbon storage capacity as typ-
Additionally, to facilitate the setting of targets that ically in models, projected regional net-zero years fur-
are both transparent, ambitious and equitable, there ther change (van Soest et al 2021). The magnitude
needs to be a clear distinction between the contribu- and direction of CDR transfers may also change due
tion of domestic mitigation (both emissions reduc- to uncertainties relating to the extent of available
tions and removals) towards national targets and the removals from a portfolio of existing and emerging
contribution of purchased units, and progress against CDR technologies (Fuss et al 2018, Köberle 2019).
each must be tracked transparently. For example, Furthermore, the distributional impacts may differ
Jeffery et al (2020) propose that governments and for other CDR technologies, such as DACCS and
organizations support CDR through what they term enhanced weathering. Therefore, further assessments
a ‘contribution claim’, without obtaining ownership of regional CDR capacity that take into account CDR
of the CDR outcomes and counting them towards technologies not yet represented by IAMs, as well as
a net-zero target. Such distinction would enable the deployment criteria beyond cost-effectiveness, will be
adequacy of national emissions reduction targets and essential in order to better understand the potentials
CDR contribution targets to be assessed, including and distributional impacts of CDR transfer.
against the benchmarks of equitable CDR contribu- We have illustrated the role of equitable distribu-
tions described in this paper and elsewhere (Fyson tions of CDR obligations for national targets and a
et al 2020, Pozo et al 2020). global market mechanism under the Paris Agreement.
8Environ. Res. Lett. 16 (2021) 094001 K Lee et al
It should be noted that the equity considerations de Coninck H et al 2018 Strengthening and implementing the
presented in this paper are not exhaustive, and con- global response global warming of 1.5 ◦ C: an IPCC special
report on the impacts of global warming of 1.5 ◦ C above
sidering what might be ethical and sustainable at the
pre-industrial levels and related global greenhouse gas
local level would be necessary when determining what emission pathways, in the context of strengthening the
deployment of CDR could be achieved domestically. global response to the threat of climate change (available at:
Furthermore, the issues we have identified are not www.ipcc.ch/site/assets/uploads/sites/2/2018/08/
SR15_Chapter4_High_Res.pdf) (Accessed 20 December
limited to equity considerations alone, but may arise
2020)
more generally (and earlier) in relation to the use of Fajardy M and Mac Dowell N 2020 Recognizing the value of
offsets in setting targets by national and subnational collaboration in delivering carbon dioxide removal One
actors. Transparency in target setting, including the Earth 3 214–25
Fuss S et al 2014 Betting on negative emissions Nat. Clim. Change
accounting of CDR contributions towards a separ-
4 850–3
ate target, could minimize risks to global mitigation Fuss S et al 2018 Negative emissions—part 2: costs, potentials and
efforts and facilitate the tracking of progress in col- side effects Environ. Res. Lett. 13 063002
lective efforts to decarbonize. There is a clear need for Fyson C L, Baur S, Gidden M and Schleussner C-F 2020
Fair-share carbon dioxide removal increases major emitter
caution regarding the inclusion of CDR in a global
responsibility Nat. Clim. Change 10 836–41
market mechanism, and a robust set of rules and Fyson C L and Jeffery M L 2019 Ambiguity in the land use
safeguard measures, such as the discounting factor component of mitigation contributions toward the Paris
explored here, would be essential. Agreement goals Earth’s Future 7 873–91
Grubler A et al 2018 A low energy demand scenario for meeting
the 1.5 ◦ C target and sustainable development goals
Data availability statement without negative emission technologies Nat. Energy
3 515–27
Haszeldine R S, Flude S, Johnson G and Scott V 2018 Negative
The data that support the findings of this study are
emissions technologies and carbon capture and storage to
available upon reasonable request from the authors. achieve the Paris Agreement commitments Philos. Trans. R.
Soc. A 376 1–23
Höhne N, den Elzen M and Escalante D 2014 Regional GHG
Acknowledgments reduction targets based on effort sharing: a comparison of
studies Clim. Policy 14 122–47
This research has been supported by the German Honegger M and Reiner D 2018 The political economy of negative
emissions technologies: consequences for international
Federal Ministry of Education and Research (BMBF) policy design Clim. Policy 18 306–21
(Grant Nos. 01LN1711A, 01LS1905A). IPCC 2018 2018: global warming of 1.5 ◦ C. An IPCC special
report on the impacts of global warming of 1.5 ◦ C above
ORCID iDs pre-industrial levels and related global greenhouse gas
emission pathways, in the context of strengthening the
global response to the threat of climate change
Kaylin Lee https://orcid.org/0000-0002-2255- IPCC 2019 Climate Change and Land: Summary for Policymakers
2143 Jeffery L, Höhne N, Moisio M, Day T and Lawless B 2020 Options
Claire Fyson https://orcid.org/0000-0003-0793- for supporting carbon dioxide removal Discussion Paper
(New Climate Institute) (available at: https://
9777 newclimate.org/wp-content/uploads/2020/07/Options-for-
Carl-Friedrich Schleussner supporting-Carbon-Dioxide-Removal_July_2020.pdf)
https://orcid.org/0000-0001-8471-848X (Accessed 18 December 2020)
Kachi A, Warnecke C and Höhne N 2019 NewClimate The role of
international carbon markets in a decarbonising world:
References aligning Article 6 with long-term strategies
Köberle A C 2019 The value of BECCS in IAMs: a review Curr.
Azar C, Lindgren K, Obersteiner M, Riahi K, van Vuuren D P, den Sustain./Renew. Energy Rep. 6 107–15
Elzen K M G J, Möllersten K and Larson E D 2010 The Kraxner F, Fuss S, Krey V, Best D, Leduc S, Kindermann G and
feasibility of low CO2 concentration targets and the role of Yan J 2015 The role of bioenergy with carbon capture and
bio-energy with carbon capture and storage (BECCS) Clim. storage (BECCS) for climate policy Handbook of Clean
Change 100 195–202 Energy Systems (Hoboken, NJ: John Wiley & Sons) pp 1–19
Bauer N, Bertram C, Schultes A, Klein D, Luderer G, Kriegler E, Kuosmanen T, Dellink R and Vöhringer F 2004 A proposal for the
Popp A and Edenhofer O 2020 Quantification of an attribution of market leakage to CDM projects HWWA
efficiency–sovereignty trade-off in climate policy Nature Discussion Paper, No. 262 (https://doi.org/10.2139/ssrn.
588 261–6 508322)
Boysen L, Lucht W, Schellnhuber H, Gerten D, Heck V and Mace M, Fyson C L, Schaeffer M and Hare W L 2021 Large-scale
Lenton T 2016 The limits to global-warming mitigation by carbon dioxide removal to meet the 1.5 ◦ C limit: key
terrestrial carbon removal Earth’s Future 5 1–12 governance gaps, challenges and priority responses Glob.
CAT 2021 Global update: projected warming from Paris pledges Policy 12 67–81
drops to 2.4 degrees after US Summit: analysis (issue brief) Mackey B, Prentice I C, Steffen W, House J I, Lindenmayer D,
(available at: https://climateactiontracker.org/press/global- Keith H and Berry S 2013 Untangling the confusion around
update-projected-warming-from-paris-pledges-drops-to- land carbon science and climate change mitigation policy
two-point-four-degrees/) (Accessed 20 December 2020) Nat. Clim. Change 3 552–7
Creutzig F, Erb K, Haberl H, Hof C, Hunsberger C and Roe S 2021 Masson-Delmotte V et al 2018 IPCC special report on global
Considering sustainability thresholds for BECCS in IPCC warming of 1.5 ◦ C summary for policy IPCC Special Report
and biodiversity assessments Glob. Change Biol. Bioenergy Global Warming of 1.5 ◦ C (https://doi.org/10.1017/CBO978
13 510–5 1107415324.004)
9Environ. Res. Lett. 16 (2021) 094001 K Lee et al
McLaren D P, Tyfield D P, Willis R, Szerszynski B and Schleussner C-F and Fyson C L 2020 Scenarios science needed in
Markusson N O 2019 Beyond ‘net-zero’: a case for separate UNFCCC periodic review Nat. Clim. Change 10 272
targets for emissions reduction and negative emissions Schneider L, Conway D, Kachi A and Hermann B 2018a Crediting
Front. Clim. 1 1–5 forest-related mitigation under international carbon market
McLaren D 2020 Quantifying the potential scale of mitigation mechanisms: a synthesis of environmental integrity risks
deterrence from greenhouse gas removal techniques Clim. and options to address them p 51 (available at: https://
Change 162 2411–28 newclimate.org/2018/09/19/crediting-forest-related-
Mintenig J, Khabbazan M M and Held H 2017 The role of mitigation-under-international-carbon-market-
bioenergy and carbon capture and storage (BECCS) in the mechanisms/) (Accessed 18 December 2020)
case of delayed climate policy—insights from cost-risk Schneider L, Warnecke C, Day T and Kachi A 2018b
analysis Earth Syst. Dyn. Discuss. Preprint 1–30 Operationalising an ‘overall mitigation in global emissions’
Pan X, Elzen M D, Höhne N, Teng F and Wang L 2017 Exploring under Article 6 of the Paris Agreement (November)
fair and ambitious mitigation contributions under the Paris (available at: https://newclimate.org/2018/11/21/
Agreement goals Environ. Sci. Policy 74 49–56 operationalising-an-overall-mitigation-in-global-emissions-
Pozo C, Galán-Martín Á, Reiner D M, Mac Dowell N and under-article-6-of-the-paris-agreement/) (Accessed 20
Guillén-Gosálbez G 2020 Equity in allocating carbon December 2020)
dioxide removal quotas Nat. Clim. Change 10 640–6 Smith S M 2021 A case for transparent net-zero carbon targets
Riahi K et al 2017 The shared socioeconomic pathways and their Commun. Earth Environ. 2 24
energy, land use, and greenhouse gas emissions Strefler J, Bauer N, Kriegler E, Popp A, Giannousakis A and
implications: an overview Glob. Environ. Change 42 153–68 Edenhofer O 2018 Between Scylla and Charybdis: delayed
Robiou du Pont Y, Jeffery M, Gütschow J, Rogelj J, Christoff P and mitigation narrows the passage between large-scale CDR
Meinshausen M 2017 Equitable mitigation to achieve the and high costs Environ. Res. Lett. 13 044015
Paris Agreement goals Nat. Clim. Change 7 38–43 Strefler J, Kriegler E, Bauer N, Luderer G, Pietzcker R C,
Rogelj J et al 2018 IPCC special report on global warming of Giannousakis A and Edenhofer O 2021 Alternative carbon
1.5 ◦ C chapter 2—mitigation pathways compatible with price trajectories can avoid excessive carbon removal Nat.
1.5 ◦ C in the context of sustainable development IPCC Commun. 12 2264
Special Report Global Warming of 1.5 ◦ C (available at: Terlouw T, Bauer C, Rosa L and Mazzotti M 2021 Life cycle
www.ipcc.ch/site/assets/uploads/sites/2/2019/02/ assessment of carbon dioxide removal technologies: a
SR15_Chapter2_Low_Res.pdf) (Accessed 18 December critical review Energy Environ. Sci. 14 1701
2020) UNFCCC 2015 Paris Agreement to the United Nations Framework
Rogelj J, Geden O, Cowie A and Reisinger A 2021 Net-zero Convention on Climate Change
emissions targets are vague: three ways to fix Nature van den Berg N J et al 2019 Implications of various effort-sharing
591 365–8 approaches for national carbon budgets and emission
Rogelj J, Huppmann D, Krey V, Riahi K, Clarke L, Gidden M, pathways Clim. Change 162 1805–22
Nicholls Z and Meinshausen M 2019 A new scenario logic van Soest H L, den Elzen M G J and van Vuuren D P 2021
for the Paris Agreement long-term temperature goal Nature Net-zero emission targets for major emitting countries
573 357–63 consistent with the Paris Agreement Nat. Commun. 12 2140
10You can also read