Breathing Fresh: Insights to Positive Externalities of COVID-19 Lockdown in Indian Megacities
←
→
Page content transcription
If your browser does not render page correctly, please read the page content below
© JHE 2020                                                                  J Hum Ecol, 71(1-3): 81-91 (2020)
PRINT: ISSN 0970-9274 ONLINE: ISSN 2456-6608                       DOI: 10.31901/24566608.2020/71.1-3.3247

    Breathing Fresh: Insights to Positive Externalities of COVID-19
                   Lockdown in Indian Megacities
              Mrinalini Goswami1, S. Puneeth1, Rakesh C. Bhatt2 and Sunil Nautiyal1*
    1
    Centre for Ecological Economics and Natural Resources (CEENR), Institute for Social and
         Economic Change (ISEC), Nagarabhavi, Bengaluru 560 072, Karnataka, India
    2
     A 104, Surbacon Maple, Chikkanayakanahalli Road, Chikkakannalli Bengaluru 560 035,
                                      Karnataka, India
KEYWORDS Air Quality Index. COVID-19. Lockdown. Megacities. Urban Environment

ABSTRACT It has been widely reported that as a consequence of nation-wide lockdown in India to control
COVID-19 pandemic, the air pollution levels have significantly reduced. The near-complete shutdown of economic
activities and stay-at-home instructions have tremendously helped in reducing emissions. This paper has attempted
to look into the pattern of change in Air Quality Index in five megacities (Delhi, Bengaluru, Chennai, Mumbai and
Kolkata) of India from pre-lockdown period to first week of lockdown and fifth week of lockdown. The paper has
also discussed changes in air quality parameters at different monitoring stations in Bengaluru during the same
period. A discussion on air quality, grounded on contemporary studies conducted to evaluate impact of lockdown on
ambient air in different cities, has provided an overview of the changes in air quality. The results provide an
understanding that the overall air quality has been improved in all the studied cities; but further comprehensive
assessment, considering the factors controlling the present air quality, is suggested to identify pathways for
emission reduction to maintain the air quality in business as usual situation in future.

                  INTRODUCTION                             Himalayas sighted from around 250 kilometres
                                                           away after about 3 decades. According to the
    Severe acute respiratory syndrome coronavi-            data of Central Pollution Control Board (CPCB)
rus-2 (SARS-CoV-2) outbreak (WHO) in Decem-                on 29 March, which provides air quality index
ber 2019, first detected in Wuhan city of China,           for 103 cities, show that 90 percent of the cities
has been spread across countries leading to a              air quality has improved to satisfactory level.
global health crisis. It has been declared as pan-         Similar improvements in air quality are also ob-
demic by the World Health Organization on 30th             served in Bengaluru, the Silicon Valley of India,
January 2020. Countries have adopted different             which is also home for many heavy industries,
measures to prevent the spread of the virus, re-           aerospace manufacturing companies, and an im-
stricting their movements, closing down work-              portant economic and cultural hub in India. The
places to contain the contagion of the virus. As           current world’s most traffic-congested city, Ben-
a consequence of nation-wide lockdown im-                  galuru, is breathing well in this lockdown period
posed in India to control the COVID-19 pan-                meant to curb the pandemic. After the COVID-
demic, the air pollution levels have significantly         19 pandemic national lockdown the air quality is
reduced. Enforcement of a near-complete halt               improving than never before, KPCB Air quality
of transport sector and industrial activities re-          monitoring has recorded 64 index which is satis-
duced the emissions from man-made activities               factorily good air condition as on 15th April 2020,
tremendously. Citizens of India, especially in the         whereas, the Air Quality Index (AQI) value was
megacities, have got the first-hand experience             recorded on an average 87 in April 2019.
of breathing and feeling clean air, otherwise suf-             The percentage of people living in cities and
focated with alarming air pollution levels. Resi-          towns of the world has been increasing steadily
dents of city of Jalandhar and the surrounding             and the recent increase has been more concen-
areas have posted photos of the peaks of the               trated in low and middle-income countries.
*
                                                           Among all urban agglomerations, 33 with 10 mil-
 Address for correspondence:
Sunil Nautiyal                                             lion or more inhabitants which are known as
Professor                                                  megacities, as per definition of the United Na-
E-mail:nautiyal_sunil@rediffmail.com                       tions. These megacities in Africa, Asia, Europe,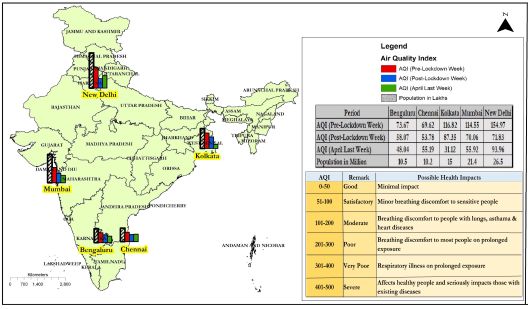
82                                     MRINALINI GOSWAMI, S. PUNEETH, RAKESH C. BHATT ET AL.

Latin America and Northern America accounts           almost 3.3 percent of the Global GDP (USD
for 7 percent of the world’s total population.        2.9Trillion) and loss of 4.5 million human lives
Countries with high projected levels of urban-        (Myllyrvirta 2020).A comprehensive report “The
ization where 90 percent of urbanization of the       Global Burden of Disease- 2015” states ambient
world will occur by 2050 belong to Asia and Af-       particulate matter pollution is the third largest
rica. These cities have a major concern for sus-      health risk factor in India. In India, approximate-
tainable urban growth while improving lives of        ly 1.2 million people died every year because of
both urban and rural population. India is one of      problems related to air pollution and air pollu-
those countries which have five megacities at         tion costs around 3 percent of GDP (Greenpeace
present, which are Delhi, Mumbai, Kolkata, Ben-       2017). The same report states that India’s urban
galuru and Chennai, and adding Hyderabad and          areas’ air quality has deteriorated by 13 percent
Ahmadabad by 2030 (UN 2018).The current pop-          in 2010-15; whereas, China, US and EU have im-
ulation of Indian megacities is more than 90 mil-     proved by 15 percent to 20 percent. Thus, to
lion. The megacities have significantly contrib-      achieve the mandates of economic development
uted to an increase in human health issues world-     in the country, it is important to tackle the prob-
wide where pollution is the most important envi-      lem of air pollution. Bengaluru and Delhi are the
ronmental health risk (Marlier et al. 2016; Liu et    two Indian cities which have pledged to provide
al. 2016). When the efforts in pollution control      clean air to their citizens by 2030 by signing C40
don’t match the pace of urban growth, the cities      Clean Air Cities Declaration, 2019 in Copen-
exhibit high levels of emission from housings,        hagen. If all the 35 signatories reduce annual
traffic and industries. Major emission sources        average PM2.5 levels to WHO guidelines (10
of those cities include vehicles, manufacturing,      ug/m3) it could avoid 40,000 deaths each year.
electricity generation, construction, road dust,      National Clean Air Programme is an initiative
waste burning, household combustion (Gut-             launched in 2019 with commitments to reduce
tikunda et al. 2014) and sometimes the pollution      air pollution in 102 most polluted cities by a max-
is contributed from neighbouring areas (Pommi-        imum of 30percent by 2024. Report by IQAir
er et al. 2013; Tiwari et al. 2014; Marrapu et al.    AirVisual, India states that India has witnessed
2014) The variations in pollutant concentrations      decrease in air pollution which can be attributed
are also influenced by various factors, predom-       to market slowdown, favourable meteorological
inantly meteorology (Sanyal and Bhattacharyya         conditions and efforts to combat emissions.
2009).                                                According to that report, 98 percent of the cities
    Urbanization in India is perceived as the force   are improving, although five of the most pollut-
of economic development; cities being the             ed cities of the world are still located in India.
growth engines provide economic opportuni-                Study in Kolkata Municipal Corporation area
ties in the form of non-agricultural livelihoods.     shows that residential sector is responsible for
Sanyal (2009) described this urbanization as the      50 percent of ambient PM-2.5 concentrations,
sociological and spatial changes that correspond      where the rest is contributed from power sector,
to economic activities and all resulted in con-       waste and open burning, road transport (ex-
struction activity from rapid growth. As the large    haust) and road transport (non-exhaust) predom-
developed states in India have already faced          inantly; whereas, industrial emissions, construc-
environmental problems pertaining to urban            tion and agriculture sector has minor contribu-
growth, they have attracted attention for appro-      tion (4%, 2% and 1% respectively) (Majumdar
priate environmental planning and management;         et al. 2020). Another prediction modelling study
however, the attention has not been enough to         for Delhi reveals that under business as usual
deal with the growing problems of pollution.The       scenario, the increase in coarse (PM10) and fine
impacts and threats to health, environment, and       particulate matter (PM2.5) will be as high as 51
economy due to persistent air pollution are also      percent and 15 percent respectively by the year
extensive in urban areas. Centre for Research         2030 (Bhanarkar et al. 2018). Reduction in Air
on Energy and Clean Air, estimated in a research      Quality Index values by 44 percent, 33 percent,
publication, that in 2018, the economic costs of      29 percent, 15 percent and 32 percent respec-
air pollution linked to fossil fuel accounted for     tively in cities’ of north, south, east, central and

J Hum Ecol, 71(1-3): 81-91 (2020)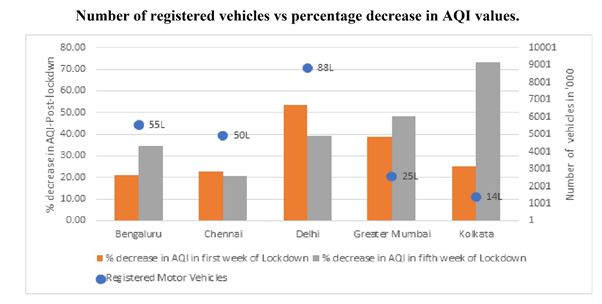
BREATHING FRESH IN INDIAN MEGACITIES                                                                     83

western India have been observed (Sharma et            which were to be extracted. Maximum Likelihood
al. 2020). It apparently has the linkage with limit-   Algorithm was employed to detect the land cov-
ing economic activities and a sudden decrease          er types in ERDAS Imagine 14.
in vehicles on road due to lockdown. This paper
is a narrative of how the air quality in cities have             RESULTS AND DISCUSSION
changed during lockdown based on secondary
data and literature. It has also attempted to ex-      A Qualitative Account on Lockdown
amine the air pollution levels pre and post lock-      and Air Quality
down in Indian megacities. Bengaluru being one
of the fastest-growing cities, the impact of this          Restrictions on economic activities and
lockdown on levels of pollution in terms of CO,        movements have exhibited impacts on air quali-
NOx, SO2, 03, PM2.5 and PM10 across the monitor-       ty in many countries which have been reported
ing stations has been assessed.                        through several studies (Dantas et al. 2020; Saa-
                                                       dat et al. 2020). Study on air pollution of Rio de
          MATERIAL AND METHODS                         Janerio, Brazil shows a significant reduction in
                                                       CO and NO2 levels during lockdown; whereas,
    Pieces of literatures regarding air quality and    decrease in PM concentrations was observed in
economic activities in cities, particularly in meg-    the first week of lockdown (Dantas et al. 2020).
acities, both in business as usual condition and       Increase in ozone concentration during that pe-
lockdown led by COVID-19 have been studied             riod was noticed which has been linked to as a
to arrive at a qualitative account of the impact of    result of the reduction in NO2 levels. Study
lockdown. Data on individual air quality param-        shows that air quality improvement in China
eters and AQI for major metropolitan cities of         during this pandemic has the potential to pre-
India have been acquired from online database          vent 24000-36000 premature death in the coun-
of Central Pollution Control Board (CPCB). List        try (He et al. 2020). Although the outbreak of
of station-wise daily AQI for before lockdown          COVID-19 is unfortunate, research findings have
and after lockdown daily wise weekly data is           also suggested positive impacts on human
obtained from different web-portals of Karnata-        health by comparing mortality from air pollution
ka State Pollution Control Board, CPCB, Minis-         and COVID-19 infection. Isaifan (2020) states in
try of Environment, Forest and Climate Change.         his research paper that air pollution is 7.6 per-
The data was converted into spatial feature us-        cent mortality rate is attributed to air pollution in
ing GIS tools and the graphs are presented on          China which is high as compared to a lower
map for visual interpretation of AQI changes in        COVID-19 mortality rate of 3.4percent as on 11th
the different cities. To perform land use and land     March. Another study critically discussed if the
cover change (LULC), Landsat 8 Earth observa-          decrease in NO2 and CO is enough for better-
tion satellite data with 30m Spatial resolution        ment of health as the SO2 and surface level ozone
was acquired for the date 31st March 2020 form         decrease is not prominently seen (Almond et al.
Earth explorer, USGS web portal. ArcGIS 10.3.1         2020), rather increase on ozone levels has been
and ERDAS IMAGINE geospatial platforms                 noticed in many places. Air quality in Barcelona
have been used to perform LULC of the selected         during lockdown has shown reduction of black
Air quality monitoring stations. A circular area       carbon and NO2 by almost half, whereas 50 per-
with a 3km radius was created using GIS tools          cent increase in ozone levels and insignificant
for each of the monitoring sites to check the          decrease in particulate matter concentrations
physical land type and landscape utilization such      pose as question in this regard (Tobias et al.
as development, conservations or mixed uses.           2020). The improvement in air quality has been
Layer stacked image of multispectral bands of          assessed in 40cities of the world (Shrestha et al.
Landsat image is considered to obtain LULC.            2020) which is definitely a temporary experience,
Supervised classification is performed to gener-       but has the potential to encourage further ef-
ate the image with defined classes, with the as-       forts to take action for emission reduction.
sistance of the image classification toolbar, train-       As a consequence of nation-wide lockdown
ing samples have been created for the classes          imposed in India to control the Pandemic, COV-

J Hum Ecol, 71(1-3): 81-91 (2020)
84 MRINALINI GOSWAMI, S. PUNEETH, RAKESH C. BHATT ET AL.
ID-19, the air pollution levels of Indian cities ing a composite index maximum eight parame-
have drastically reduced (Mahato et al. 2020; ters indicating ranges in terms of health hazards
Ramaswamy et al. 2020; Srivastava et al. 2020). and the health hazards risk for six categories of
Studies in India on improvement of air quality exposure have been described (Table 1).
during COVID-19 pandemic have emphasized Weekly averages of AQI values for three
drawing the attention of regulatory bodies in points of time, viz.- prior to lockdown, first week
emission source control in attenuating air pollu- of lockdown and fifth week of lockdown in five
tion of cities. Enforcement of a near-complete megacities of India are shown in Table 2.During
halt of transport sector and industrial activities, pre-lockdown, Chennai and Bengaluru exhibit-
reduces the emissions from man-made activities
tremendously. Sharma et al. (2020) testify the ef- ed air quality better than other three megacities,
fectiveness of restricted emissions on pollution with AQI in satisfactory range. Already being in
control. Importance has to be given to reduce a better position, the improvement in AQI (21-
secondary pollutants like ozone which have 23%) in these two cities was comparatively low-
shown increased or same concentrations while er than the other three cities. The most polluted
other primary pollutants are decreased in con- capital, Delhi had a weekly average of AQI 154.97
centrations during lockdown. Another study in which reduced to 71.68 in the first week of lock-
Delhi shows that the most notable decrease down. The results also show that Bengaluru,
(>50%) in pollutant concentrations is in terms of Mumbai and Kolkata have shown gradual im-
PM2.5 and PM10 (Mahato et al. 2020). Aerosol provement in quality of ambient air. However, a
Optical Density assessment for India shows decrease in pollutant concentrations have been
significant decrease in the first week of lockdown apparent in Delhi and Chennai in the first week
and it is the lowest in last 20 years (Gautam 2020). of lockdown, but not noticed in the fifth week’s
results. Only Bengaluru and Kolkata have
Megacities and Air Quality achieved air quality of “Good” category during
fifth week, whereas the other megacities main-
With changing pattern of economic activi- tain their air quality as “Satisfactory”. Figure 2
ties and initiatives to combat air pollution, the illustrates that the percentage decrease in AQI
pattern of pollutants in megacities are also chang- values with relation to vehicles registered in re-
ing; where, keen concern over particulate mat- spective cities, where a positive correlation has
ter, black carbon, NOx and ozone has been ob- been noticed between number of vehicles regis-
served due to their local and regional impacts tered and percentage decrease in the first week
including health risks and global climate change of lockdown. The fifth week’s decrease cannot
(Gurjar et al. 2016). Air pollution is in top rank be linked to vehicular emission, where these two
among the risk factors for death in the world and parameters have shown a negative correlation
(r=-0.61). Mumbai has the highest vehicular den-
population in the cities are worst affected. Esti- sity (1900 vehicles per km) where 28 percent is
mates from past studies show that the major private vehicles (Economic Survey 2019-20 Ma-
share of air pollution in Indian cities are 72 per- harashtra as cited in ET, March 6th 2020); how-
cent from vehicles, 20 percent from industries ever, the highest improvement in air quality has
and the rest due to domestic sources. AQI, be- been noticed in Delhi which can be linked to
Table 1: Composite AQI values and corresponding likely health impacts of exposures
AQI Remark Possible health impacts
0-50 Good Minimal impact
51-100 Satisfactory Minor breathing discomfort to sensitive people
101-200 Moderate Breathing discomfort to the people with lungs, asthma and heart diseases
201-300 Poor Breathing discomfort to most people on prolonged exposure
301-400 Very Poor Respiratory illness on prolonged exposure
401-500 Severe Affects healthy people and seriously impacts those with existing diseases
Source: https://pib.gov.in/newsite/mainpage.aspx (Retrieved on 3 May 2020)
J Hum Ecol, 71(1-3): 81-91 (2020)BREATHING FRESH IN INDIAN MEGACITIES 85
Jammu and Kashmir
Legend
Himachal Pradesh Air Quality Index
Punjab Chandigarh AQI (Pre-Lockdown Week)
Uttaranchal
AQI (Post-Lockdown Week)
Arunachal Pradesh AQI (April Last Week)
New Delhi
Sikkim Population in Million
Uttar Pradesh
Rajasthan Assam Period Bengaluru Chennai Kokkatta Mumbai New Delhi
Nagaland
Bihar
Meghalaya AQI (Pre-Lockdown Week) 73.67 69.62 116.82 114.55 154.97
Manipur
Tripura AQI (Post-Lockdown Week) 58.7 53.78 87.35 70.06 71.83
Gujarat Mizora
Madhya Pradesh AQI (April Last Week) 48.04 55.19 31.12 55.92 93%
Kolkatta
Population in Million 10.5 10.2 15 21.4 26.5
Daman and Diu Orissa
AQI
AQI Remark
Remark Possible Health
Possible Health Impacts
Impacts
Maharashtra
Mumbai 0-50 Goooodd
G Minimal impact
Minimal impact
0-50
51-100
51-100 Minor breathing
Satisfactory Minor breathing discomfort
discomfort to
to sensitive
sensitive people
people
Andhra Pradesh Pondicherry Satisfactory
101-200 Breathing discomfort
discomfort toto people
people with
with lungs,
lungs,
101-200 Moderate Breathing
Moderate asthama && heart
heart disease
disease
asthama
Breathing discomfort
Breathing discomfort to
to most
most people
people on
on
201-300
201-300 Poor prolonged exposure
exposure
Benguluru Chennai Andaman and Nicobar Poor prolonged
Lakshdweep Tamil Nadu
Kerala
301-400
301-400 Very poor Respiratory illness
poor Respiratory illness on
on prolonged
prolonged exposure
exposure
Kilometers Very
Affects healthy
Affects healthy people
people and
and seriously
seriously impacts
impacts
401-500
401-500 Severe those with
with existing
existing diseases
diseases
Severe those
Fig. 1. Map showing population of cities, AQI in pre and post-lockdown of Indian megacities
Source: Map prepared based on the data obtained from Central Pollution Control Board (CPCB), Govt. of India
highest number of registered vehicles (more than NOx) aggregated over a period of seven days
88 lakh in 2017) among all megacities. The partial (8th March to 14th March) before lockdown and
relaxation on lockdown from 4th of May 2020 has compared with the data recorded for the same
exhibited its impact on AQI (in first day) of Ben- number of days during the lockdown starting24th
galuru and Delhi among the megacities of India, March (Table 3). The comparison clearly shows
where Bengaluru’s and Delhi’s AQI has increased that other than SO2, the concentration of other
to 80 and 111 from 48 and 93 respectively in the pollutants has reduced during the lockdown
fifth week of lockdown. period. Sulphur dioxide concentrations have
shown an average 2.4 percent increase across
Air Quality Parameters across Monitoring the monitoring stations of Bengaluru. Oxides of
Stations of Bengaluru nitrogen have shown the highest decrease (av-
erage 56.1%) in concentration in all the monitor-
The concentration of air pollutants under ing stations which is followed by decrease in
consideration (PM2.5, PM10, CO, Benzene, SO2and PM10 concentrations (37.2%). Benzene and CO
Table 2: Air Quality Index (weekly average) of megacities of India in pre and post COVID-19 Lockdown
Cities Delhi Bengaluru Chennai Mumbai Kolkata
Pre-Lockdown Week 154.97 73.67 69.62 114.55 116.82
Lockdown Week-1 71.68 58.07 53.78 70.06 87.35
Lockdown Week-5 93.96 48.04 55.19 59.22 31.12
AQI Standard (Good) 50 50 50 50 50
Car density (no. of cars per km) 108 297 149 510 319
% decrease in week-1 53.75 21.18 22.75 38.84 25.23
% decrease in week-5 39.37 34.79 20.73 48.30 73.36
Source: Calculated based on the data from the Central Pollution Control Board (CPCB), Govt. of India
J Hum Ecol, 71(1-3): 81-91 (2020)86 MRINALINI GOSWAMI, S. PUNEETH, RAKESH C. BHATT ET AL.
80.00 10001
70.00 9001
88L
8001
% decrease in AQI-Post-lockdown
60.00
7001
Number of vehicles in ‘000
50.00
6001
55L
40.00
50L 5001
30.00 4001
20.00 3001
25L
2001
10.00 14L
1001
0.00
1
Bengaluru Chennai Delhi Greater Mumbai Kolkata
% decrease in AQI in first week of Lockdown in % decrease in AQI in fifth week of Lockdown
Registered Motor Vehicles
Fig. 2. Number of registered vehicles vs percentage decrease in AQI values
Source: Vehicle data: Statistical Year Book, MoSPI, India (2017)
Source: http://mospi.nic.in/statistical-year-book-india/2017/189) (Retrieved on 30 April 2020).
Table 3: Average (one-week) concentration (ppm) of air pollutants during pre and post-lockdown in Bengaluru
Pollution Monitoring PM2.5 PM10 CO Benzene SO2 NOx
Stations [μg/m3] [μg/m3] [μg/m3] [μg/m3] [μg/m3] [μg/m3]
Pre- Post- Pre- Post- Pre- Post- Pre- Post- Pre- Post- Pre- Post-
LD LD LD LD LD LD LD LD LD LD LD LD
BTM Layout 26.82 24.56 DD DD 0.99 0.87 0.0 0.0 5.28 7.17 31.38 20.71
BWSSB 57.00 50.45 DD DD 0.73 1.15 0.06 0.44 7.3 8.10 48.87 15.95
Kadubeesanahalli
Bapuji Nagar 32.29 DD 68.98 DD 0.6 DD 1.28 DD 10.53 DD 16.06 DD
Hebbal 31.86 24.83 84.43 54.51 0.74 0.62 0.27 0.17 9.78 8.03 9.90 6.34
Hombegowda Nagar 32.6 29.75 74.71 56.18 1.27 1.28 0.18 0.15 11.04 11.11 9.54 4.41
Jayanagar 5th Block 39.67 25.86 77.24 47.02 1.01 0.51 0.27 0.14 DD DD 24.17 8.78
Peenya 43.78 36.91 DD DD 1.00 0.79 DD DD 3.32 3.27 17.21 8.81
Silk Board 29.23 21.27 88.82 46.61 1.13 0.86 0.61 0.42 2.62 2.67 17.30 4.45
Average Percentage
Reduction In
Concentration 18.2% 37.2% 6.5% 4.3% -2.4% 56.1%
National Ambient
Air Quality
Standards (24
Hours) 60.00 100.00 4.00 5 80.00 -
DD: Data deficit
Source: CPCB [17]Pre-lockdown period: 8/3/20 -14/3/20; Post-lockdown period: 24/3/20 - 30/3/20 (https://
app.cpcbccr.com/AQI_India/) (Retrieved on 1 May 2020)
have experienced the least decrease in concen- quality parameters, viz., ozone, sulphur dioxide
tration; however, these pollutants are within pre- and benzene. Before lockdown, higher levels of
scribed limits in both pre and post lockdown. fine particulate matter, PM2.5, is recorded which
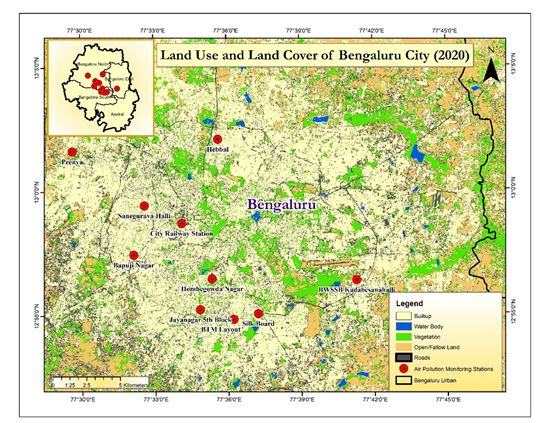
Kadubeesanahalli is the only site which has wit- is the direct result of anthropogenic activities in
nessed increasing concentration of three air Peenya (industrial area) and Kadubeesanahalli
J Hum Ecol, 71(1-3): 81-91 (2020)BREATHING FRESH IN INDIAN MEGACITIES 87 (swarming construction activities in the IT belt Land Use Land Cover Change and of south-east Bengaluru). PM2.5can enter the Air Pollutants respiratory system, which has adverse impacts on cardiovascular health and thereby increases The types and concentration of particulate the mortality risk. Carbon Monoxide has been matters in air depend on location of monitoring found with no significant reduction across mon- site, meteorological parameters and type of land itoring stations; whereas found to be increased use and land cover. The understanding of land in Kadubeesanahalli, even during lockdown use land cover patterns is essential for strate- which can be attributed to other micro-climatic gizing control measures. The conversion of nat- and topographical variables. Nevertheless, all ural land cover classes such as forest, grass- the parameters in both pre lockdown and during lands and farmland to residential housing, in- first week of lockdown had concentrations within dustrial complexes and large commercial centres the limits set by National Ambient Air Quality results in emergence of pollution sources. Fig- Standards. ure 3 shows the distribution of air pollution mon- Fig. 3. Land use land cover map of Bengaluru showing air pollution monitoring stations Source: Authors J Hum Ecol, 71(1-3): 81-91 (2020)
88                                      MRINALINI GOSWAMI, S. PUNEETH, RAKESH C. BHATT ET AL.

Table 4: Percentage of area under different land use land cover types around 3km radius of monitoring
stations

Pollution monitoring         Built-up       Vegetation       Waterbody     Open/Fallow land        Roads
stations                       (%)             (%)             (%)               %)                 (%)

Hebbal                        67.5             14.17             1.48              6.07            10.79
Peenya                        61.45             6.57             0.3              17.49            14.19
Bapujinagar                   78.32             5.54             0.16              2.71            13.27
Silkboard                     73.68            10.69             0.78              2.45            12.4
BWSSB                         53.14            15.81             0.91             14.94            15.2
Kadubeesanahalli

Source: Authors

itoring stations in Bengaluru and visual inter-          enced by atmospheric pressure and wind (Unal
pretation reveals no uniform distribution and            et al. 2000).
coverage of the city area by monitoring stations.            Transport and dispersion of pollutants vary
     Land use and economic activities are linked         depending on the meteorological parameters and
in a bi-directional loop. Extent of urban land use       behaviour of pollutants in air, which determine
including built-up area (residential, commercial         the residence time of pollutants and removal from
and industrial uses) and roads can be consid-            ambience by depositing on ground. Further as-
ered as indicator to assess urbanization and as a        sessment of behaviour and quantification of
proxy indicator for corresponding economic ac-           contribution from various economic activities
tivities. Previous studies show moderate to              will help to identify the possible pathways for
strong correlation between PM2.5 concentration           emission reduction. This experience of lockdown
and urban land (Superczynski and Christopher             has also been a lesson to improve environment-
2011). Table 4 presents the land use land cover          friendly behaviour without compromising the
pattern within a circular area of 3km radius around      economic benefits for different industries, which
five monitoring stations. Among the analysed             will certainly help to validate the possible emis-
areas of monitoring stations, Bapujinagar and            sion reduction opportunities.
Silk board area exhibit the highest share of land            India has plan to establish 3000 stations in
                                                         class-I and class-II cities by 2022. Although the
under built-up category, 78.32 percent and 73.68         number has doubled since 2016, yet National
percent respectively. Bapujinagar has the low-           Air Quality Monitoring Programme has only 703
est area under vegetation (5.54%), whereas,              stations in 2019 across 307 cities in covering the
Kadubeesanahalli has the highest land area with          states and Union Territories of the country (Pant
vegetation cover (15.81%) among all the five sites       et al. 2019). Pollution monitoring for the purpose
analysed. Area under roads varies from 10.79             of emission reduction requires understanding
percent-15.2 percent among all the sites. Open           of concentration, trend and behaviour of indi-
and Fallow land is high in Peenya and Kadubee-           vidual parameters. Availability of authentic data
sanahalli. Open/fallow land and road have shown          with spatially justified collection points which
strong positive correlation with PM2.5 and NOx           are representative of all the variations in land-
concentrations in monitoring stations. Larger            scape characteristics, is the primary requirement
area under open land (15.81%) and roads (15.2%)          in this regard. Among 3400 registered industries
in Kadubeesanahalli may be attributed with com-          in Bengaluru, 1600 industries are listed as Red
                                                         category (Guttikunda et al. 2019), which must
paratively low improvement of air pollution pa-          have in-house pollution monitoring system.The
rameters in that area, where three of the six pa-        analysis of data on ambient air quality parame-
rameters have not improved post 23rd March               ters across nine monitoring stations of Benga-
2020. The increasing concentration of Sulphur            luru to assess impact of lockdown has appar-
dioxide need more investigations to draw ap-             ently brought in the comprehension that there
propriate inference. In this regard, previous stud-      is a need for extensive data from a greater num-
ies also show SO2concentration is highly influ-          ber of representative sampling sites.

J Hum Ecol, 71(1-3): 81-91 (2020)
BREATHING FRESH IN INDIAN MEGACITIES 89
Opportunity for Environmental Renaissance: of private vehicles in Bengaluru, taking it to sec-
A Bengaluru Experience ond highest in the country in terms of registered
vehicles, which is more than 81 lakhs with a com-
Bengaluru is one of the megacities in India pound annual growth rate of over 10 percent.
that received most benefits from economic liber- Bengaluru has one bus per 1700 persons which
alization started back in 1991. The mounting is much lower than both International and na-
employment opportunities offered by domestic tional standards, and it has immense scope for
and multi-national companies, specifically from improvement. The largest IT park in Bengaluru,
IT sector has greeted influx of migrants from all Embassy Manyata Tech Park (Hebbal) alone has
over the country. In addition to that, better edu- more than 50 large companies occupying 1.8
cational institutes and business prospects have million sqft of area which has approximately 35000
paved the way for people of different skill sets vehicles, of which less than a mere 150 are bus-
and economic classes to relocate in and around es which includes both private and BMTC. In
Bengaluru. With already having the significant this regard, both government organizations and
share of urban population, it is projected that by researchers should come forward to investigate
2031 Bengaluru will have 20 million residents (The the vehicular congestion resulting in economic
Revised Master Plan of Bengaluru 2017). To ac- loss in terms of longer commuting time, health
commodate the population of such a scale, Ben- hazards of pollution, degrading quality of life
galuru Development Authority plans to expand etc.Being appreciative towards the positive ex-
city by another 80 sq km area. A haphazardly ternalities of this lockdown, public transport can
growing city contribute to environmental deg- incentivized. Improved air quality, sustained in
radation in many forms, starting from effects of India for last few weeks due to emissions reduc-
increasing energy consumption, industrial emis- tion also reflects the magnitude or scale of pol-
sions, and vehicular traffic, all of which can have lution contributed by vehicular emission and
an adverse effect on air quality. The green patches industrial activities. Study by Aaradhya et al.
are decreasing day by day resulting in disrup- (2018) shows that the emission of greenhouse
tion of pollution sink of the natural ecosystem. gases from transportation in Bengaluru accounts
Moreover, the individual private and public sec- for 35 % of the total GHG emissions of the city,
tor businesses and the town planners are ne- that is, 8521.23 Gg of CO2e. The effect of the
glecting the holistic inclusion of environmental
current situation on air pollution gives a rare
aspects in urban planning, which is pushing
Bengaluru, the Garden City of India, into a suf- glimpse of a world, if low-carbon technologies
focating situation. are adopted in future.
The effect of COVID-19 pandemic is appar-
ent on human lives and lifestyles in almost all CONCLUSION
over the world; the world’s economy has already
experienced downfall, but the nature and wild- Air pollution contribute a substantial share
life has started to reclaim their lost spaces to to the health burden of a country, more specifi-
humans. As a result of less vehicular traffic on cally to respiratory illness. The current situation
the roads, Bengaluru residents spotted peacocks of pandemic led lockdown has resulted in better
roaming freely in the busiest localities such as air quality which is realised by all and supported
Malleswaram and Sadashivanagar. Bengaluru by this paper as well as other studies in this
folks have been fortunate during this period to domain. Experts have already expressed the fear
witness chirping and singing of birds such as of increase in vehicular surge post-lockdown in
cuckoo, sparrow, woodpeckers in their back- the city because of the fear of contagion of the
yards and gardens. During this time, it is plausi- virus. This has to be prevented not only to pro-
ble to expect the attention towards the conser- tect the ambient air quality relapse to earlier sit-
vation of urban biodiversity in the remaining uation, but also to control the severity of im-
parks and small forest pockets in the city that pacts of COVID-19, which aggravates respirato-
are primarily maintained for recreational purpose. ry illness. Private companies have largely adopt-
Economic growth and rise in wealthier urban ed sustainable work style like working from home
population hashuge sharein increasing number and further scope of exploration to find low emis-
J Hum Ecol, 71(1-3): 81-91 (2020)90 MRINALINI GOSWAMI, S. PUNEETH, RAKESH C. BHATT ET AL.
sion work and lifestyle can be encouraged. Nev- Aradhya BD, Sowmya D, Gowda ST 2018. Temporal
ertheless, an unfortunate situation, yet this can analysis of greenhouse gas emission for Bangalore
City. Int J Advan Sci Eng Technology, 6: 53-57.
be a basis for further learning to identify effec- Bhanarkar AD, Purohit P, Rafaj P, Amann M, Bertok I,
tive pathways for emission reduction, and an Cofala J, Rao PS, Vardhan BH, Kiesewetter G, Sander
epiphany for humans at individual level to act R, Schöpp W 2018. Managing future air quality in
reasonably for the improvement of environmen- megacities: Co-benefit assessment for Delhi. Atmosph
tal quality. These findings can be a learning for Environment, 186: 158-177.
Dantas G, Siciliano B, França BB, da Silva CM,Arbilla G
formulating urban policies to deal with the inev- 2020. The impact of COVID-19 partial lockdown on
itable urbanization in India, as discussed in the the air quality of the city of Rio de Janeiro,
introduction of this paper, to pave the way for Brazil. Science of the Total Environment, 729: 139085.
sustainable urban growth in future. Economics Times. Dated 6th June 2020.From (Retrieved on 12 June 2020).
GBD 2015. Risk Factors Collaborators 2016. Global,
The availability of station-wise air quality regional, and national comparative risk assessment
of 79 behavioural, environmental and occupational,
data and spatial distribution of monitoring sta- and metabolic risks or clusters of risks, 1990–2015:
tions in Bengaluru could be considered as an A systematic analysis for the Global Burden of Disease
evidence to facilitate more pollution monitoring Study 2015. Lancet (London, England), 388 (10053):
stations with justified locations for proper envi- 1659.
ronmental monitoring. Discrete data series has Gautam S 2020. The influence of COVID-19 on Air
found to be another concern to be resolved for Quality in India: A boon or inutile. Bulletin of Envi-
ronmental Contamination and Toxicology, 1.
generating useful environmental dataset. Anoth- Greenpeace 2017. Airpocalypse – Assessment of Air
er question emanated is the reduction of sec- Pollution in Indian Cities. From (Re-
trieved on 15 March 2020).
tance is given to particulate matter and other Gurjar BR, Ravindra K, Nagpure AS 2016. Air pollu-
primary pollutants (NOx and CO). Further in- tion trends over Indian megacities and their local-to-
depth studies should be taken up to understand global implications. Atmosph Environment, 142: 475-
495.
the behaviour and concentrations of air pollut- Guttikunda SK, Goel R, Pant P 2014. Nature of air pollu-
ants with respect to meteorological parameters tion, emission sources, and management in the Indian
under the conditions of restricted emission fa- cities. Atmos Environ, 95: 501–510.
cilitated by this lockdown. Keeping the current Guttikunda SK, Nishadh KA, Gota S, Singh P, Chanda A,
environmental pollution and its severe conse- Jawahar P and Asundi J. 2019. Air quality, emissions,
and source contributions analysis for the Greater
quences on human health and ecosystems, local Bengaluru region of India. Atmospheric Pollution Re-
authorities in Indian cities in consultation with search, 10(3), pp.941-953.
the state government should make the provision He G, Pan Y, Tanaka T 2020. COVID-19, City Lock-
for implementing the measures for reducing air downs, and Air Pollution: Evidence from China. medRx-
pollution. There is a scope to mainstream the the iv. From (Retrieved on 30 April 2020).
Isaifan RJ 2020. The dramatic impact of Coronavirus
ing to adjust in this situation of new normal. One outbreak on air quality: Has it saved as much as it has
such approach may be to instrumentalize work killed so far? Global J Environ Sci Management,
from home for companies belonging to ITC and 6(3): 275-288.
similar service sectors through proper regula- Liu X, Zhu H, Hu Y, Feng S, Chu Y, Wu Y, Wang C, Zhang
tions. State actions based on this learning for Y, Yuan Z, Lu Y 2016. Public’s health risk awareness
on urban air pollution in Chinese megacities: The cases
achievable targets can help in stringent imple- of Shanghai, Wuhan and Nanchang. Int J Environ Res
mentation of monitoring and pollution control Public Health,13(9): 845. https://pubmed.ncbi. nlm.
measures for air polluting industries. nih.gov/27571088/.
Mahato S, Pal S, Ghosh KG 2020. Effect of lockdown
REFERENCES amid COVID-19 pandemic on air quality of the megac-
ity Delhi, India. Sci Tot Environment, 730: 139086. doi:
10.1016/j.scitotenv.2020.139086.
Almond D, Du X, Zhang S 2020. Did COVID-19 Im- Majumdar D, Purohit P, Bhanarkar AD, Rao PS, Rafaj P,
prove Air Quality Near Hubei? No.w27086. National Amann M, Sander R, PakrashiA, Srivastava A 2020.
Bureau of Economic Research, Hubei, China.
J Hum Ecol, 71(1-3): 81-91 (2020)BREATHING FRESH IN INDIAN MEGACITIES 91
Managing future air quality in megacities: Emission in- quality in India. Sci Tot Environment, 728: 138878.
ventory and scenario analysis for the Kolkata Metropol- doi: 10.1016/j.scitotenv.2020.138878.
itan City, India. Atmosph Environment, 222: 117-135. Shrestha AM, Shrestha UB, Sharma R, Bhattarai S, Tran,
Marlier ME, Jina AS, Kinney PL, DeFries RS 2016. Ex- HNT, Rupakheti M 2020. Lockdown Caused by COV-
treme air pollution in global megacities. Current Cli- ID-19 Pandemic Reduces Air Pollution in Cities World-
mate Change Reports, 2(1): 15-27. wide. https://doi.org/10.31223/osf.io/edt4j
Marrapu P, Cheng Y, Beig G, Sahu S, Srinivas R, Car- Srivastava S, Kumar A, Bauddh K, Gautam AS and Ku-
michael GR 2014. Air quality in Delhi during the Com- mar S. 2020. 21-Day Lockdown in India Dramatical-
monwealth games. Atmos Chem Phys, 14: 30. 55. ly Reduced Air Pollution Indices in Lucknow and New
Myllyvirta L 2020.Quantifying the Economic Costs of Delhi, India. Bulletin of Environmental Contamina-
Air Pollution from Fossil Fuels. From (Retrieved on 30 use and land cover effects on air quality in Central
Alabama using GIS and remote sensing. Rem Sens-
April 2020). ing, 3: 2552-2567.
Pant P, Lal RM, Guttikunda SK, Russell AG, Nagpure Revised Master Plan of Bengaluru-2031. Bangalore
AS, Ramaswami A, Peltier RE 2019. Monitoring par- Development Authority. 2017. From
Pommier M, McLinden CA, Deeter M 2013. Relative (Retrieved on 22 May 2020).
changes in CO emissions over megacities based on Tiwari S, Bisht DS, Srivastava AK, Gustafsson O 2014.
observations from space. Geophys Res Lett, 40:3766- Simultaneous measurements of black carbon and
3771. PM2.5, CO, and NOx variability at a locally polluted
urban location in India. Nat Hazards, 75: 29. 56.
Ramaswamy D2020. Enchanted Improvements in Air Tobías A, Carnerero C, Reche C, Massagué J, Via M, Min-
Quality across India-A Study from COVID-19 Lock- guillón MC, Alastuey A, Querol X 2020. Changes in air
down Perspective. Adalya Journal, 9(5). DOI: 10. quality during the lockdown in Barcelona (Spain) one
37896/aj9.5/013 month into the SARS-CoV-2 epidemic. Science of the
Saadat S, Rawtani D, Hussain CM 2020. Environmen- Total Environment, 138540.
tal perspective of COVID-19. Science of the Total Unal YS, Incecik S, Borhan Y, Mentes S 2000. Factors
Environment, 138870. influencing the variability of SO2 concentrations in
Sanyal K, Bhattacharyya R 2009. Beyond the factory: Istanbul. J Air Waste Mana Association, 50:75-84.
Globalisation, informalisation of production and the United Nations 2018.The World’s Cities in 2018-Data
Booklet, Department of Economic and Social Af-
new locations of labour. Economic and Political fairs, Population Divi-sion (ST/ESA/ SER.A/417).
Weekly, 44: 35-44.
Sharma S, Zhang M, Gao J, Zhang H, Kota SH 2020. Paper received for publication in May, 2020
Effect of restricted emissions during COVID-19 on air Paper accepted for publication in June, 2020
J Hum Ecol, 71(1-3): 81-91 (2020)You can also read