HYPERSPECTRAL IMAGING TECHNIQUE AS A STATE OF ART TECHNOLOGY IN
←
→
Page content transcription
If your browser does not render page correctly, please read the page content below
Green Chemistry & Technology Letters
                                                                                                  Vol 2, No 3, June 2016, pg. 127-137
                                                                                        eISSN: 2455-3611, DoI: 10.18510/gctl.2016.232

  HYPERSPECTRAL IMAGING TECHNIQUE AS A STATE OF ART TECHNOLOGY IN
                           MEAT SCIENCE
                         Hasan Ibrahim Kozan1, Cemalettin Sariçoban2, Hasan Ali Akyürek3, Ahmet Ünver4
                     1
                   Necmettin Erbakan University, Seydişehir Vocational School, 42090, Seydişehir, Konya, Turkey
                 2
                  Selçuk University, Agricultural Faculty, Department of Food Engineering, Selçuklu, Konya, Turkey
             3
               Necmettin Erbakan University, Department of Management Information Systems, Selçuklu, Konya, Turkey
                      4
                        Necmettin Erbakan University, Department of Food Engineering, Meram, Konya, Turkey
                                         *
                                          Corresponding author: h.ibrahimkozan@gmail.com
            Article History: Received on 20th December 2015, Revised on 30th January 2016, Published on 20th June 2016
                                                                 Abstract
Nowadays, the concern of meat consumption, safety and quality has been popular due to some health risks such coronary heart disease,
stroke and diabetes caused by the content as saturated fat, cholesterol content and carcinogenic compounds, for consumers. The importance
of the need of new non-destructive and fast meat analyze methods are increasing day by day. For this, researchers have developed some
methods to objectively measure the meat quality and meat safety as well as illness sources. Hyperspectral imaging technique is one of the
most popular technology which combines imaging and spectroscopic technology. This technique is a non-destructive, real-time and easy-to-
use detection tool for meat quality and safety assessment. It is possible to determine chemical structure and related physical properties of
meat.
It is clear that hyperspectral imaging technology can be automated for manufacturing in meat industry and all of data’s obtained from the
hyperspectral images which represents the chemical quality parameters of meats in the process can be saved to database.
Keywords: non-destructive method, hyperspectral imaging, meat science, rapid method, food safety.
INTRODUCTION
As it‟s well known, there is an important interactive relationship between technology and industry. Some new technology can lead to
build new industry or a new developed technology may be damageable for the present industry. So, competition and economic
challenges are forcing people to find a new way to survive as well as food producers and food industry.
Food is one of the most important and most fundamental desire in human life and it‟s affecting people‟s livelihood. People can change
most of their choices and these choices can directly affect the industries such machine industry, chemical industry, construction
industry etc. but food industry is always popular due to it is a part of human life. However, competition is increasing day by day thus
food manufacturers invest more money and time for new technologies.
So a new term is composed under the name of “modern food industry”. This industry is quite complex and very important because it
supplies most of the food consumed by the world population.
Recent years, the modern food industry is trying to find some new technology to achieve high efficiency and low-cost product as well
as high quality and safe food. Food safety, nutrition and food security are inextricably linked. Unsafe food creates a vicious cycle of
disease and malnutrition, particularly affecting infants, young children, elderly and the sick.
According to a report of World Health Organization (2015), an estimated 600 million – almost 1 in 10 people in the world – fall ill
after eating contaminated food and 420 000 die every year, resulting in the loss of 33 million healthy life years (WHO 2015).
This shows how food safety and quality is important. Quality and safety of food are usually defined by physical attributes (e.g.,
texture, color, marbling, tenderness), chemical attributes (e.g., fat content, moisture, protein content, pH, drip loss), and biological
attributes (e.g., total bacterial count). Traditionally, assessment of quality and safety involves human visual inspection, in addition to
chemical or biological determination experiments which are tedious, time-consuming, destructive, and sometimes environmentally
unfriendly. These necessitate the need for accurate, fast, real-time and nonchemical detection technologies, in order to optimize
quality and assure safety of food (Huang et al. 2014).
With recent advancements in computer technology and instrumentation engineering, there have been significant advancements in
techniques for assessment of food quality and safety. Machine vision and NIR spectroscopy are two of the more extensively applied
methods for food quality and safety assessment. Machine vision techniques based on red-green-blue (RGB) color vision systems have
been successfully applied to evaluate the external characteristics of foods (Chao et al., 1999; Lu et al., 2000; Tan, 2004; O'sullivan et
al.;2003; Faucitano et al; 2005; Huang et al., 2013a).

www.greenchemistry.in                                                                                                                   127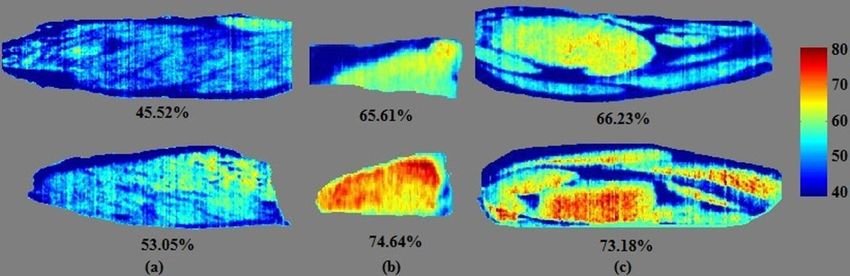
Green Chemistry & Technology Letters
                                                                                                  Vol 2, No 3, June 2016, pg. 127-137
                                                                                        eISSN: 2455-3611, DoI: 10.18510/gctl.2016.232

HSI is based on remote sensing applications (Goetz, 1985). By this technique, spectral and spatial information of sample can be
obtained from 300 – 2,600 nm wavelength) (Bannon, 2009). The main difference of the HSI from other spectrographic measurements
is getting more information from an object thus this technique is being used in several fields (Huang et al., 2013b; Lara et al., 2013;
Gendrin et al., 2007; Cruz et al., 2009; Garcia-Allende et al., 2008). It‟s possible to determine food quality and safety by detection of
microbial contamination (He and Sun, 2015), detection of contaminations (Yao et al., 2013; Kim et al., 2004), prediction and
visualization of chemical composition (Kamruzzam et al., 2012), identification of defects (Xing et al., 2005; Nagata et al., 2006),
quantification of constituents (Qiao et al., 2007) and even fecal contaminant detection (Park et al., 2006).
As well as food producers and food researchers have begun to show interest in the HSI technology. (Huang et al. 2014) reported that
in the early 2000s, the scientific articles about HSI were started to publish and today nearly 250 articles are publishing.
In this paper, usage of hyperspectral imaging systems in meat and meat products is reviewed. Since hyperspectral imaging technique
is being used, it‟s being developed by solving the issues. It became known that HSI technology is suitable for many foods especially
for meat and meat products. The mechanism and some of other details were reported in some of other published review articles. So,
the scope and the focus of this paper is recent advances of the usage of HSI in meat and meat safety, meat microbiology, meat
defection, prediction of meat chemical properties etc.
THE IMPORTANCE OF MEAT, CURRENT AND FUTURE ASPECT
There are so many factors that affects consumer behavior. In a study of Font-i-Furnols & Guerrero (2014), the main factors and sub-
factors were determined for the consumer behavior as in shown in Figure1. However, these factors are quite complex and connected
with each other. For meat and meat products, visual appearance characteristics (i.e., color, fat content, marbling, drip loss) are intrinsic
quality cues highly related with consumers' expectations of meat quality (Banović et al., 2009; Bredahl et al., 1998; Verbeke et al.,
2005) and their choice at the point of purchase because these characteristics are used to assess food quality (Banović et al., 2012; West
et al., 2001).

  Figure 1: Multidisciplinary model of the main factors affecting consumer behavior in a food domain (Font-i-Furnols et al.,
                                                             2014)

www.greenchemistry.in                                                                                                                   128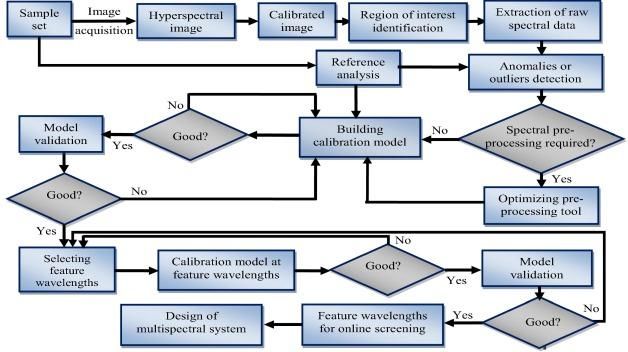
Green Chemistry & Technology Letters
                                                                                                  Vol 2, No 3, June 2016, pg. 127-137
                                                                                        eISSN: 2455-3611, DoI: 10.18510/gctl.2016.232

On the other hand, beside consumer behavior, there are some well-known external conditions for meat consumption such health
concerns, religious reasons, negative propagandas, culture, financial difficulties, regulations, imitation and adulteration, political
reasons etc. But however, a study on estimation meat consumption in future (Delgado, 2003) demonstrated that meat and milk
consumption will expand in future. Table 1 shows the estimated consumption of meat and milk in year 2020.
                    Table1: Projected food consumption trends of meat and milk, 1997–20201 (Delgado, 2003)

                                           Projected annual       Total consumption in Per capita consumption
                                          growth 1997–2020                 2020                 in 2020
                            Region         Meat       Milk           Meat         Milk      Meat        Milk
                                                (%/y)             (million metric tons)           (kg)
                   China                    3.1        3.8             107          24       73          16
                   India                    3.5        3.5              10         133        8         105
                   Other East Asia          3.2        2.5               5           2       54          29
                   Other South Asia         3.5        3.1               7          42       13          82
                   Southeast Asia           3.4        3.0              19          12       30          19
                   Latin America            2.5         1.9            46          85             70           130
                   of which is Brazil       2.4         1.8            20          30             94           145
                   only
                   WANA                     2.7         2.3            13          42             26            82
                   Sub-Saharan              3.2         3.3            11          35             12            37
                   Africa
                   Developing               3.0         2.9           217         375             36            62
                   world
                   Developed world          0.8         0.6           117         286             86           210
                   World                    2.1         1.7           334         660             45            89

Sources: Total and per capita meat consumption for 1997 are annual averages of 1996–1998 values, calculated from the United Nations
Food and Agriculture Organization database (FAO), 2002 (11). Projections are from the July 2002 version of IMPACT.
1
 Consumption is direct use as food, uncooked weight bone-in. Meat includes beef, pork, mutton and goat, and poultry. Milk is milk
and milk products in liquid milk equivalents. Metric tons and kilograms are 3-y moving averages centered on the year shown. WANA
is Western Asia and North Africa.
The last few decades, more and more countries are embarking on higher consumption of livestock products, making a shift in their
daily diet towards a western approach. Focusing on red meat, the global annual consumption per capita is forecast to reach 45.3 kg, on
average, by 2030 (i.e., twice as high as the respective assessment during 70 s)(WHO, 2016); while in a recent estimation regarding
Mediterranean area, a range from 77 to 90 kg individual red meat intake per year was highlighted (FAO, 2015). Indeed, red meat and
its products are highly preferable food items due to their energy, macronutrient (i.e., protein and fat) and salt content, nutritional
characteristics which contribute to tastefulness and satiety; whereas regarding its micronutrient profile, a wide range of minerals (i.e.,
heme iron, zinc) and vitamins (i.e., vitamin A, Β12), reasonably make it an important source of essential substances for human beings
(McAfee et al., 2010).
Meat and meat products are an important source of protein in human diets, and their consumption depends on socio-economic factors,
ethics or religious beliefs, and tradition. Globally, pork is consumed the most (15.8 kg/capita/year), followed by poultry (13.6
kg/capita/year), beef (9.6 kg/capita/year) and finally sheep and goat meat (1.9 kg/capita/year) (FAOSTAT, 2014).
The nutritional components of the meat are minerals, fats and fatty acids, vitamins and other bioactive components, and small
quantities of carbohydrates. Meat has approximately 25% dry matter and has some the most important ingredients for human health
www.greenchemistry.in                                                                                                                 129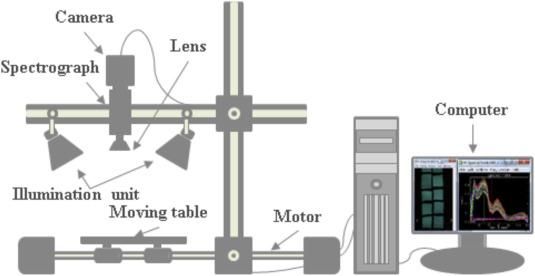
Green Chemistry & Technology Letters
                                                                                                 Vol 2, No 3, June 2016, pg. 127-137
                                                                                       eISSN: 2455-3611, DoI: 10.18510/gctl.2016.232

such essential amino acids and bioavailable vitamins also minerals. Another aspect for the meat consumption may be that there is a
correlation between meat consumption and developing for the countries. There are several studies that shows meat consumption may
maintain success on several parts of human even in school and scientific evidences also confirm this(Mann 2000, Neumann, 2007,
Webb 2005). Of course the main recommendation is based on a balanced diet that includes meat consumption.
There are also various studies that recommend lower meat consumption in diet but the choosing which food is beneficial depends on
people‟s conditions, culture, economical factors, environmental factors etc. Furthermore, in a report of FAO (2015), it was indicated
that the meat consumption had been relatively static in the developed world, annual per capita consumption of meat had doubled since
1980 in developing countries. In this report, it was also pointed out that world meat production was projected to double by 2050, most
of which was expected in developing countries. The growing meat market provides a significant opportunity for livestock farmers and
meat processors in these countries. It was also remarked that increasing livestock production and the safe processing and marketing of
hygienic meat and meat products may represent a big challenge.
Today, it‟s known that one of the most foodborne illness source is meat and meat products (Todd, 1996). As it‟s explained before,
risks such imitation and adulteration are awaiting us and this will continue to grow up with new un-known/ unpredictable issues day
by day and year by year. So some of food researchers have focused on determining the quality by basic, rapid, non-dangerous and
non-destructive methods to achieve these issues. So, the latest technologies may contain machine vision online measurements (Patel et
al, 2012), NIR spectroscopy (Osborne, 2006), electronic nose measurements (Ghasemi-Varnamkhasti, 2009), colorimetric sensors
measurements (Zaragozá et al. 2012), acoustic measurements (Davies, 2014), sensor fusion measurements(Cimander, 2002), x-ray
measurements (Lim and Barigou, 2004), raman spectroscopy technique (Zheng and He, 2014), nuclear magnetic resonance (Marcone
et al, 2013), terahertz spectroscopy/imaging(Qin et al, 2013) and hyperspectral imaging technology(He and Sun, 2015).
All of them have some advantages and disadvantages such difficulty, cost, mobility, volume, health risk etc. and most of them are
today‟s technology. But Hyperspectral imaging is not only quite enough to solve these problems but also may contribute the
manufacturer by giving more and more information about the product as it explained in next part of this paper.
A BRIEF SUMMARY OF HYPERSPECTRAL IMAGING AND THE MECHANISM
Hyperspectral imaging technique is non-destructive, real-time and easy-to-use detection tool for food quality and safety and it‟s
suitable for the continuous production. One of the major factor is no need to any chemical and no risk on the perspective of
occupational health and safety. Another attractive fact is one-time installation and long-time usage so indirectly low-cost but high
efficiency. This technique may be used for most of food. But it can be considered a major advance for the meat and meat products. As
it clearly known that meat has some issues such as short shelf-life, expensiveness, difficulties on storage, easy and rapid degradability,
difficulties on transportation etc. but consumers always desire high quality of meat and meat products. The need of modern meat
industry is modern technique that serves a solution to most of the meat production problems.
Generally, meat quality can be defined in terms of consumer appreciation of texture and flavour, and food safety, which includes the
health implications of both compositional and microbiological properties.
The meat industry is currently undergoing dramatic changes in applying the most advanced technological inventions that have gained
acceptance and respect in handling, quality control and assurance, packaging, and distribution (Shackelford et al., 2004). The changes
are noticed in many fields because there is an increasing demand from the consumers and the media for optimal quality, consistency,
safety, animal welfare, and environmental issues.
Many different methods for measuring meat quality traits are available which are based on different principles, procedures, and/or
instruments. Over the past few years, a number of methods have been developed to objectively measure meat quality traits
(Abouelkaram et al., 1997, 2006; Liu et al., 2003; Shackelford et al., 2005; Vote et al., 2003). One of these methods is the imaging
technique that has been applied for visual evaluation of meat quality. On the other hand, the spectroscopic technique is finding
increasing use owing to its rapidity, simplicity, and safety, as well as its ability to measure multiple attributes simultaneously without
monotonous sample preparation. However, the spectroscopic technique alone is not able to provide some fundamental information
where demonstration of the spatial distribution of quality parameters is essential. Hyperspectral imaging has thus emerged to integrate
both the spectroscopic and imaging techniques for providing spectral and spatial information simultaneously to cope with the
increasing demand for safe foods. Hyperspectral imaging technique is an upcoming and promising field of research for non-
www.greenchemistry.in                                                                                                                 130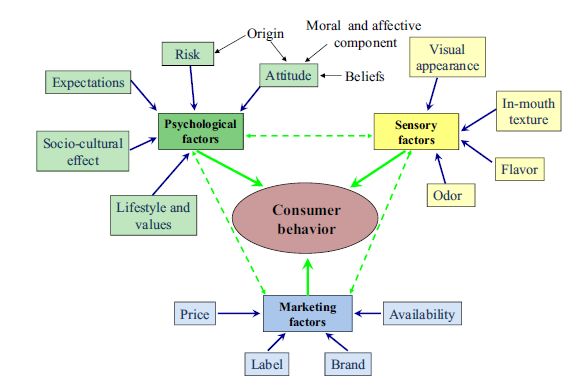
Green Chemistry & Technology Letters
                                                                                                 Vol 2, No 3, June 2016, pg. 127-137
                                                                                       eISSN: 2455-3611, DoI: 10.18510/gctl.2016.232

destructive quality assessment of agricultural and food products including meat (Cluff et al., 2008; Naganathan et al., 2008a, 2008b).
In recent years, there has been growing interest in this technology from researchers around the world. The main impetus for
developing hyperspectral imaging system is to integrate spectroscopy and imaging techniques to make direct identification of different
components and their spatial distribution in the tested sample. The commercial growth of hyperspectral imaging lies in its ability to
solve some application problems, such as those associated with industrial process monitoring and control, diagnosis, inspection, and
quality-related assessments. Although this technology has not yet been sufficiently exploited in meat processing lines and quality
assessment, its potential is promising. In contrast to conventional methods for the determination of meat quality parameters, the
hyperspectral imaging technique is a sensitive, fast, and non-destructive analytical technique with simplicity in sample preparation
allowing simultaneous assessment of numerous meat properties. For instance, hyperspectral imaging can be used to identify a
particular type of meat (Qiao et al., 2007a, 2007b), as some meat (species, cuts or grades) are more valuable for the consumers than
others (Alomar et al., 2003). Some other key potential applications include overall inspection and disease detection in different meat
products (Chau et al., 2009; Kim et al., 2004;Wold et al., 2006). In addition, hyperspectral imaging can be used as an authentication
tool in order to prevent fraud as well as to estimate chemical composition with acceptable accuracy and even to detect handling
aspects of the product. Therefore, developing a quality evaluation system based on hyperspectral imaging technology to assess meat
quality parameters and to ensure its authentication would bring economic benefits to the meat industry by increasing consumer
confidence in the quality of the meat products. In this chapter an overview of the current meat quality assessment techniques is
provided with an emphasis on hyperspectral imaging method. In particular, latest research results on using hyperspectral imaging
technology for assessing quality of red meat (beef, lamb, and pork) and white meat (poultry and fish) will be highlighted and
described in more detail.
Hyperspectral imaging technique may be defined as : it is a technique that generates a spatial map of spectral variation, making it a
useful tool in many applications. (ElMasry & Sun 2010) or Hyperspectral imaging which was originally developed for remote sensing
applications can be used to obtain spectral and spatial information of an object over the ultraviolet, visible, and near-infrared spectral
regions (300 nm–2,600 nm)(Bannon, 2009) or an upcoming and promising field of research for non-destructive quality assessment of
agricultural and food products including meat (Cluff et al., 2008; Naganathan et al., 2008a, 2008b).
A typical hyperspectral imaging system mainly consists of a spectrograph, a camera with lens, an illumination unit, a moving table
driven by a motor and a computer installed with image acquisition software (Figure 2). By scanning with such system, a hyperspectral
image of a food product is acquired and used as a basis for further product quality evaluation and assessment. The hyperspectral image
is a three-dimensional (3-D) “hypercube” or “datacube” (x, y, λ), in which (x, y) represents two-dimensional (2-D) spatial information
and λ represents one-dimensional spectral information. The 3-D “hypercube” can be described either as 2-D images (x, y) at each one-
dimensional wavelength (λ) or as spectra (λ) at every image pixel (x, y) (Sun, 2010). As an example, a salmon fillet was first placed on
the moving table of hyperspectral imaging system (900–1700 nm) to be scanned at a speed of 2.8 cm/s line by line using 10 ms
exposure time to create a hyperspectral image shown in Figure 3. The raw hyperspectral image of the salmon fillet is comprised of a
series of contiguous spatial sub-images (x, y) at every individual wavelength (λ) . Each sub-image presents the spatial distribution of
spectral information at each wavelength. At a certain wavelength, spectral intensity at different locations within an image reflects the
different light absorption, which is due to the different distribution of salmon flesh compositions and is difficult to be observed in
RGB image. With such spectral and spatial information, some physiochemical compositions of salmon flesh such as moisture (He, et
al., 2013), fat (Segtnan et al., 2009), tenderness (He et al.,2014a), pH (He et al., 2014b) and color (Wu et al., 2012) can be
quantitatively predicted and visually observed simultaneously, which however cannot be realized by spectroscopy or imaging
technique alone.

www.greenchemistry.in                                                                                                                 131
Green Chemistry & Technology Letters
Vol 2, No 3, June 2016, pg. 127-137
eISSN: 2455-3611, DoI: 10.18510/gctl.2016.232
Figure 2: Key steps in the full procedure of selecting feature wavelengths for designing multispectral systems (Kamruzzaman,
2016)
Figure 3: Configuration of a typical hyperspectral imaging system (He and Sun, 2015)
www.greenchemistry.in 132Green Chemistry & Technology Letters
Vol 2, No 3, June 2016, pg. 127-137
eISSN: 2455-3611, DoI: 10.18510/gctl.2016.232
USAGE AND APPLCATIONS OF HYPERSPECTRAL IMAGING IN MEAT AND MEAT PRODUCTS
Lately, while the popularity of hyperspectral imaging is increasing, this also caused attract attention for some big companies. Before
this, there were only a few companies can design the system. It was a difficulty for both researchers and meat industry. But today,
there are several companies that provide to build the system.
Another issue about this technology is configuring the system. It might be difficult to configure the system for the products. But
recently, so many studies are available to help people which system and configuration is suitable for their purpose. The factors that
directly associated with the system are the true camera type, spatial resolution, calibration method and spectrograph.
Some of recently studied are summarized and it would be necessary to investigate all of studies deeply to understand the system.
Cheng et al., (2016) studied on a freshness prediction of grass carp fish fillet by using multispectral imaging system. They used
successive projections algorithm (SPA) and genetic algorithm (GA) for the purpose of getting highly information from the samples to
predict the freshness. In the study, researchers were used five different wavelengths (432, 550, 660, 820, 965 nm) for the SPA and six
different wavelengths (435, 565, 660, 815, 870, 970 nm) for GA. As a result of their study, the developed real-time and on-line
multispectral imaging system was feasible and practical in quality evaluation and control of grass carp by a successful prediction of
TVB-N, TBARS and K value.
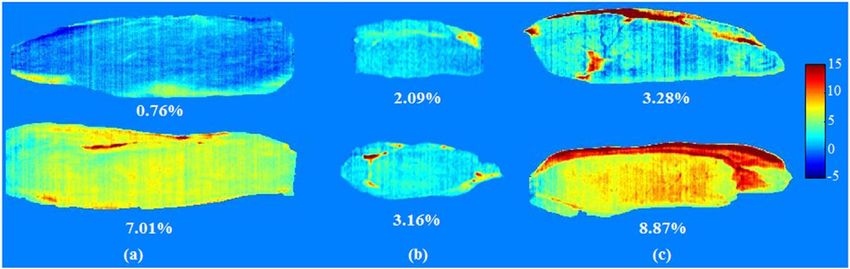
In another study, predicting water holding capacity is purposed by using the hyperspectral imaging system in red meat. The used
spectral range was 400-1000 nm to getting information from red meat samples. They developed an algorithm that was used for the
sample images. As in seed in Figure 4., researchers showed some distribution maps of the tested samples. The recommendation of the
researchers were WHC may be predicted successfully by using eight wavelengths (545, 610, 705, 765, 805, 900, 940, and 970 nm)
and this can be modified by low cost (Kamruzzaman et al. 2016a).
Figure 4: Prediction maps of WHC for (a) beef, (b) lamb, and (c) pork. The value in the bottom of each prediction map
represents the average value of WHC of the sample (Kamruzzaman et al. 2016a)
Antonio et al. (2016) studied on four different lamb muscle (Longissimus dorsi, Psoas major, Semimembranosus and Semitendinosus)
discrimination which is important for the meat industry due to price by using hyperspectral imaging system. The used spectral range
was 380 – 1028 nm. They compared various machine learning algorithms. They mainly aimed for muscle classification and gained
correct classifies at a ratio of 96.67% in the 30 samples. It also indicated that the Artificial Neural Networks, namely the linear Least
Mean Squares (LMS) was the most successful method when it compared with other 6 machine learning algorithms.
Khulal et al. (2016) also studied on prediction of total volatile basic nitrogen (TVB-N) content in chicken using hyperspectral
imaging (HSI) technique. In order to achieve high accuracy and success they also used and combined different data dimension
reduction algorithms. Researchers used Principle component analysis (PCA) and Ant Colony Optimization (ACO) for data dimension
reduction and the back propagation artificial neural network (BPANN) algorithm for modeling. They indicated that HSI integrating
spectral and spatial information may have a high potential in quantifying TVB-N content of chicken.
In another study of Kamruzzaman et al. (2016b) the real-time monitoring of moisture in red meat by using hyperspectral imaging was
purposed. The used spectral range was again 400-1000 nm. They selected 10 wavelengths (440, 480, 575, 620, 655, 680, 725, 780,
www.greenchemistry.in 133Green Chemistry & Technology Letters
Vol 2, No 3, June 2016, pg. 127-137
eISSN: 2455-3611, DoI: 10.18510/gctl.2016.232
955, from the full spectral range of 121 wavelengths. As an important part of success indicator, an on-line image was showed in
Figure 5. They indicated that the multiple linear regression (MLR) model is suitable in predicting moisture content, with R2p of 0.97.
Figure 5: Prediction maps of moisture content for (a) beef, (b) lamb, and (c) pork. The value in the bottom of each prediction
map represents the average percentage of moisture content of the sample (Kamruzzaman et al. 2016b)
A similar study was conducted by Ma et al. (2016) which aimed to predict moisture content in pork samples prepared in different
conditions including fresh, frozen–thawed, heated– dehydrated and brined–dehydrated by using HSI techniques. They obtained good
results for the optimized partial least square regression (PLSR) model (R2P= 0.952) and the optimal wavelengths selected by
regression coefficients (R2P = 0.966).
DISCUSSION AND CONCLUSIONS
It‟s estimated that there are more than 370 articles published in SCI or SCI-Expanded Journals that are related to using hyperspectral
imaging (HSI) for evaluating meat and meat products. When additional indexed journals are taken into account, these estimates
increase to more than one thousand. Until 2010, there were less than 70 of these types of related publications, showing this technology
is rapidly garnering attention from researchers. Such attention can be attributed to its high efficiency in procuring results, while
maintaining low production and analytical costs. Likewise, its ability to be easily operated provides a healthier and safer work
environment, an advantage that cannot be overlooked.
The use of hyperspectral imaging creates a near perfect database for each food item. When the HSI system is used in conjunction with
food production systems, the quality of the data stored is by far superior to the randomly analyzed sampled method.
As previously mentioned, the growing trend of “low-meat consumption” is in part due to health concerns, but equally so, due to
financial reasons. Meat is one of the most important and essential food sources for people and there is yet be evidence that high quality
and wholesome meat or meat products cause a health risk for individuals. On the contrary, it is of extraordinary importance especially
for children under 15 years of age in developing countries. The trend of low-meat consumption grew as a result of food commodities,
including meat and meat products, having always been vulnerable to fraudulent admixture or adulteration with cheaper inferior
materials. In this context, there is an interesting difference between developing and developed countries. The consumers who live in
richer and developed countries have the option of choosing locally produced food products which is considered a safer alternative. In
contrast, people who live in the poorer or developing countries, have limited selections and often resort to buying food which are
produced by a popular company or brand name they trust, given that these foods are safer than those produced locally. It is clear that
the concern of food safety for the consumer is being increased day by day when we consider that their knowledge is mostly based on
what they learned from their family members, internet, the media (television, radio and newspapers), and occasionally from
government publications.
There are many aspects of this issue to still be considered. The Hyperspectral Imaging System in comparison to other alternatives,
may be the most efficient and adaptable to solving these issues. Hence, its technology is suitable for not only in large production
www.greenchemistry.in 134Green Chemistry & Technology Letters
Vol 2, No 3, June 2016, pg. 127-137
eISSN: 2455-3611, DoI: 10.18510/gctl.2016.232
systems, but furthermore for smaller systems including, mobile phones. Its application will revolutionize the food industry in near the
future.
REFERENCES
1. Antonio, J. et al., 2016. Lamb muscle discrimination using hyperspectral imaging : Comparison of various machine learning
algorithms. Journal of Food Engineering, 174, pp.92–100. Available at: http://dx.doi.org/10.1016/j.jfoodeng.2015.11.024.
2. Abouelkaram, S., Berge, P., & Culioli, J. (1997). Application of ultrasonic data to classify bovine muscles. Proceedings of
IEEE Ultrasonics Symposium, 2, 1197–1200.
3. Abouelkaram, S., Chauvet, S., Strydom, P., Bertrand, D., & Damez, J. L. (2006). Muscle study with multispectral image
analysis. In Declan Troy (Ed.), Proceedings of the 52nd International Congress of Meat Science and Technology (pp. 669–
670). Wagening: Wageningen Academic Publishers.
4. Alomar, D., Gallo, C., Castan˜eda, M., & Fuchslocher, R. (2003). Chemical and discriminant analysis of bovine meat by near
infrared reflectance spectroscopy (NIRS). Meat Science, 63, 441–450.
5. Bannon, D. 2009. Hyperspectral imaging: Cubes and slices. Nat. Photon. 3, 627.
6. Banović, M., Aguiar Fontes, M., Barreira, M. M., & Grunert, K. G. (2012). Impact of product familiarity on beef quality
perception. Agribusiness, 28, 157–172.
7. Banović, M., Grunert, K. G., Barreira, M. M., & Aguiar Fontes, M. (2009). Beef perception at the point of purchase: A study
fromPortugal. Food Quality and Preference, 20, 335–342.
8. Bredahl, L., Grunert, K. G., & Fertin, C. (1998). Relating consumer perception of pork quality to physical product
characteristics. Food Quality and Preference, 9, 273–281.
9. Chao, K.; Chen, Y.R.; Early, H.; Park, B. (1999) Color image classification systems for poultry viscera inspection. Appl.
Eng. Agric., 15, 363–369.
10. Chau, A., Whitworth, M., Leadley, C., & Millar, S. (2009). Innovative sensors to rapidly and non-destructively determine
fish freshness. Seafish Industry Authority. Report No. CMS/REP/110284/1. References 233
11. Cheng, J. et al., 2016. Developing a multispectral imaging for simultaneous prediction of freshness indicators during
chemical spoilage of grass carp fish fillet. Journal of Food Engineering. Available at:
http://dx.doi.org/10.1016/j.jfoodeng.2016.02.004.
12. Cimander, C., Carlsson, M., & Mandenius, C. F. (2002). Sensor fusion for on-line monitoring of yoghurt fermentation.
Journal of biotechnology, 99(3), 237-248.
13. Cluff, K., Naganathan, G. K., Subbiah, J., Lu, R., Calkins, C. R., & Samal, A. (2008). Optical scattering in beef steak to
predict tenderness using hyper- spectral imaging in the VIS-NIR region. Sensing and Instrumentation for Food Quality and
Safety, 2, 189–196.
14. Cruz, J.; Bautista, M.; Amigo, J.M.; Blanco, M. (2009), Nir-chemical imaging study of acetylsalicylic acid in commercial
tablets. Talanta, 80, 473–478.
15. Davies, S. (2014). Measurement of crispness in food products using acoustic-mechanical techniques: a literature review.
16. Delgado, C. L. (2003). Rising consumption of meat and milk in developing countries has created a new food revolution. The
Journal of Nutrition, 133(11), 3907S-3910S.
17. ElMasry, G. & Sun, D., 2010. Principles of Hyperspectral Imaging Technology. Hyperspectral Imaging for Food Quality
Analysis and Control, pp.3–43.
18. FAO, U. (2014). FAOstat. Retrieved Feb, 2014.
19. FAO 2015, accessed 05.02.2016, http://www.fao.org/ag/againfo/themes/en/meat/home.html
20. Faucitano, L.; Huff, P.; Teuscher, F.; Gariepy, C., 2005, Wegner, J. Application of computer image analysis to measure pork
marbling characteristics. Meat Sci., 69, 537–543.
21. Font-i-Furnols, M. & Guerrero, L., 2014. Consumer preference, behavior and perception about meat and meat products: An
overview. Meat Science, 98(3), pp.361–371. Available at: http://dx.doi.org/10.1016/j.meatsci.2014.06.025.
22. Food And Agricalture Organization of United States (FAO), Current Worldwide Annual Meat Consumption per capita,
Livestock and Fish Primary Equivalent. (2013).
23. Garcia-Allende, P.B.; Conde, O.M.; Mirapeix, J.; Cobo, A., 2008, Lopez-Higuera, J.M. Quality control of industrial
processes by combining a hyperspectral sensor and fisher's linear discriminant analysis. Sens. Actuators B Chem., 129, 977–
984.
24. Gendrin, C.; Roggo, Y.; Collet, C. 2007. Content uniformity of pharmaceutical solid dosage forms by near infrared
hyperspectral imaging: A feasibility study. Talanta, 73, 733–741.
25. Ghasemi-Varnamkhasti, M., Mohtasebi, S. S., Siadat, M., & Balasubramanian, S. (2009). Meat Quality Assessment by
Electronic Nose (Machine Olfaction Technology). Sensors (Basel, Switzerland), 9(8), 6058–6083.
http://doi.org/10.3390/s90806058
www.greenchemistry.in 135Green Chemistry & Technology Letters
Vol 2, No 3, June 2016, pg. 127-137
eISSN: 2455-3611, DoI: 10.18510/gctl.2016.232
26. Goetz, A.F.H.; Vane, G.; Solomon, J.E.; Rock, B.N., 1985, Imaging spectrometry for earth remote-sensing. Science, 228,
1147–1153.
27. He, H. J., & Sun, D. W. (2015). Hyperspectral imaging technology for rapid detection of various microbial contaminants in
agricultural and food products.Trends in Food Science & Technology, 46(1), 99-109.
28. He, H.-J., Wu, D., & Sun, D.-W. (2013). Non-destructive and rapid analysis of moisture distribution in farmed Atlantic
salmon (Salmo salar) fillets using visible and near-infrared hyperspectral imaging. Innovative Food Science & Emerging
Technologies, 18, 237e245.
29. He, H.-J.,Wu, D., & Sun, D.-W. (2014a). Potential of hyperspectral imaging combined with chemometric analysis for
assessing and visualising tenderness distribution in raw farmed salmon fillets. Journal of Food Engineering, 126, 156e164.
30. He, H.-J., Wu, D., & Sun, D.-W. (2014b). Rapid and non-destructive determination of drip loss and pH distribution in farmed
Atlantic salmon (Salmo salar) fillets using visible and near-infrared (ViseNIR) hyperspectral imaging. Food Chemistry, 156,
394e401.
31. Huang, H., Liu, L. & Ngadi, M., 2014. Recent Developments in Hyperspectral Imaging for Assessment of Food Quality and
Safety. Sensors, 14(4), pp.7248–7276. Available at: http://www.mdpi.com/1424-8220/14/4/7248/.
32. Huang, H.; Liu, L.; Ngadi, M.O.; Gariepy, C. 2013a. Prediction of pork marbling scores using pattern analysis techniques.
Food Control, 31, 224–229.
33. Huang, M.; Wan, X.; Zhang, M.; Zhu, Q. 2013b. Detection of insect-damaged vegetable soybeans using hyperspectral
transmittance image. J. Food Eng., 116, 45–49.
34. Kamruzzaman, M., ElMasry, G., Sun, D. W., & Allen, P. (2012). Non-destructive prediction and visualization of chemical
composition in lamb meat using NIR hyperspectral imaging and multivariate regression. Innovative Food Science &
Emerging Technologies, 16, 218-226.
35. Kamruzzaman, M., Makino, Y. & Oshita, S., 2016a. LWT - Food Science and Technology Hyperspectral imaging for real-
time monitoring of water holding capacity in red meat. LWT - Food Science and Technology, 66, pp.685–691. Available at:
http://dx.doi.org/10.1016/j.lwt.2015.11.021.
36. Kamruzzaman, M., Makino, Y. & Oshita, S., 2016b. Parsimonious model development for real-time monitoring of moisture
in red meat using hyperspectral imaging. Food Chemistry, 196, pp.1084–1091. Available at:
http://dx.doi.org/10.1016/j.foodchem.2015.10.051.
37. Kim, I.; Kim, M.; Chen, Y.; Kong, S. 2004. Detection of skin tumors on chicken carcasses using hyperspectral fluorescence
imaging. Trans. Am. Soc. Agric. Eng., 47, 1785–1792.
38. Khulal, U. et al., 2016. Nondestructive quantifying total volatile basic nitrogen ( TVB-N ) content in chicken using
hyperspectral imaging ( HSI ) technique combined with different data dimension reduction algorithms. , 197, pp.1191–1199.
39. Lara, M.A.; Lleó, L.; Diezma-Iglesias, B.; Roger, J.M.; Ruiz-Altisent, M. 2013. Monitoring spinach shelf-life with
hyperspectral image through packaging films. J. Food Eng., 119, 353–361.
40. Lim, K. S., & Barigou, M. (2004). X-ray micro-computed tomography of cellular food products. Food research international,
37(10), 1001-1012.
41. Liu, Y., Lyon, B. G., Windham, W. R., Realini, C. B., Pringle, T. D. D., & Duckett, S. (2003). Prediction of color, texture,
and sensory characteristics of beef steaks by visible and near infrared reflectance spectroscopy: a feasibility study. Meat
Science, 65, 1107–1115.
42. Lu, J.; Tan, J.; Shatadal, P.; Gerrard, D.E. 2000. Evaluation of pork color by using computer vision. Meat Sci., 56, 57–60.
43. Ma, J., Sun, D. & Pu, H., 2016. Spectral absorption index in hyperspectral image analysis for predicting moisture contents in
pork longissimus dorsi muscles. , 197, pp.848–854.
44. Mann, N. (2000). Dietary lean red meat and human evolution. European Journal of Nutrition, 39(2), 71-79.
45. Marcone, M. F., Wang, S., Albabish, W., Nie, S., Somnarain, D., & Hill, A. (2013). Diverse food-based applications of
nuclear magnetic resonance (NMR) technology. Food Research International, 51(2), 729-747.
46. McAfee, A. J., McSorley, E. M., Cuskelly, G. J., Moss, B. W., Wallace, J. M., Bonham, M. P., & Fearon, A. M. (2010). Red
meat consumption: An overview of the risks and benefits. Meat science, 84(1), 1-13.Antonio, J. et al., 2016. Lamb muscle
discrimination using hyperspectral imaging : Comparison of various machine learning algorithms. Journal of Food
Engineering, 174, pp.92–100. Available at: http://dx.doi.org/10.1016/j.jfoodeng.2015.11.024.
47. Naganathan, G. K., Grimes, L. M., Subbiah, J., Calkins, C. R., Samal, A., & Meyer, G. E. (2008a). Visible/near-infrared
hyperspectral imaging for beef tenderness prediction. Computers and Electronics in Agriculture, 64(2), 225–233.
48. Naganathan, G. K., Grimes, L. M., Subbiah, J., Calkins, C. R., Samal, A., & Meyer, G. E. (2008b). Partial least squares
analysis of near-infrared hyper- spectral images for beef tenderness prediction. Sensing and Instrumentation for Food Quality
and Safety, 2, 178–188.
49. Nagata, M.; Tallada, J.G.; Kobayashi, T. 2006, Bruise detection using nir hyperspectral imaging for strawberry (fragaria x
ananassa duch.). Environ. Control Biol., 44, 133.
www.greenchemistry.in 136Green Chemistry & Technology Letters
Vol 2, No 3, June 2016, pg. 127-137
eISSN: 2455-3611, DoI: 10.18510/gctl.2016.232
50. Neumann, C. G., Murphy, S. P., Gewa, C., Grillenberger, M., & Bwibo, N. O. (2007). Meat supplementation improves
growth, cognitive, and behavioral outcomes in Kenyan children. the Journal of Nutrition, 137(4), 1119-1123.
51. Osborne, B. G. 2006. Near-Infrared Spectroscopy in Food Analysis. Encyclopedia of Analytical Chemistry (Book), John
Wiley & Sons, Ltd, 2006
52. O'sullivan, M.G.; Byrne, D.V.; Martens, H.; Gidskehaug, L.H.; Andersen, H.J.; Martens, M. 2003. Evaluation of pork colour:
Prediction of visual sensory quality of meat from instrumental and computer vision methods of colour analysis. Meat Sci., 65,
909–918.
53. Park, B., Lawrence, K. C., Windham, W. R., & Smith, D. P. (2006). Performance of hyperspectral imaging system for
poultry surface fecal contaminant detection. Journal of Food Engineering, 75(3), 340-348.
54. Patel KK, Kar A, Jha SN, Khan MA. 2012, Machine vision system: a tool for quality inspection of food and agricultural
products. Journal of food science and technology.;49(2):123-141. doi:10.1007/s13197-011-0321-4.
55. Qiao, J., Ngadi, M. O., Wang, N., Gariepy, C., & Prasher, S. O. (2007a). Pork quality and marbling level assessment using a
hyperspectral imaging system. Journal of Food Engineering, 83(1), 10–16.
56. Qiao, J., Ngadi, M.,Wang, N., Gunenc, A., Monroy, M., Gariepy, C., & Prasher, S. (2007b). Pork quality classification using
a hyperspectral imaging system and neural network. International Journal of Food Engineering, 3(1). Article No. 6.
57. Qin, J., Ying, Y., & Xie, L. (2013). The detection of agricultural products and food using terahertz spectroscopy: A review.
Applied Spectroscopy Reviews,48(6), 439-457.
58. Segtnan, V. H., Høy, M., Lundby, F., Narum, B., & Wold, J. P. (2009). Fat distribution analysis in salmon using non-contact
near infrared interactance imaging: a sampling and calibration strategy. Journal of Near Infrared Spectroscopy, 17, 247e253.
59. Shackelford, S. D., Wheeler, T. L., & Koohmaraie, M. (2004). Development of optimal protocol for visible and near-infrared
reflectance spectroscopic evaluation of meat quality. Meat Science, 68, 371–381.
60. Shackelford, S. D., Wheeler, T. L., & Koohmaraie, M. (2005). On-line classification of US select beef carcasses for
longissimus tenderness using visible and near-infrared reflectance spectroscopy. Meat Science, 69(3), 409–415.
61. Sun, D.-W. (2010). Hyperspectral imaging for food quality analysis and control. San Diego, California, USA: Academic
Press/Elsevier.
62. Tan, J.L. 2004. Meat quality evaluation by computer vision. J. Food Eng., 61, 27–35.
63. Todd, E. C. (1996). Epidemiology of foodborne diseases: a worldwide review. World health statistics quarterly. Rapport
trimestriel de statistiques sanitaires mondiales, 50(1-2), 30-50.
64. Verbeke, W., De Smet, S., Vackier, I., Van Oeckel, M. J., Warnants, N., & Van Kenhove, P. (2005). Role of intrinsic search
cues in the formation of consumer preferences and choice for pork chops. Meat Science, 69, 343–354.
65. Vote, D. J., Belk, K. E., Tatum, J. D., Scanga, J. A., & Smith, G. C. (2003). Online prediction of beef tenderness using a
computer vision system equipped with a BeefCam module. Journal of Animal Science, 81, 457–465.
66. Webb, K., Rutishauser, I., Katz, T., Knezevic, N., Lahti‐Koski, M., Peat, J., & Mihrshahi, S. (2005). Meat consumption
among 18‐month‐old children participating in the Childhood Asthma Prevention Study. Nutrition & Dietetics, 62(1), 12-20.
67. West, G. E., Larue, B., Touil, C., & Scott, S. L. (2001). The perceived importance of veal meat attributes in consumer choice
decisions. Agribusiness, 17, 365–382.
68. WHO 2015, World Health Organization, Global and regional food consumption patternsand trends. Available at:
http://www.who.int/nutrition/topics/3foodconsumption/en/index4.html (2015).
69. WHO 2016http://www.who.int/mediacentre/factsheets/fs399/en/.» Food Safety. December 2015.
http://www.who.int/mediacentre/factsheets/fs399/en/ (accessed: 02 01, 2016).
70. Wold, J. P., Johansen, T., Haugholt, K. H., Tschudi, J., Thielemann, J., Segtnan, V. H., Narum, B., & Wold, E. (2006). Non-
contact transflectance near infrared imaging for representative on-line sampling of dried salted coalfish (bacalao). Journal of
Near Infrared Spectroscopy, 14(1), 59–66.
71. Wu, Di, Sun, Da-Wen, & He, Yong (Oct 2012). Application of long-wave near infrared hyperspectral imaging for
measurement of color distribution in salmon fillet. Innovative Food Science & Emerging Technologies, 16, 361e372.
72. Xing, J.; Bravo, C.; Jancsók, P.T.; Ramon, H.; de Baerdemaeker, J. 2005. Detecting bruises on „golden delicious‟ apples
using hyperspectral imaging with multiple wavebands. Biosyst. Eng., 90, 27–36.
73. Yao, H.; Hruska, Z.; Kincaid, R.; Brown, R.L.; Bhatnagar, D.; Cleveland, T.E. 2013. Detecting maize inoculated with
toxigenic and atoxigenic fungal strains with fluorescence hyperspectral imagery. Biosyst. Eng., 115, 125–135.
74. Zaragozá, P. et al., 2012. Fish freshness decay measurement with a colorimetric array. Procedia Engineering, 47, pp.1362–
1365. Available at: http://dx.doi.org/10.1016/j.proeng.2012.09.409.
75. Zheng, J., & He, L. (2014). Surface‐Enhanced Raman Spectroscopy for the Chemical Analysis of Food. Comprehensive
Reviews in Food Science and Food Safety, 13(3), 317-328.
www.greenchemistry.in 137You can also read