BUSINESS PLAN July 2019 for Acorn Farmers' Market & Café
←
→
Page content transcription
If your browser does not render page correctly, please read the page content below

BUSINESS PLAN
                                            July 2019
                                                   for
                      Acorn Farmers’ Market & Café
    A Non-Profit Store Offering Fresh, Local Food & Food Education
                           In the Manchester, MI Community

                                                 Mission.
To model a rural, community-driven market and gathering place that provides access to fresh food and supports
the economic viability of area farmers by promoting education, collaboration, and entrepreneurship.

                                  www.acornfarmersmarketcafe.org
                                  acornfarmersmarket@gmail.com

                                                      1
Executive Summary

With the closure of Manchester’s only grocery store, area residents are concerned about potential
negative impacts on our health and the Village economy. At the same time, our corner of Washtenaw
County includes a significant number of food producers seeking access to customers, and the Village is
rich in volunteer-driven organizations that support diverse community goals. Acorn Farmers’ Market
and Cafe will respond to the immediate fresh food gap by channeling available resources through its
vibrant storefront and gathering place, internet presence, administrative infrastructure, and
programming. Its activities will include: operating a fresh food store and cafe; partnering with
community organizations to develop educational programs and present events that celebrate healthy
Manchester food culture; and engaging with government, health, and academic institutions to assess
wellness impacts and to advance local food production and entrepreneurship.

Our Model. With the support from the Village of Manchester and the Manchester Farmer’s Market,
our model is based on the success of Argus Farm Stop in Ann Arbor and The Wild Ramp, a non-profit
market in Huntington, WV. Meat and produce will be provided on consignment year-round by local
farmers. A small café will bring additional revenue to offset overhead costs. The store and café will
offer fresh, healthy prepared foods. In partnership with the Community Resource Center, we will
distribute free and reduce cost products to community members in need.

Our Goals: Operate a market that sells local farm products and is open at least 6 days/week beginning
April 2020. Mobilize community networks to make fresh food attractive and accessible to more
residents. Support the economic viability of area farmers by promoting their learning, collaboration
and entrepreneurship. Develop a sustainable non-profit business model that could be replicate in
other rural communities.

Measures of success will include: increasing fresh food sales, evidence of a positive impact on
Manchester’s obesity rate, diverse community participation in educational opportunities such as
cooking classes and family food economics workshops, improved profitability as reported by
participating producers, and evidence of innovation as farmers respond directly to customers’ tastes
and needs.

Acorn will be established at 327 W. Main Street, Manchester, MI, a short walk from Manchester’s
traditional downtown, in a building that began as a gas station in the 1940’s. Today the building is
clean, solid and ready to develop:
    • A four-season greenhouse addition to seat café patrons, hold classes, meetings, etc.
    • A small commercial kitchen for prepared foods and classes
    • A landscaped patio
    • Refrigeration and display equipment

Your Part: All it takes is seed money from you! Soon Manchester’s food desert status will be
eliminated with a wonderful place to shop for fresh food to prepare healthy homemade meals.

                                                    2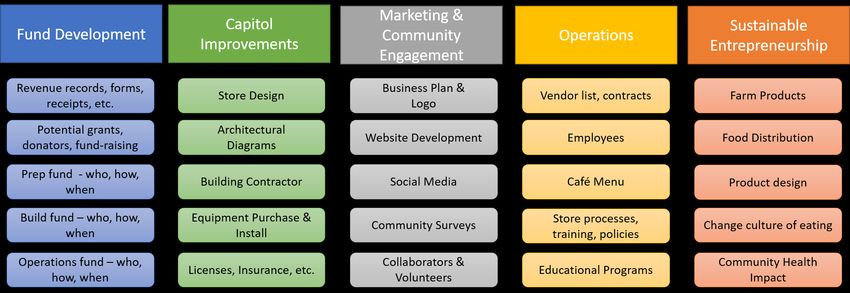
Table of Contents

 I. Food Desert Situation & Locally Grown Food Solution…….Pages 4-7

II. Acorn as a Non-Profit, 501c3 Organization……………………..Pages 7-12

III. Acorn’s Business Model, Partnerships and Marketing……Pages 12-13

IV. Acorn’s Financial Plans…………………………………………………..Pages 14-16

V. Appendix………………………………………………………………………..Pages 17-20

                                Board of Directors
                               Chair: Megan DeLeeuw
                                Vice Chair: Linda Knox
                              Secretary: Theresa Herron
                                Treasurer: Linda Davis
                                  Members at Large:
                                   Ruth VanBogelen

                                         3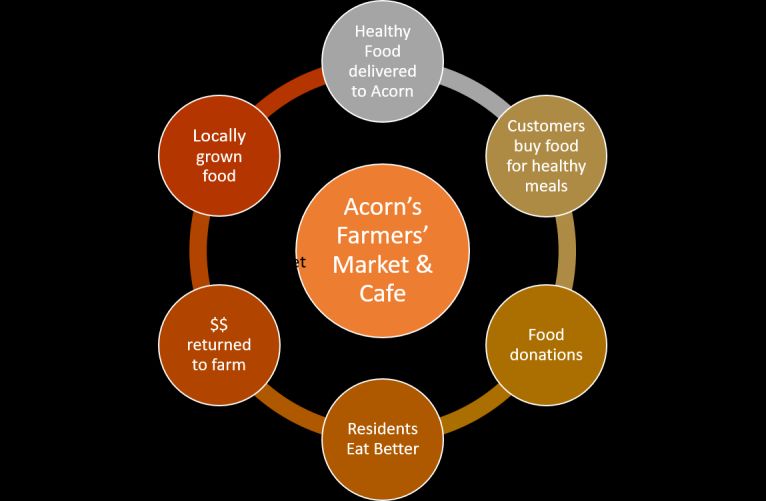
I.   FOOD DESERT SITUATION & LOCALLY GROWN FOOD SOLUTION

     A. Manchester, MI Food Desert Situation

     Technically Manchester is not a food desert because there is a grocery store closer than 10 miles (6 miles to
     Busch’s in Clinton), but when the Manchester Market closed in early February of 2019 getting groceries
     became a problem for many area residents. There is no public transportation in Manchester, MI. It is hard
     to eat healthy when there is no local source of healthy food.

      The Figure on the right, shows the distance from
      the center of Manchester to the nearest grocery
      stores.

      In the absence of a grocery store, residents turn to
      area restaurants and convenient stores for food. In
      Manchester, the offerings are two pizza places,
      three sports bars, and three other restaurants.
      None of these establishments offer any nutritional
      information about the items on their menus. The
      meals tend to be high in fat, large portion size and
      lacking in vegetables and fruits. Additionally
      residents eat more fringe foods from Dollar
      General and gas stations with no or limited healthy
      food options. Fringe foods are chips, candy and
      other foods not found on the USDA MyPlate.

     Data from other food deserts warn that health problems arise fairly quickly including weight gain leading to
     obesity, hypertension, diabetes and worse (https://science.howstuffworks.com/environmental/green-
     science/food-desert1.htm). We have data from several scientific surveys for the Manchester area implying
     the percentages of residents with these conditions is already high. Evidence Manchester residents would
     benefit from both nutrition education and improvements in their nutrition environment.
     ● 2015 Behavior Risk Factor Surveillance Survey. (data from Washtenaw County Public Health
         Department with over-sampling of Manchester residents was paid for by 5 Healthy Towns Foundation)
             o 68% of Manchester residents are overweight or obese compared to 56% overall in Washtenaw
                County
             o 34% have high blood pressure and high cholesterol compared to 22% overall in the county
             o 0% of youth and only 26% of adults consume the recommended 5 servings of fruits/vegetables
                per day
     ● 2018 Nutritional Environment Assessment Tool Survey (NEAT is a tool used by the state of Michigan)
         performed by 5 Healthy Towns Foundations yielded a score reflecting Manchester has a partially
         supportive nutritionally environment. Note this survey was done before the only grocery store closed.

                                                         4
B.      Manchester’s Farming Community – locally grown food solution

Manchester area is made up of many established and beginning farming families. A diversity of agriculture
exists within the farming community from field crops (corn/soy) and hay to food crops such as lamb, dairy
and vegetables. A new crop of farmers have been popping up around Manchester, specializing in various
food crops, tending toward natural and organic systems. These farming families rely on either international
markets for economic security or on the accessibility of customers who want to purchase directly from a
farmer. Acorn will offer a convenient local outlet for farmers to sell directly as well as experiment with
bringing new products to market and ultimately improving financial viability.

Small to medium sized farms have always struggled with economic sustainability but are intimately feeling
pressure in the current marketplace. The commodity market has recently experienced a lot of insecurity
with the loss of a guaranteed market for soybeans due to factors out of producer’s control. In Washtenaw
County, 93% of farms producing food have disappeared between 1950 and 2012. The dairy industry is one
prime example, suffering from very low prices and competition from many angles. Farms have been closing
or selling land consistently since the 1950’s due to economic pressures, development, retirement and no
succession plan, etc.

Once farms are lost, they are difficult to replace for many reasons. Farmers want to produce crops for sale
that have a market and that keep their families working the land and are willing to try innovate and invest in
new products. One such example is Horning Farm, a bicentennial dairy farm just miles from downtown
Manchester, has expressed interest in experimenting with raising and selling beef locally as a way to
diversify sales. The location of Acorn in proximity to the farm and its connection to local customers will be
perfect for this farm and allow them to find ways to increase revenue.

Similarly, many beginning farmers (defined as a farmer in their first 10 years of farming), are working to
define their specialty and crop mix as they develop skill, markets and confidence. Many of these farmers
choose to sell direct to the customer in order to retain a higher percentage of each food dollar. (Traditionally
farmers receive only 14.8 cents of each food dollar) Many of these farmers spend a high percentage of their
time and energy on direct marketing from harvest and processing, preparing, commuting (often over 20
miles away), setting up, training staff, and cleaning up after market. After much work and time invested,

                                                     5
direct sales are reliant on good weather and foot traffic for success. Direct sales at farmers markets are
unreliable as customers seek conveniences.
Acorn offers a convenient way for Manchester area food farmers to save valuable resources spent selling
directly to customers through farmers markets and allows them to expand access to a larger number of
customers through the consignment market over longer periods of time. The farmer will be able to decide
what to sell and when, set their own prices and deliver when it works best in their schedule. After delivery,
Acorn staff is responsible to displaying, maintaining and rotating stock as well as communicating to farmers
when more product is needed. Acorn staff and volunteers educate customers on seasonal product and how
to utilize the ingredients. These services take an enormous burden off of the shoulders of farmers so that
they may focus on growing and building their businesses.
C. Research into short & long term solutions for local source(s) of healthy food items
As soon as the Manchester Market grocery store announced they were closing (early January 2019) area
residents began to meet to discuss potential solutions. Two of the key points discussed were: 1) timeline to
implement a potential solution and 2) how many days a week the food store would be open. The figure
below provides a summary of the timeline for different solutions. Because an expanded farmers market
would only be open 1 day a week and likely for only 3-4 hours, this option was not as attractive as the other
options.
This figure was created by one of the BOD
members for Acorn for use in the Connected
Magazine published in April 2019
(https://www.5healthytowns.org/connected/).
Two articles have already been published in the
local weekly newspaper, The Manchester Mirror
(https://themanchestermirror.com/?s=Farm+stop&x=0&y=0 ;
https://themanchestermirror.com/?s=Acorn&x=0&y=0 ).
And articles about the DDA’s work on recruiting a
Grocery store
(https://themanchestermirror.com/?s=DDA&x=0&y=0 )and
another groups effort to explore the Food Co-op
Store and an article about extending the farmers
market or having a veggie mobile
(https://themanchestermirror.com/?s=Food+Coop&x=0&y=0
Fortunately, a study had already been completed in 2014 by Gibbs Planning Group of Birmingham, MI which
concluded that Manchester could support a 10,000 square foot traditional grocery store and a 1000-1400
square foot specialty food store. Other research suggests a specialty food store like Acorn Farmers’ Market
& Café would be sustainable are:
o Manchester has empty stores of perfect the size and location for Acorn Farmers’ Market & Café.
o Manchester is a rural community and there are many local farmers who produce fresh food that could
be sold at Acorn Farmers’ Market & Café.
o Manchester currently does not have a Café type restaurant for casual pick up of take out coffee, tea,
muffins, sandwiches and soups
6o Manchester is one of the 5 Healthy Towns supported by the 5 Healthy Towns Foundation
(www.5healthytowns.org) with annual grants to Manchester for purposes: Eat Better, Move More,
Connect with others in healthy ways and avoid unhealthy substances. They have two employees whose
role is to help the 5 towns gather necessary resources and strategies for executing programs to make
the communities increase their culture of wellness and who can assist Acorn in the Educational
programming.
o St. Joseph Mercy Chelsea Hospital is already heavily connected to our weekly Farmers Market (Thursday
afternoons, May – Oct) helping the market with SNAP, DUFB, connections to other food assistance
programs, Registered Dieticians, nurses and other professionals, who spend time at the farmers market
each summer. This connection will be transferred to Acorn once it opens.
II. ACORN AS A NON-PROFIT 501c3 ORGANIZATION
While historically, grocery stores have been for-profit businesses, the increasing number of food desert
communities have opened non-profit food stores. In some cases, existing non profits added a food store
(e.g. Salvation Army in Baltimore, MD, https://nonprofitquarterly.org/2018/03/09/salvation-armys-new-
nonprofit-grocery-stores-membership-model-surprising-twists/). During the Obama administration six
different agency with an total budget of $800,000 helped 27 communities develop a non-profit food stores.
There are many models possible (https://nonprofitquarterly.org/2016/04/01/funding-the-nonprofit-
grocery-store-a-variety-of-models-at-work/.) The model is typically a small food store, selling locally-grown
produce, meat, dairy and eggs delivered by the producer. The producers set the price and most sell their
products on consignment. Most have cafés which provide additional revenue. A good example is The Wild
Ramp in Huntington, WV a store started to fight a local obesity epidemic (see Washington Post article
from April 10, 2019, (https://www.washingtonpost.com/outlook/this-appalachian-town-was-americas-
fattest-city-heres-how-it-slimmed-down/2019/04/10/e0eb31e4-5622-11e9-814f-e2f46684196e_story.html).
On May 22, 2019, Acorn submitted Form 1023 to the IRS to receive approval to operate as a 501c3
organization. Typically, the review process takes 6 months.
As a 501c3 Acorn has three purposes:
1. To prevent health and economic deterioration in our community
2. To advance fresh food education and awareness
3. To partner with experts to design projects that could directly inform practices related to food
production, distribution and marketing in rural areas.
Below is more detail on how Acorn plans to achieve these purposes
A. To prevent health and economic deterioration in our community – operating a fresh food
store and cafe
To prevent health and economic deterioration in our community, the Acorn Farmers’ Market and Cafe will
be established at 327 Main Street -- just a short walk from our traditional downtown and adjacent to the
Village Green area in the Village. The store and cafe will offer fresh produce and prepared foods that are
provided by local producers and priced by them directly for the Manchester economy, making healthy meals
conveniently available to most community members, and supporting the local farm economy. To make the
products more accessible, we will partner with the Community Resource Center et alia to distribute free
products to community members in need (we estimate up to 25% of the food delivered to the store will be
7redistributable as it nears expiration). To further enhance accessibility and connect producers to their
customers, the storefront will host and present educational events and activities (see “Detailed Activities:
Community Education… below).
Goal: To operate a fresh food market and cafe selling local farm products to the public at least 6 days/wk
(70 - 90 hrs/wk)
Strategy: Blending the Argus and Wild Ramp models: develop a program of public and private support to
provide the physical and administrative infrastructure to sell fresh food products on consignment.
Outcomes: Baseline food sales in 2020 averaging $1282 per day and attracting 50 customers per day and
increasing sales in the following 2 years; 20 producers consigning products in 2020 and increasing to
capacity by 2021 . Twenty percent or more of food brought into the store distributed to families in need.
Personnel: Generally, the Board of Directors will: seek and manage grants and donations; acquire a
building; contract and oversee renovations; initiate relationships with producers and other partners; and
hire staff. The Store Manager will oversee operations, train employees, manage vendor relations, and
perform other daily duties. Two to four full or part time store clerks will assist the manager with all functions
of store operations including opening and closing the store. Volunteer roles (optional) may include
customer service, vendor outreach, stocking, and setting up deliveries of food donations.
Specifically, the store development will be led by Megan DeLeeuw, farm owner and chair of the board of
directors.
Funding: In addition to revenue from sales, the store will rely on support from foundations, corporations,
agencies and individuals, as modeled by The Wild Ramp. Public support will be essential for the initial start-
up expenses: building acquisition, capital improvements, and equipment purchases.
Specific Activities
Objectives:
● Organize Acorn Farmers’ Market & Cafe, Inc as a non-profit, 501(c)3. (Spring 2019)
● Develop a comprehensive fund development plan (Summer 2019)
● Host a pop-up farmers’ market at the building location 1 day/wk (Nov-Dec 2019).
● Complete all capital fundraising and build out by March 2020
● Open in April of 2020.
● Establish ongoing programs to help sustain the store’s services (Jan - Dec 2020).
. Major Activities:
● Seek grants and donations for capital improvements and partial operations (July - Dec 2019)
● Partner with the Manchester Farmer’s Market to enlist producers for the pop-up market and cafe
and promote the transition to a year-round model (July - Dec 2019).
● Build a patio, kitchen and cafe area (Jan - Apr 2020)
● Purchase and install equipment and furniture (Mar 2020)
● Schedule inspections (Mar 2020)
● Hire a store manager and 2 associates to run daily operations (Mar 2020).
B. To advance fresh food education and awareness – community engagement
Rationale: For a small community, Manchester has a strong volunteerism profile. Representatives from ten
or more organizations meet quarterly to share news and information. Collectively, they accomplish an
8annual canoe race and a community fair; run a summer farmers’ market; maintain the community’s
historical record; raise funds for schools; provide a food pantry and deliver food to residents in need; and
present music performances and art exhibitions, among many other things. Notably, 550 volunteers
participate in the annual Manchester Chicken Broil, now in it’s 65th year, cooking and serving 10,000 meals
in 4 hours each July.
Each of these organizations embodies a part of Manchester’s identity, and their members hold knowledge
and expertise relevant to our collective culture. Their purposes often intertwine, and when they come
together, food is frequently involved. Acorn Farmers’ Market and Cafe and its website can be a hotspot for
conversations, workshops, events and messaging about and around food, where the whole community
participates in content development and benefits from learning opportunities that are relevant to their lives.
Notably, we won’t be starting from scratch! Acorn will inherit a rich cache of community relationships,
educational materials, program ideas, contacts and experience developed by the Manchester Farmer’s
Market since 2005. We expect to continue a program, funded by the 5 Healthy Towns Foundation, to bring
interns from the University of Michigan School of Public Health to the farmers’ market to assist with
nutrition education, recipes, and meal planning guides. Additionally, we expect to continue Farmer’s Market
programs that bring health professionals to the community for monthly events.
To advance fresh food education and awareness, Acorn’s program may include:
● Community-sourced healthy recipe collections available in-store and online
● Meal planning guides available in-store and online
● Cooking classes and demonstrations for all ages, abilities and tastes, taught in-store or in facilities
offered by partnering organizations (e.g. commercial kitchens in churches)
● Nutrition courses taught by health professionals with topics for specific health conditions for example,
pre-diabetics, diabetics, high blood pressure, etc.
● A yearly calendar of events celebrating good food and community connections
● A weekly column in the Manchester Mirror
● A dynamic website maintaining current information about in-season items, vendors’ news, and other
timely connections, as well as access to static material.
● Social media engagement promoting program activities and materials
Goal: Mobilize community networks to make fresh food attractive and accessible to more residents.
Strategy: Partner with regional health experts and local organizations to connect residents to healthy food
through events, workshops, classes and volunteer opportunities that speak to local interests.
Outcomes: An increasing collection of healthy food learning material such as recipes, buying guides and
nutritional information available in-store and through our website; increasing participation in workshops,
cooking classes and other events; collaboration among community organizations.
Personnel: Generally, the Board of Directors will seek and manage initial grants and donations, hire a
Community Engagement Program Manager, approve ongoing grant requests, and oversee grant reporting.
The program manager will build relationships, develop project proposals, seek grants and donations, and
provide administrative support. Volunteers, interns and additional staff will be engaged as needed per
funded project.
9Specifically, health education and other activities in 2019 that partner with the Farmer’s Market will be led
by Ruth VanBogelen, the current Chair of Farmer’s Market Committee and a member of the Board of
Directors.
Funding: Grants will be sought to cover individual project costs.
Specific Activities
Objectives:
● Leverage community support for and appreciation of the existing Farmer’s Market to launch
participation in the creation of Acorn Market (July - Dec 2019)
● Attract and coordinate additional volunteer participation in program development (Sep - Dec
2019)
● Establish an ongoing program of events and activities engaging volunteers that broadly represent
the makeup of the community. (Jan - Dec 2020)
Major Activities:
● Seek grants and donations to develop the educational program (July-Dec 2019)
● Develop a web presence to promote events and distribute materials (Summer 2019)
● Populate the web with content created in collaboration with the Farmer’s Market programs
(Summer 2019)
● WIth the Farmer’s Market, host a weekly event in the store coinciding with the pop-up farmers’
market (Nov -Dec 2019)
● Hire a program manager to design and implement the ongoing educational program (Mar 2020).
● Seek ongoing program funding (March - Dec 2020)
C. To partner with experts to design projects that could directly inform practices related to food
production, distribution and marketing in rural areas – sustainable entrepreneurship research
Rationale: The Village of Manchester is a rural community in close proximity to Michigan State University
and the University of Michigan as well as to local producers (see map). A community-driven fresh food
grocery here presents an ideal location to study the intersection of rural health, local food production and
rural food culture.
Additionally, farmers in our area have a unique opportunity emerging: to sell their products on consignment
to as many as 5 small stores that have been developed following the same business model. Acorn will be
well positioned to facilitate coordination and collaboration among store owners and farmers considering
ways to optimize this new distribution environment.
Acorn’s activities with collaborators in this problem space will accomplish our purpose of advancing
education and increasing knowledge, not only for our community, but also for our more rural neighbors.
Goal: Together with expert partners, design and implement nimble research, assessment and design
projects that could directly inform practices related to food production, distribution, and marketing in rural
areas.
Strategy: Develop relationships with relevant MSU and U-M schools and colleges, regional health
organizations, government agencies, and local growers to facilitate studies in fields such as: sales analytics,
product design, small farm agricultural practices, product pricing practices, community health impacts, and
cultural change.
10Outcomes: Projects would seek to 1) improve access to farm products, increase sales of farm products
and/or increase efficiency and equity in the distribution of farm products as measurably demonstrated in
our market, or 2) measure community health impacts or cultural change related to our market’s activities.
Public participation: Studies would be discussed and results would be shared publicly through our website
or other publications (as appropriate).
Personnel: Generally, the Board of Directors will hire a Research Program Manager, approve grant requests
and oversee grant reporting. The program manager will build relationships, develop project proposals, seek
grants and donations, and provide administrative support. Science, health and business expertise will be
provided by partnering organizations. Volunteers, interns and additional staff will be engaged as needed per
funded project.
Specifically, the development of the sustainable entrepreneurship research program will be led by Linda
Knox, Sr. Assoc Librarian at the University of MIchigan and a member of the Acorn Board of Directors.
Funding: Grants will be sought to cover individual project costs.
III. Business Model & Partnerships
This diagram provides an overview of Acorn’s
business. Healthy food is delivered to Acorn from
local producers for customers to buy to prepare
healthy meals at home. Food that isn’t sold by the
sell by date is donated to the local food pantry.
Residents eat better while local producers obtain
additional revenue which allows them to increase
production and quality of food. The extras is that
Acorn will provide space for coffee and
conversation, cooking classes and advice. Finally,
Acorn helps to learn together with customers and
producers!
A. Basic Operations.
o Products for sale:
▪ a) primarily locally produced items used to prepare healthy meals, including vegetables, fruits,
meat, dairy, eggs, baked breads, baked goods – most of which will be sold on consignment.
▪ b) limited non-consignment items which have longer shelf will also be sold, including homemade
pastas, locally distributed teas, coffees, olive oils, etc.
▪ The BOD will be responsible for setting consignment rates and the Store Manager will be
responsible for assessing applications and deciding how to fill the store with a wonderful variety
fresh food
o Café Menu – will include prepared coffees, teas and other specialty beverages (smoothies, etc.),
baked goods (e.g., healthy muffins, gluten free baked goods) and a limited take out menu (e.g. soup
and sandwich of the day).
11o Tracking sales and other data – We’ll use software for tracking items sold per seller, number of
paying customers per day, and inventory.
o Sales – one stop check will be offered which accepts cash, checks, credit cards, SNAP, DUFB and
other programs cards, coins, etc.
B. Hours of operation – the plan is for Acorn to be open 6-7 days a week. The exact hours have not yet
been set, but hours of operation will be between 70-90 hours per week. We’ll survey area residents to
determine the best hours per day.
C. Key Personnel
o Store Manager – day to day operation of the store including interaction with farmers (including
pricing), directing staff and chefs, marketing, carrying out education plans.
o Chef –in addition to preparing the beverages and food items that will be for sale. This position will
prepare menus for each month so that customers know what the soup and sandwich of the day will
be in advance, determine nutritional information on items made in the store.
o Staff – friendly, knowledgeable about good ways to prepare items for sale in the store, maintain the
store to look fantastic (neat, clean, etc.), friendly with customers, well informed of educational
materials being offered by Acorn, assist customers with recipes for items available.
o Program Director – this part time position is key execute our 3rd purpose as a 501c3 organization, to
establish sustainable entrepreneurship research by partnering with experts to design projects that
could directly inform practices related to food production, distribution and marketing in rural areas.
to our non-profit status and key role is planning and implementing the nutrition education program.
This position will also survey and converse with customers and potential customers wants to ensure
the store is aligned to help the community eat better.
o Other professional services as needed will all be contract and/or hourly including legal, accounting,
marketing, janitorial, grounds-keeping
o Volunteers – we anticipate there will be many roles for volunteers. Details to be determined.
D. Partnerships
Organization Brief Description of partnership
Community CRC operates a food pantry 5 days a week for low income families and provides
Resource Center, many other support services. Producers will indicate on their application if food
Manchester MI that has reached it sell by date can be donated to CRC’s food pantry. Some
education programs may specific target the low imcome population and we’ll
rely on CRC to help guide that programming
Family Services, This organization has a monthly food distribution to low income families. They
Manchester, MI could be recipients of food past its sell by date.
Manchester Senior This organization provides lunch for seniors 2 days a week September through
Center May each year. They could also be recipients of food past its sell by date. We
also will offer to do lunch talk programs about food education.
5 Healthy Towns Their goal is to improve the culture of wellness in 5 towns including
Foundation Manchester. We’ll partner as we share the same goal. They have 2 employees
who help the communities with mission related things. We anticipate a
wonderful 2 way working relationship
St. Joseph Mercy Partnership will be lots of synergy with their community support for wellness
Chelsea and health, potential source of grants
12Manchester Village The Council has goals for supporting Healthy Communities so we share joint
Council goals. The exact partnership will evolve over the next year or so.
There are lots of other opportunities for partnerships in Manchester. For example, with Manchester
Community schools we may develop bring a farmer to class days, could work with them on nutritional
curriculum, etc. There are many volunteer organizations in Manchester that promote a healthy community
and we would be open to collaborations and partnerships around our overlapping mission and goals.
E. Marketing and promotions
Acorn Board of Directors has allocated only 1.5% of gross sales to marketing and promotions because the
marketing and promotion plan makes use of many free or low cost methods. There are three major
objectives of the marketing plan:
1. Ensure area residents are aware of what Acorn will sell and later has for sale daily.
2. Help are residents appreciate the nutritional benefits of buying and consuming locally grown food (we
know from Manchester Farmers Market surveys that area residents want to support local farmers)
3. Engage area residents in what Acorn offers – food, café, classes, etc. Basically area residents will have
input into the business!
Specifically, the marketing plan for 2019 includes:
• This business plan to communicate details of the business
• Articles in The Manchester Mirror to communicate information and updates
• Weekly column in The Manchester Mirror to share information about eating better, about food and
other related topics (started in June 2019)
• Social media – Facebook is used by many to obtain information about what is happening and thus, is
a good way to get the word out daily/weekly.
• Website – this marketing media is important if someone is searching the web or wants information
about a business (hours, contact info, history, etc.)
• Community surveys provide a way for Acorn BOD to learn what area residents are interested in. The
major locations for surveys are the Manchester Farmers Market and Manchester District Library.
•
F. Committee working toward the April 2020 store opening – many volunteers are contributing their
time to make this non-profit food store available to area residents and local
13IV. FINANCIAL PLAN
In 2019, the financial plan primarily focuses on fundraising to obtain the funds needed for start up – funds to
make changes to the building and to purchase the equipment needed to operate the business. The financial
projections for once the store is operating have also been developed. Fortunately for both start up
expenses and operating revenue and expenses Acorn has had access to financial information from Argus
Farm Stop.
A. Fundraising to Open Acorn
Based on financial data
from Argus Farm Stop, a
Profit/Loss analyses for
Acorn was developed
which projected a
fundraising need of
$200,000 to cover
expenses to prepare the
building to open the store.
Details are provided in the
Appendix below. The
Board of Directors
developed a fundraising
strategy diagramed in the
figure on the right
Prep Fund – to raise this $25K , the Fund Development committee is targeting local businesses, corporations
and local residents with donation letters and forms. The website has a Paypal link for donations and other
fund-raising projects are planned. By July 1, 2019, 20% had been raised.
Build Fund – to raise $115,000 in grants, the BOD worked with the Manchester Wellness Coalition to secure
$25,000 in grant funds from 5 Healthy Towns Foundation (can be received once 501c3 status is approved).
A grant application was submitted to Michigan Department of Agriculture and Rural Development (MDARD)
in May for $60,000. Notification for this grant will be in August 2019. Michigan Economic Development
Corporation (MEDC) offers a Placemaking grant for up to $50,000. Discussions with MEDC have determined
that Acorn fits the program and would qualify once the Village of Manchester has submitted the necessary
paperwork for businesses in Manchester to qualify. The MEDC funding has to be the last $50,000 – meaning
that all the additional funds needed have been received or pledged. Another requirement of this grant is a
crowdfunding campaign which would require matching funds ($50,000) which starts once all other
requirements have been met and which runs for 2 months. Thus, Acorn will need to have received the
$25,000 for the Prep Fund and $65,000 of the Build Fund to before initiating the crowdfunding campaign.
With the $25,000 from 5 Healthy Towns Foundation secured and about $5000 of the Prep fund already
received, Acorn only needs $60,000 more. If the MDARD grant is funded and the other $20K of the Prep
Fund is received, Acorn is ready to go with the MEDC Placemaking grant.
14Start-up Operate Fund. This $10,000 fundraising will start in early 2020.
B. Operating the Store
A detailed cash flow analysis has been developed for operating the store. The Acorn Board of
Directors were very conservative with assumptions of sales at the store which are roughly 60% of
the sales Argus Farm Stop had their first 2 years of operation. Argus is located in Ann Arbor so the
expectations are that sales in Manchester will be lower primarily because the resident population is
much lower. Overall, the cashflow is positive with a small net profit for 2020 and 2021. Once the
store is operational, the BOD will be responsible for exercising changes as need to maintain the
positive cash flow. For revenue, in addition to sales, the BOD will have opportunities to apply for
grants. For expenses, the BOD will have flexibility with employee compensation (how many hours
employees are working) depending on the volume of business and also with the consignment rate.
The current budget uses a 68% consignment (32% kept by Acorn), but this percentage could be
higher or lower depending on sales.
The food sold on consignment has a higher cost of goods (monies given back to the vendors is 68%)
than the café will have (estimated cost of goods 30%). This table below provides the sales
assumptions the BOD have made for the cash flow analysis.
Food Sales Café Sales
Number of customers per day 50 40
Sales per customer $18 $9.50
Total sales per day $900 $380
Gross Sales minus cost of goods $288 $266
Expenses. There are five categories of expenses plus depreciation for equipment. As with sales,
the cash flow analysis was based on expenses Argus had during their first couple years of operation
with adjustments for things like lease payments (lower in Manchester) and employee
compensation (fewer employees needed in Manchester. Expenses for cost of goods were
presented in the previous section. The other five categories are listed in the table below with the
percentage of the Gross sales needed to cover the expense.
Personnel 38%
Occupancy 8.1%
Operating 4.1%
Administrative 1.3%
Marketing/Promotions 1.5%
The table below provides the overview of the cash flow for 2019, 202 and 2021. The detailed cash flow is
provided in the Appendix.
152019 2020 2021
Revenue
Grants, donations $ 160,500 $ 76,500 $ 20,000
Gross sales $ 339,870 $ 464,190
COG $ (192,040) $ (264,220)
Total $ 160,500 $ 224,330 $ 219,970
Expenses
Start up expenses $ 14,875 $ 168,343
Personnel $ 111,515 $ 146,547
Occupancy $ 8,650 $ 27,479 $ 28,835
Operations $ 14,635 $ 19,111
Adminstrative $ 4,379 $ 4,438
Research Programs $ 1,800 $ 2,400
Community Engagement $ 500 $ 5,255 $ 5,326
Depreciation $ 19,220 $ 18,220
Total $ 24,025 $ 352,626 $ 224,876
Net for the year $ 136,475 $ (128,297) $ (4,906)
Ending Balance $ 136,475 $ 8,178 $ 3,272
16V. Appendix – additional detailed financial information
Acorn Farmers' Market & Café
Fixed Assets & Depreciation
Sensitivity Model
A. Acorn Fixed Assets & Depreciation Sensitivity Model
Capital Requirements Acquisition Useful Annual
Cost Life Depr/Amort
Organization Start-up Costs
Professional Services $8,200.00 10 $820.00
Additional Start-up Cost $0.00 0 $0.00
IRS Filing & Incorporation $600.00 10 $60.00
Total Amortization $8,800.00 $880.00
Fixed Assets
Commercial Kitchen & Café Equipment $26,415.00 10 $2,641.50
Refrigeration $47,391.00 10 $4,739.10
Website Design $3,000.00 3 $1,000.00
Signage $3,000.00 3 $1,000.00
POS System $5,461.00 3 $1,820.33
Additional Equipment $0.00 0 $0.00
Leasehold Improvements:
General Rennovation $43,048.00 5 $8,609.60
Electrical $5,584.00 5 $1,116.80
Plumbing $12,894.00 5 $2,578.80
Additional Leasehold Improvements $0.00 0 $0.00
Front Patio $9,050.00 5 $1,810.00
Greenhouse $18,500.00 10 $1,850.00
Total Depreciation $174,343.00 $27,166.13
Total $183,143.00 $28,046.13
17B. Cashflow analysis for 2019, 202 and 2021
Acorn FY19 PROJECTED INCOME STATEMENT May June July Aug Sept Oct Nov Dec 2019 Total
pop up 1x/week
REVENUE
Grants $500 $50,000 $25,000 $75,500
Donations $3,000 $5,000 $13,000 $500 $8,000 $50,000 $79,500
Fundraisers $1,500 $2,000 $2,000 $5,500
TOTAL Revenue $3,500 $5,000 $13,000 $500 $9,500 $0 $102,000 $27,000 $160,500
EXPENSES
Start-up Costs
Professional services $1,400 $700 $1,100 $1,000 $1,000 $1,000 $1,000 $1,000 $8,200
IRS filing and incorporation $600 $600
Website design $3,000 $3,000
signs $3,075 $3,075
Total start up costs $2,000 $700 $1,100 $4,000 $1,000 $4,075 $1,000 $1,000 $14,875
Occupancy Expenses
Rent $1,000 per 1,000 900 900 $900 900 900 900 900 7,300
Liability Insurance year of
0.4% 83 83 83 250
Repairs & Maintenance gross sales
0.4% of 0
Insurance gross
$9 persales
sq ft 150 150 300
Utilities (inc. internet/phone) per yearper
$1,000 400 400 800
Licenses & Permits year 0
Total Occupancy Expenses 1,000 900 900 900 900 983 1,533 1,533 8,650
Program Expenses
Promotion Expense
Advertising / Marketing 100 100 100 100 100 100 500
Merchandising & Promotion 0
Total Promotional Expenses 0 0 100 100 100 100 100 100 500
TOTAL EXPENSES 3,000 1,600 2,100 5,000 2,000 5,158 2,633 2,633 24,125
Net for Month 500 3,400 10,900 (4,500) 7,500 (5,158) 99,367 24,367
Ending Balance $500.00 $3,900 $14,800 $10,300 $17,800 $12,642 $112,008 $136,375
1Acorn FY20 PROJECTED INCOME STATEMENT 14-Jan 14-Feb 14-Mar 14-Apr 14-May 14-Jun 14-Jul Aug-14 14-Sep 14-Oct 14-Nov 14-Dec 2020 Total
Seasonal fluxuation assumption 75% 75% 75% 75% 75% 85% 100% 100% 100% 100% 85% 85%
INCOME
Grants $40,000 $5,000 $10,000 $10,000 $65,000
Donations $500 $500 $500 $500 $500 $500 $500 $500 $500 $500 $500 $500 $6,000
Fundraising $500 $500 $500 $500 $500 $500 $500 $1,000 $1,000 $5,500
Groceries
Customers / hour estimate 4.2 4.2 4.2 4.2 4.2 4.2 4.2 4.2 4.2
Customers / day customers
estimate 50 50 50 50 50 50 50 50 50
Sales / customer average sales $15.00 $15.00 $17.00 $20.00 $20.00 $20.00 $20.00 $17.00 $17.00
Days / sales period 29 30 29 30 29 30 29 30 29
Sales / day $750 $750 $850 $1,000 $1,000 $1,000 $1,000 $850 $850
GROSS SALES $0 $0 $0 $21,750 $22,500 $24,650 $30,000 $29,000 $30,000 $29,000 $25,500 $24,650 $237,050
COST OF GOODS SOLD 0 0 0 14,790 15,300 16,762 20,400 $19,720 20,400 19,720 17,340 16,762 161,194
• AS % OF GROSS SALES 68.00% 68.00% 68.00% 68.00% 68.00% 68.00% 68.00% 68.00% 68.00% 68.00% 68.00% 68.00% 68.00%
Café estimate
Customers / hour customers
estimate 3.3 3.3 3.3 3.3 3.3 3.3 3.3 3.3 3.3
Customer / day average sales 40.6 40.6 40.6 40.6 40.6 40.6 40.6 40.6 40.6
Sales / customer $9.00 $9.00 $9.00 $10.00 $10.00 $10.00 $10.00 $9.50 $9.50
Sales / day $365 $365 $365 $406 $406 $406 $406 $386 $386
Gross Sales $0 $0 $0 $10,597 $10,962 $10,597 $12,180 $11,774 $12,180 $11,774 $11,571 $11,185 $102,820
Cost of Goods Sold 0 0 0 3,179 3,289 3,179 3,654 $3,532 3,654 3,532 3,471 3,356 30,846
• AS % OF GROSS SALES 30.00% 30.00% 30.00% 30.00% 30.00% 30.00% 30.00% 30.00% 30.00% 30.00% 30.00% 30.00% 30.00%
GROSS SALES (Groceries & Café) $0 $0 $0 $32,347 $33,462 $35,247 $42,180 $40,774 $42,180 $40,774 $37,071 $35,835 $339,870
COG $0 $0 $0 $17,969 $18,589 $19,941 $24,054 $23,252 $24,054 $23,252 $20,811 $20,118 $192,040
GROSS GRANT & DONATIONS $40,500 $500 $500 $1,000 $1,000 $1,000 $6,000 $11,000 $11,000 $1,000 $1,500 $1,500 $76,500.00
• AS % OF GROSS SALES 56% 56% 57%
TOTAL GROSS REVENUE-ALL $40,500 $500 $500 $15,378 $15,873 $16,306 $24,126 $28,522 $29,126 $18,522 $17,760 $17,218 $224,330
EXPENSES
Start-up Costs
Interior and exterior renovations $43,048 $43,048
Electrical total $4,000 $1,584 $5,584
Plumbing $6,000 $6,894 $12,894
Refrigration $20,000 $10,000 $17,391 $47,391
Commercial kitchen $13,000 $13,415 $26,415
Front Patio $9,050 $9,050
Greenhouse $18,500 $18,500
POS system $5,461 $5,461
Contingency $0
Professional services $0
Total Start Up $73,048 $31,478 $45,317 $0 $0 $0 $0 $0 $18,500 $0 $0 $0 $168,343
$0
Personnel Costs
Store Manager (1 FTE) $39,000 3,250 3,250 3,250 3,250 3,250 3,250 3,250 3,250 3,250 3,250 32,500
Associates (coffee) $13/hr 2,000 3,016 3,120 3,016 3,120 3,016 3,120 3,016 3,120 3,016 29,560
Associates (grocery) $13/hr 2,000 3,016 3,120 3,016 3,120 3,016 3,120 3,016 3,120 3,016 29,560
Program Manager (10 months @ 0.25 of $35,000) $8,750.00 792 792 792 792 792 792 792 792 792 792 7,920
Payroll & Salary Expense 25% mgr; 8,042 10,074 10,282 10,074 10,282 10,074 10,282 10,074 10,282 10,074 99,540
Payroll Taxes & Benefits 10% Assoc 1,006 1,210 1,230 1,210 1,230 1,210 1,230 1,210 1,230 1,210 11,975
Total Personnel Costs 0 0 9,048 11,284 11,512 11,284 11,512 11,284 11,512 11,284 11,512 11,284 111,515
• AS % OF GROSS SALES 31.1% 31.5% 32.8%
Occupancy Expenses
Rent $1,000 per 900 900 900 900 900 1,000 1,000 1,000 1,000 1,000 1,000 1,000 11,500
Liability Insurance year of gross
0.4% 83 83 83 83 83 83 83 83 83 83 83 83 1,000
Repairs & Maintenance sales of gross
0.4% 0 0 0 141 141 141 141 141 141 141 141 141 1,269
Insurance sales
$9 per sq ft 0 0 0 141 141 141 141 141 141 146 141 141 1,274
Utilities (inc. internet/phone) per yearper
$1,000 953 953 953 953 953 953 953 953 953 953 953 953 11,436
Licenses & Permits year 83 83 83 83 83 83 83 83 83 83 83 83 1,000
Building Services 0
Total Occupancy Expenses 2,020 2,020 2,020 2,302 2,302 2,402 2,402 2,402 2,402 2,407 2,402 2,402 27,479
• AS % OF GROSS SALES 6.5% 6.7% 8.1%
Research Program Expenses $200 $200 $200 $200 $200 $200 $200 $200 $200 $1,800
Operating Expenses 1.25% of
Store Supplies gross of
2.0% sales
gross 0 0 0 404 418 441 527 510 527 510 463 448 4,248
Credit Card Fees sales 0 0 0 647 669 705 844 815 844 815 741 717 6,797
Trash/Baler $200/month
0.1% of gross 200 200 200 200 200 200 200 200 200 200 200 200 2,400
Bad Debt, Bank Charges sales 0 0 0 32 33 35 42 41 42 41 37 36 340
Vehicle Expense 0.25% of 0 0 0 0 0 0 0 0 0 0 0 0 0
Miscellaneous sales 0 0 0 81 84 88 105 102 105 102 93 90 850
Total Operating Expenses 200 200 200 1,364 1,405 1,469 1,718 1,668 1,718 1,668 1,535 1,490 14,635
• AS % OF GROSS SALES 4.14% 4.16% 4.31%
Administrative Expenses 0.2% of gross
Office Supplies/Postage sales of gross
0.1% 73 73 73 73 73 73 73 73 73 73 74 72 876
Dues & Subscriptions sales
0.7% of gross 37 37 37 37 37 37 37 37 37 37 37 36 438
Legal, Accounting, Consulting Fees sales
0.25% of 256 256 256 256 256 256 256 256 256 256 259 251 3,065
Travel Expenses gross sales 0
Total Administrative Expenses 365 365 365 365 365 365 365 365 365 365 371 358 4,379
• AS % OF GROSS SALES 1.0% 1.0% 1.3%
Promotion Expense 1% of gross
Advertising / Marketing sales
0.2% of gross 365 365 365 365 365 365 365 365 365 365 371 358 4,379
Merchandising & Promotion sales 73 73 73 73 73 73 73 73 73 73 74 72 876
Total Promotional Expenses 438 438 438 438 438 438 438 438 438 438 445 430 5,255
• AS % OF GROSS SALES 1.2% 1.2% 1.5%
TOTAL EXPENSES $76,071 $34,501 $57,388 $15,953 $16,222 $16,157 $16,635 $16,356 $35,135 $16,361 $16,464 $16,164 333,406
• AS % OF GROSS SALES 44.4% 45.1% 98.1%
0
DEPRECIATION/AMORTIZATION 3,000 3,044 3,044 3,044 2,000 2,044 3,044 19,220
Net for month (35,571) (34,001) (56,888) (575) (348) (2,851) 4,447 9,122 (9,053) 161 (748) (1,990)
Ending Balance 136,375 100,804 66,804 9,916 9,341 8,992 6,141 10,588 19,709 10,656 10,817 10,068 8,078
1Acorn FY21 PROJECTED INCOME STATEMENT 14-Jan 14-Feb 14-Mar 14-Apr 14-May 14-Jun 14-Jul Aug-14 14-Sep 14-Oct 14-Nov 14-Dec 2020 Total
Seasonal fluxuation assumption
INCOME
Grants $5,000 $5,000
Donations $500 $500 $500 $500 $500 $500 $500 $500 $500 $500 $500 $500 $6,000
Fundraising $500 $500 $500 $500 $500 $500 $500 $500 $500 $500 $2,000 $2,000 $9,000
Groceries
Customers / hour estimate 4.2 4.2 4.2 4.2 4.2 4.2 4.2 4.2 4.2 4.2 4.2 4.2
Customers / day customers
estimate 50 50 50 50 50 50 50 50 50 50 50 50
Sales / customer average sales $15.00 $15.00 $15.00 $15.00 $17.00 $17.00 $22.00 $22.00 $22.00 $25.00 $19.00 $19.00
Days / sales period 30 29 30 29 30 29 30 29 30 29 30 29
Sales / day $750 $750 $750 $750 $850 $850 $1,100 $1,100 $1,100 $1,250 $950 $950
GROSS SALES $22,500 $21,750 $22,500 $21,750 $25,500 $24,650 $33,000 $31,900 $33,000 $36,250 $28,500 $27,550 $328,850
COST OF GOODS SOLD 15,300 14,790 15,300 14,790 17,340 16,762 22,440 $21,692 22,440 24,650 19,380 18,734 223,618
• AS % OF GROSS SALES 68.00% 68.00% 68.00% 68.00% 68.00% 68.00% 68.00% 68.00% 68.00% 68.00% 68.00% 68.00% 68.00%
Café estimate
Customers / hour customers
estimate 3.3 3.3 3.3 3.3 3.3 3.3 3.3 3.3 3.3 3.3 3.3 3.3
Customer / day average sales 40.6 40.6 40.6 40.6 40.6 40.6 40.6 40.6 40.6 40.6 40.6 40.6
Sales / customer $9.00 $9.00 $9.00 $9.00 $9.00 $9.00 $10.00 $10.00 $10.00 $10.00 $9.50 $9.50
Sales / day $365 $365 $365 $365 $365 $365 $406 $406 $406 $406 $386 $386
Gross Sales $10,962 $10,597 $10,962 $10,597 $10,962 $10,597 $12,180 $11,774 $12,180 $11,774 $11,571 $11,185 $135,340
Cost of Goods Sold 3,289 3,179 3,289 3,179 3,289 3,179 3,654 $3,532 3,654 3,532 3,471 3,356 40,602
• AS % OF GROSS SALES 30.00% 30.00% 30.00% 30.00% 30.00% 30.00% 30.00% 30.00% 30.00% 30.00% 30.00% 30.00% 30.00%
GROSS SALES (Groceries & Café) $33,462 $32,347 $33,462 $32,347 $36,462 $35,247 $45,180 $43,674 $45,180 $48,024 $40,071 $38,735 $464,190
COG $18,589 $17,969 $18,589 $17,969 $20,629 $19,941 $26,094 $25,224 $26,094 $28,182 $22,851 $22,090 $264,220
GROSS GRANT & DONATIONS $1,000 $1,000 $1,000 $1,000 $1,000 $1,000 $6,000 $1,000 $1,000 $1,000 $2,500 $2,500 $20,000.00
• AS % OF GROSS SALES 57% 57% 57%
TOTAL GROSS REVENUE-ALL $15,873 $15,378 $15,873 $15,378 $16,833 $16,306 $25,086 $19,450 $20,086 $20,842 $19,720 $19,146 $219,970
$15,873 $15,378 $15,873 $15,378 $16,833 $16,306 $25,086 $19,450 $20,086 $20,842 $19,720 $19,146
EXPENSES
Start-up Costs $0
Personnel Costs
Store Manager (1 FTE) $39,000 3,250 3,250 3,250 3,250 3,250 3,250 3,250 3,250 3,250 3,250 3,250 3,250 39,000
Associates (coffee) $13/hr 2,808 2,808 2,808 2,808 2,808 4,680 4,680 4,680 4,680 4,680 4,680 2,808 44,928
Associates (grocery) $13/hr 2,808 4,680 4,680 4,680 4,680 4,680 4,680 4,680 2,808 38,376
Program Manager $8,750.00 729 729 729 729 729 729 729 729 729 729 730 730 8,750
Payroll & Salary Expense 25% mgr; 6,787 6,787 6,787 9,595 11,467 13,339 13,339 13,339 13,339 13,339 13,340 9,596 131,054
Payroll Taxes & Benefits 10% Assoc 878 878 878 1,158 1,346 1,533 1,533 1,533 1,533 1,533 1,533 1,159 15,493
Total Personnel Costs 7,665 7,665 7,665 10,753 12,813 14,872 14,872 14,872 14,872 14,872 14,873 10,755 146,547
• AS % OF GROSS SALES 37.1% 27.8% 31.6%
Occupancy Expenses
Rent $1,000 per 1,000 1,000 1,000 1,000 1,000 1,000 1,000 1,000 1,000 1,000 1,000 1,000 12,000
Liability Insurance year of gross
0.4% 83 83 83 83 83 83 83 83 83 83 83 83 1,000
Repairs & Maintenance sales of gross
0.4% 141 141 141 141 141 141 141 141 141 141 141 141 1,692
Insurance sales
$9 per sq ft 141 141 141 141 141 141 141 141 141 146 146 146 1,707
Utilities (inc. internet/phone) per yearper
$1,000 953 953 953 953 953 953 953 953 953 953 953 953 11,436
Licenses & Permits year 83 83 83 83 83 83 83 83 83 83 83 83 1,000
Building Services 0
Depreciation/Amortization
Total Occupancy Expenses 2,402 2,402 2,402 2,402 2,402 2,402 2,402 2,402 2,402 2,407 2,407 2,407 28,835
• AS % OF GROSS SALES 6.0% 6.2% 6.2%
Research Expenses 200 200 200 200 200 200 200 200 200 200 200 200 2,400
Operating Expenses 1.25% of
Store Supplies gross of
2.0% sales
gross 418 404 418 404 456 441 565 546 565 600 501 484 5,802
Credit Card Fees sales 669 647 669 647 729 705 904 873 904 960 801 775 9,284
Trash/Baler $200/month
0.1% of gross 200 200 200 200 200 200 200 200 200 200 200 200 2,400
Bad Debt, Bank Charges sales 33 32 33 32 36 35 45 44 45 48 40 39 464
Vehicle Expense 0.25% of 0 0 0 0 0 0 0 0 0 0 0 0 0
Miscellaneous sales 84 81 84 81 91 88 113 109 113 120 100 97 1,160
Total Operating Expenses 1,405 1,364 1,405 1,364 1,513 1,469 1,826 1,772 1,826 1,929 1,643 1,594 19,111
• AS % OF GROSS SALES 4.10% 4.12% 4.12%
Administrative Expenses 0.2% of gross
Office Supplies/Postage sales of gross
0.1% 73 73 73 73 73 73 73 73 73 73 80 77 888
Dues & Subscriptions sales
0.7% of gross 37 37 37 37 37 37 37 37 37 37 40 39 444
Legal, Accounting, Consulting Fees sales
0.25% of 256 256 256 256 256 256 256 256 256 256 280 271 3,107
Travel Expenses gross sales 0
Total Administrative Expenses 365 365 365 365 365 365 365 365 365 365 401 387 4,438
• AS % OF GROSS SALES 1.0% 1.0% 1.0%
Promotion Expense 1% of gross
Advertising / Marketing sales of gross
0.2% 365 365 365 365 365 365 365 365 365 365 401 387 4,438
Merchandising & Promotion sales 73 73 73 73 73 73 73 73 73 73 80 77 888
Total Promotional Expenses 438 438 438 438 438 438 438 438 438 438 481 465 5,326
• AS % OF GROSS SALES 1.2% 1.2% 1.1%
TOTAL EXPENSES $12,474 $12,434 $12,474 $15,523 $17,730 $19,745 $20,103 $20,049 $20,103 $20,210 20,004 15,808 206,656
• AS % OF GROSS SALES 49.9% 40.8% 44.5%
TOTAL START UP EXPENSES 0
DEPRECIATION/AMORTIZATION 2,000 2,044 3,044 2,044 2,044 2,044 5,000 18,220
Net for month 3,399 2,944 3,399 (145) (897) (5,440) 2,939 (3,643) (2,061) (1,413) (2,328) (1,662)
NET INCOME FROM OPERATIONS, GRANT &
DONATION 8,078 11,478 14,422 17,821 17,676 16,780 11,340 14,279 10,636 8,575 7,163 4,834 3,172
2You can also read