A stable start to the year - January-March 2021 - Sweco
←
→
Page content transcription
If your browser does not render page correctly, please read the page content below
Q1
                           Interim Report
                           January–March 2021
                           Sweco AB (publ)

11 May 2021

A stable start
to the year
January–March 2021
•	Net sales amounted to SEK 5,538 million (5,680)
•	EBITA amounted to SEK 540 million (630), margin 9.8 per cent (11.1)
•	EBITA increased 4 per cent year-on-year after adjustment for the substantial
   negative calendar effect in the quarter
•	EBIT amounted to SEK 523 million (615), margin 9.4 per cent (10.8)
• Net debt improved to SEK 957 million (2,225)
• Net debt/EBITDA improved to 0.5 x (1.0)
•	Profit after tax amounted to SEK 392 million (443), corresponding to
   SEK 1.10 per share (1.25)

Sweco plans and designs the sustainable communities and cities of the future. Together with our clients and the collective knowledge of our 17,500 architects,
engineers and other specialists, we co-create solutions to address urbanisation, capture the power of digitalisation and make our societies more sustainable.
Sweco is Europe’s leading engineering and architecture consultancy, with sales of approximately SEK 21 billion (EUR 2 billion). The company is listed on
Nasdaq Stockholm. This information is information that Sweco is obliged to make public pursuant to the EU Market Abuse Regulation. The information was
submitted for publication, through the agency of the contact persons, at around 07:20 CEST on 11 May 2021.
CEO comment
A stable start to the year quarter. Therefore, I am pleased to announce that we have,
as of April 12, appointed Julia Zantke as Business Area
We have started the year with solid margins and slightly
President Sweco Germany & Central Europe. Julia has
positive organic growth, despite the challenging market.
extensive international experience from the consulting and
Four out of eight Business Areas delivered double-digit
engineering industry and is an experienced leader with the
margins, with three of them well above our profitability
right skillset to lead the organisation in the right direction.
target of 12 per cent. We also saw a stable order inflow and
order book. I am pleased to see that we are winning the
Continued focus on acquisitions
right type of projects, and I am proud that Sweco plays an
important role in the sustainable transformation of society. Our strong financial position enables us to maintain a con-
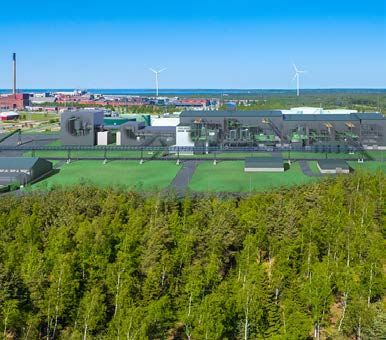
One example from this quarter is H2 Green Steel, a pioneer- tinued focus on acquisitions. In the first quarter, we acquired
ing project to develop large-scale fossil-free steel produc- BUUR, a Belgian consultancy specialised in urban planning
tion in the northern parts of Sweden. and landscape architecture. In April, we announced two
new acquisitions: Gaia Consulting, one of the leading sus-
The pandemic is still impacting growth tainability consultancies in Finland with 60 employees;
and Linja Arkkitehdit, an architecture firm with 60 experts
– financial position remains strong on the design of educational establishments and residential
We delivered a slightly positive organic growth, adjusted and business premises.
for the negative calendar effect. Net Sales amounted to
SEK 5,538 million (5,680) in the quarter. Belgium, Denmark, Well-diversified business model
Germany & Central Europe and the Netherlands delivered
provides stability
positive organic growth in the quarter. Continued pandemic-
related lockdowns and restrictions still have a significant Our broad geographical footprint, well-diversified offering,
impact on our growth, primarily in Norway and the UK. balanced mix of public and private clients, and decentral-
Restrictions and market uncertainty also adversely ised business model with focus on small and medium-sized
affected our recruiting and FTE growth. projects provides stability. This is a strength that has served
us well over time, and it has continued to do so throughout
EBITA amounted to SEK 540 million (630), with an EBITA the pandemic, including the first quarter of this year.
margin of 9.8 per cent (11.1). There is a substantial negative
calendar effect in the quarter and, after adjustment for this Looking ahead, our focus is to execute on our strategy to
effect, EBITA increased 4 per cent. The improvement was deliver profitable growth. We continue to implement the
driven by reduced absence, cost reductions and higher Sweco model in all Business Areas and to work closely with
average fees. our clients.
Sweden, Finland and Belgium all continued to deliver good
margins in the quarter. The Netherlands managed a signifi-
cant uplift in profitability and an all-time high margin of
13.8 per cent. Sweco Netherlands has taken significant
steps in their implementation of the Sweco model. This is
a gradual process, and our focus remains on fully imple-
menting the Sweco model in all Business Areas.
We maintain a strong financial position with stable cash
flow and low net debt, giving us flexibility and allowing us
to act on opportunities.
New leadership in Germany
As previously announced, a change in leadership in Ger-
many is an important part of our plan for returning to profit- Åsa Bergman
able growth in Germany after the write-down in the fourth President and CEO
Sweco AB (publ) Interim Report January–March 2021 2Europe’s leading
architecture
and engineering
consultancy
Urbanisation, digitalisation and sustainability are transforming
society. Together with our clients, we are committed to ensuring
that we have clean water, clean air, clean energy and a physical
environment where we all can live, work and prosper. With more
than 17,500 experts in Europe, we have the knowledge to solve
the most challenging projects, no matter size or location.
Key figures
#1 8 17,500
In the European Business Areas Full-time
market employees
SEK SEK
20.7 bn 1.7 bn 8.1%
Net sales R12 EBITA R12 EBITA margin R12
Sweco AB (publ) Interim Report January–March 2021 3Group performance
EBITA increased approximately 4 per cent or SEK 26 million year-on-year after
adjustment for calendar effects. Organic growth was slightly positive after adjust-
ment for calendar effects. Acquired growth amounted to 2 per cent.
January–March EBITA increased approximately 4 per The quarter had 13 fewer working
cent or SEK 26 million year-on-year hours compared with the same period
Net sales decreased 3 per cent to SEK
after adjustment for calendar effects. last year. This corresponded to a neg-
5,538 million (5,680). Organic growth
The EBITA improvement was attribut- ative year-on-year impact of approxi-
amounted to approximately 0 per cent
able to the Netherlands, Belgium, mately SEK 115 million on net sales
after adjustment for calendar effects.
Denmark and Sweden. Overall for the and EBITA.
Acquired growth amounted to 2 per
Group, the EBITA improvement was
cent and currency effects impacted The billing ratio was stable at 73.6 per
primarily driven by less absence,
growth with -3 per cent. cent (73.6).
lower operating expenses and higher
Organic growth adjusted for calendar average fees. The contribution from Total net financial items improved to
effects was slightly positive, driven acquisitions also had a positve SEK -18 million (-38), primarily due to
mainly by less absence and higher impact. Cost savings, mainly related positive foreign exchange effects and
average fees while lower subconsult- to Covid-19, had a positive impact on lower interest expenses, both related
ant revenue impacted negatively. EBITA of approximately SEK 60 million. to leasing and borrowing.
EBITA decreased to SEK 540 million At the end of the period, around 70 Earnings per share decreased to
(630). The EBITA margin decreased employees were on temporary lay-off. SEK 1.10 (1.25).
to 9.8 per cent (11.1). The majority of these were in the UK.
Jan–Mar Jan–Mar Apr 2020– Full-year
KPIs 2021 2020 Mar 2021 2020
Net sales, SEK M 5,538 5,680 20,716 20,858
Organic growth, % -2 4 -1
Acquisition-related growth, % 2 7 4
Currency, % -3 1 -2
Total growth, % -3 11 1
Organic growth adj. for calendar, % 0 4 -2
Organic growth adj. for calendar & IAC, % 0 4 -1
EBITA excl. IAC, SEK M1 540 630 1,967 2,056
Margin,% 9.8 11.1 9.4 9.7
EBITA, SEK M1 540 630 1,677 1,766
Margin, % 9.8 11.1 8.1 8.5
Profit after tax, SEK M 392 443 1,242 1,293
Earnings per share, SEK2 1.10 1.25 3.49 3.64
Number of full-time employees 17,628 17,330 17,402 17,328
Billing ratio, % 73.6 73.6 74.2 74.3
Normal working hours 487 500 1,961 1,974
Net debt/EBITDA, x3 0.5 1.0 0.5
1) EBITA is an alternative performance measure (APM) defined as Earnings before Interest, Taxes and Acquisition-related items, under which all leases are treated as operating leases and the total
cost of the lease affects EBITA. For further information, see pages 18 and 20. IAC stands for Items affecting comparability, see definition on page 18.
2) Due to the share split conducted during Q4 2020, historical data has been restated in accordance with IAS 33.
3) Net debt/EBITDA is an alternative performance measure (APM). Net debt is an alternative performance measure (APM) defined as financial debt (comprised almost exclusively of interest-bearing
bank debt) less cash and cash equivalents and short-term investments. Lease liabilities are excluded from Net debt. EBITDA is an alternative performance measure (APM) defined as Earnings
before Interest, Taxes, Depreciation & amortisation and Acquisition-related items, under which all leases are treated as operating leases and the total cost of the lease affects EBITDA. For further
information, see pages 18 and 27.
Sweco AB (publ) Interim Report January–March 2021 4Employees Net sales by quarter and rolling 12 months
The number of full-time employees SEK M
amounted to 17,628 (17,330) in the Quarter Rolling 12 months
period.
6,000 24,000
Market 5,000 20,000
Overall, the underlying market for 4,000 16,000
Sweco’s services remained somewhat
3,000 12,000
weaker in the first quarter, due to the
continued Covid-19 impact. Still, 2,000 8,000
essentially all Business Areas experi- 1,000 4,000
enced a relatively good market for 0 0
Sweco’s services in the infrastructure, 03 06 09 12 03 06 09 12 03 06 09 12 03 06 09 12 03 06 09 12 03
16 16 16 16 17 17 17 17 18 18 18 18 19 19 19 19 20 20 20 20 21
water, environment and energy seg-
ments. Demand for services in the
building and real estate segment
and in parts of the industry market EBITA by quarter and rolling 12 months
remained weaker. SEK M
Quarter Rolling 12 months
Outlook
The Covid-19 situation continues to 700 2,100
create uncertainty regarding future 600 1,800
market development. Demand for 500 1,500
Sweco’s services normally follows the 400 1,200
general macro-economic trend in 300 900
Sweco’s markets, with some time lag. 200 600
A negative medium-term impact on
100 300
demand can therefore be expected
0 0
from the economic effects of Covid-19. 03 06 09 12 03 06 09 12 03 06 09 12 03 06 09 12 03 06 09 12 03
However, this impact will most likely 16 16 16 16 17 17 17 17 18 18 18 18 19 19 19 19 20 20 20 20 21
be partly mitigated by increased
public spending.
market with expertise focusing on 60 architects located in Oulu, Helsinki
Sweco does not provide forecasts.
urban planning, landscape architec- and Jyväskylä. The company offers
ture, infrastructure design and mobil- architectural services in the design of
Events during the quarter ity studies. BUUR has over 60 experts educational establishments, residen-
On 12 January, Sweco announced the and a full-year revenue of approxi- tial premises and business premises.
acquisition of the Finnish engineering mately SEK 47 million. The revenue of Linja Arkkitehdit in
and architecture consultancy Optiplan 2020 was SEK 56 million.
with approximately 150 employees. Events after the quarter On 12 April, Julia Zantke took office as
The acquisition was completed on
On 7 April, Sweco announced the Business Area President for Germany &
29 December 2020. The acquisition
acquisition of Gaia Consulting, the Central Europe and joined the Execu-
strengthens Sweco’s expertise in the
largest sustainability consultancy in tive Team.
area of designing sustainable and
Finland. Gaia Consulting has more
energy efficient residential and non- On 29 April, dividends totalling SEK
than 60 employees and revenue in
residential buildings. The revenue 782 million were distributed to Sweco
2020 was SEK 66 million.
of Optiplan during 2020 was SEK 124 AB shareholders. Last year, dividends
million. On 9 April, Sweco announced the totalling SEK 732 million were distrib-
acquisition of the Finnish architecture uted in April and in October.
On 19 January, Sweco announced the
company Linja Arkkitehdit Oy. Linja
acquistion of BUUR in Belgium. BUUR
Arkkitehdit Oy has approximately
has a strong reputation in the Belgian
Sweco AB (publ) Interim Report January–March 2021 5Cash flow and financial Net debt/EBITDA, x
Sweco Finland has won the contract
to support with integrated planning
position of the first Finnish wood-structured
1.0
Group cash flow from operating Lidl store in Riihimäki. The choice of
activities totalled SEK 301 million material was in part inspired by a
(467) for the first quarter. Net debt carbon footprint calculation carried
decreased to SEK 957 million (2,225), 0.6 out earlier for Lidl by Sweco. The wood
primarily as a result of the increased 0.5 0.5 0.5 construction pilot project is a good
operating cash flow and less cash fit with Lidl’s goal of making its own
outflow due to acquisitions. operations carbon-neutral by 2025.
The Net debt/EBITDA ratio was 0.5 x The grand opening is scheduled for
(1.0). late 2021.
Available cash and cash equivalents,
Q1 Q2 Q3 Q4 Q1 Sweco Finland will, partnership with
2020 2020 2020 2020 2021
including unutilised credit lines, Kanta-Häme Hospital District, Skanska
totalled SEK 3,928 million (2,838) at and the architect consortium Team
the end of the quarter. Integrated, develop Ahvenisto Hospi-
tional team of Belgian and Dutch
tal. The hospital will become a next
Purchase considerations paid to specialists, Sweco is responsible for
generation integrated health services
acquire companies and operations the complete design, as well as the
central hospital and will facilitate
had an impact of SEK -26 million necessary permits and subsidies.
collaboration between specialised
(-264) on the Group’s cash and cash The contract value is SEK 8 million.
healthcare, basic healthcare, social
equivalents. Purchase considerations Sweco Belgium has won an assign- services, university hospitals and pri-
received on the divestment of compa- ment from the Flemish transport vate service providers. Sweco experts
nies and operations had an impact of company De Lijn to provide design in the project include architects,
SEK -1 million (-) on the Group’s cash services in connection with a new structural engineers, building services
and cash equivalents. bus depot in Deurne and its accessi- designers, and specialists in functional
No repurchases of Sweco shares were bility to and from the roads R11 and design, logistics and user-centric
made during the period or duriing the the Luchthavenlei, as well as the new design. The total order value for Sweco,
same period last year. bus depot in Rumst. The depots sup- including the development phase, is
port the growth and maintenance approximately SEK 225 million.
Investments, of public transport in the greater
Sweco Denmark has been contracted
Antwerp area. The contract value is
January–March 2021 SEK 13 million.
to provide engineering services in
Investments in equipment totalled connection with the construction of
Sweco Finland has been chosen as the Circle House project, Denmark’s
SEK 57 million (44) and were primarily
the provider of engineering, procure- first public housing built according to
attributable to IT investments. Depre-
ment and construction management the principles of circular economy.
ciation of equipment amounted to
services for Keliber’s lithium project The goal is to build a scalable circular
SEK 55 million (58) and amortisation
in Central Ostrobothnia. More than lighthouse building that is procured
of intangible assets totalled SEK 35
100 of our experts will be involved in and built on market terms. The client
million (36).
the project and the production of lith- is Lejerbo A/S.
ium hydroxide is expected to start in
Examples of new projects Sweco Denmark has also won an
2024. The project is one of the most
Sweco Belgium has been commis- assignment from the government
significant battery chemical projects in
sioned by VoltH2 to design the two agency responsible for maintenance
Europe and is part of Finland’s national
first green hydrogen plants in the and traffic control on the Danish rail
battery strategy. In addition to Keliber’s
North Sea Port area. The hydrogen network, Banedanmark A/S, to pre-
project, Sweco has also won an assign-
plants will generate green hydrogen pare three existing bridges for railway
ment in recent years from Terrafame
using electricity from wind energy electrification. As part of the project,
and Northvolt, to develop sustainable
within a few years. Using an interna- Sweco is implementing the Common
battery production.
Sweco AB (publ) Interim Report January–March 2021 6Safety Methods (CSM) process and is Sweco Norway has won a contract for free steel production. The ability to
managing the environmental impact consultancy services in connection convert to fossil-free production plays
of the project. The contract value is with planning and project support for a key role in helping the EU achieve its
SEK 5 million. a double-track line through Stange climate goals by 2030. The contract
municipality. The assignment value is SEK 14 million.
Sweco Germany has been engaged to
includes drawing up technical com-
conduct a feasibility study that will Sweco UK has been assigned to, in a
petition documentation for two major
identify potential cycling routes on new 10-year partnership with BAM
substructure contracts based on the
both sides of the Rhine between the Nuttall, continue the development of
Norwegian Total Contract, and two
city of Koblenz and the border to the the programme to modernise the Brit-
specialised performance contracts
state North Rhine-Westphalia, with ish Antarctic Survey’s (BAS) research
for railway technology. The client is
the involvement of the city of Bad stations. The projects could include
Bane NOR and the contract has an
Neuenahr-Ahrweiler. The study also new scientific support buildings, lab-
estimated value of SEK 163 million.
covers the implementation of a fast, oratories, accommodation, upgraded
safe and comfortable bicycle route Sweco Sweden has been tasked by recycling and waste management
connecting 13 municipalities in the Vattenfall, one of Europe’s largest pro- facilities, and runway enhancements
commuter belt region of Rhineland- ducers and retailers of electricity and as well as exploring renewable energy
Palatinate. The client is Städtenetz heat, to conduct feasibility studies options and decarbonisation.
“Mitten am Rhein”, the local govern- and prepare detailed design for 11
ment of the town Bad Breisig. The switch-gear facilities and 11 power
contract value is SEK 1 million. transmission lines, for the so-called
Bottleneck Stockholm project. The
Sweco Netherlands has been selected
project is part of the solution to the
to contribute to improved mobility in
capacity challenge in the Stockholm
the greater Amsterdam area, in the
region electrical grid and is currently
project to widen the A9 between
one of Sweco’s largest assignments
Badhoevedorp and Holendrecht from
within electrical transmission and
three to four lanes in both directions.
distribution. The contract value is
Sweco is responsible for the integral
SEK 10–50 million.
preliminary design and the final
design of the main road network, Sweco Sweden has been contracted
including all entrances and exits, the to assist with the preparation of the
open cut tunnel, water management, environmental permit application,
environmental issues, along with electric power supply and process
pedestrian and bicycle paths. The integration as H2 Green Steel (H2GS
client is Rijkswaterstaat, which is part AB) develops a large-scale fossil-free
of the Dutch Ministry of Infrastructure steel production facility in Norrbotten
and Water Management and the County. The plant, with fully integrated
assignment will be completed by the steel production based on a fossil-free
end of 2026. The contract value is manufacturing process, is an impor-
SEK 102 million. tant step in the transition to fossil-
Sweco AB (publ) Interim Report January–March 2021 7Large-scale fossil-
free steel production
in Boden-Luleå,
Sweden
Large-scale lithium
battery project in
Central Ostrobothnia,
Finland
Sweco AB (publ) Interim Report January–March 2021 8Business Area
Overview
Sweco’s Business Areas are Sweden, Norway,
Finland, Denmark, the Netherlands, Belgium,
the UK and Germany and Central Europe.
Finland
Norway
Sweden Estonia
Denmark
Lithuania
Germany
Netherlands
Poland
Ireland
UK
Belgium Czech Republic
Bulgaria
Our markets
Sweco operates in 14 markets. We have 8 Business
Areas where Sweco holds well-established posi-
tions and it is primarily here that we will grow in
the future. These markets are economically and
politically stable, while also being close to each
other geographically and culturally.
Sweco AB (publ) Interim Report January–March 2021 9Sweco Sweden
Positive EBITA development in Sweden, exclusive calendar, despite negative organic
growth in the quarter. EBITA improvement was driven by lower operating expenses
and less absence. The market remains relatively good, but there was negative impact
from Covid-19 in some segments.
Sales and profit, The Swedish market remained rela-
Net sales & EBITA margin,
tively good during the first quarter
January–March but there were variations between the
rolling 12 months
Net sales decreased to SEK 1,905 different segments. Demand for infra- Net sales, SEK M EBITA margin, %
million (1,985). Organic growth was structure services was good, backed
-2 per cent adjusted for calender by major public investments. The mar- 8,000 16
effects. Organic growth was impacted kets for industrial investments, water
negatively mainly by lower revenue and environmental services were also 6,000 12
from subconsultants and a lower good. In the real estate market, there
number of employees, while less was good demand within public build- 4,000 8
absence contributed positively. There ings and demand related to residential
were 12 fewer working hours in the construction improved somewhat,
2,000 4
quarter compared to last year, which with larger cities continuing to provide
had a negative impact on net sales better conditions. The market for power
and EBITA with of approximately transmission services was strong 0 0
Q1 Q2 Q3 Q4 Q1
SEK 39 million. while demand in energy generation 2020 2020 2020 2020 2021
EBITA increased approximately 6 per remained challenging.
cent, corresponding to SEK 17 million, During the first quarter, the business
after adjusting for calender effects. impact from the Covid-19 pandemic
The EBITA margin decreased to 13.0 entailed a slow start of projects in
per cent (13.6). The EBITA improve- January. Caution prevailed in the
ment was mainly driven by lower oper- quarter with regard to starting new
ating expenses and less absence. projects within the private building
and real estate market.
In brief
Net sales and profit Jan–Mar 2021 Jan–Mar 2020
Net sales, SEK M 1,905 1,985
Organic growth, % -4 0
Acquisition-related growth, % – 1
Currency, % 0 0
Total growth, % -4 1
Organic growth adj. for calendar, % -2 0
EBITA, SEK M 247 269
EBITA margin, % 13.0 13.6
Number of full-time employees 5,812 5,911
Sweco AB (publ) Interim Report January–March 2021 10Sweco Norway
Net sales were negatively impacted by a substantial calendar effect and a weaker
Norwegian krona. EBITA was impacted by the lower billing ratio. The market weak-
ness continued, due to heavy Covid-19 restrictions.
Sales and profit, EBITA decreased approximately SEK 7
Net sales & EBITA margin,
million, corresponding to 7 per cent,
January–March after adjusting for calender effects.
rolling 12 months
Net sales declined 5 per cent to The EBITA margin declined to 7.8 per Net sales, SEK M EBITA margin, %
SEK 675 million (708), to a large cent (13.7). EBITA was impacted
extent impacted by a significant neg- negatively by the lower billing ratio, 3,000 12
ative calendar effect and a weaker whereas lower operating expenses 2,500 10
Norwegian krona. The year-on-year and less absence contributed posi-
calendar effect of 32 fewer hours had tively. 2,000 8
a negative impact of approximately
The increased Covid-19 restrictions 1,500 6
SEK 37 million on net sales and EBITA.
during the first quarter had a cooling
Organically, net sales decreased 1 per 1,000 4
effect on the market. The commercial
cent adjusted for calender effects.
building sector continued to be 500 2
The negative organic growth was
affected by postponement or cancel-
mainly driven by the lower billing 0 0
lation of new projects. The infrastruc- Q1 Q2 Q3 Q4 Q1
ratio and lower revenue from sub 2020 2020 2020 2020 2021
ture and energy markets were stable,
consultants, while less absence
but were not yet showing signs of
impacted positively. The acquisition
compensating for the weaker building
of TAG Arkitekter contributed growth
market.
of 5 per cent.
In brief
Net sales and profit Jan–Mar 2021 Jan–Mar 2020
Net sales, SEK M 675 708
Organic growth, % -6 5
Acquisition-related growth, % 5 –
Currency, % -3 -5
Total growth, % -5 0
Organic growth adj. for calendar, % -1 4
EBITA, SEK M 53 97
EBITA margin, % 7.8 13.7
Number of full-time employees 1,765 1,631
Sweco AB (publ) Interim Report January–March 2021 11Sweco Finland
A slightly slower quarter after a long period of strong performance, but still a double-
digit EBITA Margin. Net sales and EBITA were impacted by the lower billing ratio and
negative FX effects. The market remains relatively stable.
Sales and profit, Overall, the Finnish market was rela-
Net sales & EBITA margin,
tively good during the first quarter,
January–March with slight differences between seg-
rolling 12 months
Net sales decreased to SEK 723 mil- ments. Demand within the building Net sales, SEK M EBITA margin, %
lion (738). A weaker Euro had an effect and real estate segments was rela-
of -5 per cent on growth. Organic tively good, but decline in residential 2,800 14
growth was approximately -2 per cent construction continued. The renova- 2,400 12
adjusted for calendar effects. Organic tion, maintenance and improvement 2,000 10
growth was impacted negatively by market was relatively stable. The mar-
lower revenue from subconsultants 1,600 8
ket for industrial services was quite
and the lower billing ratio, while higher stable and the market for infrastruc- 1,200 6
average fees had a positive effect. ture-related services was good. 800 4
The year-on-year calendar effect of
During the first quarter, the impact of 400 2
8 fewer hours had a negative impact
Covid-19 on the construction segment
of approximately SEK 10 million on 0 0
was limited, with only some projects Q1 Q2 Q3 Q4 Q1
net sales and EBITA. Acquired growth 2020 2020 2020 2020 2021
postponed or cancelled.
contributed 7 per cent and related
to the acquisitions of Saraco and On 7 April, Sweco announced the
Linja Arkkitehdit Oy has approximately
Optiplan. acquisition of Gaia Consulting, the
60 architects located in Oulu, Helsinki
largest sustainability consultancy in
EBITA decreased approximately 15 per and Jyväskylä. The company offers
Finland. Gaia Consulting has more
cent, corresponding to SEK 15 million architectural services in the design of
than 60 employees and revenue in
adjusted for calendar effects and the educational establishments, residen-
2020 was SEK 66 million.
EBITA margin decreased to 10.5 per tial premises and business premises.
cent (13.7). The decrease in EBITA was On 9 April, Sweco announced the The revenue of Linja Arkkitehdit in
mainly attributable to the lower billing acquisition of the Finnish architec- 2020 was SEK 56 million.
ratio and a weaker Euro. ture company Linja Arkkitehdit Oy.
In brief
Net sales and profit Jan–Mar 2021 Jan–Mar 2020
Net sales, SEK M 723 738
Organic growth, % -3 8
Acquisition-related growth, % 7 17
Currency, % -5 2
Total growth, % -2 27
Organic growth adj. for calendar, % -2 9
EBITA, SEK M 76 101
EBITA margin, % 10.5 13.7
Number of full-time employees 2,654 2,473
Sweco AB (publ) Interim Report January–March 2021 12Sweco Denmark
Higher average fees, a higher billing ratio and FTE growth led to positive organic
growth and increased EBITA, with an additional contribution from the acquisition of
KANT Arkitekter. Overall, the market was fairly stable, despite some negative impact
from Covid-19.
Sales and profit, adjusted for calendar effects and the
Net sales & EBITA margin,
EBITA margin increased to 8.6 per cent
January–March (6.7). The EBITA improvement was
rolling 12 months
Net sales increased to SEK 480 million mainly driven by higher average fees, Net sales, SEK M EBITA margin, %
(458). Organic growth was 6 per cent, higher billing ratio and FTE growth.
adjusted for calender effects. Organic 2,100 9
Overall, the Danish market was rela-
growth was impacted positively by
tively stable during the first quarter,
a higher number of employees, higher
with slight differences between seg-
average fees and a higher billing ratio, 1,400 6
ments. Demand in the water and envi-
while lower revenue from subconsult-
ronmental sectors remained stable,
ants impacted negatively. The year-on-
driven by climate-related services in
year calendar effect of 7 fewer hours 700 3
the larger cities. The infrastructure
had a negative impact of approximately
market was fairly stable in the munici-
SEK 6 million on net sales and EBITA.
pal market, whereas state investments
Acquired growth contributed 4 per 0 0
in road infrastructure in particular Q1 Q2 Q3 Q4 Q1
cent and related to the acquisition of 2020 2020 2020 2020 2021
remained weak. The market for build-
KANT Arkitekter.
ing services and the residential mar-
EBITA increased approximately 54 per ket were relatively stable.
cent, corresponding to SEK 16 million
In brief
Net sales and profit Jan–Mar 2021 Jan–Mar 2020
Net sales, SEK M 480 458
Organic growth, % 5 -4
Acquisition-related growth, % 4 2
Currency, % -5 2
Total growth, % 5 1
Organic growth adj. for calendar, % 6 -5
EBITA, SEK M 41 30
EBITA margin, % 8.6 6.7
Number of full-time employees 1,284 1,182
Sweco AB (publ) Interim Report January–March 2021 13Sweco Netherlands
Positive organic growth and significantly improved EBITA, driven by less absence
and a higher billing ratio. The market remained relatively good, even if Covid-19 had
some impact on projects within infrastructure and buildings.
Sales and profit, The lockdown in the Netherlands due
Net sales & EBITA margin,
to Covid-19 continued throughout the
January–March first quarter. Despite this, the Dutch
rolling 12 months
Net sales decreased to SEK 528 mil- market remained relatively good, Net sales, SEK M EBITA margin, %
lion (547) due to a negative foreign however with differences between
exchange effect. Organic growth segments. Demand within residential 2,400 12
adjusted for calender effects amounted building remained high due to the
to 3 per cent and was driven by less continued shortage of residential 1,800 9
absence and a higher billing ratio, homes. Also the market for building
while lower revenue from subconsult- services systems was good. The mar- 1,200 6
ants impacted negatively. There were ket for industrial services was diversi-
8 fewer working hours in the quarter fied, in the sense that the food sector
600 3
compared to last year which contrib- was stable but the chemical sector
uted negatively with approximately remained under pressure. Within the
SEK 7 millon in net sales and EBITA. energy market there was substantial 0 0
Q1 Q2 Q3 Q4 Q1
EBITA increased approximately 55 per demand to increase the infrastructure 2020 2020 2020 2020 2021
cent, corresponding to SEK 28 million, to facilitate green energy like solar
after adjusting for calender effects. energy and windfarms, and there was
The EBITA improvement was mainly an increasing interest in hydrogen.
attributable to less absence, a higher During the first quarter, the impact
billing ratio and lower operating of Covid-19 in the form of delayed
expenses. The EBITA margin improved projects remained limited.
to 13.8 per cent (9.4), an all-time high
for Sweco Netherlands.
In brief
Net sales and profit Jan–Mar 2021 Jan–Mar 2020
Net sales, SEK M 528 547
Organic growth, % 2 6
Acquisition-related growth, % – –
Currency, % -5 2
Total growth, % -4 8
Organic growth adj. for calendar, % 3 4
EBITA, SEK M 73 51
EBITA margin, % 13.8 9.4
Number of full-time employees 1,362 1,404
Sweco AB (publ) Interim Report January–March 2021 14Sweco Belgium
Significant organic growth and net sales growth from acquisitions. The EBITA margin
improved due to a higher billing ratio and less absence. Mixed picture in the market
with some strong segments and others that are more impacted by Covid-19.
Sales and profit, The market was good within most
Net sales & EBITA margin,
segments during the first quarter and
January–March the infrastructure market is back at
rolling 12 months
Net sales increased to SEK 478 mil- full speed. The public sector building Net sales, SEK M EBITA margin, %
lion (431), and organic growth was market remained stable, while the
approximately 9 per cent adjusted for residential market and the office mar- 2,000 12
calendar effects. Organic growth was ket weakened further. Belgium is in
driven by a higher billing ratio and the middle of a complete energy tran- 1,500 9
less absence. Recent acquisitions sition with a new government clearly
contributed 8 per cent to growth. committed to the European Green 1,000 6
The year-on-year calendar effect of Deal. The electrification in industry
8 fewer hours had a negative impact and the public domain increased.
500 3
of approximately SEK 5 million on The pharma industry was running at
net sales and EBITA. full speed, and the more traditional
industry markets were slowly picking 0 0
EBITA increased approximately 40 per Q1 Q2 Q3 Q4 Q1
cent, corresponding to SEK 20 million up again. 2020 2020 2020 2020 2021
adjusted for calendar effects and the On 19 January, Sweco announced the
EBITA margin increased to 13.5 per acquistion of BUUR in Belgium. BUUR ture, infrastructure design and mobil-
cent (11.5). The improvement in earn- has a strong reputation in the Belgian ity studies. BUUR has over 60 experts
ings was mainly attributable to a market with expertise focusing on and a full-year revenue of approxi-
higher billing ratio and less absence. urban planning, landscape architec- mately SEK 47 million.
In brief
Net sales and profit Jan–Mar 2021 Jan–Mar 2020
Net sales, SEK M 478 431
Organic growth, % 8 15
Acquisition-related growth, % 8 11
Currency, % -5 2
Total growth, % 11 29
Organic growth adj. for calendar, % 9 14
EBITA, SEK M 65 50
EBITA margin, % 13.5 11.5
Number of full-time employees 1,152 1,025
Sweco AB (publ) Interim Report January–March 2021 15Sweco UK
The UK is the market most impacted by Covid-19 and organic growth remained
significantly negative in the quarter. EBITA was negatively impacted by employees
on furlough and project adjustments. The market remains uncertain, but with some
first positive signs in the quarter.
Sales and profit, EBITA margin declined to 5.1 per cent
Net sales & EBITA margin,
(10.4). Earnings were negatively
January–March impacted by employees on furlough
rolling 12 months
Net sales amounted to SEK 313 mil- and negative project adjustments. Net sales, SEK M EBITA margin, %
lion (382). A weaker pound sterling
The UK market remains challenging
had an effect of -6 per cent on growth. 1,600 8
and the government temporary fur-
Organic growth was approximately
lough scheme will continue in the UK
-10 per cent adjusted for calendar 1,200 6
until the end of September 2021.
effects and the decline was mainly
driven by lower revenue from subcon- Demand in the buildings market
800 4
sultants, a lower number of employ- showed signs of recovery in the first
ees and negative project adjustments. quarter. The energy, environment and
400 2
The year-on-year calendar effect of water markets remained fairly stable
8 fewer hours had a negative impact with moderate impact from Covid-19.
of approximately SEK 4 million on net The transportation infrastructure 0 0
Q1 Q2 Q3 Q4 Q1
sales and EBITA. market is the market most impacted 2020 2020 2020 2020 2021
by Covid-19.
EBITA decreased approximately 49 per
cent, corresponding to SEK 20 million At the end of the quarter, 51 employees
adjusted for calendar effects. The were on furlough.
In brief
Net sales and profit Jan–Mar 2021 Jan–Mar 2020
Net sales, SEK M 313 382
Organic growth, % -12 9
Acquisition-related growth, % – 66
Currency, % -6 4
Total growth, % -18 79
Organic growth adj. for calendar, % -10 8
EBITA, SEK M 16 40
EBITA margin, % 5.1 10.4
Number of full-time employees 1,199 1,245
Sweco AB (publ) Interim Report January–March 2021 16Sweco Germany and Central Europe
Positive organic growth due to higher average fees and less absence. The lower bill-
ing ratio had a negative impact on EBITA. The market remained stable with Covid-19
primarily impacting the private real estate market.
Sales and profit, Covid-19 and no major construction
Net sales & EBITA margin,
sites had to be closed due to the crisis.
January–March However, private investors continued
rolling 12 months
Net sales decreased 3 per cent to to slow down or stop projects and Net sales, SEK M EBITA margin, %
SEK 483 million (497) due to a foreign tenders in the real estate market. On
exchange effect of -6 per cent. the other hand, the German publicly 2,500 5
Organic growth was around 4 per funded sector remained good and
2,000 0
cent, adjusted for calender effects, energy transition projects have con-
and was impacted positively by tinued as planned. 1,500 -5
higher average fees and less absence.
At the end of the quarter, 13 employees
The year-on-year calendar effect of 1,000 -10
were on temporary lay-off.
8 fewer hours had a negative impact
of approximately SEK 7 million on On 12 April, Julia Zantke took over the 500 -15
net sales and EBITA. role as Business Area President for
Germany & Central Europe and joined 0 -20
EBITA decreased approximately Q1 Q2 Q3 Q4 Q1
the Executive Team. The change in 2020 2020 2020 2020 2021
SEK 4 million adjusted for calendar
leadership is an important part of the
effects. EBITA was impacted negatively
plan for returning to profitable growth
by the lower billing ratio, whereas
in Germany. Julia is an experienced
higher average fees and less absence
leader, with the right skillset to lead
contributed positively.
the organisation in the right direction
Overall, the German market remained and drive the continued implementa-
stable in the first quarter despite tion of the Sweco model.
In brief
Net sales and profit Jan–Mar 2021 Jan–Mar 2020
Net sales, SEK M 483 497
Organic growth, % 3 7
Acquisition-related growth, % 0 16
Currency, % -6 2
Total growth, % -3 25
Organic growth adj. for calendar, % 4 6
EBITA, SEK M -3 9
EBITA margin, % -0.5 1.8
Number of full-time employees 2,352 2,417
Sweco AB (publ) Interim Report January–March 2021 17Other information
Parent Company, EBITA is the Group’s key metric for operational performance
at Group and BA level. Sweco’s EBITA measure is defined
January–March 2020 as Earnings Before Interest, Taxes and Acquisition-related
Parent Company net sales totalled SEK 228 million (212) items. All leases are treated as operating leases and the
and were attributable to intra-group services. Profit after total cost of the lease affects EBITA. Operating lease treat-
net financial items totalled SEK -24 million (-11). Invest- ment follows IAS 17 (the standard for leases applicable
ments in equipment totalled SEK 25 million (5). Cash and through 31 December 2018).
cash equivalents at the end of the period totalled SEK 51
Net debt/EBITDA is Sweco’s key metric for financial
million (805).
strength. The definition remains essentially in line with the
covenants defined in Sweco’s bank financing agreements.
Accounting principles
Net debt is defined as financial debt (comprised almost
Sweco complies with the International Financial Reporting exclusively of interest-bearing bank debt) less cash and
Standards (IFRS) and interpretive statements from the cash equivalents and short-term investments. Lease liabil-
International Financial Reporting Interpretations Commit- ities are excluded from Net debt. As with the calculation of
tee (IFRIC), as adopted by the EU. This report was prepared EBITA, when calculating EBITDA all leases are assumed to
in accordance with IAS 34, Interim Reporting; the Swedish comprise operating leases pursuant to IAS 17.
Annual Accounts Act; and the Swedish Financial Reporting
Board’s RFR 2, Reporting for Legal Entities. The Group Items affecting comparability: To assist in understanding
applies the same accounting and valuation principles as its operations, Sweco believes that it is useful to consider
those described in Note 1 in the Annual Report for 2020. certain measures and ratios exclusive of items affecting
comparability. Items affecting comparability include items
In this report, amounts in brackets refer to the correspond- that are non-recurring, have a significant impact and are
ing period of the previous year. Because table items are considered to be important for understanding the operating
individually rounded off, table figures do not always tally. performance when comparing results between periods.
The interim report comprises pages 1–27; the interim Items affecting comparability relate to restructuring and
financial information presented on pages 1–27 is therefore integration costs, costs related to acquisitions and divest-
part of this financial report. ments, project write-downs and other one-off items when
amounts are significant. The items affecting comparability
Key performance measures are disclosed in this report. All measures and ratios in this
Sweco follows the guidelines from ESMA (European Securi- report have been disclosed including items affecting com-
ties and Markets Authority) regarding APMs (Alternative parability first and then excluding items affecting compa-
Performance Measures). In brief, these are measures of rability as a second measure when deemed appropriate.
historical or ongoing operating results and financial per-
The reconciliation of Sweco’s key financial metrics, described
formance that are not specified or defined in IFRS. The
above, and IFRS measures is presented on page 20 and 27.
presentation of non-IFRS financial measures is limited as
Organic growth calculation is presented on page 26.
an analytical tool and should not be used as a substitute
for key ratios pursuant to IFRS. Sweco believes that the
The Sweco share
APMs will enhance investors’ evaluation of our ongoing
operating results, aid in forecasting future periods and The Sweco share is listed on Nasdaq Stockholm. The share
facilitate meaningful comparison of results between periods. price of the Sweco Class B share was SEK 142.60 at the end
The non-IFRS financial measures presented in this report of the period, representing a 6 per cent decrease during
may differ from similarly titled measures used by other the quarter. Nasdaq Stockholm OMXSPI increased 14 per
companies. A complete list of all Sweco’s definitions can cent over the same period.
be found on our website: https://www.swecogroup.com/ The total number of shares at the end of the period was
investor-relations/financial-information/definitions 363,251,457: 31,086,598 Class A shares and 332,164,859
Sweco’s key financial metrics, defined as Alternative Class B shares. The total number of shares outstanding
Performance Measures (APMs) in accordance with IFRS, was 355,338,601: 31,086,598 Class A shares and
are EBITA and Net debt/EBITDA. 324,252,003 Class B shares.
Sweco AB (publ) Interim Report January–March 2021 18Resolutions at the 2021 AGM Acquisition-related amortisation
Dividend: The Annual General Meeting resolved, in accord- Acquisition-related intangible assets and expensed costs
ance with the proposal of the Board of Directors, to distrib- for future services will be amortised pursuant to the follow-
ute a dividend of SEK 2.20 per share (2.07) to the share- ing schedule, based on acquisitions to date:
holders. 2021 Estimate SEK -131 million
2021 Share savings scheme: Pursuant to the Board’s 2022 Estimate SEK -87 million
proposal, the 2021 AGM resolved to implement a long-term 2023 Estimate SEK -45 million
share savings scheme for up to 100 Sweco Group senior 2024 Estimate SEK -15 million
executives and other key employees.
2021 Share bonus scheme: Pursuant to the Board’s Forthcoming financial information
proposal, the 2021 AGM resolved to implement a share- Interim report January–June 16 July 2021
based incentive scheme for employees in Sweden. Interim report January–September 29 October 2021
Year-end report 2021 11 February 2022
Pursuant to the Nomination Committee’s proposal, the 2021
AGM resolved that the Board of Directors shall be comprised
of seven members. Pursuant to the Nomination Committee’s Stockholm, 11 May 2021
proposal, Gunnel Duveblad, Elaine Grunewald, Alf Göransson,
Åsa Bergman
Johan Hjertonsson, Johan Nordström, Christine Wolff and
President and CEO, Member of the Board of Directors
Åsa Bergman were re-elected as directors. Johan Nordström
was re-elected as Chairman of the Board of Directors.
For further information, please contact:
Risks and uncertainties Åsa Bergman, President and CEO
asa.bergman@sweco.se
Significant risks and uncertainties affecting the Sweco
Group and the Parent Company include business risks Olof Stålnacke, CFO
associated with the general economic trend and investment Phone +46 70 306 46 21
level in various markets, the capacity to attract and retain olof.stalnacke@sweco.se
skilled personnel, the effects of political decisions as well
Katarina Grönwall, CCO
as risks und uncertainties related to the Covid-19 pandemic.
Phone +46 73 258 93 33
The Group is also exposed to various types of financial risk,
katarina.gronwall@sweco.se
such as foreign currency, interest rate and credit risk. The
risks to which Sweco is exposed are detailed in Sweco’s 2020 SWECO AB (publ) Org. nr. 556542-9841
Annual Report (page 96–97, Risks and Risk Management). Gjörwellsgatan 22, Box 34044, 100 26 Stockholm,
Phone: +46 8 695 60 00
Calendar effects Email: info@sweco.se
www.swecogroup.com
Year 2021
The number of normal working hours in 2021, based on the This report has not been audited.
12-month sales-weighted business mix as of September
2020, is broken down as follows:
2021 2020
Quarter 1: 487 500 -13
Quarter 2: 473 465 8
Quarter 3: 517 518 -1
Quarter 4: 496 491 5
Total: 1,973 1,974 -1
Sweco AB (publ) Interim Report January–March 2021 19KPIs
Jan–Mar Jan–Mar Apr 2020– Full-year
KPIs1 2021 2020 Mar 2021 2020
Profitability
EBITA margin excl. IAC, % 9.8 11.1 9.4 9.7
EBITA margin, % 9.8 11.1 8.1 8.5
Operating margin (EBIT), % 9.4 10.8 7.8 8.2
Profit margin, % 9.1 10.2 7.4 7.7
Revenue growth2
Organic growth, % -2 4 -1
Acquisition-related growth, % 2 7 4
Currency, % -3 1 -2
Total growth, % -3 11 1
Organic growth adj. for calendar, % 0 4 -2
Organic growth adj. for calendar & IAC, % 0 4 -1
Debt
Net debt, SEK M 957 2,225 943
Interest-bearing debt, SEK M 1,564 3,267 3,031
Financial strength
Net debt/Equity, % 11.8 29.0 12.5
Net debt/EBITDA, x 0.5 1.0 0.5
Equity/Assets ratio, % 42.2 37.0 37.9
Available cash and cash equivalents, SEK M 3,928 2,838 3,898
– of which unutilised credit, SEK M 3,322 1,796 1,811
Return
Return on equity, % 15.8 20.1 17.6
Return on capital employed, % 12.2 15.2 12.9
Share data3
Earnings per share, SEK 1.10 1.25 3.49 3.64
Diluted earnings per share, SEK 1.09 1.22 3.45 3.58
Equity per share, SEK4 22.76 21.67 21.25
Diluted equity per share, SEK4 22.60 21.11 21.07
Number of shares outstanding at reporting date 355,338,601 353,512,266 355,197,471
Number of repurchased Class B shares 7,912,856 9,739,191 8,053,986
1) The definitions of the Key Performance Indicators (KPIs) are available on Sweco’s website.
2) See page 26 for details on Sweco’s calculation of revenue growth.
3) Due to the share split conducted during Q4 2020, all historical share data have been restated in accordance with IAS 33.
4) Refers to portion attributable to Parent Company shareholders.
Reconciliation of EBIT and the APMs EBITA Jan–Mar Jan–Mar Apr 2020– Full-year
and EBITDA, SEK M 2021 2020 Mar 2021 2020
Operating profit (EBIT) 523 615 1,614 1,706
Acquisition-related items 34 36 133 135
Lease expenses1 -195 -195 -783 -782
Depreciation and impairments, right-of-use assets 179 174 713 708
EBITA2 540 630 1,677 1,766
Amortisation/depreciation and impairment,
tangible and intangible fixed assets 68 71 275 278
EBITDA3 608 701 1,951 2,044
1) Lease expenses pertain to adjustments made in order to treat all leases as operating leases.
2) EBITA is an alternative performance measure (APM) defined as Earnings before Interest, Taxes and Acquisition-related items, under which all leases are treated as operating leases and the total
cost of the lease affects EBITA.
3) EBITDA is an alternative performance measure (APM) defined as Earnings before Interest, Taxes, Depreciation & amortisation and Acquisition-related items, under which all leases are treated as
operating leases and the total cost of the lease affects EBITDA.
Reconciliation of the APMs EBITA Jan–Mar Jan–Mar Apr 2020– Full-year
and EBITA excl. IAC, SEK M 2021 2020 Mar 2021 2020
EBITA 540 630 1,677 1,766
Items affecting comparability (IAC)1 – – 290 290
EBITA excl. IAC 540 630 1,967 2,056
1) Items affecting comparability encompassed the write-down of working capital of SEK 290 million in the German operations and are reported in Business Area Germany & Central Europe.
Sweco AB (publ) Interim Report January–March 2021 20Consolidated income statement
Jan–Mar Jan–Mar Apr 2020– Full-year
SEK M 2021 2020 Mar 2021 2020
Net sales 5,538 5,680 20,716 20,858
Other income 2 5 4 7
Other external expenses -979 -1,119 -4,040 -4,180
Personnel expenses -3,757 -3,671 -13,946 -13,859
Amortisation/depreciation and impairment,
tangible and intangible fixed assets1 -68 -71 -275 -278
Depreciation and impairment, right-of-use assets -179 -174 -713 -708
Acquisition-related items2 -34 -36 -133 -135
Operating profit (EBIT) 523 615 1,614 1,706
Net financial items3 -10 -11 -44 -46
Interest cost of leasing4 -12 -15 -52 -54
Other financial items5 4 -12 18 2
Total net financial items -18 -38 -78 -98
Profit before tax 505 577 1,536 1,608
Income tax -113 -134 -294 -316
PROFIT FOR THE PERIOD 392 443 1,242 1,293
Attributable to:
Parent Company shareholders 392 443 1,241 1,292
Non-controlling interests 0 0 1 1
Earnings per share attributable to
Parent Company shareholders, SEK6 1.10 1.25 3.49 3.64
Average number of shares outstanding6 355,291,558 353,473,303 355,080,723 354,626,159
Dividend per share, SEK6 2.20
1) Includes tangible assets and intangible assets that are not acquisition-related.
2) Acquisition-related items consist of amortisation and impairment of goodwill and acquisition-related intangible assets, revaluation of purchase price, profit and losses on the divestment
of companies, operations, land and buildings, as well as costs for received future service. See page 24 for additional details.
3) Net financial items comprise interest expenses on credit facilities and costs related to credit facilities less interest income on cash and cash equivalents.
4) Interest cost of leasing comprises the interest cost of leasing pursuant to IFRS 16.
5) Other financial items: Result and distributions from participation in associated companies and other securities, result from sale of participations in associated companies and other securities,
foreign exchange gains and losses on financial assets and liabilities, and other interest income and interest expenses.
6) Due to the share split conducted during Q4 2020, historical data has been restated in accordance with IAS 33.
Consolidated statement of comprehensive income
Jan–Mar Jan–Mar Apr 2020– Full-year
SEK M 2021 2020 Mar 2021 2020
Profit for the period 392 443 1,242 1,293
Items that will not be reversed in the income statement
Revaluation of defined benefit pensions, net after tax1, 2 – – -34 -34
Items that may subsequently be reversed in
the income statement
Translation differences, net after tax 148 62 -228 -314
COMPREHENSIVE INCOME FOR THE PERIOD 540 505 980 945
Attributable to:
Parent Company shareholders 540 505 980 945
Non-controlling interests 0 0 0 0
1) Tax on revaluation of defined benefit pensions – – 11 11
2) Revalued annually. Reviewed quarterly in the event of material changes to actuarial assumptions.
Sweco AB (publ) Interim Report January–March 2021 21Consolidated cash flow statement
Jan–Mar Jan–Mar Apr 2020– Full-year
SEK M 2021 2020 Mar 2021 2020
Profit before tax 505 577 1,536 1,608
Amortisation/depreciation and impairment 270 269 1,072 1,071
Other non-cash items 28 8 523 502
Cash flow from operating activities before changes
in working capital, tax paid, interest paid and received 803 854 3,130 3,181
Interest cost leasing -12 -15 -52 -54
Net interest paid -5 -6 -27 -28
Tax paid -131 -106 -362 -337
Changes in working capital -353 -259 393 488
Cash flow from operating activities 301 467 3,083 3,249
Acquisition and divestment of subsidiaries and operations -27 -264 -298 -535
Purchase and disposal of intangible and tangible assets -67 -55 -232 -220
Other investing activities -1 2 6 9
Cash flow from investing activities -95 -318 -523 -746
Borrowings and repayment of borrowings -1,554 390 -1,567 376
Principal elements of lease payments -183 -173 -709 -700
Dividends paid – – -733 -733
Repurchase of treasury shares – – – –
Cash flow from financing activities -1,737 217 -3,009 -1,056
CASH FLOW FOR THE PERIOD -1,531 366 -450 1,447
Consolidated balance sheet
SEK M 31 Mar 2021 31 Mar 2020 31 Dec 2020
Goodwill 7,783 7,765 7,593
Other intangible assets 334 376 340
Property, plant and equipment 531 568 519
Right-of-use assets 2,748 3,010 2,705
Financial assets 397 536 391
Current assets excl. cash and cash equivalents 6,786 7,451 6,312
Cash and cash equivalents incl. short-term investments 606 1,043 2,088
TOTAL ASSETS 19,186 20,749 19,948
Equity attributable to Parent Company shareholders 8,089 7,660 7,548
Non-controlling interests 10 10 10
Total equity 8,099 7,670 7,557
Non-current lease liabilities 2,150 2,462 2,135
Non-current interest-bearing debt 1,550 3,208 2,996
Other non-current liabilities 855 1,058 832
Current lease liabilities 724 708 706
Current interest-bearing debt 14 59 34
Other current liabilities 5,796 5,584 5,688
TOTAL EQUITY AND LIABILITIES 19,186 20,749 19,948
Pledged assets – 1 –
Contingent liabilities 1,008 1,035 942
Sweco AB (publ) Interim Report January–March 2021 22Consolidated statement of changes in equity
Jan–Mar 2021 Jan–Mar 2020
Equity Equity
attributable attributable
to Parent Non- to Parent Non-
Company controlling Company controlling
SEK M shareholders interests Total equity shareholders interests Total equity
Equity, opening balance 7,548 10 7,557 7,154 10 7,164
Comprehensive income for the period 540 0 540 505 0 505
Share bonus scheme -1 – -1 – – –
Share savings schemes 2 – 2 2 – 2
EQUITY, CLOSING BALANCE 8,089 10 8,099 7,660 10 7,670
Acquisitions
The following company acquisition was carried out during the period.
Annual Number
Included Business Acquired net sales in of employees
Company or operations1 from area share, %2 SEK M3 (individuals)
Bureau voor Urbanisme (BUUR) BV January Belgium 100 47 654
TOTAL 47 65
1) Acquired goodwill attributable to acquisition of assets is tax deductible in event of future write-downs.
2) No acquired ownership share reported for asset deals.
3) Estimated annual net sales.
4) Of which 63 self employed.
During the period, the acquired company contributed SEK 14 million in net sales, SEK 1 million in EBITA and SEK 0 million
in operating profit (EBIT). The transaction costs for the acquisitions during this period and the previous period totalled
SEK 2 million. The acquisition impact on the consolidated balance sheet will be reported in the next interim report.
Divestments
In the beginning of the period Sweco divested its Norwegian subsidiary Årstiderne Arkitekter AS with 3 employees. The
divestment had no impact on profit and the divested company did not contribute any net sales or profit during the period.
Sweco AB (publ) Interim Report January–March 2021 23You can also read