COVID-19: Monitoring the propagation of the first waves of the pandemic - 4Open

Page created by Raymond Warner
 
CONTINUE READING
COVID-19: Monitoring the propagation of the first waves of the pandemic - 4Open
4open 2020, 3, 5
Ó W. Knafo, Published by EDP Sciences, 2020
https://doi.org/10.1051/fopen/2020005

                                                                                                                         Available online at:
                                                                                                                        www.4open-sciences.org

 RESEARCH ARTICLE

COVID-19: Monitoring the propagation of the first waves
of the pandemic
William Knafo*
Laboratoire National des Champs Magnétiques Intenses, CNRS-UPS-INSA-UGA, 143 Avenue de Rangueil, 31400 Toulouse, France

            Received 11 May 2020, Accepted 17 May 2020

            Abstract – Introduction: A phenomenological approach is proposed to monitor the propagation of the first
            waves of the COVID-19 pandemic.
            Method: A large set of data collected during the first months of 2020 is compiled into a series of semi-logarithmic
            plots, for a selection of 32 countries from the five continents.
            Results: Three regimes are identified in the propagation of an epidemic wave: a pre-epidemic regime 1, an
            exponential-growth regime 2, and a resorption regime 3. A two-parameters scaling of the first-wave death vari-
            ation reported in China is used to fit the first-wave data reported in other countries. Comparison is made
            between the propagation of the pandemic in different countries, which are classified into four groups, from
            Group A where the pandemic first waves were contained efficiently, to Group D where the pandemic first waves
            widely spread. All Asian countries considered here, where fast and efficient measures have been applied, are in
            Group A. Group D is composed of Western-European countries and the United States of America (USA), where
            late decisions and confused political communication (pandemic seriousness, protection masks, herd immunity,
            etc.) led to a large number of deaths.
            Discussion: The threat of resurging epidemic waves following a lift of lockdown measures is discussed. The
            results obtained in Asian countries from group A, as Hong Kong and South Korea, are highlighted, and the
            measures taken there are presented as examples that other countries may follow.

            Keywords: Asia, Australia, Belgium, Brazil, Czech Republic, China, COVID-19, Epidemic, Epidemic wave,
            Epidemiology, Europe, France, Germany, Greece, Hong Kong, Immunity, India, Iran, Israel, Italy, Japan,
            Lockdown, Mexico, Morbidity, Morocco, Mortality, The Netherlands, Nigeria, Norway, Pandemic, Phenome-
            nological Description, Philippines, Portugal, Protection, Resurging Epidemic Waves, Russia, Sars-CoV-2,
            Sepsis, Singapore, South Korea, Scandinavia, Spain, South Africa, Sweden, Switzerland, Taiwan, Western
            Europe, United Kingdom, USA, Virus

Introduction                                                                issues. Without this, an uncontrolled exponential propaga-
                                                                            tion could lead to cumulative death tolls of up to one or
    In the first months of 2020, the first waves of the pan-                  even a few percent of the population. This corresponds to
demic spread of the coronavirus disease 2019 (COVID-19)                     a situation where herd immunity would be achieved in a
have affected most of the countries worldwide [1]. This dis-                “natural” manner [4–6].
ease, caused by severe acute respiratory syndrome coron-                        The target to avoid such a dire situation offers a rare case
avirus 2 (SARS-CoV-2), was first reported in end 2019 in                     where scientists can directly guide politicians and where their
Hubei province, China [2, 3]. At the time of writing this                   recommendations on short- and medium-term decisions can
paper (9 May 2020), almost 300,000 deaths have been                         have enormous impacts for the community/country. They
reported and multiple challenges have emerged: slowing                      can monitor the pandemic statistics, they can model it, they
down the spread of the virus, offering adapted medical care,                can propose solutions to slow down the pandemic propaga-
saving lives, developing a vaccine to immunize the popula-                  tion, they can follow or anticipate the impacts of given series
tion, and anticipating a forthcoming economic crisis. As a                  of political decisions. In recent weeks, several epidemiological
first step, slowing down the pandemic propagation is                         models and reports emerged [7–15], some of them having
essential to limiting the number of deaths occurring in a                   impact in national press and immediate consequences on
few-weeks timescale and, thus, to avoid a cascade of related                political decisions. In addition to the work from epidemi-
                                                                            ologists, modelling and graphical tools have been proposed
*Corresponding author: william.knafo@lncmi.cnrs.fr                          by physicists (see for instance [16–19]). In particular,
This is an Open Access article distributed under the terms of the Creative Commons Attribution License (https://creativecommons.org/licenses/by/4.0),
              which permits unrestricted use, distribution, and reproduction in any medium, provided the original work is properly cited.
2                                                W. Knafo: 4open 2020, 3, 5

phenomenological approaches, such as that proposed in this        to their population, and deaths numbers are given per
work, are suited to monitor the propagation of a pandemic.        100,000 inhabitants. In these last graphs, a second “shifted”
    Here, a battery of semi-logarithmic plots on the propaga-     time is used, and the day d = 0 is defined as the extrapola-
tion of the COVID-19 pandemic is given, for a selection of        tion of the exponential-growth regime to n = 0.001 cumula-
32 countries from the different continents. The choice to         tive deaths/100,000 inhabitants.
consider full-country data (rather than comparing territories         For a selection of countries, the evolution of the cumu-
of similar populations) is motivated by the fact that political   lative death toll is fitted using one or two single-wave con-
decisions are generally taken at a national scale. A two-         tribution derived from a smoothed curve constructed from
parameter scaling of the death data reported in China is          the Chinese cumulative single-wave death variation. It is
used to fit the first waves of the epidemic in a selection of       assumed that, for each epidemic wave, the exponential-
countries, where the spread was well-advanced in beginning        growth and decay regimes are similar to those reported
of May 2020 (USA, Spain, Italy, United Kingdom [UK],              for the first epidemic wave reported in China. For each
France and Germany). The graphs constitute simple tools           wave, two parameters, an offset in time and a scaling factor
to identify trends and key moments in the propagation of          in the death number, are adjusted to reproduce both cumu-
the pandemic in a country. They offer an easy way to assess       lative and daily death variations. A factor F is also defined
and compare the efficiency of measures. The success of those       as the ratio of cumulative deaths at the beginning of the
taken in Asian countries is emphasized. The situation in          lockdown start and at the end of the epidemic wave.
several Western Europe countries and in the USA is oppo-              The countries considered here are classified in a four-
site. Confused political communication about the apprecia-        group scheme (Groups A–D), depending on the degree of
tion of the pandemic’ seriousness [20, 21], recommendations       spread of the pandemic in their population on 8 May 2020.
to wear protection masks [22], and the consequences of a
herd immunity scenario [23], has been observed. In these
countries, the delay in the application of strong containment     Results
measures led to tens of thousands of deaths after the first        Spread of the pandemic in a selection of Asian
waves of the epidemic. An early lift of the lockdown may also     and Western countries
lead to the resurgence of further waves of the epidemic. The
monitoring tools compiled here, once updated, will help in            Figure 1 presents the time variation of confirmed case
forecasting resurging waves of the pandemic. The fatality         and death tolls from a selection of six countries early hit
rate and the question of achieving herd immunity, as well         by the COVID-19 pandemic, on a time window covering
as the exponential consequences of a delay or inefficiency         fully or partly the first epidemic waves. Figures 1a, 1c,
in the application of measures are discussed.                     and 1f show the evolution from 1 January to 8 May 2020
                                                                  of the cumulative confirmed cases, cumulative deaths, and
                                                                  daily deaths in China, South Korea, Italy, Spain, France
Materials and methods                                             (mainland) and the USA. Time offsets between the varia-
                                                                  tions from the different countries result from the delayed
    Data presented here were extracted from the Johns             arrivals of the virus on their territory.
Hopkins University [24], Santé Publique France [25] and               China was the first country to be hit by the pandemic,
“https://dashboard.covid19.data.gouv.fr” databases. They          where the first wave ended in late April 2020, with cumula-
were accessed on 9 May 2020 and correspond to confirmed            tive confirmed cases saturating at  80,000 and cumulated
cases and deaths reported in 32 countries up to 8 May 2020        deaths saturating < 5000 (initial saturation to  3300
(most of the data were extracted from [24], some French           deaths corrected to  4600 on 17 April 2020). South Korea
data were completed from [25], and French confirmed cases          was hit a few weeks after China and was less affected than
data were extracted from “https://dashboard.covid19.data.         the other countries considered here, with < 11,000 cumula-
gouv.fr”). This selection is composed of the first countries       tive confirmed cases and < 300 cumulative deaths in the
hit by the pandemic in Asia and western countries, and of         beginning of May 2020. The USA was the last country of
a panel of lately-hit countries from the different continents.    this selection to be hit, but it was the most affected with
Discussion about possible errors in some official tolls would      > 1,000,000 cumulative confirmed cases and > 70,000
go beyond the scope of this paper and is not made here.           cumulative deaths in the beginning of May 2020. The three
Delays in the report of data (for instance during weekends)       Western European countries were hit a few days after
sometimes lead to an additional noise in the graphs, but          South Korea and were strongly affected, with  200,000
they weakly affect the general trends observed on several-        cumulative confirmed cases and  30,000 cumulated deaths
week time scales.                                                 in each country in the beginning of May 2020. These graphs
    Data are presented in a systematic and progressive way.       show that, when the epidemic is active in a country, the
Plots of raw data, i.e., cumulative reported cases and death      number of cumulative deaths increases in an exponential
numbers versus time, are first considered. Daily deaths            manner, which leads to a linear increase in the semi-loga-
numbers are then presented. For all sets of data, a “shifted”     rithmic scale of the graphs.
time is adjusted so that day D = 0 corresponds to the                 Complementarily graphs are shown in the panels (b, d, f)
extrapolation of the exponential-growth regime to N = 1           of Figure 1 where the cumulative confirmed cases, cumula-
cumulative death. All data are then normalized with regard        tive deaths and daily deaths are plotted as a function of a
W. Knafo: 4open 2020, 3, 5                                                                            3

 (a)                           Cumulative confirmed cases                                     (b)                               Cumulative confirmed cases
    1000000                                    19 March - 7 April, USA                              1000000                           19 March - 7 April, USA
                                                                                                                       Lockdown:
                                      15 March, Spain
                                                                                                                                        8 March, Italy
                  Lockdown:
       100000                                                                                        100000                      15 March, Spain
                                       8 March, Italy
                                                                                                                                   23 January,
                 23 January,
        10000    China                                                                                10000                        China

         1000                                                                                          1000
                                                            17 March France
                                                                                                                                                     17 March France

                                                                              USA                                                                                      USA
          100                                                                                           100
                                                                              France                                                                                   France
                                                                              Spain                                                                                    Spain
                                                                              Italy                                                                                    Italy
           10                                                                                            10
                                                                              South Korea                                                                              South Korea
                                                                              China                                                                                    China
            1                                                                                             1
           1 January                       1 March                            1 May                        -40                      0                           40          80
                                                       Date                                                                                 'Shifted' time (days)
                                                                                                                 (D = 0 adjusted at the beginning of the exponential-growth regime)

 (c)                                   Cumulative deaths                                      (d)                                       Cumulative deaths
       100000                                                                                        100000
                                               19 March - 7 April, USA                                                USA                  19 March - 7 April, USA
                                                                                                                      France
                                        15 March, Spain                                                               Spain
        10000     Lockdown:
                                      8 March, Italy
                                                                                                      10000           Italy
                                                                                                                      South Korea
                                                                                                                      China              8 March, Italy

         1000                                                                                          1000         Lockdown:
                                                                                                                                15 March, Spain

                23 January,                                                                                                        23 January,
                China                                                                                                              China
          100                                                                                           100
                                                                              USA
                                                                              France
                                                                              Spain                                                                  17 March France
           10                                            17 March France                                 10
                                                                              Italy
                                                                              South Korea
                                                                              China
            1                                                                                             1
           1 January                       1 March                            1 May                        -40                      0                           40          80
                                                       Date                                                                                 'Shifted' time (days)
                                                                                                                 (D = 0 adjusted at the beginning of the exponential-growth regime)

 (e)                                          Daily deaths                                    (f)                                                Daily deaths
        10000                                                                                         10000
                                               19 March - 7 April, USA                                              USA
                        USA                                                                                                           19 March - 7 April, USA
                        France                                                                                      France
                                        17 March France                                                             Spain
                        Spain                                                                                                              8 March, Italy
                                                                                                                    Italy
                        Italy           15 March, Spain
                                                                                                                                        17 March,
         1000                                                                                          1000         South Korea
                        South Korea                                                                                                     France
                                        8 March, Italy                                                              China
                        China
                                                                                                                                 15 March, Spain
                   Lockdown:                                                                                         Lockdown:

                23 January,                                                                                                        23 January,
          100                                                                                           100
                China                                                                                                              China

           10                                                                                            10

            1                                                                                             1
           1 January                       1 March                            1 May                        -40                      0                           40          80
                                                       Date                                                                                 'Shifted' time (days)
                                                                                                                 (D = 0 adjusted at the beginning of the exponential-growth regime)

Figure 1. Focus on six countries: China, South Korea, Italy, Spain, France (mainland) and the USA [27–31]. Plots of cumulative
confirmed cases (a) versus date and (b) versus “shifted” time, of cumulative deaths (c) versus date and (d) versus “shifted” time, and of
daily deaths (e) versus date and (f) versus “shifted” time.

“shifted” time. For each country, the “shifted” time is                                        in all countries a few days or weeks after D = 0. An epidemic
adjusted so that day D = 0 corresponds to the extrapolation                                    peak corresponding to a several-week plateau in the time
to a number N = 1 of the exponential increase of cumulative                                    variation of the daily death number is visible for the six
deaths. A deviation from the exponential regime is observed                                    countries considered in Figure 1. This plateau was always
4                                                                                                                W. Knafo: 4open 2020, 3, 5

    (a)                           Daily confirmed cases & deaths                                     (b)                      Daily confirmed cases & deaths                                       (c)                       Daily confirmed cases & deaths
      10000                                                                                           10000                                                                                         10000
                Lockdown start:
                                                                                                                                         1 March
                  23 January                                   China                                                                                                       Daily confirmed cases
                                                                                                                                                                           Daily deaths                           Czech Republic
                                                                                                                                                                                                                                                    30 March
       1000                                                                                            1000                                                                                              1000
                                  4 February                       Lockdown lift:
                                                                       8 April
                                                                                                                  South Korea
                                                                                                                                                                                                                              Lockdown start: 14 March

          100                                                                                              100                                                                                            100
                                                                                                                                                      22 March                                                     Daily confirmed cases                       78April
                                                                                                                                                                                                                                                                 April

                                     16 February                                                                                                                                                                   Daily deaths

           10                                                                                               10                                                                                             10

                       Daily confirmed cases
                       Daily deaths
            1                                                                                                1                                                                                              1
           1 January                           1 March                              1 May                   1 January                     1 March                                    1 May                 1 January                     1 March                                    1 May
                                                      Date                                                                                         Date                                                                                          Date

    (d)                           Daily confirmed cases & deaths                                     (e)                      Daily confirmed cases & deaths                                       (f)                       Daily confirmed cases & deaths
                                                                                                     100000                                                                                        100000
                                                                  23 March
      10000                                                                                                                                                       28 March                                                                                       1 April
                                  Lockdown start: 8 March
                                                                                                                                 Lockdown start: 15 March
                                                                                                      10000                                                                                         10000                        Lockdown start: 17 March

       1000               Italy                                                                                           Spain                                                                                        France
                                                                                                       1000                                                                                              1000

                                                                 27 March
          100                                                                                                                                                   1 April
                                                                                                           100                                                                                            100
                                                                                                                                                                                                                                                                   11 April

           10                                                                                               10                                                                                             10
                                                                           Daily confirmed cases                                                                                                                       Daily confirmed cases
                                                                                                                        Daily confirmed cases
                                                                           Daily deaths                                                                                                                                Daily deaths
                                                                                                                        Daily deaths
            1                                                                                                1                                                                                              1
           1 January                           1 March                              1 May                   1 January                     1 March                                    1 May                 1 January                     1 March                                    1 May
                                                      Date                                                                                         Date                                                                                          Date

    (g)                           Daily confirmed cases & deaths                                     (h)                      Daily confirmed cases & deaths                                       (i)                       Daily confirmed cases & deaths
    1000000                                                                                          100000                                                                                        100000
                                                                                                                                                                                                                                                               29 March
                                      Lockdown start: 19 March - 7 April                                                                                                                                                       Lockdown start: 21-23 March
     100000
                                                                                                      10000                          Lockdown start: 23 March
                                                                                                                                                                                                    10000

                          USA                                                                                                                                                                                           Germany
      10000                                                                                                             United Kingdom
                                                                                                       1000                                                                                              1000

       1000
                                                                                                                                                                          12 April
                                                                                                           100                                                                                            100
          100
                                                                                                                                                                                                                                                                         15 April
                                                                                                            10                                                                                             10
           10                                                                Daily confirmed cases                                                                         Daily confirmed cases
                                                                                                                                                                                                                                                                         Daily confirmed cases
                                                                             Daily deaths                                                                                  Daily deaths
                                                                                                                                                                                                                                                                         Daily deaths

            1                                                                                                1                                                                                              1
           1 January                           1 March                              1 May                   1 January                     1 March                                    1 May                 1 January                     1 March                                    1 May
                                                      Date                                                                                         Date                                                                                          Date

Figure 2. Time variation of daily confirmed cases and deaths in a selection of nine countries: (a) China, (b) South Korea, (c) Czech
Republic, (d) Italy, (e) Spain, (f) France, (g) USA, (h) UK, and (i) Germany [27–35].

maintained to < 10 daily deaths in South Korea. It reached                                                                                                    constancies, depending on the considered country. A
100–200 daily deaths in China, 500–1000 daily deaths in                                                                                                       large proportion of cases are not detected. Also, the
the four considered Western Europe countries, and a maxi-                                                                                                     testing procedure often focuses on people suspected
mum of 2000–4000 daily deaths in the USA.                                                                                                                     to be infected.
    Figure S1 in the Supplementary Materials generalizes                                                                                                    ! When the number of cases increases, it becomes more
the graphs from Figure 1 to a total of 32 countries world-                                                                                                    difficult to detect all of them. Even in the countries
wide. It confirms that all countries follow similar trajecto-                                                                                                  equipped with the best detecting system, detection is
ries. A large scattering of the data is visible in the plots of                                                                                               less efficient when it approaches its maximal capacity
the cumulative confirmed cases as a function of the “shifted”                                                                                                  (saturation of a detector).
time (Fig. S1c). In contrast, the cumulative deaths plotted
as a function of the “shifted” time almost converge on a                                                                                                        In the next Sections, the number of deaths, thought to
unique line in the exponential regime of the pandemic prop-                                                                                                 be more reliable, will be considered preferentially. We note
agation (Fig. S1f). This difference can be explained as the                                                                                                 that voluntary or involuntary failures in death counting can
number of cumulative confirmed cases is a less reliable                                                                                                      also occur. This was for instance the case in France, where
quantity than the number of cumulated deaths, for the fol-                                                                                                  incomplete numbers of deaths (only deaths in hospitals)
lowing reasons:                                                                                                                                             were communicated before 1 April 2020. In the UK, the
                                                                                                                                                            deaths outside hospitals were also not counted before 29
! The tests on the population are done with different                                                                                                       April 2020. In many countries, only the deaths in hospitals
  financial resources, with different efforts, and different                                                                                                 have been counted so far.
W. Knafo: 4open 2020, 3, 5                                                 5

(a)                            Daily confirmed cases                              numbers of daily cumulative cases and deaths. However,
 10000                                                                            in Italy a few weeks after the peak the number of daily
                    Sweden                                                        deaths decreased at a slower rate than in China. In the
                    Norway
                                                                                  USA and in the UK, both daily confirmed cases and death
  1000      Lockdown start:                                                       tolls have been saturating in the last weeks of April, and no
                 12 March, Norway
                                                                                  clear peak emerged so far from the plateaus. In all of these
                                                                                  western countries (except the Czech Republic), daily con-
      100                                                                         firmed cases and death numbers are still several orders of
                                                                                  magnitude higher than those in China when lockdown
                                           27 March
                                                                                  was lifted [31], or than those in South Korea after the epi-
       10                                                                         demic peak.
                                       Lockdown lift:
                                                 20 April, Norway                      Figure 3 focuses on a comparison between two neighbors
                                                                                  from the Scandinavian Peninsula: Sweden and Norway.
        1                                                                         Beyond their geographic and climatic similarities, both
      1 February                             1 April                  1 June
                                                                                  countries are quite comparable in term of population and
                                              Date
                                                                                  density (10 million inhabitants and 450,000 km2 for Swe-
(b)                                    Daily deaths                               den, 5.4 million inhabitants and 385,000 km2 for Norway
  1000                                                                            [37]). The pandemic started in these two territories almost
                                    Lockdown lift:
                                           20 April, Norway                       simultaneously, as shown by the sudden increase of daily
                                                                                  confirmed cases after 1 March (Fig. 3a) and of the daily
                        Sweden
                        Norway
                                                                                  deaths (Fig. 3b) two weeks later in both countries. Two
      100                                                                         opposite strategies were followed by Sweden and Norway
                                                                                  to face the pandemic. Sweden was guided by the target to
                                                                                  let the pandemic spread over the territory, so that herd
             Lockdown start:
                                                                                  immunity [4–6] is achieved in a “natural” manner [38]. A
       10               12 March, Norway                                          few days after the first reported cases, Norway applied
                                                                                  strong measures and lockdown was set on 12 March [35],
                                                                                  i.e., before the first reported death. The effects of these mea-
                                                  10 April
                                                                                  sures are visible in Figure 3, with broad maxima centered
        1                                                                         on 27 March in the daily cumulative cases, and on 10 April
      1 February                             1 April                  1 June
                                                                                  in the daily deaths. In the beginning of May, the first epi-
                                              Date
                                                                                  demic wave almost ended in Norway, with < 1 “average”
                                                                                  daily deaths and < 30 daily confirmed cases. In Sweden,
Figure 3. Comparison of daily (a) confirmed cases and                              without lockdown the number of daily reported cases and
(b) deaths in Sweden and Norway [36, 37].
                                                                                  deaths increased before reaching a plateau with 300–900
                                                                                  daily confirmed cases and 10–200 daily deaths. A large noise
    Complementarily to Figure 1, Figure 2 presents a com-                         in the data indicates a difficulty to collect data in this coun-
parison, for a selection of nine countries in Asia and Western                    try. In the beginning of May 2020,  200 cumulative deaths
North hemisphere, of the variation with time of the daily                         were reported in Norway and > 3000 cumulative
confirmed cases and death tolls. For each country, the                             deaths were reported in Sweden, where the first epidemic
variation of the daily death number follows that of the daily                     wave was about to continue and to lead to a higher death
confirmed cases, with a delay of 5–10 days. In China, a sig-                       toll. The comparison between Sweden and Norway is a
nificant decrease of daily confirmed cases was observed                             direct illustration of the human cost of a herd immunity
10 days after the setup of lockdown [30], and the epidemic                        strategy.
peak in the number of daily deaths was observed 10 days
later. After this peak, the number of daily deaths has
                                                                                  Phenomenological description
decreased within an exponential decay, as indicated by the
negative-slope linear variation in the semi-logarithmic scale                     Definition of three epidemic regimes
of the graphs. Two months later, lockdown was lifted on 8
April [31]. At this date, there were a few daily deaths and                           Figure 4 focuses on the variation of cumulated death
 50–100 daily confirmed cases in China. The case of South                         and daily death tolls normalized per 100,000 inhabitants
Korea is unique: after an early increase of daily confirmed                        for four countries: China, South Korea, Italy and France.
cases, this number reached a maximum of  1000 before                             In the non-normalized graphs plotted in Figures 1b, 1d,
strongly decreasing. By the end of April, less than 2 daily                       1f, the date corresponding to the day D = 0 of the “shifted”
deaths and  10 daily confirmed cases were reported. Before                        time scale was defined by adjusting the extrapolation of the
May, the number of daily deaths has always been contained                         exponential-growth regime to N = 1 cumulative death.
to less than 10 in South Korea.                                                   Since the criterion N = 1 is not proportional to the popula-
    In the Czech Republic, Italy, Spain, France, and                              tion, if we compare two countries of different populations
Germany, the epidemic peak has been observed for both                             and hit at the same time by the pandemic, a later “shifted”
6                                                                         W. Knafo: 4open 2020, 3, 5

    (a)              Cumulative deaths / 100 000 inhabitants                                     ! Regime 2: exponential- and uncontrolled-growth phase.
          100        Italy                                                                          The propagation is wild and not slowed down. Cumu-
                     France                                                                          lative, but also daily, confirmed cases and deaths are
                     South Korea
                     China                                                                           increasing exponentially, and a universal law is fol-
           10
                                                                                                     lowed. In the semi-logarithmic-scale graphs presented
                                     Regime 2:                        Regime 3:
                  Regime 1:                                                                          here, all countries show a linear variation of similar
                                                                      Resorption
            1                       Uncontrolled
                                                                    (indicated for China)
                                                                                                     slope when they are in regime 2.
                 Pre-epidémic        exponential
                                       growth
                                                                                                 ! Regime 3: resorption phase.
           0.1                                                                                      After a deviation from the exponential-growth
                                                                                                     regime 2, this phase corresponds to a decay of the
          0.01                                                                                       epidemic propagation. Here, we define the transition
                                                                                                     (in fact a broad crossover) from regime 2 to regime 3
                                                                                                     at the date when the numbers of daily death tolls
      0.001
           -20                  0                  20              40                       60       passes through a maximum, which is identified as
                                      'Shifted' time (days)                                          the epidemic peak. The decline of the epidemic
                 (D = 0 adjusted at the beginning of the exponential-growth regime)                  propagation ends asymptotically by a saturation
                                                                                                     of the cumulative death number. Regime 3 can be
    (b)                   Daily deaths / 100 000 inhabitants                                         the result of several causes:
           10
                     Italy                                                                            the success of a national policy in the slowing
                     France                                                                             down of the virus propagation (mitigation, con-
                     South Korea
                     China
                                                                                                        tainment, lock-down, vaccination, etc.),
            1
                                                                                                      a number of contaminated cases approaching the
                  Regime 1:
                                     Regime 2:                                                         total population, which was not immunized before
                                    Uncontrolled                                                       the epidemic (if there is fewer persons to contam-
                 Pre-epidémic        exponential                      Regime 3:
           0.1
                                       growth
                                                                                                       inate, there will be less infected people), meaning
                                                                      Resorption
                                                                                                       that herd immunity is approaching,
                                                                                                      particular local conditions (weather, human den-
                                                                    (indicated for China)

          0.01                                                                                         sity, age, obesity in the population) unfavorable
                                                                                                       to the virus, or
                                                                                                      a failure (voluntary or not) in the counting system.
      0.001
           -20                  0                  20              40                       60
                                      'Shifted' time (days)
                 (D = 0 adjusted at the beginning of the exponential-growth regime)                 While the transition between regimes 1 and 2 is sharp
                                                                                                 and fast, that between regimes 2 and 3 is progressive and
Figure 4. Identification of three regimes in a single-wave                                        spreads over several weeks. Successive waves can also occur
epidemic propagation, illustrated with their signatures in the                                   on a given territory, leading to a more complex variation of
variation of (a) cumulative deaths/100,000 inhabitants and                                       the death number than that presented here for a single
(b) daily deaths/100,000 inhabitants of Italy, France, South                                     wave.
Korea, and China.
                                                                                                 Two-parameters description of first-epidemic waves

                                                                                                     A universal behavior is observed in regime 2 where the
date D is artificially defined for the country of smaller                                          epidemic dynamics is out of control. An open question is
population. The consideration of data normalized with                                            whether the transition between the regimes 2 and 3 is also
regard to the population permits one to avoid this artefact.                                     universal, or if it depends on local specificities, as an inter-
In Figure 4, but also in the next graphs presenting tolls                                        action rate in the population, the efficiency of social distanc-
normalized per 100,000 inhabitants, the day d = 0 is defined                                      ing, mitigation, containment or lockdown when applied.
as the extrapolation of the exponential-growth regime                                            Here, extrapolations are made with the crude, but perhaps
to n = 0.001 cumulative deaths/100,000 inhabitants.                                              not unrealistic, assumption that for each epidemic wave the
Normalized death tolls will be systematically considered                                         transition between regimes 2 and 3, and then the resorption
in Section “Comparison of the propagation of the pandemic                                        in regime 3, are similar to those reported for the first epi-
for a selection of countries”.                                                                   demic wave in China. The evolutions of the cumulative
    Figure 4 indicates that three regimes can be identified in                                    death tolls in several countries are estimated using a
a single-wave propagation of the pandemic:                                                       single-wave smoothed curve constructed from the Chinese
                                                                                                 cumulative death variation, or using the superposition of
! Regime 1: pre-epidemic phase.                                                                  two successive waves. For most of the countries considered
   Zero or a few isolated cases are reported, and the                                           at this stage (data up to 8 May 2020) the assumption of a
    propagation rhythm is zero or weak. In this regime,                                          unique epidemic wave is proposed to fit the data within a
    the epidemic is kept at bay.                                                                 first approximation. Higher final numbers than those given
W. Knafo: 4open 2020, 3, 5                                                                                                                                                          7

 (a)                               Cumulative deaths                                           b)                               Cumulative deaths                                              (c)                             Cumulative deaths
  100000                                                                                          100000                                                                                           100000                                                                              80 000

                                                                                          28 000                                                                                                                                                                                      34 000
                        France                                                                                                                                                            31 500                   USA
                        China                                                                                                                                                                                      United Kingdom                                                     29 000
   10000                                                                                           10000     Lockdown: 8 March, Italy                                                               10000          Spain
                                                                                                                                                                                                                   Germany                                                            8 000
               Lockdown:
                                                                                                                                                                                                                   China                                                              3 300
                                                                                          3 300                                                                                            3 300
                   17 March, France
       1000                                                                                          1000                                                                                            1000

                     23 January,                                                                                 23 January,
                                                                                                                                                                                   250
        100          China                                                                            100        China                                                                                100

         10                                                                                            10                                                        Italy                                 10
                                                                                                                                                                 China
                                                                                                                                                                 South Korea
          1                                                                                             1                                                                                               1
                       0                       40                       80                                          0                        40                         80                                           0                         40                          80
                                      'Shifted' time (days)                                                                        'Shifted' time (days)                                                                         'Shifted' time (days)
               (D = 0 adjusted at the beginning of the exponential-growth regime)                           (D = 0 adjusted at the beginning of the exponential-growth regime)                              (D = 0 adjusted at the beginning of the exponential-growth regime)

 (d)                                    Daily deaths                                           (e)                                    Daily deaths                                             (f)                                  Daily deaths
                                                                                                                                                                                                    10000
                                                                                                                Italy                                                                                            USA
                       France                                                                                                                                                                                                                                        extrapolated
                                                                                                                China                                           extrapolated                                     United Kingdom
                       China                                                                         1000                                                                                                                                                            first-wave final toll:
       1000                                                      extrapolated                                   South Korea                                     first-waves final toll:                          Spain
                                                                 first-wave final toll:                                                                                                                          Germany
                   17 March, France                                                                               8 March, Italy                                                                     1000                                                                 80 000 deaths
                                                                                                                                                                                                                 China
                                                                                                                                                                               total: 31 500
              Lockdown start:                                                                                                                                                   wave 2: 11 500
                                                                          28 000 deaths                                                                                                                                                                                     34 000 deaths
        100                                                                                           100   Lockdown:                                                             wave 1: 20 000
                     23 January,                                                                                                                                                                                                                                            29 000 deaths
                                                                                                                                                                                                      100
                     China                                                                                    23 January,
                                                                                                              China
                                                                              China                                                                                                                                                                                           8 000 deaths
                                                                              = 3 300 deaths                                                 total: 250
         10                                                                                            10
                                                                              (corrected: 4 600)
                                                                                                                                                                                                       10                                                                        3 300 deaths
                                                                                                                                                                                 3 300 deaths
                                                                                                                                                                                                                                                                                 (corrected 4600)
                                                                                                                                                                                 (corrected 4600)

                                                                                                                                                  wave 2: 135
                                                                                                                               wave 1: 115
          1                                                                                             1                                                                                               1
                       0                       40                       80                                          0                        40                         80                                           0                         40                          80
                                      'Shifted' time (days)                                                                        'Shifted' time (days)                                                                         'Shifted' time (days)
               (D = 0 adjusted at the beginning of the exponential-growth regime)                           (D = 0 adjusted at the beginning of the exponential-growth regime)                              (D = 0 adjusted at the beginning of the exponential-growth regime)

Figure 5. Extrapolation of (a) cumulative and (d) daily death numbers in France, assuming a unique wave similar to that reported
in China. Extrapolation of (b) cumulative and (e) daily death numbers in Italy and South Korea, assuming two successive epidemic
waves, each one being similar that reported in China. Extrapolation of (c) cumulative and (f) daily death numbers in the USA, UK,
Spain and Germany, assuming a unique wave similar to that reported in China.

here can be reached later, if deviations from a single-wave                                                                                               dates in the different states). Long plateaus in the USA
behavior are induced by less-efficient lockdown measures,                                                                                                  and UK data suggest that a single wave contribution,
resurging waves or late death-toll corrections. A long pla-                                                                                               scaled from the Chinese first-wave data, might not be suffi-
teau instead of a sharp epidemic peak can be the signature                                                                                                cient to fit the data, and that higher final tolls may be
of less-efficient or hasty-lifted lockdown measures.                                                                                                       expected. For Italy and South Korea two successive waves
    For each wave, two parameters, an offset in time and a                                                                                                are used to describe a long epidemic plateau. For Italy, the
scaling factor in the death number, are adjusted to repro-                                                                                                fit is compatible with a first wave of 20,000 final cumulative
duce both cumulative and daily death variations. A factor                                                                                                 deaths, with a maximum peaked 40 days after the start of
F is also defined as the ratio of cumulative deaths at the                                                                                                 regime 2, and a second wave of 11,500 final cumulative
beginning of the lockdown and at the end of the epidemic                                                                                                  deaths, with a maximum peaked 60 days after the start of
wave. Efficient lockdown measures are associated with a                                                                                                    regime 2. For South Korea, the fit is compatible with a first
smaller value of F.                                                                                                                                       wave of 115 final cumulative deaths, with a maximum
    Graphically, in a semi-logarithmic scale this corresponds                                                                                             peaked 20 days after the start of regime 2, and a second
to a translation of the dashed black line initially adjusted on                                                                                           wave of 135 final cumulative deaths, with a maximum
China’s data. These fits summarized in Figure 5 do not                                                                                                     peaked 50 days after the start of regime 2. The results from
intend to precisely predict the final number of cumulative                                                                                                 these phenomenological fits are in good agreement with
deaths for an on-going epidemic wave. They show that,                                                                                                     those from more sophisticated models (see for instance [15]).
within a first approximation, the dynamics of a COVID-19                                                                                                       Figure 6 summarizes the fits made here for the USA,
wave is similar in the different countries, and they indicate                                                                                             UK, Spain, Italy, France, and Germany. In this graph,
the typical time scales and the orders of magnitude of the                                                                                                the daily death tolls are plotted as function of non-shifted
final death tolls expected at the end of an epidemic wave.                                                                                                 date. Two months after an epidemic peak of 100–200 daily
    For France, the best fit to the data, with a factor                                                                                                    deaths, China ended the lockdown in Wuhan, where the
F = 160, corresponds to a final number of 28,000 cumula-                                                                                                   virus has been the most active, on 8 April [31]. At this date,
tive deaths for the first wave. Fits are compatible with                                                                                                   the daily death number was of the order of 1. An almost-
extrapolations for the first wave to 8000 final cumulative                                                                                                  constant negative slope in the evolution of the daily death
deaths in Germany (F = 80), 29,000 final cumulative in                                                                                                     numbers, in this semi-logarithmic plot, was reported during
Spain (F = 100), 34,000 final cumulative deaths in the                                                                                                     the two months after the epidemic peak in China. It indi-
UK (F = 100), and 80,000 final cumulative deaths in the                                                                                                    cates an exponential decay of the daily death number with
USA (F cannot be estimated due to different lockdown                                                                                                      time. Assuming a similar decay for the other countries,
8                                                                                                           W. Knafo: 4open 2020, 3, 5

                                                   Daily deaths                                                                                     Comparison of the propagation of the pandemic
10000
                      USA
                                                                                                                                                    for a selection of countries
                      United Kingdom                                                   Extrapolated
                      Spain
                                                                                                                                                        While the raw data presented in Section “Spread of the
                                                                                       first-waves final toll:
                      Italy
                      France                                                               USA: 80 000 deaths
 1000                 Germany
                      China                                                                United Kingdom: 34 000 deaths
                                                                                                                                                    pandemic in a selection of Asian and Western countries”
             China: 3 300 deaths                                                              Spain: 29 000 deaths
                                                                                                                                                    spotlight the countries with a large population, in this sec-
             (corrected 4 600)                                                                  France: 28 000 deaths                               tion we consider graphs where the cumulative and daily
    100                                                                                          Italy: 31 500 deaths
                                                                                                                                                    death tolls have been normalized with regard to the popu-
                                                                                                                                                    lation [37] (see Sect. “Definition of three epidemic regimes”).
                                                                                                   Germany: 8 000 deaths

                                                              8 April :
                                                              Lockdown end
                                                              in Wuhan (China)
                                                                                                                                                    This permits to quantitatively compare the spread of the
     10                                                                                                                                             pandemic in countries of different populations.
                                                                                                                                                        Figure 7 presents the cumulative and daily death tolls
                                                                                                                                                    normalized per 100,000 inhabitants as function of a “shifted”
      1                                                                                                                                             time, for a selection of 32 countries worldwide (data ending
    1 January                            1 March                         1 May                                  1 July
                                                           Date                                                                                     in the beginning of May 2020). Complementary plots of
                                                                                                                                                    confirmed cases and deaths data for these countries are pre-
Figure 6. Fit to the daily death tolls as function of date in the                                                                                   sented in the Supplementary Materials (Fig. S1). In most of
USA, the United Kingdom, Spain, France, Italy and Germany,                                                                                          the countries, a similar exponential-growth regime is
assuming epidemic waves dynamics similar to that reported in                                                                                        observed in the time-evolution of the death numbers.
China.                                                                                                                                                  The efficiency of the measures taken in Asia is revealed
                                                                                                                                                    spectacularly in the graphs of Figure 7: the death tolls per
longer lockdown duration is expected in countries where the                                                                                         100,000 inhabitants are two orders of magnitude smaller
epidemic peak reached a higher level. However, contrary to                                                                                          in Asian countries than in the western countries listed
the Chinese strategy, in beginning of May 2020 most of the                                                                                          above. A maximum of 3–4 daily deaths/100,000 inhabitants
Western countries were planning to lift their lockdown mea-                                                                                         has been reported in Belgium, which is the mostly-affected
sures soon after the epidemic peaked, at a date where hun-                                                                                          country. Maxima of 1–2 daily deaths/100,000 inhabitants
dreds of daily deaths were still being reported (see for                                                                                            were reported in several Western Europe countries, as
instance [39]).                                                                                                                                     Spain, France, Italy, UK and Sweden, and in the USA.

      (a)                Cumulative deaths / 100 000 inhabitants                                    (b)                Cumulative deaths / 100 000 inhabitants                             (c)                Cumulative deaths / 100 000 inhabitants
          100                                                                                           100                                                                                      100
                           China
                           South Korea
                           Hong-Kong                                         Asia                                      Europe                                                                               Other continents
            10             Japan                                                                          10                                                                                      10
                           Philippines
                           Singapore
                           Taiwan
             1                                                                                             1                                                                                       1
                                                                                                                                                                          Belgium
                                                                                                                                                                          Spain                                                                                       USA
                                                                                                                                                                          Italy                                                                                       Iran
                                                                                                                                                                          France                                                                                      Turkey
            0.1                                                                                           0.1                                                             United Kingdom         0.1                                                                  Brazil
                                                                                                                                                                          Netherlands                                                                                 India
                                                                                                                                                                          Sweden                                                                                      Mexico
                                                                                                                                                                          Switzerland                                                                                 Morocco
                                                                                                                                                                          Portugal                                                                                    Israel
          0.01                                                                                         0.01                                                               Germany            0.01                                                                     Russia
                                                                                                                                                                          Norway                                                                                      Australia
                                                                                                                                                                          Czech Republic                                                                              South Africa
                                                                                                                                                                          Greece                                                                                      Nigeria
       0.001                                                                                         0.001                                                                                  0.001
                  0                           40                            80                                  0                           40                            80                           0                           40                            80
                                           'Shifted' time (days)                                                                         'Shifted' time (days)                                                                  'Shifted' time (days)
                      (D = 0 adjusted at the beginning of the exponential-growth regime)                            (D = 0 adjusted at the beginning of the exponential-growth regime)                     (D = 0 adjusted at the beginning of the exponential-growth regime)

      (d)                      Daily deaths / 100 000 inhabitants                                   (e)                      Daily deaths / 100 000 inhabitants                            (f)                      Daily deaths / 100 000 inhabitants
            10                                                                                            10                                                                                      10
                            China
                            South Korea                                     Asia                                       Europe                                                                               Other continents
             1              Hong-Kong                                                                      1                                                                                       1
                            Japan
                            Philippines
                            Singapore
                            Taiwan
            0.1                                                                                           0.1                                                                                    0.1
                                                                                                                                                                                                                                                                      USA
                                                                                                                                                                                                                                                                      Iran
                                                                                                                                                                                                                                                                      Turkey
          0.01                                                                                         0.01                                                                                  0.01                                                                     Brazil
                                                                                                                                                                                                                                                                      India
                                                                                                                                                        Belgium          Switzerland                                                                                  Mexico
                                                                                                                                                        Spain            Portugal                                                                                     Morocco
                                                                                                                                                        Italy            Germany                                                                                      Israel
       0.001                                                                                         0.001                                              France           Norway
                                                                                                                                                                                            0.001                                                                     Russia
                                                                                                                                                        United Kingdom   Czech Republic                                                                               Australia
                                                                                                                                                        Netherlands      Greece                                                                                       South Africa
                                                                                                                                                        Sweden                                                                                                        Nigeria
        1E-4
      0.0001                                                                                          1E-4
                                                                                                    0.0001                                                                                   1E-4
                                                                                                                                                                                           0.0001
                  0                           40                            80                                  0                           40                            80                           0                           40                            80
                                           'Shifted' time (days)                                                                         'Shifted' time (days)                                                                  'Shifted' time (days)
                      (D = 0 adjusted at the beginning of the exponential-growth regime)                            (D = 0 adjusted at the beginning of the exponential-growth regime)                     (D = 0 adjusted at the beginning of the exponential-growth regime)

Figure 7. Cumulative and daily death tolls per 100,000 inhabitants for a selection of 32 countries worldwide. Cumulative deaths per
100,000 inhabitants versus “shifted” time (a) in Asian countries, (b) in European countries, and (c) in countries from other continents.
Daily deaths per 100,000 inhabitants versus “shifted” time (d) in Asian countries, (e) in European countries, and (f) in countries from
other continents.
W. Knafo: 4open 2020, 3, 5                                                       9

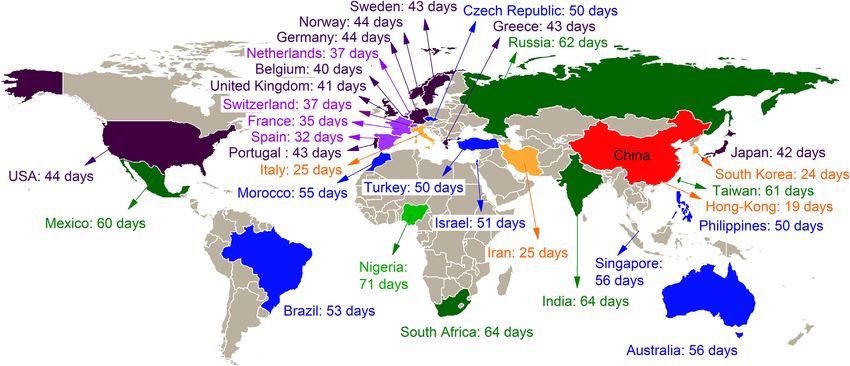
Figure 8. World map and shifts in days of the beginning of the epidemic exponential-growth regime 2, for a selection of 31 countries,
in comparison with China.

The spread of the pandemic is heterogeneous in Europe,              ! Group A: Taiwan, Hong Kong, Japan, China, Singa-
and countries as Greece, Czech Republic, and Norway                   pore, Philippines, South Korea, Nigeria, South Africa,
succeeded to contain it to < 0.2 daily deaths/100,000                 India, India, Australia, Morocco.
inhabitants, which is 5–10 times higher than the rates                 The pandemic was contained to low levels, with less
< 0.05 daily deaths/100,000 inhabitants reported in Asian               than 0.5 cumulative death/100,000 inhabitants. In
countries.                                                              most of these countries measures were taken in reac-
    In the Supplementary Materials (Section S4 “Focus on                tive and efficient way. The early measures (including
the propagation of COVID-19 in France”), we show that                   high-level of testing, massive use of masks, insulation
similar inhomogeneity can be observed at a national scale,              of detected cases) taken in some of these countries, as
once regions and departments are considered separately.                 South Korea [55] and Hong Kong [56], permitted to
In other parts of the world (Africa, South America, Aus-                avoid lockdown and to preserve a “minimal” eco-
                                                                        nomic activity. In other countries from Group A, a
tralia), the reported death numbers indicate a situation
                                                                        late arrival of the virus combined with local specifici-
in-between that in Asia and that in mostly-affected western             ties (weather, age of population, etc.) perhaps helped
countries, due to the combination of late arrivals of the               to keep low death tolls in the beginning of May 2020.
virus on the territory and possible local specificities (density
of population, weather, etc.).                                      ! Group B: Russia, Mexico, Greece, Brazil, Czech Repub-
    The world map in Figure 8 indicates the delays in the             lic, Israel, Turkey, Norway.
worldwide propagation of the COVID-19. The “shifts” in                 These countries have been “weakly” affected by the
time used in the data plotted in Figure 7, in relation with              pandemic, with between 1 and 5 cumulative
the delayed onset of the exponential-growth regime 2 (see                deaths/100,000 inhabitants. In Europe, the results
Fig. 4) are indicated for the countries considered here. This            obtained in Greece, Czech Republic, and Norway
Figure shows that, four months after the first cases reported             contrast with those from their neighbors, most of
in China, all parts of the globe have been hit by the pan-               them being in Group D. In the beginning of May
demic. After Asia, the pandemic arrived in South-West                    2020, the daily death tolls in Brazil, Mexico, and
Europe and then expanded to the North and East of Eur-                   Russia continued increasing, and these countries
ope, to the USA, and finally to the rest of the world.                    may later downshift to Group C.
    Table 1 summarizes the situation for the countries con-
sidered here. It shows that the pandemic spread in the dif-         ! Group C: Iran, Germany, Portugal.
ferent countries is weakly-correlated with the date of arrival         From the official tolls, these countries are in a better
of the pandemic. This means that the experience gained by               situation than the countries from Group D. However,
early-hit countries did not benefit to all lately-hit countries.         the situation is not optimal, since between 8 and 11
The countries considered here are classified in a four-group             cumulative deaths/100,000 inhabitants were
scheme, depending on the degree of spread of the pandemic               reported, which is more than a factor 20 higher than
in their population on 8 May 2020:                                      in the countries from Group A.
10                                               W. Knafo: 4open 2020, 3, 5

! Group D: USA, Switzerland, the Netherlands, Sweden,                 In real life, measurements are imperfect and the means
  UK, France, Italy, Spain, Belgium.                             to detect COVID-19 cases are more or less efficient, depend-
   This “group” is composed of countries from Western           ing on the country. The large scattering of data in Figure 9
    Europe and North America. Fashionable theories               mainly results from these counting limitations. Since cumu-
    (herd immunity scenario [4–6]) and a confidence in            lative death tolls are expected to be more reliable than con-
    health system perhaps led to a delayed state reaction        firmed case tolls, the ratio at the end of an epidemic wave
    against the pandemic propagation. Lockdown mea-              reaches a value higher than the fatality rate when measure-
    sures were applied late, when the numbers of cumu-           ments are imperfect. We can suspect that a small country
    lative deaths were already high, leading to much             doing a high number of tests may be able to reach a ratio
    higher epidemic peaks and cumulative death tolls             close to the fatality rate. This may be the case of Hong-
    than in the countries from the Groups A–C. Between           Kong, for which the ratio converges to 0.4% at the end of
    20 and 75 cumulative deaths/100,000 inhabitants
                                                                 the epidemic wave and may be compatible with a fatality
    were counted on 8 May 2020 in these countries. A
    maximum of 3–5 daily deaths/100,000 inhabitants              rate of  0.5%. This rate is in good agreement with esti-
    was reported in Belgium, and maxima of 1–2 daily             mates of fatality rates, ranging from 0.5 to 1.5%, proposed
    deaths/100,000 inhabitants were reported in Spain,           in references [9, 10, 57]. We note that a smaller ratio 0.1%
    France, Italy, Sweden, UK and USA. In the begin-             was observed in Singapore in the beginning of May 2020,
    ning of May 2020, Sweden was the last strongly-              but an epidemic wave was still on-going and this ratio could
    affected country having the strategy to reach herd           converge to a higher value after the wave.
    immunity without lockdown measures [38]. Its situa-               From this rough, but presumably reasonable assump-
    tion may continue worsening until herd immunity is           tion of a fatality rate of 0.5%, we can estimate the order
    achieved or until the Swedish government changes its         of magnitude of the already-infected part of the population
    strategy.                                                    in each country by applying a factor 200 to the cumulative
                                                                 death number. Due to the delay between infections and
                                                                 their consequences (including deaths), this estimation is
     Table 1 also indicates that a clear relation exists         more appropriate for countries at the end of an epidemic
between the earliness of application of lockdown measures        wave. Table 1 shows the estimated proportions of the pop-
and the efficiency to contain the pandemic spread. From           ulation infected by the coronavirus SARS-CoV-2 at the
most of the countries considered here, the epidemic peak,        date of 29 April 2020: less than 0.1% in countries of the
i.e., the center of the maximal plateau in the daily deaths      Group A, between 0.1 and 1% in countries of the Group
variation is observed 20–25 days after the application of        B, between 1 and 2% in countries of the Group C, and
lockdown. The effects of a lockdown are, thus, observable        more than 4% in countries of the Group D. A maximum
quite late, which indicates the importance of applying it        of 15% of infected people is estimated for Belgium, which
immediately after the start of an epidemic wave. The Sec-        is the mostly-affected country. For all countries from Group
tion S2 “Consequences of a delay in the lockdown start” in       D, these tolls remain far below from the proportion of
the Supplementary Materials presents this point in more          60% expected to achieve herd immunity. We note that
details. Early lockdown dates, before or a few days after        lower proportions may be sufficient to reach herd immu-
the d = 0 start of the exponential-growth regime 2, charac-      nity in areas with heterogeneous densities of population
terize the countries from Group A (those which needed to         [58].
apply lockdown). On the contrary, all countries from Group            In the mostly-affected parts in Europe (as department
D (with the exception of Sweden) applied a late lockdown,        Bas-Rhin in France, see Section S4 “Focus on the propaga-
about three weeks after the start of the exponential-growth      tion of COVID-19 in France” in the Supplementary
regime 2. Most countries from Groups B and C are in an           Materials), a maximum of about 100 cumulative deaths
intermediate situation.                                          per 100,000 inhabitants was reported and we can estimate
     Figure 9 presents the time variation of the ratio between   that 20% of the population was contaminated. In these
the cumulative deaths and confirmed cases for the selection       highly-affected areas, the number of contaminated cases is
of countries considered here. The “shifted” times used in this   still far from the proportion of 60%. On 8 May 2020,
graph were defined by considering normalized death tolls          New-York City was one of the mostly-affected areas in
per 100,000 inhabitants (see Fig. 7). Even in the case of a      the world, with 19,561 cumulative deaths reported [24],
perfect “measurement”, where the cumulated deaths and            which corresponds to 0.235% of its population of 8.3 million
confirmed cases would be well-estimated, their ratio would        inhabitants [59]. Assuming a fatality rate of 0.5%, we can
not be constant with time, due to the time delay between         estimate that 47% of the population was infected by the
contaminations and deaths. For a perfect “measurement”,          virus. New-York city may be soon one the first areas with
this ratio would lead asymptotically to the fatality rate of     several million inhabitants where herd immunity may be
the epidemic at the end of an epidemic wave. However, this       achieved. These rough estimations also confirm that herd
rate is not universal, since it can vary from one country to     immunity would be an option of very high human cost if
another, due to different weather conditions, population         achieved on a worldwide scale (see Section S3 “What could
characteristics (age, obesity, density, etc.), medical care      be expected without containment measure?” in the Supple-
means, and possibly virus mutations.                             mentary Materials).
W. Knafo: 4open 2020, 3, 5                                                 11

Table 1. Comparison of characteristic times in the propagation of the pandemic, deaths rates (maximum daily deaths and cumulative
death tolls, normalized per 100,000 inhabitants, observed till the 8 May 2020) for the selection of 32 countries considered here.
Lockdown start and lift dates are from references [26–36, 40–54]. Assuming a fatality rate of 0.5%, the percentage of population
already hit by the virus is estimated for each country. The countries are ranked into four Groups A–D, depending on the degree of
propagation of the pandemic in their population.

Country       Start of Delay in Lockdown Lockdown       Peak in Lock- Lockdown Daily deaths/ Cumulative Estima- Group
              regime 2 comparison start     start          daily down    lift     100,000     deaths/    tion of
               (d = 0)    with            (shifted      reported  lift (shifted inhabitants   100,000    contam-
                         China            time d)         cases/       time d)  (maximum) inhabitants     inated
                                                         deaths                 8 May 2020 8 May 2020 population
                                                        (shifted                                            (%)
                                                         time d)                                       8 May 2020
Taiwan        22 Mar     61          –         –          1/–       –        –        < 0.01          0.03        0.005      A
Hong Kong      9 Feb     19          –         –          48/–      –        –        < 0.01          0.05         0.01      A
China         21 Jan      0       23 Jan       2         14/26    8 Apr     78       0.01–0.02        0.32         0.06      A
Singapore     17 Mar     56       7 Apr        21         34/–      –        –       0.01–0.02        0.34         0.07      A
Japan         03 Mar     42          –         –          44/–      –        –       0.01–0.03        0.46         0.09      A
South         14 Feb     24          –         –         16/37      –        –       0.01–0.02        0.50         0.10      A
Korea
Philippines   11 Mar     50       15   Mar    4           –/–       –       –        0.01–0.03        0.64         0.13      A
Nigeria        1 Apr     71       30   Mar    2          –/–       –       –       0.002–0.01        0.06         0.01      A
India         25 Mar     64       25   Mar    0           –/–       –       –       0.004–0.015       0.15         0.03      A
South         25 Mar     64       26   Mar    2           –/–       –       –        0.01–0.03        0.30         0.06      A
Africa
Australia     17 Mar     56       23 Mar       6          10/–      –       –        0.01–0.03        0.38         0.08      A
Morocco       16 Mar     55       20 Mar       4         36/24      –       –        0.01–0.03        0.51         0.10      A
Russia        23 Mar     62       31 Mar       8          –/–       –       –        0.05–0.07         1.2         0.24      B
Greece        4 Mar      43       23 Mar       19         26/–      –       –        0.03–0.07         1.4         0.29      B
Mexico        21 Mar     60       21 Apr       31                   –       –        0.15–0.2          2.5         0.50      B
Czech         11 Mar     50       14 Mar       3         19/27      –       –        0.1–0.15          2.6         0.51      B
Republic
Israel        12 Mar     51          –         –         21/32     –         –         0.1–0.2         2.9         0.58      B
Norway        5 Mar      44       12 Mar       7         22/36    20        46        0.1–0.25         4.0         0.81      B
                                                                  Apr
Turkey        11 Mar     50            –       –         33/38     –        –          0.15            4.4         0.88      B
Brazil        15 Mar     53            –       –          –/–      –        –         0.3–0.4         4.75         0.95      B
Iran          15 Feb     25         –          –         43/41      –       –         0.15–0.2         7.9         1.6       C
Germany       5 Mar      44     21–23 Mar    16–18       24/41      –       –          0.2–0.5         9.0         1.8       C
Portugal      4 Mar      43      19 Mar        15        28/36      –       –            0.3          10.9         2.2       C
Switzerland 27 Feb       37      17 Mar        19        28/40      –       –          0.5–1          21.2         4.2       D
USA         5 Mar        44      19 Mar–     14–33        –/–       –       –         0.5–1.5         23.5         4.7       D
                                  7 Apr
The           27 Feb     37      23 Mar        25        40/44      –       –         0.7–1.5         31.3         6.3       D
Netherlands
Sweden        4 Mar      43          –         –          –/–       –       –           1–2           31.8          6.4      D
France        26 Feb     35       17 Mar       20        40/45      –       –           1–2           40.2          8.0      D
UK            02 Mar     41       23 Mar       21         –/–       –       –          1–1.5          46.3          9.3      D
Italy         15 Feb     25        8 Mar       22        37/41      –       –          1–1.5          49.8         10.0      D
Spain         22 Feb     32       15 Mar       22        35/39      –       –            2            56.3         11.3      D
Belgium       1 Mar      40       18 Mar       17        39/45      –       –           3–5           74.1         14.8      D

Discussion                                                        lockdown was lifted 80 days after its application [31], while
                                                                  an average rate of < 1 death per day was reported. In South
    The Asian countries from the Group A succeeded to             Korea, an early reaction permitted to isolate most of the
contain the spread of the pandemic to low levels. In China,       contagious cases and to early curb the pandemic dynamics,
lockdown was applied early after the identification of a           with a total of 250 cumulative deaths counted at the begin-
starting epidemic wave [30]. An epidemic peak with a rate         ning of May 2020. To keep a low number of contagious
of 100–200 deaths per day was reached 20 days later, and          cases, and thus, a low number of new contaminated cases,
12                                                                       W. Knafo: 4open 2020, 3, 5

      Ratio cumulative deaths / confirmed cases (%)                                           additional difficulties in the Western Europe countries from
                         China          United Kingdom   Philippines   Norway
                                                                                              Group D.
                         South Korea    Netherlands      Singapore     Israel
100                      Hong-Kong      Belgium          Taiwan        Czech Republic
                         Iran           Germany          India         Greece
                         Italy          Turkey           Mexico        Russia
                         Spain          Brazil           Morocco       Australia
                         USA            Sweden           Switzerland   South Africa
                         France         Japan            Portugal      Nigeria
                                                                                              Summary
 10
                                                                                                  The graphs and the phenomenological descriptions pre-
                                                                                              sented here emphasize the importance of applying reactive
                                                                                              and efficient measures against the propagation of the
  1                                                                                           COVID-19 pandemic, at least if one wants to fight against
                                                                                              it. Such intensive effort may be needed as long as herd
                                                                                              immunity is not achieved, either by a global vaccination
                                                                                              campaign or by a free (voluntarily or not) spread of the
0.1                                                                                           pandemic in a population. The COVID-19 pandemic
                                                                                              revealed the weak preparation of several countries, in parti-
            0                      40                     80                            120
                                                                                              cular in Western Europe and the USA. An application of
                           'Shifted' time (days)
      (D = 0 adjusted at the beginning of the exponential-growth regime)
                                                                                              the methods which proved to be successful in Asia, rather
                                                                                              than alternative and risky methods, is suggested for the
Figure 9. Ratio between cumulative deaths and confirmed case                                   countries facing strong epidemic waves. Additional compli-
tolls for the selection of 32 countries considered here.                                      cations could come from a seasonality of the virus, which
                                                                                              would prevent reaching herd immunity without a vaccine.
                                                                                                  In beginning of May 2020 several questions are still
the strategy of Asian countries of Group A can be summa-                                      open:
rized by the main measures [55, 56]:
                                                                                              ! Are the measures taken in Asian countries, as China
! Systematic tests and survey of the population com-                                            and South Korea, sufficient to limit COVID-19 resur-
   bined with a fast isolation of new contaminated cases.                                       gences to ripples associated with a “few” tens or hun-
! A massive use of protection masks.                                                            dreds of cumulative deaths? Is it possible to maintain
! A strict surveillance of national frontiers, with quaran-                                     the pandemic to such low level, during 10–20 months,
  tine imposed to all new incomers.                                                             i.e., the expected timescale for a vaccine available in
                                                                                                large quantities?
    The results obtained so far can be considered as a                                        ! How will Western Europe countries proceed to try
validation of this strategy. They may allow continuing an                                       avoiding resurging waves? Will they apply similar
economic activity without risking the resurgence of large                                       measures than the Asian countries, or will they experi-
epidemic waves. Bilateral agreements between “safe” coun-                                       ment alternative methods? In particular, can a hasty
tries may permit to reopen progressively the frontiers and                                      lift of lockdown lead to the resurgence of epidemic
                                                                                                waves of significant magnitude? In such case, could
to restart economic exchanges.
                                                                                                herd immunity be achieved rapidly?
    In most of the countries from Group B, after the end of
                                                                                              ! How the situation will evolve in the countries of
the first epidemic wave, the levels of contagious people are                                      South America, Africa and Oceania, where the late arri-
or will remain low enough to hope avoiding a second devas-                                       val of the pandemic, possibly combined to local speci-
tating wave, once appropriate measures are taken. A similar                                      ficities (weather, age of population, etc.), permitted
method to that applied in Asian countries may constitute a                                       them not to be heavily-hit in the beginning of May
healthy strategy for the forthcoming weeks/months. A dif-                                        2020?
ficulty will be to avoid infections exported by their neigh-
bors from Groups C and D.                                                                     Nomenclature of abbreviations
    In the countries from Groups C and D, the successful
strategy and the experience gained by early-hit countries
                                                                                              N          Number of cumulative deaths.
in Asia was not considered, and confused political commu-
                                                                                              D=0        Corresponds to the date at which N = 1 cumu-
nication and late measures led to tens of thousands cumu-
lative deaths in many of them. A patient approach, with                                                  lative death is extrapolated from the exponen-
a lockdown lift, when the number of daily death tolls would                                              tial growth regime.
be of the order of a few units per country (see Fig. 6), may                                  n          Number of cumulative deaths normalized per
allow to safely reach a situation similar to that of China and                                           100,000 inhabitants.
South Korea after their first epidemic waves. On the con-                                      d=0        Corresponds to the date at which n = 0.001 cumu-
trary, a lockdown lift while the number of contagious people                                             lative deaths/100,000 inhabitants is extra-
would remain high could be risky. This second option was                                                 polated from the exponential growth regime.
chosen by several of these countries (see for instance [39]).                                 F          The ratio of cumulative deaths at the begin-
A re-opening of the frontiers inside the Schengen area                                                   ning of the lockdown and at the end of the epi-
and a non-massive use of protection masks may constitute                                                 demic wave.
W. Knafo: 4open 2020, 3, 5                                                       13

Supplementary materials                                            2. Zhu N, Zhang D, Wang W, Li X, Yang B, Song J, Zhao X,
                                                                      Huang B, Shi W, Lu R, Niu P, Zhan F, Ma X, Wang D, Xu
    The supplementary materials of this article is available at       W, Wu G, Gao GF, Tan W (2020), A novel coronavirus from
https://www.4open-sciences.org/10.1051/fopen/2020005/                 patients with pneumonia in China, 2019. N Engl J Med 382,
                                                                      727–733. https://doi.org/10.1056/NEJMoa2001017.
olm                                                                3. Huang C, Wang Y, Li X, Ren L, Zhao J, Hu Y, Zhang L,
    Supplementary data: Australia.dat, Brazil.dat, Belgium.           Fan G, Xu J, Gu X, Cheng Z, Yu T, Xia J, Wei Y, Wu W,
dat, China.dat, China_smoothed.dat, Czech_Republic.dat,               Xie X, Yin W, Li H, Liu M, Xiao Y, Gao H, Guo L, Xie J,
France.dat, Germany.dat, Greece.dat, Hong_Kong.dat,                   Wang G, Jiang R, Gao Z, Jin Q, Wang J, Cao B (2020),
India.dat, Iran.dat, Israel.dat, Italy.dat, Japan.dat,                Clinical features of patients infected with 2019 novel coro-
Mexico.dat, Morocco.dat, Netherlands.dat, Nigeria.dat,                navirus in Wuhan, China. The Lancet 395, 497–506.
Norway.dat, Philippines.dat, Portugal.dat, Russia.dat,                https://doi.org/10.1016/S0140-6736(20)30183-5.
                                                                   4. Fine P (1993), Herd immunity: History, theory, practice.
Singapore.dat, South_Africa.dat, South_Korea.dat, Spain.              Epidemiol Rev 15, 265–302.
dat, Sweden.dat, Switzerland.dat, Taiwan.dat, Turkey.dat,          5. Fine P, Eames K, Heymann DL (2011), “Herd immunity”: A
UK.dat, USA.dat                                                       rough guide. Clin Infect Dis 52, 911–916. https://doi.org/
    Figure S1: Comparison of the propagation of the                   10.1093/cid/cir007.
pandemic in a selection of 32 countries.                           6. Brett T, Rohani P (2020), COVID-19 herd immunity strate-
    Figure S2: Evolution of cumulative and daily death tolls          gies: walking an elusive and dangerous tightrope. medRxiv
                                                                      [Preprint]. https://doi.org/10.1101/2020.04.29.20082065.
per 100,000 inhabitants in China, South Korea, Italy,
                                                                   7. Ferguson NM, Laydon D, Nedjati-Gilani G, Imai N, Ainslie K,
Spain, France (mainland) and the USA.                                 Baguelin M, Bhatia S, Boonyasiri A, Cucunubá Z, Cuomo-
    Figure S3: (a) Fit by an exponential law of the cumula-           Dannenburg G, Dighe A, Dorigatti I, Fu H, Gaythorpe K,
tive deaths variation in regime 2. This universal law is fol-         Green W, Hamlet A, Hinsley W, Okell LC, van Elsland S,
lowed by all countries in this regime. (b) Extrapolation of           Thompson H, Verity R, Volz E, Wang H, Wang Y, Walker
the final cumulative death number expected in France, as               PGT, Walters C, Winskill P, Whittaker C, Donnelly CA,
a function of the starting date of lockdown. A similar epi-           Riley S, Ghani AC (2020), Impact of non-pharmaceutical
                                                                      interventions (NPIs) to reduce COVID-19 mortality and
demic decline as that reported in China, and a factor                 healthcare demand. Report 19, Imperial College COVID-19
F = 160 compatible with 28,000 cumulative deaths, for a               Response Team 16 March 2020-04-0816 (16 March 2020),
lockdown starting on 17 March, are assumed.                           https://spiral.imperial.ac.uk:8443/handle/10044/1/77482.
    Figure S4: Fit by an exponential law of the variation          8. Murray CJL, IHME COVID-19 health service utilization fore-
with time of cumulative death tolls in Italy and France,              casting team (2020), Forecasting the impact of the first wave of
and its extrapolation after the start of lockdown.                    the COVID-19 pandemic on hospital demand and deaths for the
    Figure S5: Focus on cumulative and daily deaths in                USA and European Economic Area countries. medRxiv
                                                                      [Preprint]. https://doi.org/10.1101/2020.04.21.20074732.
French metropolitan regions.                                       9. Di Domenico L, Pullano G, Sabbatini CE, Boëlle P-Y, Colizza V,
    Figure S6: Map of France and shift in days of the begin-          Paireau J, Andronico A, Hoze N, Richet J, Dubost C-L, Le Strat
ning of the epidemic exponential-growth regime 2 for the              Y, Lessler J, Bruhl D, Fontanet A, Opatowski L, Boëlle P-Y,
metropolitan regions in comparison with China.                        Cauchemez S (2020), Expected impact of lockdown in Île-de-
    Figure S7: Cumulative deaths, daily deaths, and nor-              France and possible exit strategies, Report #9. medRxiv
malized daily deaths per 100,000 inhabitants as function              [Preprint]. https://doi.org/10.1101/2020.04.13.20063933.
                                                                  10. Salje H, Tran Kiem C, Lefrancq N, Courtejoie N, Bosetti P,
of date or “shifted” time for a selection of French depart-
                                                                      Paireau J, Andronico A, Hoze N, Richet J, Dubost C-L,
ments in region Ile-de-France and in the East of the                  Le Strat Y, Lessler J, Bruhl D, Fontanet A, Opatowski L,
country.                                                              Boëlle P-Y, Cauchemez S (2020), Estimating the burden of
    Figure S8: Map of East of France and shift in days at             SARS-CoV-2 in France, pasteur-02548181, https://hal-pas-
the beginning of the epidemic exponential-growth regime               teur.archives-ouvertes.fr/pasteur-02548181.
2 for a selection of departments, in comparison with China.       11. Sebastiani G, Massa M, Riboli E (2020), Covid-19 epidemic
    Figure S9: Variation of (a) cumulative and (b) daily              in Italy: evolution, projections and impact of government
                                                                      measures. Eur J Epidemiol. 35, 341–345, https://doi.org/
death tolls in France, in regard with political measures              10.1007/s10654-020-00631-6.
and the last mass events.                                         12. Standl F, Jöckel K, Stang A (2020), COVID-19 and the need
    S5 – Supplementary References                                     of targeted inverse quarantine. Eur J Epidemiol. https://doi.
                                                                      org/10.1007/s10654-020-00629-0.
Conflict of interest                                               13. Zhang Y (2020), Vital surveillances: the epidemiological
                                                                      characteristics of an outbreak of 2019 novel coronavirus
   Author declared no conflict of interests.                           diseases (COVID-19) – China, 2020. China CDC Weekly 2,
                                                                      113–122. https://doi.org/10.46234/ccdcw2020.032.
References                                                        14. Ke R, Sanche S, Romero-Severson E, Hengartner N (2020),
                                                                      Fast spread of COVID-19 in Europe and the US suggests the
 1. Bedford J, Enria D, Giesecke J, Heymann DL, Ihekweazu C,          necessity of early, strong and comprehensive interventions.
    Kobinger G, Lane HC, Memish Z, Oh MD, Sall AA, Schuchat           medRxiv [Preprint]. https://doi.org/10.1101/2020.04.04.
    A, Ungchusak K, Wieler LH, WHO Strategic and Technical            20050427.
    Advisory Group for Infectious Hazards (2020), COVID-19:       15. Brow P, Rai K, La Vecchia C, Rodriguez PS, Qu K, Brown
    towards controlling of a pandemic. The Lancet 395, 1015–          MG, Hyun Shin H, Tang X, Newcombe L, Suraweera W,
    1018. https://doi.org/10.1016/S0140-6736(20)30673-5.              Schultz C, Bogoch I, Gelband H, Nagelkerke N, Jha P (2020),
You can also read