Comparisons between the Neighboring States of Amazonas and Pará in Brazil in the Second Wave of COVID-19 Outbreak and a Possible Role of Early ...
←
→
Page content transcription
If your browser does not render page correctly, please read the page content below
International Journal of
               Environmental Research
               and Public Health

Brief Report
Comparisons between the Neighboring States of Amazonas and
Pará in Brazil in the Second Wave of COVID-19 Outbreak and a
Possible Role of Early Ambulatory Treatment
Francisco G. Emmerich

                                            Federal University of Espirito Santo, Campus de Goiabeiras, Vitoria-ES 29075-910, Brazil;
                                            fgemmerich@terra.com.br

                                            Abstract: Brazil and many countries are now experiencing a second wave of the COVID-19 outbreak.
                                            The objective of this study is to compare results with statistical samples involving millions of people
                                            in the two largest neighboring states in Brazil, Amazonas and Pará, which in the first wave were
                                            similar but now show significant different results in combating COVID-19. During the first wave,
                                            in May 2020, the maximums of the 7-day average daily deaths per population of Amazonas and
                                            Pará were similar: 15.7 and 17.1 deaths per day per million people, respectively, which means a
                                            ratio 15.7/17.1 = 0.92 ≈ 1. Now, in the second wave of COVID-19 outbreak, Amazonas has entered
                                            a serious situation; meanwhile, Pará has presented a much smaller growth in the mortality. The
                                            accumulated mortality per population from 11 November 2020 to 15 March 2021 of Amazonas
                                            and Pará are 1645 and 296 deaths per million people, respectively. As 1645/296 = 5.55, Amazonas

                                     is presenting an accumulated mortality per population more than five times that of Pará. Future
Citation: Emmerich, F.G.
                                            in-depth research can provide a grounded answer to explain this significant difference, nonetheless
Comparisons between the                     the explicit support of the Pará state government, after 21 May 2020, to early ambulatory treatment
Neighboring States of Amazonas and          may have played some role on this result.
Pará in Brazil in the Second Wave of
COVID-19 Outbreak and a Possible            Keywords: SARS-CoV-2; COVID-19; mortality; treatment; comparison; statistics; Brazil
Role of Early Ambulatory Treatment.
Int. J. Environ. Res. Public Health 2021,
18, 3371. https://doi.org/10.3390/
ijerph18073371                              1. Introduction
                                                 The COVID-19 pandemic has been impacting the world since the beginning of
Academic Editor: Jimmy T. Efird
                                            2020 [1,2] and two waves of COVID-19 outbreak [3] have hit many countries. As pointed
                                            out by Jindal et al. [4], according to the Centers for Disease Control and Prevention of
Received: 20 February 2021
Accepted: 21 March 2021
                                            the United States of America (USA), there are two ways to control the damage of a viral
Published: 24 March 2021
                                            infection: (1) reduce the spread of the virus and, (2) decrease the associated disease severity.
                                            Concerning item (1), most countries issued complete or partial lockdown in many cities and
Publisher’s Note: MDPI stays neutral
                                            measures of prevention such as social distancing, wearing a mask, washing hands, post-
with regard to jurisdictional claims in
                                            exposure prophylaxis, and staying at home quarantined under signals of infection [1,2,4,5].
published maps and institutional affil-     Concerning item (2), some medicines such as hydroxychloroquine, azithromycin, iver-
iations.                                    mectin and others were proposed and tested against the SARS-CoV-2 virus in some stages
                                            of the disease [6–9], and several vaccines were developed in record time [10,11].
                                                 Some groups of researchers showed the advantages of early ambulatory treatments for
                                            COVID-19 [7,8,12–14], but, as commented on by Paul [15], the differences between patients
Copyright: © 2021 by the author.
                                            given treatment for COVID-19 or not require exceptionally large sample sizes for appropri-
Licensee MDPI, Basel, Switzerland.
                                            ate adjustment. There are many recruitment difficulties [16] in conducting experimental
This article is an open access article
                                            studies involving large number of patients. Although studies with 10,000–20,000 patients
distributed under the terms and             or more are important, the scope and the objective of this research note is not to discuss
conditions of the Creative Commons          them but to work on comparisons of statistical samples involving millions of people in
Attribution (CC BY) license (https://       two states of a country in the second wave of COVID-19 outbreak. This country is Brazil,
creativecommons.org/licenses/by/            which occupies a vast area (about half of South America) with a relatively large population,
4.0/).                                      which corresponds to about 45% of the population of South America, 30% of Europe and

Int. J. Environ. Res. Public Health 2021, 18, 3371. https://doi.org/10.3390/ijerph18073371                        https://www.mdpi.com/journal/ijerph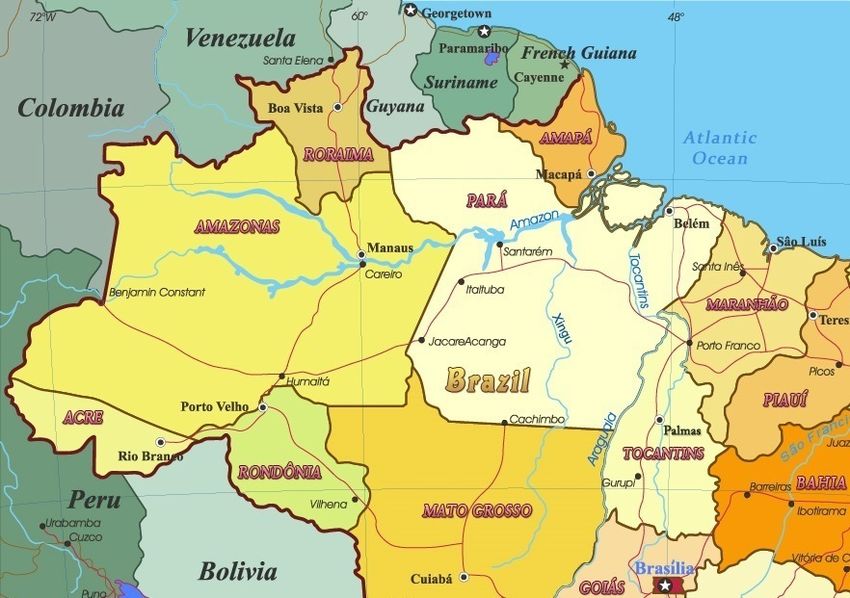
Int. J. Environ. Res. Public Health 2021, 18, 3371                                                                             2 of 18

                                        65% of the USA. Therefore, cross-comparison for Brazil can be relevant and the information
                                        provided can be extrapolated to the world in many cases.
                                              As pointed out by Pearce et al. [17], comparisons are important because, despite
                                        some difficulties, it is possible to learn a great deal from comparing countries, states, and
                                        regions, and they can play a major role in our learning what works best for controlling
                                        COVID-19. The number of options is not high, and some alternatives to comparisons,
                                        such as randomize a lockdown or other aspects of physical distancing, are impossible
                                        or unethical [17]. There could be trials of intensive population testing, or prophylactic
                                        treatment of household contacts, but few have been launched, and the clock is ticking
                                        accumulating more deaths [17].
                                              Comparisons between countries of Africa, Asia, Europe, Central, North and South
                                        America, and Oceania were performed [18–28]. Most of these studies analyzed the diverse
                                        strategies in combating the disease and report parameters involving the number of cases
                                        and the mortality. Some of the studies involved themes such as testing coverage [23],
                                        economic valuation [24], response strategies [25], age distribution [26,27], and seasonal
                                        climate changes [28], among others.
                                              Comparisons involving states and country regions were also presented [29–33]. For
                                        example, Rath et al. [29] studied selected states of India by analyzing parameters such as
                                        case fatality rate and population density. La Gatta et al. [30] used graph-based machine
                                        learning to compare the forecasts of the trained model with available data about the
                                        Covid-19 epidemic spread in different regions of Italy. Cavalcante et al. [32] described
                                        the evolution of the pandemic until 16 May 2020 in Brazil, analyzing the number of cases
                                        and mortality, making comparisons between states, regions, and also with other nine
                                        countries. Orellana et al. [33] studied the excess overall mortality until 19 May 2020 in
                                        the state of Amazonas (Brazil), focusing mainly on its capital, analyzing parameters such
                                        as age bracket, sex, place of death, epidemiological week, and specific causes of death.
                                        These authors [33] made comparisons with the pre-COVID-19 mortality in 2018–2019 and
                                        presented comments about other Brazilian states and the world.
                                              Most of the mentioned comparisons studies [18–31] involve the first wave of COVID-
                                        19 outbreaks, and two of them were focused more specifically on Brazil and its states [32,33]
                                        analyzing results until 16–19 May 2020. The objective of the present work is to make
                                        comparisons between the neighboring states of Amazonas and Pará in Brazil in the second
                                        wave of the COVID-19 outbreak. This is particularly relevant because in the first wave of
                                        the COVID-19 outbreak, the maximums of the mortality rate in the states of Amazonas
                                        and Pará were quite similar considering their populations, but now, in the second wave,
                                        there are significant differences in the results. To the author’s knowledge, the present
                                        work is one of the first comparison studies between two neighboring states that were quite
                                        similar during the maximum of the first wave, and now, in the second wave, are presenting
                                        significant different results in combating COVID-19.
                                              Amazonas and Pará are the two largest states of Brazil by area, located in the northern
                                        region of the country and traversed by the Amazon River (cf. Figure 1). Their summed
                                        area corresponds to 33% of the country (Amazonas: 18.3% and Pará: 14.6%), and their
                                        populations are 4.208 and 8.691 million people, which correspond respectively to 2.0% and
                                        4.1% of the total Brazilian population (211.8 million people). Although the population
                                        of Amazonas is 0.48 (about half) of Pará, the metropolitan regions of their state capitals
                                        (Manaus-AM and Belém-PA) have similar populations: Greater Manaus (13 municipalities):
                                        2.72 million people and Greater Belém (7 municipalities): 2.51 million people. Excluding
                                        the two large metropolitan regions surrounding their capitals, the other municipalities,
                                        49 in Amazonas and 137 in Pará, have average populations of 30 and 45 thousand people,
                                        respectively. Furthermore, among other factors, the two states are relatively similar in
                                        climate, in the public healthcare system, in the socioeconomic status (SES) distribution, in
                                        the level of education of the population, and in the age and gender composition [34,35]; the
                                        Human Development Index (HDI) of 2010 for Amazonas, Pará and Brazil as a whole are,
                                        respectively, 0.674, 0.646 and 0.699. These inherent similarities of the two states, together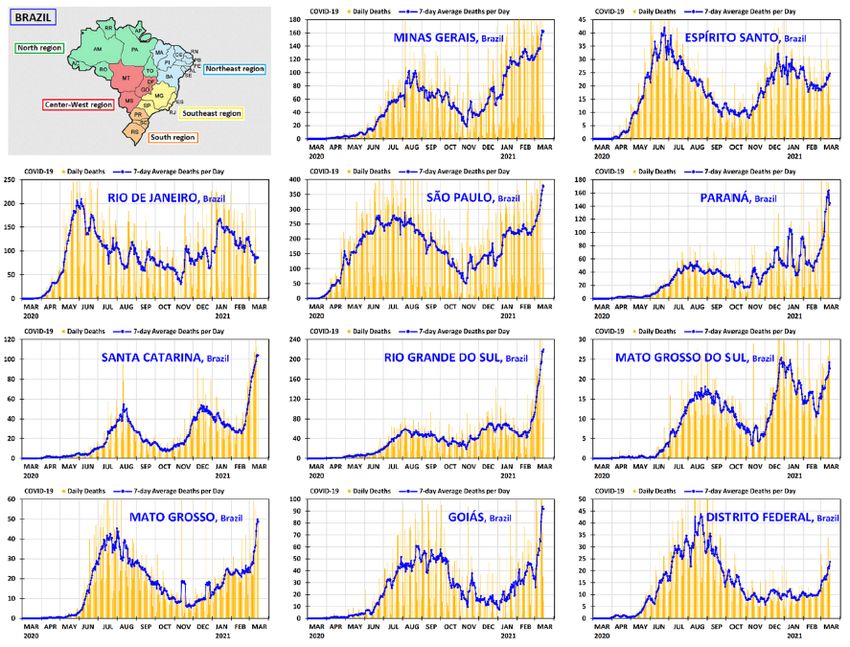
Int. J. Environ. Res. Public Health 2021, 18, x FOR PEER REVIEW 3 of 19
Int. J. Environ. Res. Public Health 2021, 18, 3371 3 of 18
[34,35]; the Human Development Index (HDI) of 2010 for Amazonas, Pará and Brazil as a
whole are, respectively, 0.674, 0.646 and 0.699. These inherent similarities of the two states,
with the specific
together with thecircumstances during theduring
specific circumstances first and
theinfirst
the and
second wave
in the of COVID-19
second wave of
outbreak,
COVID-19 outbreak, will evidence that the comparisons are appropriate Looking
will evidence that the comparisons are appropriate and helpful. for
and helpful.
the main differences of behavior between the two states in the second wave
Looking for the main differences of behavior between the two states in the second wave may serve
as an serve
may example forexample
as an other states or other
for other geographic
states entities inentities
or other geographic the combat
in theofcombat
the COVID-
of the
19 pandemic.
COVID-19 pandemic.
Figure1.1. Map
Figure Mapofofthe
thestates
statesofof
Amazonas
Amazonasandand
Pará in Brazil
Pará and their
in Brazil neighboring
and their states states
neighboring and inter-
and
national borders. Reproduced from http://www.geographicguide.net/america/brazil-map.htm
international borders. Reproduced from http://www.geographicguide.net/america/brazil-map.htm
(accessed on 15 February 2021)—Adapted with permission from copyright © Geographic Guide—
(accessed on 15 February 2021)—Adapted with permission from copyright © Geographic Guide—
World in Pictures.
World in Pictures.
An important starting point for the present work is to define what is the most appro-
An important starting point for the present work is to define what is the most ap-
priate
propriate parameter
parameter to use in the
to use comparisons.
in the comparisons. TheThe number
number of cases perper
of cases million people
million is a
people
rate that is frequently reported for comparison purposes, but the
is a rate that is frequently reported for comparison purposes, but the testing practice of testing practice of differ-
ent countries
different and states
countries to identify
and states cases may
to identify casesvarymay[24,36,37]. Other parameters,
vary [24,36,37]. such as
Other parameters,
infection fatality ratio and case fatality ratio are other relevant measures,
such as infection fatality ratio and case fatality ratio are other relevant measures, but they but they depend
directlydirectly
depend on the testing
on thepractices to identify
testing practices to cases,
identify which
cases,usually
whichare not uniform
usually are notand vary.
uniform
In the case of Brazil, the testing practice to identify COVID-19 cases
and vary. In the case of Brazil, the testing practice to identify COVID-19 cases varies from varies from state to
state and also between municipalities in the same state, so using
state to state and also between municipalities in the same state, so using a parameter such a parameter such as the
case
as thefatality ratio to
case fatality compare
ratio statesstates
to compare may notmay benot
very beappropriate.
very appropriate.
Although deaths per million people
Although deaths per million people is a crude rate, is a crude rate, many
many consider
consider itit aa useful
useful com-
com-
parator[24,36,37].
parator [24,36,37].As Aspointed
pointedout outbybyFitzpatrick
Fitzpatrick[37], [37],although
althoughsome someCOVID-19
COVID-19reported
reported
deathsinclude
deaths includejustjustthose
thosetested
testedpositive,
positive,which
whichisismainly
mainly the the case
case in
in hospitalized
hospitalized patients;
patients;
other reported deaths include those where COVID-19 is regarded
other reported deaths include those where COVID-19 is regarded highly likely, without highly likely, without
confirmation. Despite the possibility of doubt in some circumstances,
confirmation. Despite the possibility of doubt in some circumstances, in the case of Brazil, in the case of Brazil,
the number of deaths by COVID-19 per million people is the
the number of deaths by COVID-19 per million people is the parameter that may be more parameter that may be more
appropriate for comparisons between states and municipalities,
appropriate for comparisons between states and municipalities, because the statistics of because the statistics of
thepopulation
the populationisiswell wellperformed
performedby byaafederal
federalinstitute
institute(Instituto
(InstitutoBrasileiro
BrasileirodedeGeografia
Geografiaee
Estatística—IBGE) since
Estatística—IBGE) since 1938,
1938, and,
and, according
according to to aa federal
federal regulation
regulation (Art.
(Art. 7777 of
of Law
Law No.No.
6015of
6015 of1515December
December1973), 1973),thethedeath
deathisisan
anevent
eventin inwhich
whichaaphysician
physicianisisresponsible
responsible for for
certifying the cause, and a death certificate must be issued in a civil registration office,
before burial. Only in cases where there is no physician, two qualified persons who have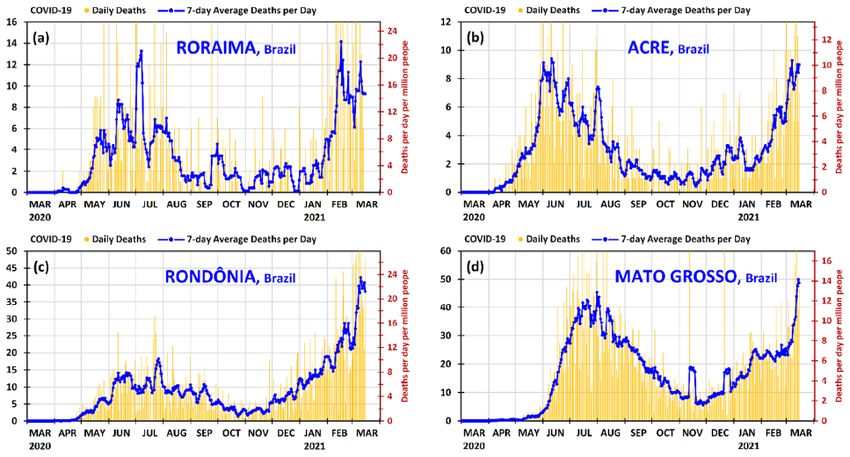
Int. J. Environ. Res. Public Health 2021, 18, 3371                                                                               4 of 18

                                        witnessed or verified the death can inform the cause. However, the great majority of the
                                        municipalities in Brazil have physicians, which are paid for with the support of the munici-
                                        palities, the states, and the Brazilian Unified Health System (Sistema Único de Saúde—SUS).
                                        Despite the possibility of doubt in some cases of highly likely COVID-19 deaths, without
                                        confirmation, it is probably that these cases in Brazil may be distributed evenly among the
                                        municipalities and states of the regions, and not concentrated in certain municipalities and
                                        states (of the region). Therefore, taking into account all these reasons, it is appropriate to
                                        assume that the municipalities inside the regions of Brazil have reasonable uniformity in
                                        the criteria for the notification of the COVID-19 deaths of the patients. In addition, it is
                                        worth comment that the notifications from the municipalities are what generate the data
                                        for the states and for the country, which appear daily in the released statistics. All things
                                        considered, the number of deaths per million people is the parameter that will be used in
                                        the comparisons of the present work.

                                        2. Materials and Methods
                                              The daily deaths of COVID-19 in Brazil and other statistical data of the pandemic are
                                        provided by the municipalities and the states, and compiled by the Ministry of Health,
                                        which provides a spreadsheet in a CSV format available on its website (https://covid.saude.
                                        gov.br/ (accessed on 15 March 2021)). The File S1 used here was obtained on 15 March 2021,
                                        and is reproduced in the Supplementary Materials. It involves daily data since 25 February
                                        2020 of the country, of the 27 federation units (26 states and one federal district), and of the
                                        5570 municipalities.
                                              As the present work involves the country and the federation units, it was sufficient to
                                        take the first part of the above spreadsheet and export the content of this primary data to the
                                        File S2 of three tabs created by the author, which is available openly in the Supplementary
                                        Materials for those who are interested. This spreadsheet contains the primary data, the
                                        determination of the useful parameters, and the data used to make the graphs. In the
                                        part of primary data, the columns of interest in the present study are region, state, date,
                                        population, accumulated deaths, and daily deaths. Other columns, such as: accumulated
                                        cases, new cases, new recovered cases, and follow-up new cases, were not used here, but
                                        may be of interest for other works. The averages of deaths per day were calculated on a
                                        7-day basis, by taking the data of the considered day and the six previous days. The details
                                        of how the data were worked out in this spreadsheet are presented in Appendix A in the
                                        first three paragraphs.
                                              The graphs were made in the Excel File S3 of 28 tabs, which is also available openly
                                        in the Supplementary Materials for those interested. This spreadsheet provides graphs
                                        of the country and all 27 federation units in a suitable resolution. Appendix A, in its
                                        fourth paragraph, provides details of how the data were worked out in the spreadsheet.
                                        The figures with the graphs shown in this work can be compared with graphs, normally
                                        of lower resolution, provided daily by the Brazilian press through the “Consórcio de
                                        Veículos de Imprensa”. For example, the webpages of Uol and Globo, which present daily
                                        statistical graphs of COVID-19 for the country and the federation units, are indicated in the
                                        references [38,39].

                                        3. Results and Discussion
                                              As shown in Figure 2, Brazil suffered the first wave of COVID-19 outbreak between
                                        March and 10 November 2020. The period of highest mortality of the first wave occurred
                                        between the end of May 2020 and the beginning of September 2020, with the maximum
                                        of the 7-day average daily deaths occurring on 25 July 2020: 1097 deaths per day, which
                                        corresponds to 5.1 deaths per day per million people. The second wave of the pandemic
                                        began on 11 November 2020 and is affecting most states. It is worrying because the
                                        mortality rate now, in March 2021, is significantly higher than that of the maximum of the
                                        first wave, and it is mainly related to new, more contagious, variants of the virus [11,40],
                                        and also to reductions in the measures of prevention. In February 2021, the 7-day average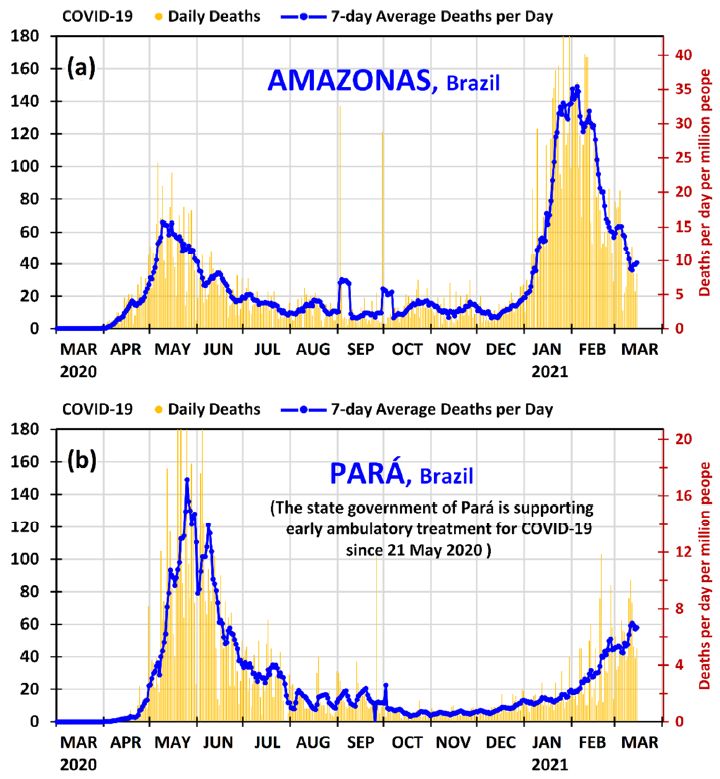
Int. J. Environ. Res. Public Health 2021, 18, 3371                                                                                 5 of 18

                                        daily deaths was 1000–1200 deaths per day (4.7–5.7 deaths per day per million people). In
                                        March 2021, the mortality rate is increasing steadily; on 15 March 2021, the 7-day average
                                        daily deaths has reached 1841 deaths per day, the highest in the world at the moment (in
                                        absolute value), which corresponds to 8.7 deaths per day per million people.

                                        Figure 2. Daily deaths and 7-day average deaths per day of COVID-19 in Brazil from 1 March 2020
                                        to 15 March 2021. The deaths per day per million people can be found using the secondary vertical
                                        axis on the right.

                                             As shown in Figure 3, during the month of May 2020, Amazonas and Pará experienced
                                        strong first waves of COVID-19 outbreak. The maximums of the 7-day average daily deaths
                                        reached 66 deaths per day in Amazonas on 9 May 2020 and 149 deaths per day in Pará
                                        on 25 May 2020, which correspond to 15.7 and 17.1 deaths per day per million people,
                                        respectively. The difference in the daily deaths per population was only −9%, and therefore
                                        the two states were quite similar because the ratio 15.7/17.1 = 0.92 ≈ 1.
                                             In that situation, in March–May 2020, each state and the municipalities separately
                                        adopted measures to contain the pandemic, because in Brazil the Supreme Federal Court
                                        has decided that the municipalities, the states and the federal government have autonomy
                                        of action, in their respective jurisdictions, to combat COVID-19 [41]. In general, the mayors
                                        and governors implemented partial lockdown in some cities and suggested measures of
                                        prevention such as those mentioned in Section 1. However, the government of the state
                                        of Pará had a different additional attitude because: (1) a private healthcare plan operator
                                        (Unimed Belém) was with successful results with early ambulatory treatment dispensing
                                        medicines such as those mentioned in Section 1 to their patients upon prescription from
                                        their physicians [42]; (2) some municipalities, such as Afuá, were already acquiring such
                                        medicines [43]; and (3) the municipality of Ourilândia do Norte (Center-South of Pará,
                                        33.1 thousand people and HDI of 2010 = 0.624) was also with successful results with
                                        early ambulatory treatment dispensing medicines such as those mentioned in Section 1
                                        to patients upon prescription from their physicians at its municipal public healthcare
                                        unit [44]. On 21 May 2020, the state government of Pará, as documented on the official
                                        state agency [45] and in the press [46], acquired hundreds of thousands of capsules of
                                        medicines for covid-19 to distribute to the municipalities in the state for use by people with
                                        symptoms or a confirmed diagnostic of COVID-19. On that occasion it was informed that
                                        the effectiveness of early ambulatory treatment for COVID-19 was not yet scientifically
                                        proven and that the medicines could only be prescribed by physicians if they so wish; it
                                        was informed that the main role of the state government of Pará was to guarantee the
                                        supply of the medicines. A concise complementary discussion of this issue is left at the
                                        end of this section, supplemented with Appendix B.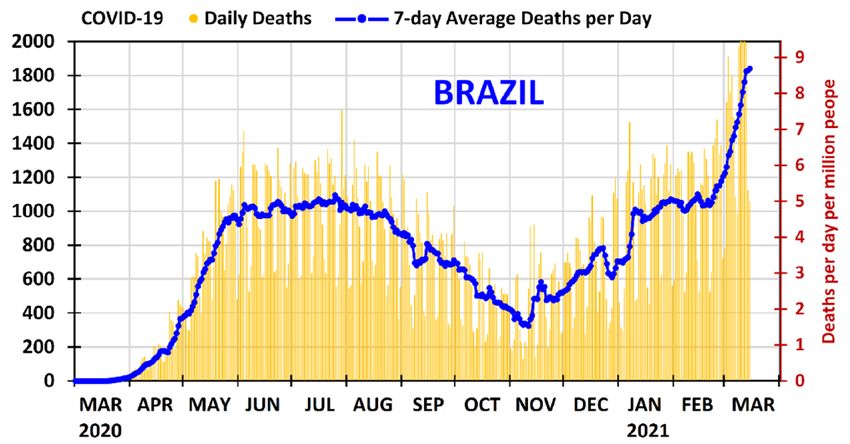
Int. J. Environ. Res. Public Health 2021, 18, 3371                                                                                  6 of 18

                                        Figure 3. Daily deaths and 7-day average deaths per day of COVID-19 in the states of (a) Amazonas
                                        and (b) Pará in Brazil from 1 March 2020 to 15 March 2021. The deaths per day per million people
                                        can be found using the secondary vertical axis on the right.

                                              As demonstrated in Figure 3, both states managed to control the first wave of COVID-
                                        19 outbreak; however, Pará presented a much faster reduction after the maximum of the
                                        first wave, not only in relation to the state of Amazonas, but in relation to all states in Brazil.
                                        After the first wave maximum, the state of Pará reduced the 7-day average daily deaths by
                                        83% in 46 days (from 25 May 2020 to 10 July 2020) and by 95% in 70 days (from 25 May
                                        2020 to 3 August 2020), which is a remarkable result.
                                              Some points can be emphasized in this matter: (1) The physicians of the public
                                        healthcare system in the state of Pará started to know in May 2020 that the proposed
                                        early ambulatory treatment was working well for a private healthcare plan operator [42]
                                        and for a municipality [44]; (2) the state government of Pará, which have made early
                                        ambulatory treatment feasible by purchasing the medicines, has a great power of influence;
                                        and, importantly, (3) the patients and the municipalities did not have to purchase and
                                        pay for the medicines—the state government of Pará did so. Consequently, it is likely
                                        that the result obtained in Pará (the best in Brazil) in decreasing at the shortest time the
                                        maximum of the death rates of the first wave of COVID-19 outbreak may be due to the
                                        explicit support of the state government and the adhering of the municipalities and their
                                        physicians in the public healthcare system to the early ambulatory treatment. The role of
                                        early ambulatory treatment in the second wave is discussed latter.
Int. J. Environ. Res. Public Health 2021, 18, 3371 7 of 18
As can be observed in Figure 3, the second wave of the COVID-19 outbreak has hit the
state of Amazonas severely. From the middle of December 2020, Amazonas presented an
increase in the daily deaths, which grew significantly in January 2021. The 7-day average
daily deaths in Amazonas remained above 120 deaths per day (15.3 deaths per day per
million people) from 18 January 2021 to 15 February 2021, and then decreased to 60 deaths
per day on 27 February 2021 and then to 40 deaths per day on 11 March 2021. Meanwhile,
its neighboring state, Pará, which had a first wave as strong as that of Amazonas in May
2020, taking into account the populations, has been in a different situation. In the second
wave Pará has presented a much smaller growth than Amazonas. The 7-day average daily
deaths in Pará increased from 13 to 20 deaths per day from 1 to 31 January 2021, from
18 to 45 deaths per day from 1 to 28 February 2021, and from 46 to 58 deaths per day from
1 to 15 March 2021. The latter value corresponds to 6.7 deaths per day per million people.
Despite the fact that Pará is in a situation where the maximum of the second wave is not yet
defined as in Amazonas, it may be useful to make a comparison with the current situation.
In the second wave (until 15 March 2021), the maximums of the 7-day averages of daily
deaths were 149 deaths per day in Amazonas on 4 February 2021 and 61 deaths per day in
Pará on 12 March 2021, which correspond to 35.4 and 7.0 deaths per day per million people,
respectively. Since 35.4/7.0 = 5.1 ≈ 5, the ratio of the maximums of the 7-day average daily
deaths per population between Amazonas and Pará has increased from about 1 to 5 from
the first wave to the second wave.
It is worth commenting on the fact that the reduction of the daily deaths in Amazonas
from the middle of February 2021 is related to several measures of prevention and partial
lockdown in some cities that were issued from January–February 2021; mainly in Manaus
and its metropolitan area. Moreover, the vaccination program in Brazil, which started on
17 January 2021, is also contributing to part of the decrease, because, due to the circum-
stances, the state of Amazonas has received priority: 8.07% of its population have received
the first dose by 14 March 2021 (almost the double of the Brazil average, 4.59%) [47,48].
Older people, people with disabilities in care institutions, and health professionals have
been included in the priority group, and over 60% of indigenous people above the age of
18 have received the first dose by 26 February 2021 [49]; and the indigenous of Amazonas
are receiving a higher priority [50].
Since Amazonas has entered in a difficult situation during the second wave, and the
graph of the state of Pará has already been shown, it is instructive to observe the panorama
of the other neighboring states of Amazonas (Roraima, Acre, Rondônia, and Mato Grosso).
Figure 4 provides the graphs of daily deaths and 7-day average deaths per day of Roraima,
Acre, Rondônia, and Mato Grosso from 1 March 2020 to 15 March 2021.
Positively, new, more contagious, variants of the virus COVID-19 have been contribut-
ing to the situation in Amazonas and many states of Brazil in the second wave. Although
two variants have been verified in Brazil [40], P.1 (B.1.1.28) and VOC 202012/01 (B.1.1.7),
the variant P.1 is the predominant [11,40]. In all likelihood, it is not a matter of timing that
the new variants in the second wave may reach Pará with the intensity that Amazonas has
been reached, since the second wave has already reached Brazil with severity (cf. Figure 2),
and most states are presenting a high increase in daily deaths. In the case of Pará, the larger
increases in the 7-day averages of daily deaths have occurred from 18 to 26 February 2021
and from 6 to 12 March 2021, but these increases are not as high as those of Amazonas
from 4 to 25 January 2021. Moreover, as shown in Figure 4, all the other neighboring states
of Amazonas (Roraima, Acre, Rondônia and Mato Grosso) are presenting accumulated
mortality per population much larger than that of Pará, as will be detailed in Table 1. As
shown in Figure 4, the situation is serious because these neighboring states of Amazonas
are presenting high daily deaths; therefore, it is highly likely that the variant P.1 is one of the
main causes of these significant increases in the daily deaths because it is the predominant
variant in Brazil [11,40]. On 15 March 2021 the 7-day average daily deaths in the states
of Roraima, Acre, Rondônia and Mato Grosso were 9.3, 9.0, 38.1 and 48.7 deaths per day,Int. J. Environ. Res. Public Health 2021, 18, 3371 8 of 18
which corresponds, respectively, to 14.7, 10.1, 21.2 and 13.8 deaths per day per million
people. These values are, respectively, 120%, 51%, 318% and 107% higher than that of Pará.
Figure 4. Daily deaths and 7-day average deaths per day of COVID-19 in the states of (a) Roraima, (b) Acre, (c) Rondônia
and (d) Mato Grosso in Brazil from 1 March 2020 to 15 March 2021. The deaths per day per million people can be found
using the secondary vertical axis on the right.
To better compare Amazonas and Pará with the country and other federation units
in the second wave of COVID-19 outbreak, some parameters of interest are provided in
Table 1 for all states, the federal district, and the country as a whole. The last four columns
of Table 1 provide the accumulated mortality per population in the second wave (from
11 November 2020 to 15 March 2021)—in absolute values and in relation to the state of
Pará; and the ratio between the maximums of the 7-day average daily deaths in the second
wave and in the first wave (from 1 Mar 2020 to 10 November 2021)—in absolute values
and in relation to the state of Pará. It is worth commenting on that the data of these
comparisons, and those of other comparisons such as the ratio between the accumulated
mortality per population in the second wave and in the first wave, can be found in File S2
of Supplementary Materials. Because the second wave of the pandemic is still taking place,
the accumulated mortality increases every day, especially for the various states where the
average daily deaths is high or continues to increase. The last two columns, which depend
on the maximum of the 7-day average daily deaths in the second wave, may also vary in
cases where the maximum has not yet been reached.
The antepenultimate and the last columns of Table 1 demonstrate quantitatively that
the state of Pará is the best of the North region (where the virus variant P.1 was first
found in Brazil [11,40]) in the fight against COVID-19. Moreover, Pará, even located in
the presently risky North region, has performed best against COVID-19 when compared
with most states of the other regions, and with the country in general. Amazonas, Pará,
and Brazil (as a whole) have presented (until 15 March 2021) an accumulated mortality per
population in the second wave of 1645, 296, and 550 deaths per million people, respectively;
this means that Amazonas and the country (as a whole) are presenting values that are 5.55
and 1.86 times that of Pará.Int. J. Environ. Res. Public Health 2021, 18, 3371 9 of 18
Table 1. Accumulated mortalities per population in the second wave of COVID-19 outbreak (from 11 November 2020 to
15 March 2021); and the ratios between the maximums of the 7-day average daily deaths in the second wave and in the
first wave (from 1 March 2020 to 10 November 2021)—for all states of Brazil—in absolute values and in relation to the state
of Pará.
Accumulated
Accumulated Max. 7-Day Av.
Mortality Per Max. 7-Day
Mortality Per Deaths Per Day
Population in Av. Deaths
Population in Sec. Wave/
State Abbr. Region Population the Sec. Wave Per Day
the Sec. Wave First Wave (in
(in Relation to Sec. Wave/
(Deaths Per Relation to the
the State First Wave
Million People) State of Pará)
of Pará)
Rondônia RO North 1,796,460 1076 3.63 2.31 5.68
Acre AC North 894,470 475 1.60 0.98 2.42
Amazonas AM North 4,207,714 1645 5.55 2.26 5.55
Roraima RR North 631,181 851 2.87 1.06 2.61
Pará PA North 8,690,745 296 1.00 0.41 1.00
Amapá AP North 861,773 489 1.65 0.66 1.61
Tocantins TO North 1,590,248 366 1.24 1.11 2.72
Maranhão MA Northeast 7,114,598 192 0.65 0.83 2.03
Piauí PI Northeast 3,281,480 355 1.20 0.87 2.14
Ceará CE Northeast 9,187,103 315 1.06 0.54 1.32
Rio Grande
RN Northeast 3,534,165 376 1.27 0.65 1.59
do Norte
Paraíba PB Northeast 4,039,277 452 1.53 1.24 3.04
Pernambuco PE Northeast 9,616,621 275 0.93 0.31 0.75
Alagoas AL Northeast 3,351,543 280 0.94 0.68 1.68
Sergipe SE Northeast 2,318,822 386 1.30 0.56 1.36
Bahia BA Northeast 14,930,634 369 1.24 1.50 3.68
Minas
MG Southeast 21,292,666 539 1.82 1.59 3.91
Gerais
Espírito
ES Southeast 4,064,052 687 2.32 0.77 1.88
Santo
Rio de
RJ Southeast 17,366,189 773 2.61 0.80 1.96
Janeiro
São Paulo SP Southeast 46,289,333 529 1.79 1.31 3.22
Paraná PR South 11,516,840 706 2.38 2.91 7.13
Santa
SC South 7,252,502 765 2.58 1.90 4.67
Catarina
Rio Grande
RS South 11,422,973 797 2.69 3.68 9.04
do Sul
Mato
Center-
Grosso do MS 2,809,394 708 2.39 1.40 3.44
West
Sul
Mato Center-
MT 3,526,220 689 2.33 1.10 2.70
Grosso West
Center-
Goiás GO 7,113,540 522 1.76 1.54 3.77
West
Distrito Center-
DF 3,055,149 448 1.51 0.54 1.33
Federal West
BRAZIL BRA 211,755,692 550 1.86 1.68 4.12
It is instructive to complement the prospects offered by Figures 3 and 4 with a unified
panoramic view of the country, region by region. The graphs of daily deaths and 7-
day average deaths per day—from 1 March 2020 to 15 March 2021—are presented in
Figures 5 and 6 for all states of Brazil and its federal district, grouped by region, following
the same order as in Table 1. The North and Northeast regions are shown in Figure 5, and
the Southeast, South and Center-West regions in Figure 6. In both figures, there is a smallInt. J. Environ. Res. Public Health 2021, 18, 3371 10 of 18
map showing the positions of the states and regions. The country graph is shown at the
beginning of Figure 6, so that all relevant graphs can be seen together in the same resolution.
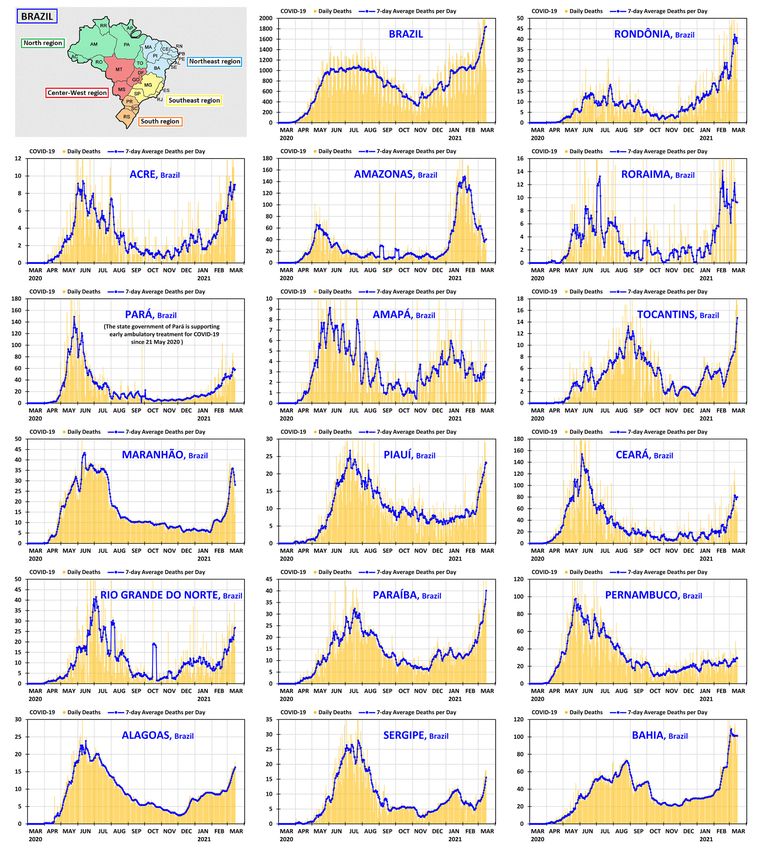
Figure 5. Daily deaths and 7-day average deaths per day of COVID-19 in Brazil and in the states of the North and Northeast
regions of Brazil from 1 March 2020 to 15 March 2021.Int. J. Environ. Res. Public Health 2021, 18, 3371 11 of 18
Figure 6. Daily deaths and 7-day average deaths per day of COVID-19 in the states of the Southeast, South and Center-West
regions of Brazil from 1 March 2020 to 15 March 2021.
Although it is necessary to perform future in-depth research to provide a more
grounded answer to explain with clarity the significant difference of the good result
of Pará in combating COVID-19 in relation to that of Amazonas in the second wave (mainly
in January–February 2021, when the virus variant P.1 was already present in the North
region and in some states of Brazil), it is likely that the strong support of the Pará state
government, after 21 May 2020, for early ambulatory treatment, may have played some
role in the good result. This inference is being made because the two neighboring states
were similar in the relative mortality rates at the maximums of first wave, and in the second
wave they have presented significant differences, and the main difference of the behavior
of the government of the two states, after 21 May 2020, was the strong support of the Pará
state government to early ambulatory treatment.
It is worth commenting that since the municipalities in Brazil have autonomy in their
jurisdictions to combat COVID-19, some of them have supported early ambulatory treat-
ment policies, while others have not. Hence, it is difficult to generalize saying that a given
state, as a whole, has implemented early ambulatory treatment or not. For example, in the
state of Maranhão, the Regional Council of Medicine supported early ambulatory treatment
from the beginning of May 2020 [51] with the medicines mentioned in Section 1, but the
state government of Maranhão did not support early ambulatory treatment. In contrast
to other states, in Pará there is a clear message and action of the state government that
was passed to the population and to the municipalities. Most of the municipalities and the
physicians of the public healthcare system in the state of Pará adhered to early ambulatoryInt. J. Environ. Res. Public Health 2021, 18, 3371 12 of 18
treatment after the difficult situation in May 2020, as it is detailed in Appendix B, which
also discusses why this was not followed in the state of Amazonas.
As said previously in the discussion of the first wave, the measures of prevention and
lock downs in April–May 2020 helped the state of Amazonas to reduce the mortality at
that time. However, relaxations in measures of prevention and the more contagious P.1
variant have caused the increase in the mortality in Amazonas from December 2020, and
especially from the middle of January 2021, with daily deaths higher than in May 2020.
This situation (with the more contagious virus variant P.1) spread to the neighboring states
of Amazonas, but Pará was the neighboring state that has suffered the least, as shown
in Figure 4 and Table 1. This demonstrates that is very likely that the early ambulatory
treatment implemented in the public healthcare system in the state of Pará may be one of
the main causes for its relatively good results in the second wave.
Because the virus is still causing high mortality in most states of Brazil, which in-
tensified in March 2021, as can be directly observed in Figures 5 and 6, measures of
prevention [1,2,4,5] such as social distancing and wearing a mask, among others, must
continue to be used; partial lockdown in some cities must also be issued, depending on the
circumstances. The vaccines that were developed for COVID-19 in record time [10,11] are a
major advance for humanity and for the science, technology, and innovation of the 21th cen-
tury, and must be strongly supported by everyone. However, vaccination will not be so fast,
especially in countries with large populations and less technological development, because
most of them have not invested in advanced purchase of a significant number of doses.
An additional difficulty is that in the second half of January 2021 the European Union
and the United States of America—two major blocks of vaccine producers—announced
some measures to restrict the export of vaccines [52,53]. The vaccination program in Brazil
started in middle January 2021, and by 14 March 2021 4.59% of the population have re-
ceived the first dose [47,48] (either Coronavac or Oxford/AstraZeneca). Two important
research/development centers of Brazil (Instituto Butantan and Fiocruz) are producing the
vaccines by using ingredients from China and India. The federal government and some
state governments are negotiating with other producers; there is progress but there are
also some difficulties to obtain large amounts of vaccine doses, mainly in the next months.
Therefore, early ambulatory treatment for Covid-19 may still be important as shown by
some groups of researchers [7,8,12–14]. The goal should always be to save as many lives
as possible. The author considers that depending on the specific circumstances, similar
comparisons can be made in other geographically neighboring regions, involving countries,
states, and municipalities.
4. Concluding Remarks
Amazonas and Pará, the two largest neighboring states in Brazil, were in a similar
situation during the worse period of the first wave of COVID-19 outbreak in May 2020, and
each state and the municipalities separately adopted procedures to contain the first wave
of COVID-19 outbreak, such as partial lockdown in some cities and used several measures
of prevention. However, the Pará state government, after 21 May 2020, started a strong
support to early ambulatory treatment in the public healthcare system. The outcome was
that Pará presented the faster reduction in Brazil of daily deaths after the maximum of the
first wave: the 7-day average deaths per day decreased 95% in 70 days (from 25 May 2020
to 3 August 2020).
Now, in the second wave of COVID-19 outbreak, the state of Amazonas faced a serious
situation, mainly from the middle of January to the middle of February 2021; meanwhile,
the state of Pará has presented a much smaller growth in the death rates, presenting an
accumulated mortality during the second wave much smaller than that of Amazonas, the
other neighboring states of Amazonas, and also most of the other states of Brazil. The
accumulated mortality per population so far in the second wave of COVID-19 outbreak,
(from 11 November 2020 to 15 March 2021) of Amazonas and Pará are 1645 and 296 deaths
per million people, respectively. This means that Amazonas is presenting an accumulatedInt. J. Environ. Res. Public Health 2021, 18, 3371 13 of 18
mortality per population in the second wave more than five times that of Pará, which is a
significant difference. Fortunately, this large difference is decreasing because Amazonas has
implemented several measures of prevention (mainly from January 2021); the vaccination
program, which started in late January 2021, is also slightly contributing to decrease the
daily deaths.
Although it is necessary to have future in-depth research to provide a grounded
answer to explain with clarity this significant difference between Amazonas and Pará
in the second wave of COVID-19 outbreak, mainly in January–February 2021 (when the
virus variant P.1 was already present in the North region and in some states of Brazil), it
is likely that the strong support of the Pará state government, after 21 May 2020, to early
ambulatory treatment, and the adhering of the municipalities and their physicians in the
public healthcare system to early ambulatory treatment, may have played a role in the
good result of Pará for controlling COVID-19 (even with the presence of the virus variant
P.1) in comparison with the states of the region and many states of Brazil. The comparisons
offered in the present work indicates that early ambulatory treatment is an option that
should not be a priori neglected in the public healthcare policies to combat COVID-19.
Depending on the specific circumstances, the type of comparison presented here can
be applied, in a similar way, in other neighboring geographic entities, such as countries,
states, regions, and municipalities.
Supplementary Materials: The following are available online at https://www.mdpi.com/1660-460
1/18/7/3371/s1, File S1: provides the daily deaths and other statistical data of COVID-19 in Brazil
from 25 February 2020 to 15 March 2021. File S2: contains the primary data, the determination of
useful parameters, and the data used to make the graphs. File S3: provides the graphs of the country
and of the federation units of Brazil.
Funding: This research received no external funding.
Data Availability Statement: The File S1 of Supplementary Materials was obtained online at
https://covid.saude.gov.br/ (accessed on 15 March 2021). Each day the spreadsheet is updated,
keeping the data of the past dates. The Files S2 and S3 of Supplementary Materials were made by the
author as explained in Appendix A.
Acknowledgments: The author would like to thank the anonymous reviewers for their useful
comments, which contributed greatly to the improvement of the final version of the work. The author
would also like to thank the physician Laércio Abrahão Ceconello for some valuable comments.
Conflicts of Interest: The author declares no conflict of interest.
Disclaimer: The views expressed in this manuscript are those of the author, and they do not neces-
sarily reflect the position or the policy of the Federal University of Espirito Santo.
Appendix A Details on the Spreadsheets with the Data/Parameters and the Graphs
As the complete CSV File S1 is exceedingly long, mainly because it involves daily data
of 5570 municipalities, it is convenient to use a TXT file editor to separate the suitable part
of the data that is the focus of the analysis, before opening this part in a spreadsheet editor.
As the present work involves only the country, the states and the federal district, and not
the municipalities, it was sufficient to take the first 10,783 lines.
The primary data contained in the above lines were exported to the Excel File S2
of three tabs in the tab “CO-VIDBR_15mar2021-data-calc”. The primary data is spread
over an area of 17 columns and 10,781 rows kept intact (from column A to Q). Two rows
(306 and 327) of the original spreadsheet were removed, because they were repeating the
date of the previous row and the number of new deaths were zero in the original rows
(306 and 327). Column R was left blank, and columns S, T, and U were used to place the
necessary data of the graphs. Columns S and T provide the date and daily deaths and are
copies of columns H and N. Column U provides the 7-day average daily deaths, which was
calculated as 1/7 of the sum of daily deaths between the day considered and the previous
six days. As there are no deaths before 17 March 2020, the 7-day average daily deathsInt. J. Environ. Res. Public Health 2021, 18, 3371 14 of 18
from 1 March 2020 to 6 March 2020 was taken equal to zero in column U. From 7 March
2020 to the final date (15 March 2021) it was used the formula Un = (SUM(T(n − 6):Tn))/7,
where n is the number of the row. For example, for row 13 (7 March 2020) it was used
U13 = (SUM(T7:T13))/7. The number of rows in columns S, T and U for the graph of each
federation unit is equal to the number of days between 1 March 2020 and 15 March 2021.
For the country and each federation unit, the row corresponding to the initial date of the
graphs (1 March 2020) was used, from column V to AK, to place the calculations of several
parameters of interest, such as the accumulated mortality in each wave of the pandemic.
All mathematical operations are simple (addition, subtraction, multiplication, and division)
and can be seen in the formulas openly disclosed in the spreadsheet.
Two additional tabs (“Parameters-pop-2019” and “Parameters-pop-2020-final”) were
created to compile the results related with the parameters. The Parameters-pop-2019
tab was obtained by copying the data of the first tab from column V to AK and from
row 7 to 10,781, and pasting the data as “values”. As the spreadsheet with primary data
from the Ministry of Health provides population data updated in 2019, an additional tab,
Parameters-pop-2020-final, was copied from the previous one, replacing the data of the
population of Brazil and its federation units updated for the year 2020 [54]. All parameters
that depended on populations were recalculated. Other columns were included in this tab
with several other parameters of interest. The data that appears in Table 1 were taken from
that last tab.
All graphs were made in the Excel File S3 of 28 tabs. The order and the names of the
tabs follow the order and abbreviations of the states and the federal district as shown in
Table 1. In each tab, the columns from C to T, starting from row 7, were copied from the
File S2, from column T to AK and from the rows between the start date of 1 March 2020
and the end date of 15 March 2021. It is worth observing that a technical difficulty was
found in formatting the dates contained in the primary data spreadsheet, therefore, the
dates that appear in column B of all tabs of File S3 were placed independently: the initial
date of 1 March 2020 of cell B7 was placed manually; subsequent dates from cell B8 were
obtained by adding 1 day to the previous day, for example, B8 = B7 + 1, until reaching the
row of the final date (15 March 2021). Thus, the dates of the Files S2 and S3 exactly match.
The formatting of the horizontal axis (containing the dates) and the secondary vertical axis
(indicating the deaths per day per million people), which appear in the final graphs shown
in Figures 2–6, were made separately.
Appendix B A Discussion about the Main Reasons for the Municipalities of Pará and
Their Physician to Adhered to Early Ambulatory Treatment in the Public
Healthcare System
To address this issue, five points are discussed: (1) Access of patients to the public
healthcare system and/or to the private medical network; (2) Main approaches of the
physicians to the first symptoms of COVID-19; (3) Need for a prescription for certain
medicines, and availability of the medicines to private consumers; (4) Acquisition of
medicines by the public sector; (5) Main causes for the municipalities and their physicians
to adhere to early ambulatory treatment in the public healthcare system.
As already mentioned in Section 1, the states of Amazonas and Pará present similar
SES distribution. The majority of patients have medium to low SES, and they can only
have access to the public healthcare system, which is linked to the Brazilian SUS (Unified
Health System). A smaller proportion of patients, primarily those with high SES, may have
access to private physicians and/or to the private medical network, mainly through private
healthcare plans (health insurance).
In general, two of the used approaches of the physicians to treat the first symptoms
of COVID-19 are: (a) to make exams and treat the patients according to their symptoms
because COVID-19 was a new disease and no medicine had been specifically approved
by the control agencies (in the case of Brazil, ANVISA), and (b) to make exams and
perform early ambulatory treatment according to medical protocols established early in theInt. J. Environ. Res. Public Health 2021, 18, 3371 15 of 18
pandemic. It is outside the scope of the present work to discuss these protocols. Approach
(a) usually involves the necessary medical exams, such as COVID-19 diagnostic test, if
available. Usual medications are prescribed to treat the symptoms, such as an antipyretic in
case of fever. The medicines in general can be purchased at pharmacies or, eventually, made
available by the doctor or the healthcare unity that the patient is attended. Most patients
do not progress to severe cases of the disease. However, if the patient’s health condition
became worse, appropriate medical interventions have to be performed. Sometimes it
is necessary to admit the patient to an intensive care unit in hospital where intubation
procedures may be required. Approach (b) usually involves the necessary medical exams,
such as COVID-19 diagnostic test, if available, but an early ambulatory treatment begins
if the patient presents the first symptoms of the disease, according to medical protocols
established early in the pandemic. It is informed that such a procedure is important since
part of the tests to detect COVID-19 take several days for the result to be released, and
many tests give false-negative results [8,12,13]. As mentioned in Section 1, the medicines
that have been recommended in scientific studies [7,8,12–14] are: hydroxychloroquine,
azithromycin and ivermectin, among others. It is worthy to mention that it is outside the
scope of the present work to discuss first symptoms of the disease, and the doses, the
effects, and the actions of the medicines, combined or not. Some critics of approach (b)
usually say that that there is no evidence that the medicines have any benefit at all stages of
COVID-19 [10,55], and the patients can suffer from side effects from the medications [55].
However, the researchers that support early ambulatory treatment say that it is not possible
to know, a priori, how the disease will develop in any particular person, and it is especially
important starting the treatment as soon as possible at the first symptoms [7,8,12–14],
because this improve the combating of the disease; they say that the benefits that can be
achieved (in terms of saving lives) outweigh the harm caused by possible side effects from
the medicines.
Concerning the need for a prescription for the medicines, in the beginning of the
pandemic, only azithromycin, because it is an antibiotic, needed a medical prescription
in Brazil. Hydroxychloroquine and ivermectin were over-the-counter drugs that could be
obtained without a prescription. However, shortly after the beginning of the pandemic, a
prescription was necessary to purchase hydroxychloroquine after 20 March 2020 [56] and
ivermectin after 22 July 2020 [57]. The need for a prescription for ivermectin was revoked
on 1 September 2020 [58], but that for hydroxychloroquine is still maintained. With regard
to the availability of medicines, shortly after the start of the pandemic, the press, and the
social networks, mainly messaging apps such as WhatsApp, reported the possibility of
using some medicines, such as those above mentioned, to combat COVID-19. It was also
reported that some of the medicines might not work and that they could cause side effects.
Even with the critical news, there was a great demand for these medicines in Brazil, and the
price of two of them (hydroxychloroquine and ivermectin) increased substantially, and they
were practically sold out in the pharmacies for some months. Therefore, the purchase of
two of the medicine by patients individually was very restricted, even for those who had a
prescription and had financial resources to purchase them. The purchase of these medicines
by healthcare plan operators of the private medical network, such as Unimed Belém, was
possible because the purchase was made directly from manufacturers or representatives.
Regardless of the pandemic, the purchase of medicines by the public healthcare
system for distribution to patients is particularly important in Brazil, especially for low SES
patients. In many cases, when public healthcare units do not provide the medications to the
patients, even with a prescription and the medications available at pharmacies, many low
SES patients have financial difficulties to purchase them. In Brazil, public organizations
must make the purchase of medicines and other supplies through a bidding process, which
requires time and work, in addition to financial resources. If there is urgency, as in the case
of the beginning of the pandemic, the bidding process may be simplified, but the public
organization lawyers must prepare and publish a document with grounded justifications
for the procedure, as the municipality of Afuá-PA did on 13 May 2020 [43]. However, thisInt. J. Environ. Res. Public Health 2021, 18, 3371 16 of 18
is laborious and requires determination, in addition to depending on financial resources.
The great difference of the state of Pará in relation to Amazonas and the other states of
Brazil was that the state government made the purchase process in a centralized way for
all municipalities in the state. The public healthcare system received the medications in
their municipalities without having to follow the entire purchase process, which involve
bureaucratic issues, publication of documents, search for suppliers, payment and, finally,
the receipt of the medications.
In that situation of May 2021, with a high mortality rate, the physicians in the public
healthcare system of the state of Pará were able to choose the approach of early ambulatory
treatment after 21 May 2020, because: (1) the results of the other approach were not so
successful (the number of deaths was increasing steadily); (2) the actions for COVID-19
of Unimed Belém and the municipality of Ourilândia do Norte-PA for their patient in
the beginning of May 2020 [42,44] was an incentive; and (3) in Pará the medicines were
available and provided free of charge by the state government. In the public medical
healthcare units of Pará, the patients received the medicines directly at the end of the
medical consultation; they did not need to go to the pharmacy. The particularly good
practical result achieved from the fourth week of May 2020 in Pará gave credibility to the
early ambulatory treatment in the public healthcare system.
In Amazonas, early ambulatory treatment was difficulted in the public healthcare
system mainly because the state government did not support early ambulatory treatment,
and, therefore, did not purchase the medicines.
References
1. Sohrabi, C.; Alsafi, Z.; O’Neill, N.; Khan, M.; Kerwan, A.; Al-Jabir, A.; Iosifidis, C.; Agha, R. World Health Organization declares
global emergency: A review of the 2019 novel coronavirus (COVID-19). Int. J. Surg. 2020, 76, 71–76. [CrossRef]
2. Yan, Y.; Shin, W.I.; Pang, Y.X.; Meng, Y.; Lai, J.; You, C.; Zhao, H.; Lester, E.; Wu, T.; Pang, C.H. The first 75 days of Novel
Coronavirus (SARS-CoV-2) outbreak: Recent advances, prevention, and treatment. Int. J. Environ. Res. Public Health 2020, 17, 2323.
[CrossRef] [PubMed]
3. Nørgaard, S.K.; Vestergaard, L.S.; Nielsen, J.; Richter, L.; Schmid, D.; Bustos, N.; Braye, T.; Athanasiadou, M.; Lytras, T.; Denissov,
G.; et al. Real-time monitoring shows substantial excess all-cause mortality during second wave of COVID-19 in Europe, October
to December 2020. Eurosurveillance 2021, 26, 2002023. [CrossRef]
4. Jindal, C.; Kumar, S.; Sharma, S.; Choi, Y.M.; Efird, J.T. The prevention and management of COVID-19: Seeking a practical and
timely solution. Int. J. Environ. Res. Public Health 2020, 17, 3986. [CrossRef] [PubMed]
5. Gentile, I.; Maraolo, A.E.; Piscitelli, P.; Colao, A. COVID-19: Time for post-exposure prophylaxis? Int. J. Environ. Res. Public Health
2020, 17, 3997. [CrossRef] [PubMed]
6. Frediansyah, A.; Tiwaric, R.; Sharun, K.; Dhama, K.; Harapan, H. Antivirals for COVID-19: A critical review. Clin. Epidemiol. Glob.
Health 2021, 9, 90–98. [CrossRef]
7. Lagier, J.-C.; Million, M.; Gautret, P.; Colson, P.; Cortaredona, S.; Giraud-Gatineau, A.; Honoré, S.; Gaubert, J.Y.; Fournier,
P.E.; Tissot-Dupont, H.; et al. Outcomes of 3737 COVID-19 patients treated with hydroxychloroquine/azithromycin and other
regimens in Marseille, France: A retrospective analysis. Travel Med. Infect. Dis. 2020, 36, 101791. [CrossRef]
8. McCullough, P.A.; Alexander, P.E.; Armstrong, R.; Arvinte, C.; Bain, A.F.; Bartlett, R.P.; Berkowitz, R.L.; Berry, A.C.; Borody,
T.J.; Brewer, J.H.; et al. Multifaceted highly targeted sequential multidrug treatment of early ambulatory high-risk SARS-CoV-2
infection (COVID-19). Rev. Cardiovasc. Med. 2020, 21, 517–530. [CrossRef]
9. Gentile, D.; Fuochi, V.; Rescifina, A.; Furneri, P.M. New anti SARS-Cov-2 targets for quinoline derivatives chloroquine and
hydroxychloroquine. Int. J. Mol. Sci. 2020, 21, 5856. [CrossRef]
10. Mishra, S.K.; Tripathi, T. One year update on the COVID-19 pandemic: Where are we now? Acta Trop. 2021, 214, 105778. [CrossRef]
11. World Health Organization (WHO). 28th WHO Regulatory Update on COVID-19; 5 February 2021; Vaccines: pp. 8–15; New
Virus Variants: pp. 2–4; WHO: Geneva, Switzerland, 2021; Available online: https://www.who.int/docs/default-source/
medicines/regulatory-updates/covid-19/28th-who-regulatory-update-on-covid-19_05feb2021_with-revision.pdf (accessed on
15 February 2021).
12. McCullough, P.A.; Kelly, R.J.; Ruocco, G.; Lerma, E.; Tumlin, J.; Wheelan, K.R.; Katz, N.; Lepor, N.E.; Vijay, K.; Carter, H.; et al.
Pathophysiological basis and rationale for early outpatient treatment of SARSCoV-2 (COVID-19) infection. Am. J. Med. 2021, 134,
16–22. [CrossRef]
13. Procter, B.C.; Ross, C.; Pickard, V.; Smith, E.; Hanson, C.; McCullough, P.A. Clinical outcomes after early ambulatory multidrug
therapy for high-risk SARS-CoV-2 (COVID-19) infection. Rev. Cardiovasc. Med. 2020, 21, 611–614. [CrossRef]
14. Raoult, D. Rational for meta-analysis and randomized treatment: The COVID-19 example. Clin. Microbiol. Infect. 2021, 27,
6–8. [CrossRef]You can also read