KCG Policy Paper Lagging behind? German Foreign Direct Investment in Africa - Julian Glitsch, Olivier Godart, Holger Görg, Saskia Mösle, and ...
←
→
Page content transcription
If your browser does not render page correctly, please read the page content below

}

 KCG Policy Paper

Lagging behind?
German Foreign Direct Investment in Africa

Julian Glitsch, Olivier Godart, Holger Görg, Saskia Mösle, and Frauke Steglich

 No. 5 | June 2020
KCG Policy Paper No. 5 | June 2020

Lagging behind?
German Foreign Direct Investment in Africa*

Julian Glitsch, Olivier Godart, Holger Görg, Saskia Mösle, and Frauke Steglich

Abstract: German Foreign Direct Investment (FDI) in Africa is lagging behind China, France, the
Netherlands, the UK, the US, and other economies. It represented only 1 percent of the German total FDI
stock abroad in 2018 and is concentrated in few African countries. Overall, around 850 German firms have
roughly 200,000 employees on the African continent (as of 2017). Compared with the main sending
countries, German FDI is more concentrated in manufacturing as opposed to the natural resources sector.
Germany has engaged in various proactive policies to encourage FDI, including in Africa. For example, the
Federal Government offers investment guarantees to German firms to cover political risks, which are often
high in developing and emerging countries. German Chambers of Commerce abroad provide information
on the local business environment, local investment opportunities and partners and thus aim to bridge
information gaps often hindering FDI. More recently, new initiatives such as “German Desks” and
“AfricaConnect” were introduced. They rely on private-public partnerships to facilitate access to local
business opportunities but also to third markets in neighboring countries.
Based on an analysis of German FDI in 115 countries since 2010, we confirm that German Chambers of
Commerce are related to a higher German FDI stock in their country of location. Moreover, we find that
German investment guarantees help to reduce negative effects of low institutional quality. They are
nevertheless only a second best option as compared to improving the national institutional environment.
This is particularly true in the African context if the goal is to increase significantly the number of German
firms active on the continent.
Recipient countries have also developed tools to attract FDI including “Investment Promotion Agencies”
(IPAs) and “Special Economic Zones” (SEZs), aiming at compensating for weaknesses in the national
business environment. While there is some evidence in the literature about IPAs as investment facilitators,
the evidence is rather mixed concerning SEZs. In our analysis of German FDI, we do not find a significant
correlation between the presence of SEZs and the German FDI stock.
Assessing the impact of very recent initiatives such as the “German Desks” and “AfricaConnect” is less
straightforward as they are still in their infancy. They have the potential to reduce costly information
barriers to FDI. Nevertheless, their beneficial effect on German FDI may take time to materialize and
depends strongly on a business friendly institutional environment and cross border openness between
African countries to FDI and trade.
Keywords: Africa, Foreign Direct Investment, Investment Promotion

 2
KCG Policy Paper No. 5 | June 2020

*This policy paper is based on the report „Instrumente und Wirkung der Außenwirtschaftsförderung in
Afrika“ prepared for the Sector Project Sustainable Economic Development of Deutsche Gesellschaft für
Internationale Zusammenarbeit (GIZ) GmbH. The report was finalized in Fall 2019. We are grateful to the
German Federal Ministry for Economic Cooperation and Development and GIZ for funding this project and
to the German Federal Ministry for Economic Affairs and Energy and PricewaterhouseCoopers GmbH
Wirtschaftsprüfungsgesellschaft (PwC) for providing data on German investment guarantees on behalf of
the Federal Government.

 Julian Glitsch Olivier Godart, PhD
 Kiel Institute for the World Economy Kiel Institute for the World Economy
 Kiellinie 66 Kiellinie 66
 D-24105 Kiel D-24105 Kiel
 Germany Germany
 olivier.godart@ifw-kiel.de
 Prof. Holger Görg, PhD Saskia Mösle
 Kiel Centre for Globalization Kiel Centre for Globalization
 Kiel Institute for the World Economy Kiel Institute for the World Economy
 Kiellinie 66 Kiellinie 66
 D-24105 Kiel D-24105 Kiel
 Germany Germany
 holger.goerg@ifw-kiel.de saskia.moelse@ifw-kiel.de
 Frauke Steglich
 Kiel Centre for Globalization
 Kiel Institute for the World Economy
 Kiellinie 66
 D-24105 Kiel
 Germany
 frauke.steglich@ifw-kiel.de

About the Kiel Centre for Globalization (KCG): KCG is a Leibniz Science Campus initiated by Christian-
Albrechts University of Kiel and Kiel Institute for the World Economy. It works on an interdisciplinary
research agenda that evaluates the proliferation of global supply chains as an important aspect of
globalization. To this end, the KCG brings together researchers from economics, ethics and management
science. KCG is financially supported by the Leibniz Association and the State Government of Schleswig-
Holstein. More information about KCG can be found here: www.kcg-kiel.org.

The responsibility for the contents of this publication rests with the authors, not the Institute. Any comments should be
sent directly to the authors.

 3
KCG Policy Paper No. 5 | June 2019

1 Introduction

Global foreign direct investment (FDI) has substantially increased over the past decades and so has
FDI in Africa – but still the continent continues to rank among the recipient regions with the lowest
level of FDI worldwide. Figures from the World Investment Report 2018 show that global FDI stocks
have increased from 20.3 trillion US dollars in 2010 to 33.5 trillion US dollars in 2017; the comparable
figures for the African continent are 598 and 867 billion US dollars, respectively (UNCTAD, 2018).1
This implies that less than 3 percent of all FDI worldwide is located in Africa. Moreover, foreign
investments are mainly concentrated in a few countries in the North and the South. For Germany,
the African continent so far also plays a negligible role as a destination of investment; Africa’s share
in total German FDI is even lower than its share at the global level.

Since FDI can have positive effects on national economies, increasing FDI flows to Africa could
stimulate its economic development. Alfaro et al. (2004), for example, show that FDI has a positive
impact on the overall economic growth of the recipient country. Görg and Strobl (2005) show with
micro-data for Ghana that companies with managers who have gained experience with multinational
companies show higher productivity growth than other comparable companies. Bwalya (2006)
analyses enterprise data for Zambia and finds that domestic suppliers are increasing their
productivity growth as a result of additional FDI.

Poor quality of political, economic and legal institutions, high levels of political risk, and information
asymmetries are impediments to FDI inflows. These factors are particularly relevant for developing
countries – including in Africa – where institutions to avoid or at least mitigate risks are often not
sufficiently developed, and thus deter FDI (e.g. Busse und Hefeker, 2007; Asiedu und Freeman, 2009).
As a consequence, for investments in high-risk countries, external financing is difficult to obtain and
therefore a major obstacle (e.g. Foley and Manova, 2015). In addition, transparent information about
business conditions is often scarce in developing countries, constituting another barrier to foreign
investment (Harding and Javorcik, 2011). To increase the attractiveness for foreign investors, efforts
to improve institutional quality at the country-level can be accompanied by targeted economic policy
measures to overcome specific obstacles to investment.

Against this background, a crucial question is which economic policy instruments currently exist that
can facilitate and support foreign investment in Africa and which ones are particularly effective. This
paper outlines the most important foreign investment promotion instruments of both sender
countries – focusing on Germany – and recipient countries – focusing on the African continent – of
FDI and assesses their impact. The rest of the paper is structured as follows. Chapter 2 provides an
overview of the FDI trends in Africa with a special focus on Germany as an investor country. Chapters
3 and 4 present and evaluate the effectiveness of several investment promotion measures taken by
sender and recipient countries of FDI. Chapter 5 concludes with policy recommendations.

1
 For comparison, Germany alone had an inward FDI stock of 931 billion US dollars in 2017.

 4
KCG Policy Paper No. 5 | June 2020

2 Lagging behind – Foreign Direct Investment in Africa

The strong increase in global FDI flows over the past three decades has also embraced Africa but the
importance of the continent as a recipient of FDI remains low compared with other regions. The
value of the total stock of FDI on the continent has risen almost 15-fold since 1990 to just under 900
billion US dollars in 2018 (Figure 1). However, Africa’s share in the global stock of FDI fluctuated
between 2 and 3 percent over the same period even though its share of the world population rose
markedly. Africa’s share thus remains well below that of other developing regions. For example, East
Asia accounted for just under one fifth of global FDI in 2017, compared with less than 15 percent in
1990. Latin America’s share has since risen from 5 to 7 percent.

The main recipient countries of FDI on the continent remain South Africa as well as the countries in
North Africa, but their relative importance is declining (Figure 2). While in 2010 they accounted for
just under two-thirds of all FDI stocks in Africa, their share decreased to 46 percent in 2018. The bulk
of this decline is attributable to South Africa whose share shrank from 30 to 14.4 percent. Among the
North African countries, Egypt and Morocco remain the most important recipients of FDI – their
share remained roughly constant at just over 12 and 7 percent, respectively. Nigeria’s share grew
slightly from 10 to 11 percent despite the dominance of its oil sector and falling prices. Among the
most important emerging recipient countries in this period are Mozambique, Ethiopia, Ghana and
the Republic of Congo – each accounted for between 2.5 and 5 per cent of Africa's total stocks in
2018 (UNCTADStat, 2019). This list reflects the increasingly broad geographical distribution of FDI in
Africa. It also includes structurally highly diverse economies. For example, FDI in Mozambique and
the Republic of Congo continues to flow predominantly into the primary sector while the more
diversified Ethiopian economy is also attracting more investment in industries such as textile
processing (Nordea Trade Portal 2019a, 2019b; Heritage Foundation, 2019).

Africa plays a very minor role as a target for German FDI. Less than one percent of the total German
FDI stock was in Africa in 2017 compared with just less than 3 percent of global FDI stocks. Despite
the low share of German FDI in Africa, the share of employees in German companies in Africa was
somewhat higher at 2.6 percent of all employees in German companies abroad in 2017. Roughly
200,000 people were employed in German companies in Africa in 2017 (Figure 3). Around half of the
almost 1.2 trillion euros in German FDI was located in Europe, a third in the Americas and just under
14 percent in Asia (Figure 4). Africa is still behind Oceania with an investment volume of 11 billion
euros (13 billion US dollars) – less than one percent of the total stock.

The volume of German FDI in Africa is also low in comparison with other investing countries. While
the German FDI stock in Africa has hardly grown over the past decade, China has overtaken Germany
as an investor on the continent and has recently been almost on a par with the largest investors
France, the US and UK (Figure 7). Their FDI holdings in 2017 amounted to between 43 and 65 billion
US dollars each, respectively. Germany was last among the ten largest origin countries by stock in
2015, but in 2018 the Netherlands, Italy and Singapore were prominently represented instead
(UNCTAD 2016, 2019). With an investment volume of around 15 billion US dollars, India regularly
ranks at the bottom of the top 10. South Africa is the only intraregional investor represented and in
2018 it ranked 7th with a volume of 27 billion US dollars (UNCTAD, 2019).

 5
KCG Policy Paper No. 5 | June 2020

Compared with the main sending countries, German FDI is more concentrated in manufacturing as
opposed to the natural resources sector. The manufacturing sector, especially automobile
manufacturing, accounts for the majority of German FDI stocks, with services accounting for around
30 percent (Figure 5). Investments in automobile manufacturing are mainly concentrated in South
Africa, where they account for 40 percent of the total German investment stock (Figure 6). 2 The raw
materials sector, on the other hand, plays a subordinate role. 3 Thus, the structure of German FDI in
Africa is comparable to its structure in other developing regions such as Latin America and Asia. At
the same time, it differs significantly from that of other sending countries: In the case of British and
French FDI stocks, the commodities sector was by far the largest item; in the case of US investments,
it was roughly on a par with financial services. The share of FDI in the manufacturing industry was
low for all three sending countries (Figure 8). The prominent role of the natural resources sector is
generally accompanied by a high volatility of FDI inflows and a low share of value added. 4 FDI flows
to Africa in services and manufacturing remain concentrated mainly in a few countries in the north
and the south of the continent (UNCTAD, 2019).

The African Continental Free Trade Area Agreement (AfCFTA) can contribute to further diversification
of foreign direct investment and the establishment of regional value chains. The agreement, signed
in 2018, lays the foundation for an integrated African domestic market which, among other things,
will facilitate the establishment of cross-border value chains and can thus promote Africa’s global
competitiveness as an industrial location (Brookings, 2019). According to UNCTAD (2019), AfCFTA is
expected to diversify foreign direct investment away from the natural resources sector towards
industrial production and services. Since German companies are already predominantly active in the
industrial sector in Africa, they could particularly benefit from AfCFTA due to facilitated continental
market access and could thus contribute to the establishment of regional value chains.

2
 Automobile manufacturing in Figures 5 and 6 refers to “Manufacture of motor vehicles, trailers and semi-
trailers” as reported by Bundesbank. The economic activity “Wholesale and retail trade; repair of motor vehicles
and motorcycles” is included in “Other services”.
3
 It is not specifically mentioned in the Bundesbank’s bilateral stocks surveys and falls under the residual item
“Other”, which accounted for around 13 percent of stocks in Africa in 2017.
4
 As in other resource-rich developing countries, the price boom of the 2000s led to an investment boom in
many places in Africa. However, falling prices meant falling investment volumes from 2015 onwards and
significant disinvestments in some countries (UNCTADStat, 2019).

 6
KCG Policy Paper No. 5 | June 2020

Figure 1: Inward FDI stocks in Africa and the shares Figure 2: Inward FDI stocks by region
of developing regions in global FDI
 bn. US$ 25 1000 3,5
 Percent
1400 bn. US$ Percent
 900
 3,0
1200 20 800
 700 2,5
1000
 15 600
 2,0
 800
 500
 600 10 1,5
 400
 300 1,0
 400
 5 200
 200 0,5
 100

 0 0 0 0,0

 1990
 1992
 1994
 1996
 1998
 2000
 2002
 2004
 2006
 2008
 2010
 2012
 2014
 2016
 2018
 1990
 1992
 1994
 1996
 1998
 2000
 2002
 2004
 2006
 2008
 2010
 2012
 2014
 2016

 FDI stock in Africa (lhs)
 Sub-Saharan Africa (without South Africa)
 East Asia - share in global FDI (rhs)
 South Africa
 Latin America - share in global FDI (rhs)
 North Africa
 Africa - share in global FDI (rhs)
 Africa - share in global FDI (rhs)

Source: Own visualization based on UNCTADStat (2019). Source: Own visualization based on UNCTADStat (2019).

Figure 3: The role of Africa in German outward FDI Figure 4: German outward FDI stocks by recipient
activity and employment region
 4 250 1400
 Percent Thousand bn. €
3,5 1%
 1200 2%
 200
 3 14%
 1%
 1000 4%
 2%
2,5 1% 14%
 150
 800 2% 5%
 10% 29%
 2 5%
 600 29%
1,5 100 29%

 400
 1
 50 50%
 53% 49%
0,5 200

 0 0 0
 2010 2011 2012 2013 2014 2015 2016 2017 2010 2014 2017
 Employees of German firms in Africa
 Europe North America
 Share of Africa in total employees of German
 Latin America Asia
 firms abroad
 Share of German firms abroad with a Oceania Africa
 presence in Africa
 African share of German FDI stock

Source: Own visualization based on UNCTADStat (2019) and Source: Own visualization based on Bundesbank (2019).
Bundesbank (2019). * „North America“ = U.S.A. & Canada; all other countries of the
 American continent are recorded under „Latin America“.

 7
KCG Policy Paper No. 5 | June 2020

Figure 5: Sectoral distribution of German outward Figure 6: Sectoral distribution of German outward
FDI stocks by region/country in 2017 FDI stocks in South Africa and other African
 countries in 2010 and 2017
100% 100%

 80% 80%

 60% 60%

 40%
 40%

 20%
 20%

 0%
 0%
 Africa South Africa Latin Asia China
 Africa (without America (without South Africa South Africa Africa Africa
 South China) (2010) (2017) without without
 Africa) South Africa South Africa
 (2010) (2017)
 Others (incl. commodities sector)
 Other services Others (incl. commodities sector)
 Financial services Other Services
 Manufacturing industry (without automobile) Financial services
 Automobile manufacturing Manufacturing industry (without automobile)
 Automobile manufacturing

Source: Own visualization based on Bundesbank (2019). Source: Own visualization based on Bundesbank (2019).

Figure 7: German outward FDI stocks in Africa in Figure 8: Sectoral distribution of German outward
international comparison FDI stocks in Africa in international comparison

80 100%
 bn. US$
70
 80%
60

50 60%
40

30 40%

20
 20%
10

 0 0%
 Germany* Great France** USA
 2000
 2001
 2002
 2003
 2004
 2005
 2006
 2007
 2008
 2009
 2010
 2011
 2012
 2013
 2014
 2015
 2016
 2017

 Britain**

 France USA Manufacturing industry Financial Services
 Great Britain China Other services Commodities sector
 Germany Others

Source: Own visualizations based on data of the Bundesbank (for Source: Own visualizations based on data of the Bundesbank (for
Germany), the Office of National Statistics (for Great Britain), Germany), the Office of National Statistics (for Great Britain), the
Banque de France (for France), the Bureau of Economic Analysis Banque de France (for France), and the Bureau of Economic
(for USA) and the Ministry of Commerce (for China). Analysis (for USA).
 *For Germany, the commodities sector is included in category
 „Others“.
 **Data for Great Britain and France are from 2014.

 8
KCG Policy Paper No. 5 | June 2020

3 Investment promotion instruments

Foreign direct investment can be supported by targeted economic policy measures. This chapter
focuses on the question of which instruments can be used to support investment in Africa. A
distinction is made between measures taken by the sending countries and those taken by the
recipient countries. On the part of the sending countries, the focus is on Germany. The role and the
significance of bilateral investment promotion treaties are discussed, which also include the issuance
of investment guarantees by the Federal Government to cover political risks in foreign direct
investments. In addition, we examine the role of the German Chambers of Commerce Abroad (AHKs)
as mediators of information on investment conditions in foreign markets. On the part of the recipient
countries on the African continent, investment promotion agencies (IPAs) and special economic
zones (SEZs) are described as instruments of investment promotion. We focus on these two
instruments due to their high relevance for Africa. First, information asymmetries are a major
obstacle for FDI in developing countries, a weakness that IPAs address. Second, public resources are
limited and nation-wide improvements in investment conditions often very costly – one of the
reasons why SEZs have become increasingly popular in Africa. At the same time, both instruments
can provide valuable insights – by working closely together with the private sector (IPAs) and
providing a testing ground for reforms (SEZs) – feeding back into national reform processes.

3.1 Investment promotion instruments of origin countries

3.1.1 Investment promotion contracts and investment guarantees of the German Federal
 Government

The investment guarantees of the German Federal Government protect foreign investments of
German companies in newly industrializing and developing countries against political risks. They have
been issued since 1960 and can cover the following risks (BMWi, 2019a): 5

 • Nationalisation, expropriation or measures equivalent to expropriation;
 • War, armed conflict, revolution and insurrection or acts of terrorism related to such events;
 • Breach of legally binding commitments by state or state-controlled authorities;
 • Payment moratoria and conversion or transfer restrictions.

The existence of a bilateral investment promotion and protection agreement (BIPA) with the
recipient country of the investment is usually a prerequisite for the granting of a guarantee. BIPAs

5
 Guarantees can be provided for equity investments, investment-like loans, capital endowments of branches or
operating facilities (endowment capital) and other asset rights. The subject of the guarantee is primarily the
capital invested in cash or in kind (capital cover). Additionally and depending on the individual project, earnings
due can also be included in the guarantee, for example in the form of dividends or interest (earnings cover). The
duration of the investment guarantee is generally 15 years. When a guarantee is issued, the Federal Government
not only pays compensation in the event of a loss, but also actively promotes damage avoidance. In the case of
an impending loss, the German Federal Government and its diplomatic representations abroad will act to
prevent and mitigate losses to the investment project. In the event of a loss due to political measures and events
in the host country the German Federal Government will pay compensation to the German investor.

 9
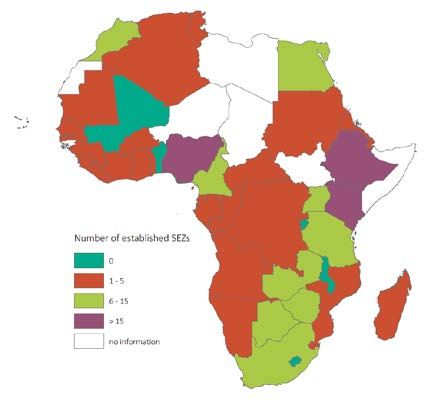
KCG Policy Paper No. 5 | June 2020

establish terms and conditions for the promotion and protection of private foreign investment.
Germany has concluded more than 130 such agreements since 1959 (BMWI, 2019b); since 2009 the
competence is shared between the European Union and its Member States. 6 On the African
continent there are BIPAs between Germany and 44 states.7 Several studies show that bilateral
investment treaties can have a positive impact on FDI. 8 For example, Egger and Merlo (2007) find
that the conclusion of a bilateral investment agreement increases FDI by an average of 5 percent in
the short term, and by about 9 percent over a longer period. However, if the differences in the
quality of the political institutions in the sending and recipient countries are too large, BIPAs have no
effect (Falvey and Foster-McGregor, 2017).

The portfolio of the German government’s investment guarantees has increased substantially since
the 1990s but remained at a low level in sub-Saharan Africa. Figure 9 shows the development of the
volume of the German investment guarantees by regions. Currently, the guarantee portfolio
amounts to just under 24 billion euros.9 On the other hand, in 1990 the guarantee portfolio
amounted to just 2 billion euros; before that, the investment guarantees had been used even less.
However, while the guarantee volume in several regions – especially in East Asia and the Pacific
region as well as in Europe and Central Asia – significantly increased, the guarantee volume in sub-
Saharan Africa remained at a low level. In 2018, the region accounted for less than 2 per cent of total
exposure. Most guarantees exist for investments in East Asia and the Pacific region (32 per cent) and
for Europe and Central Asia (32 per cent), followed by South Asia (15 per cent), the Middle East and
North Africa (11 per cent) and Latin America (8 per cent).

Within Africa, North Africa is the key region with regard to guarantees. In 2018, the volume
amounted to around 2 billion euros (Figure 10). Southern Africa follows by a large margin with a
guarantee volume of 340 million euros. In other regions of Africa, the investment guarantees –
despite the general possibilities of cover given by the aforementioned network of BIPAs – are rarely
used. In 2018, the guarantee portfolio amounted to only 44 million euros in East Africa and 18 million
euros in West Africa. In Central Africa, no investments are currently covered by investment
guarantees. 10 Overall, the demand for investment guarantees seems to match with the main focus of
German investments in Africa.

6
 Since 2009, the EU has been competent for foreign direct investment and is negotiating Investment Protection
Agreements for the EU and its Member States with third countries. However, the BIPAs of Member States
remain in force until a corresponding replacement agreement has been concluded at the EU-level.
7
 There are no treaties with Equatorial Guinea, Djibouti, Eritrea, Gambia, Malawi, Guinea-Bissau, the Comoros,
São Tomé and Príncipe and the Seychelles. South Africa terminated the BIPA with Germany with effect from
2014. Additionally, a partnership agreement between the EU and part of the Southern African Development
Community (Botswana, Eswatini (formerly Swaziland), Lesotho, Mozambique, Namibia) has been in force since
2018.
8
 See Falvey and Foster-McGregor (2017) for an up-to-date overview of the state of research.
9
 In the annual report of the investment guarantees 2018, the maximum liability of the German Federal
Government from capital and income cover is shown at 33.8 billion euros, as this represents the maximum
liability for the Federal Government. For a comparison with FDI data, however, the consideration of capital cover
is more suitable.
10
 More recently, the German Federal Government decided to provide additional incentives to encourage
German investments in Africa, for example by making the terms governing investment guarantees in Compact

 10
KCG Policy Paper No. 5 | June 2020

In most regions of the world, the investment guarantees of the Federal Government mainly cover
investments in the manufacturing sector (Figure 11). In the regions of East Asia and the Pacific, South
Asia, Latin America and the Caribbean, the Middle East and South Africa, this sector accounted for
more than 60 per cent – in some places even 80 per cent – of all guarantees in 2018. In South Africa,
for example, more than 80 per cent of all investment guarantees are located in this sector. In North
Africa, on the other hand, raw material extraction dominates, accounting for more than 90 percent
of the total guarantee volume in this region. The guarantee portfolio in sub-Saharan Africa without
South Africa is more diverse. The share of investments in the construction industry and in
manufacturing is similar with more than 30 per cent each; the energy industry follows with 20 per
cent. To date, demand for investment guarantees in the automotive sector has focused on South
Africa.

Figure 9: Development of the German investment Figure 10: Development of the German investment
guarantee volume by region guarantee volume by regions in Africa
 10 3,0
 bn. € bn. €
 8 2,5

 6 2,0

 4 1,5

 2 1,0

 0 0,5
 1990 2000 2010
 0,0
 East Asia and Pacific Region
 1990 2000 2010
 Europe and Central Asia
 Latin America and Caribbean North Africa East Africa
 Middle East and North Africa Southern Africa West Africa
 South Asia Central Africa
 Sub-Saharan Africa

Note: The figure shows the maximum amount of capital cover Note: The figure shows the maximum amount of capital cover
provided by the investment guarantees of the Federal Government provided by the investment guarantees of the Federal Government
for each region. for each region in Africa.
Source: Own visualization based on data on investment guarantees Source: Own visualization based on data on investment guarantees
of PricewaterhouseCoopers GmbH Wirtschaftsprüfungsgesellschaft of PricewaterhouseCoopers GmbH Wirtschaftsprüfungsgesellschaft
(PwC) on behalf of the Federal Government. (PwC) on behalf of the Federal Government.

with Africa countries more attractive. These include a partial suspension of the application fee and a reduced
deductible borne by the policy holder if projects are deemed appropriate.

 11
KCG Policy Paper No. 5 | June 2020

 Figure 11: Sectoral distribution of German investment guarantees by regions

 100%
 90%
 80%
 70%
 60%
 50%
 40%
 30%
 20%
 10%
 0%
 East Asia and South Asia Europe and Latin America Middle East North Africa Sub-Saharan South Africa
 Pacific Region Central Asia and Caribbean Africa (without
 South Africa)
 Extractive industry Automobile industry
 Manufacturing (without automobile) Energy
 Construction Financial services
 Others

 Note: The figure shows the investment guarantee stocks by sectors and regions in 2018. As South Africa terminated the BIPA with
 Germany with effect from 2014 no new guarantees were issued since then. Nevertheless, there is still an active stock of guarantees
 because they are usually granted for 15 years.
 Source: Own visualization based on data on investment guarantees of PricewaterhouseCoopers GmbH Wirtschaftsprüfungsgesellschaft
 (PwC) on behalf of the Federal Government.

3.1.2 German Chambers of Commerce Abroad (AHKs) and German-Desks-Initiative

The German Chambers of Commerce Abroad (German: “Auslandshandelskammern”, short: AHKs)
play a central role in providing information on investment opportunities and conditions in foreign
markets to German firms. In general, AHKs serve to promote foreign trade and investment. They
advise German companies that are active or want to become active in foreign markets and represent
the interests of German companies locally. The range of services offered by the AHKs includes
support with legal and tax issues, personnel recruitment, translation and interpreting services.
Furthermore, they offer the organisation of delegation trips or trade fair appearances, location
consulting, business partner mediation and market studies. The 140 German Chambers of Commerce
Abroad (AHKs) are located in 92 countries. 11 In Africa, AHKs are present in Egypt, Algeria, Angola,
Ghana, Kenya, Morocco, Nigeria, South Africa, Tanzania and Tunisia. There are also regional offices in
Ethiopia, Mozambique, Rwanda, Zimbabwe, Zambia and Uganda. Thus, the network of AHKs also
achieves a large coverage in Africa.

Launched in 2017, the German Desk Initiative is a relatively new form of public-private partnership
for information dissemination and investment planning support. This initiative offers potential
investors (especially SMEs) assistance with financing issues. Together with the Deutsche Investitions-
und Entwicklungsgesellschaft (DEG) and partner banks in the respective recipient countries, the AHKs
support German companies and their local trading partners in all matters relating to banking services

11
 Via internet (09.07.2019) .

 12
KCG Policy Paper No. 5 | June 2020

(e.g. opening an account) and financing solutions (e.g. trade and investment financing). The advisory
services are aimed both at German companies wishing to invest abroad and at foreign companies
wishing to purchase products or services from German companies. In general, the aim of this
initiative is to support German companies and their partners in countries with a relatively weak
financial sector. One focus of this instrument is thus on African countries. Of the six German Desks
set up to date, three are present in Africa – in Ghana (since 2019), Kenya and Nigeria. 12 Although
there are still few German Desks so far, it is expected that there will be multiplier effects (spillovers)
in neighboring countries in the future. Thus, investment projects in neighboring countries could also
benefit from the German Desks through the networks of the participating banks 13 and chambers. The
German Desk in Kenya, for example, is the point of contact for all German-East African trade
relations and is not limited to the Kenyan market. The German Desks in Ghana and Nigeria have
Access Bank as their local partner bank, which is represented on the entire African continent. With
the help of these regional networks, barriers to investment and financing can be reduced to a greater
extent. Additionally, the AfCFTA could also contribute to regional multiplier effects.

In addition to the German Desks Initiative, DEG offers AfricaConnect, a further instrument that
supports German and European companies with investment projects in Africa. AfricaConnect offers
loans for investments in African countries. In principle, investment projects on the entire African
continent can be supported within this framework. However, preference is given to companies
wishing to invest in Compact with Africa countries. 14 The aim of this instrument is to promote
investment in Africa, paying particular attention to development policy aspects. In addition to
profitability, the expected developmental impact is taken into account in the lending decision. For
example, explicit reference is made to the fact that the costs of implementing environmental and
social standards can be borne.

3.2 Investment promotion instruments of recipient countries

3.2.1 Investment promotion agencies (IPAs)

Since the 1980s, investment promotion agencies (IPAs) have become an important component of the
investment promotion strategy of many countries. IPAs bundle information for investors and help to
balance information asymmetries between investors and recipient countries. Information
asymmetries represent a major obstacle to investment (Gordon and Bovenberg, 1996; Harding and
Javorcik, 2011). In principle, IPAs’ tasks include image building for the investment location,
investment generation, investor support and political advocacy. For example, they support investors
in the search for local partners, the selection of locations and bureaucracy and thus play an
important role in reducing transaction costs.

12
 The other German Desks are in Indonesia, Bangladesh and Peru; Via internet (09.07.2019)
< https://www.deginvest.de/Internationale-Finanzierung/DEG/Unsere-L%C3%B6sungen/German-Desks/>.
13
 According to IMF (2018), the regional networking of banks in Africa in particular has the potential to generate
spillovers to neighboring countries.
14
 Compact with Africa partner countries include Egypt, Ethiopia, Benin, Burkina Faso, Côte d'Ivoire, Ghana,
Guinea, Morocco, Rwanda, Senegal, Togo and Tunisia.

 13
KCG Policy Paper No. 5 | June 2020

There are around 190 investment promotion agencies in almost all countries worldwide. 15 The
umbrella organization, the World Association of Investment Promotion Agencies (WAIPA), represents
the interests of 130 investment promotion agencies worldwide. 16 Of these, 37 IPAs are located in 30
African countries. Some countries, including Egypt, South Africa and Tanzania have national IPAs as
well as subnational IPAs specializing in specific regions.

Especially in countries with high bureaucratic hurdles and information asymmetries, IPAs can
facilitate foreign direct investment. For developing countries, research shows that the existence of
IPAs increases foreign investment, whereas such a positive correlation could not be found for
developed countries (Harding and Javorcik, 2011; Harding and Javorcik, 2013). In countries with
relatively weak institutions, IPAs thus contribute to reducing information asymmetries and
promoting FDI.

IPAs need to be equipped with the appropriate resources and a concrete mandate to promote
investment in order to fulfil their tasks effectively. A study on the IPAs of eight southern
Mediterranean countries shows that one of the biggest obstacles to their work is a lack of resources
(OECD, 2019). It is crucial for the IPAs to be well-connected and to actually offer what investors need
in order to have a positive impact. A survey of foreign investors in African countries showed that IPAs
are not the first to be consulted when looking for new investment locations, but rather to be
approached by investors already active on the ground to obtain information (UNIDO, 2011). This
suggests that at least some IPAs in Africa are unable to meet the needs of foreign investors.

3.2.2 Special economic zones

In recent years, many countries in Africa have (re)discovered special economic zones (SEZs) as an
instrument of industrial policy. Special economic zones, also known as free zones, are geographically
defined areas designated by the government in which firms are subject to laws and regulations that
differ from those in the rest of the country and that are designed to be more favorable to business.
In most cases, SEZs offer tax and other fiscal incentives (e.g. duty exemptions) for investors. In
addition, companies generally benefit from administrative facilitations, special services and a high-
quality infrastructure. In contrast to traditional industrial estates or industrial parks, SEZs have their
own legal structures, which are laid down in a corresponding law and monitored by the state – often
through its own Special Economic Zones Authority.

SEZs can counteract existing weaknesses in the national investment climate and are therefore
regarded as a potentially strong instrument for promoting investment. By creating an attractive
business environment, SEZs aim at attracting foreign direct investment in order to diversify the
economy, generate exports and create jobs. In addition, policymakers often hope for so-called
dynamic effects of SEZs in order to develop positive macroeconomic effects. These include the
integration of local enterprises into global value chains via links with SEZ enterprises, the promotion

15
 Cf. Harding and Javorcik, 2012.
16
 Cf. World Association of Investment Promotion Agencies (WAIPA), 2019. Via internet (24.07.2019)
.

 14
KCG Policy Paper No. 5 | June 2020

of knowledge and technology transfers and the support of industrial upgrading. In addition, SEZs can
be used as “testing grounds” for nationwide reforms.

SEZs are increasingly gaining popularity, particularly in developing and emerging countries, which is
reflected in their increasing number and importance for the global economy. According to recent
estimates, there are now over 5,000 SEZ in more than 140 countries worldwide (UNCTAD, 2019), up
from around 200 SEZs in the 1980s (Figure 13). They are responsible for at least 20 percent of global
trade in goods (OECD, 2018). Most SEZs are located in emerging and developing countries in Asia –
more than 2,500 SEZs are located in China alone (Figure 14). Almost 500 SEZs can be found in Latin
America and the Caribbean; about 250 in Africa.

 Figure 12: Global development of SEZs Figure 13: Geography of SEZs worldwide
 Latin
 Number of SEZs America Transition
 Africa
 and 4% economies
 Number of countries with SEZs (rhs)
 Caribbean 4%
 6000 200 9% Industrial
 countries
 5000 11%
 150 Other
 4000 Asian
 developing
 3000 100 countries
 20%
 2000
 50
 1000
 India China
 0 0 7% 45%
 1975 1986 1995 1997 2002 2006 2018
 Notes: Industrial countries: Europe, North America, Australia, Isreal,
 Notes: Single Factory Free Zones, i.e. single firms that have SEZ Japan, New Zealand. Transition economies: Countries in Eastern
 status, are not included. Europe, Central Asia as well as Russia.
 Source: Boyenge (2007), estimates by UNCTAD (2019) for 2018. Source: UNCTAD (2019).

There are many different types of SEZs. Some specialize, for example, in goods processing for export
markets (“Export Processing Zones”) or in warehousing and logistics services (“Free Trade Zones”). 17
In some countries, such as Mexico, India or Ghana, SEZ incentives can be granted to individual
companies regardless of their location. In recent years and particularly in developing countries, a
trend towards larger, multi-sectoral SEZs can be observed; they are open to investors from various
sectors of the economy and can accommodate not only production facilities and offices but also
residential areas, shops, research centers, educational facilities, etc. (Hachmeier and Mösle, 2019).

Despite the veritable boom in SEZs, their track record is mixed, especially in Africa. 18 While many
SEZs in emerging and developing countries successfully generated foreign direct investment, exports
and jobs, only a few succeeded in unleashing dynamic effects and contributing to broader economic
structural change. Positive examples can be found in Asia, where SEZs – e.g. in China, Taiwan and
South Korea – are regarded as an important engine of export-oriented growth in recent decades.
Many African countries have tried to replicate this success. In Liberia, Mauritius and Senegal, the first

17
 SEZs in advanced economies are mostly specialized in warehousing and logistics; examples are the more than
190 “Foreign Trade Zones” in the US (NAFTZ, 2018).
18
 Hachmeier und Mösle (2019) provide a detailed evaluation of the available research.

 15
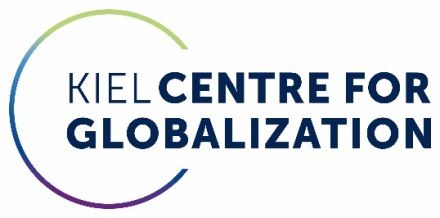
KCG Policy Paper No. 5 | June 2020

SEZs were opened in sub-Saharan Africa as early as in the 1970s; in the 1990s the investment
promotion instrument became increasingly popular. The majority of African countries now have SEZ
programs (Figure 7); others are planned. 19 However, with a few exceptions (e.g. Mauritius and
Morocco) African SEZs overall fell short of government expectations. Lack of national
competitiveness and inadequate planning and implementation are the main reasons for the lack of
success (Farole, 2011; Farole and Moberg, 2017).

Finally, there are also positive signs for the development of some African SEZs. One example is the
Kigali Special Economic Zone in Rwanda (Steenbergen and Javorcik, 2017). Among others, the
German car manufacturer Volkswagen opened a factory there in 2018.20 The investment of 16
million euros is expected to create around 1,000 jobs. 21 Since many countries which had had no or
unsuccessful SEZs have initiated new SEZ programs in recent years (e.g. Angola, Botswana, Ethiopia,
Liberia, Rwanda, Senegal, Swaziland) and the zones are often still in the development phase, it is not
yet possible to make a broad assessment of the success of the recent SEZ boom.

SEZs are often criticised for their working conditions and environmental effects, but most problems
do not seem to be SEZ-specific. There is little evidence that SEZs systematically perform worse than
other centres of economic activity in this respect. National labour legislation in most countries is also
valid within SEZs (ILO, 2017); exceptions are particularly rare in more recent SEZ regimes (Hachmeier
and Mösle, 2018). Deficits in compliance with environmental and employment standards – often due
to lack of control and enforcement by the authorities – are generally predominant problems in many
developing and emerging countries and not limited to SEZs. Meanwhile, sustainability has become an
important issue for many SEZs and competition for foreign direct investment between SEZs based on
social and environmental standards is increasing (UNCTAD, 2019).

19
 Figure 7 only takes into account active SEZs; SEZs in the planning and development phase – more than 50 on
the African continent (UNCTAD, 2019) – are not included. Some countries, such as Ghana and Tanzania, offer SEZ
incentives to individual companies regardless of their location. In other countries, such as Lesotho, there is no
SEZ program, but there are various SEZ-like policy instruments to support exporters (Farole, 2011). These special
forms are also not included in Figure 7.
20
 Other examples of SEZs in Africa with investments from Germany are the Coega Special Economic Zone in
South Africa (Rehau, Benteler and Hella in the automotive sector; Bosun Bricks in the construction sector) and
the Tangier Med Zone in Morocco (Adidas, Siemens Gamesa Renewable Energy, Bosch).
21
 Neue Züricher Zeitung of 30.06.2018: „VW betritt in Rwanda Neuland“. Via internet (05.08.2019)
.

 16
KCG Policy Paper No. 5 | June 2020

Figure 14: Special Economic Zones in Africa

Source: Own visualization based on UNCTAD (2019).

4 Effects of the presented instruments

In this chapter, an econometric gravity model is used to estimate the determinants of German FDI
and, in particular, to analyse the impact of the policy measures described in Chapter 3. The gravity
model was originally developed to explain bilateral trade flows by the size and distance of two
countries (see Head and Mayer, 2014) but has also proved its worth for explaining bilateral FDI (e.g.
Carr et al., 2001, Görg and Greenaway, 2003).

More specifically, the stocks of German direct investment abroad are estimated at the country-level
for the time period 2010 to 2016 for 115 destination markets. Alternatively, the number of German
branches in the respective countries is used as the dependent variable. Since bilateral FDI is
influenced by factors such as market size, the level of development, geographical and economic
distance, and the quality of institutions (see Wheeler and Mody, 1992, Carr et al., 2001), these
fundamental factors are included in the estimation of FDI from Germany. In addition to these
standard gravity variables, the policy measures of the home and recipient countries listed in Chapter
3 are included as determinants of German FDI. In detail, the following variables are used to estimate
the gravity model:

Market size and economic development: The market size of a country is captured by the gross
domestic product (GDP). In principle, a country attracts more FDI the larger it is. Thus, a positive
relationship between the GDP of a recipient country and German FDI stocks is expected. In addition
to pure market size, the level of development of a destination country also plays a role for FDI. In line
with market size, it is expected that a higher level of development will be accompanied by higher
levels of FDI inflows. To proxy a country’s level of development, we use the World Bank’s
categorization into low, low middle, high middle and high income countries by the level of GDP per

 17
KCG Policy Paper No. 5 | June 2020

capita. It is important for the interpretation of the results that the group of high-income countries
serves as the reference group.

Geographical and economic distance: The distance between countries continues to play an important
role in the exchange of goods and services. The closer countries are to each other, the more they
trade with each other. The same applies to investments, as information and communication costs
increase with distance. Distance (measured as distance in kilometres between the countries’ capitals)
thus takes up informal investment barriers and is included in the estimation model. To examine
whether African countries differ from other investment locations for German FDI, an additional
binary variable Africa is included, which assumes the value 1 for African countries.

We use bilateral trade flows as an alternative indicator for a country’s economic relevance for
Germany. To avoid multicollinearities between trade and other explanatory variables in our gravity
estimation of German FDI, we use the residual of a regression of trade flows to GDP, GDP per capita,
distance and dummy variables for years. The sign of the coefficient can be positive or negative
depending on whether trade and direct investment complement or replace each other (Brainard,
1997; Helpman 1984).

Quality of institutions: Greater political stability, security and asset protection play a crucial role in
attracting FDI as they reduce the risks to investment projects. Political, economic and regulatory
institutions that reduce these risks should therefore be associated with higher FDI stocks. We use the
Fraser Institute’s composite index of economic freedom that also reflects the security of property
rights. The variable takes values from 0 to 10. The lower the index, the more protected is economic
freedom, including the judicial system, and the more efficiently protected are property rights by law.

German investment promotion instruments: We use the data on Federal Investment Guarantees (IG)
described in more detail in Chapter 3 including the information whether there was a non-zero total
guarantee volume in a certain year in a recipient country. 22 It is expected that investment guarantees
contribute to reducing the political risks of an investment and are thus positively linked to FDI from
Germany. As such, they are closely related to the institutional quality in the recipient countries. In
addition, we introduce an indicator for whether a country is host of a German AHK as described in
Chapter 3. Since the role of AHKs is to link German buyers and investors with local suppliers and
companies, they can reduce the information costs for potential investment projects. We therefore
expect a positive link with German FDI. However, it is likely that AHKs will need time to establish links
with local companies before facilitating German FDI and therefore, positive effects will probably
materialise with a time lag.

Investment promotion tools by recipient countries: As shown in Chapter 3, the interest in SEZs has
increased sharply but their links with total FDI to a country where the SEZ is located are
indeterminate and deserve more empirical scrutiny. To this end, we include a binary variable equal
to one if a country has active SEZs and zero otherwise in our country sample. The data is provided by
UNCTAD and complemented with own research findings.

22
 All countries that report a non-zero guarantee volume are included. This also holds for countries that no
longer receive new guarantees but still have guarantee stocks.

 18
KCG Policy Paper No. 5 | June 2020

To investigate the determinants of German FDI, we implement a gravity approach with quasi-panel
estimation methods as follows:

 = 0 + 1 log( ) + 2 log( ) + 4 ( ) + 5 ( ) + 6 ( ) + 7 + +

Where is German FDI or the number of German companies, respectively, in recipient country i
at time t. t covers the years 2010 to 2016. Since in some countries there is no German FDI, we use
the Poisson Pseudo-Maximum-Likelihood (PPML) estimation technique that allows for the inclusion
of this information.

Table 1: PPML Gravity Estimation
Dependent variable FDI Stock Number of German companies abroad

 (1) (2) (3) (4) (5) (6)
GDP 0.94*** 0.93*** 0.94*** 0.91*** 0.91*** 0.90***
 (0.068) (0.067) (0.070) (0.022) (0.022) (0.023)
Distance -0.54*** -0.55*** -0.53*** -0.60*** -0.60*** -0.59***
 (0.044) (0.439) (0.048) (0.024) (0.024) (0.025)
Trade 0.42*** 0.44*** 0.40*** 0.74*** 0.74*** 0.73***
 (0.087) (0.087) (0.101) (0.042) (0.043) (0.043)
Investment Guarantees (IG) -0.33** -1.48*** -0.27** -0.13** -0.22** -0.08
Dummy (0.114) (0.260) (0.114) (0.057) (0.112) (0.058)
Institutional Quality (IQ) -1.36*** -1.79*** -1.40*** -1.05*** -1.11*** -1.09
 (0.160) (0.269) (0.168) (0.076) (0.104) (0.058)
(IG)×(IQ) -- 1.20*** -- 0.11
 (0.269) (0.133)
AHK Dummy 1.55*** 1.52*** 1.45*** 0.99*** 0.99*** 0.92***
 (0.240) (0.238) (0.216) (0.156) (0.156) (0.0152)
AHK years 0.002 0.002**
 (0.002) (0.001)
SEZ Dummy 0.09 0.052 0.097 -0.02 -0.02 -0.01
 (0.117) (0.125) (0.120) (0.054) (0.054) (0.059)
Low Income Dummy -1.05** -1.17** -1.06** -0.06 -0.06 -0.08
 (0.370) (0.370) (0.367) (0.267) (0.267) (0.266)
Low-Medium Income -0.50** -0.62*** -0.52*** -0.24** -0.24** -0.25**
Dummy (0.154) (0.149) (0.518) (0.103) (0.103) (0.100)
Upper-Middle Income -0.01 -0.12 0.002 -0.01 0.01** -0.01
Dummy (0.109) (0.111) (0.011) (0.073) (0.009) (0.070)
Year Dummies yes yes yes yes yes yes
Number of Observations 783 783 783 783 783 783
Number of Recipient Countries 115 115 115 115 115 115
GDP, distance, trade, and institutional quality are expressed in logarithms. Robust standard errors in parentheses.
*** significant at 1% level, ** significant at 5% level, * significant at 10% level; years from 2010 to 2016. Source: Own calculations.

Table 1 shows the baseline results. FDI is higher the larger and the closer a recipient country is. The
traditional gravity variables are statistically significant, robust across all specifications and have the
expected signs. GDP, a proxy for market size, is associated positively with German FDI measured by
the stock of FDI and the number of German companies active in a foreign country, respectively. The
distance coefficient is negative and significant, suggesting that distance is an important determinant
of the location decision of German investors abroad. Moreover, the higher bilateral trade between
Germany and another country, the higher is the German FDI stock in this country.

 19
KCG Policy Paper No. 5 | June 2020

The presence of German AHK seems to foster FDI whereas the role of SEZ seems to be small. The
results show a positive and statistically significant association between the dummy variable
indicating the presence of a German Chamber of Commerce Abroad and the stock of German FDI. In
addition, there is a significant correlation between the number of years a German Chamber of
Commerce has been present in a country, and the number of firms active. While the result is not
entirely robust – the stock of FDI is not significantly related to the age of an AHK –, it suggests that
the existence of a German AHK may be indeed associated with lower costs and obstacles to German
FDI. The SEZ variable is also mostly positive, but never statistically significant at conventional levels. 23

Investment guarantees – at least partly – compensate for poor legal protection of assets of foreign
investors. The dummy variable signaling active investment guarantees in a given country is negative
and significant, suggesting that countries covered by German investment guarantees are, on average,
less attractive for German FDI than countries without investment guarantees. However, reverse
causality is likely to be a problem: The lower institutional quality and the higher political risks, the
lower is the stock of German FDI and the more likely German firms are probably to make use of the
investment guarantees. Due to the close link with investment guarantees, a (reverse) measure of
institutional quality (IQ) is also introduced into the regression model. The robust and significant
negative coefficient suggests a positive correlation between institutions promoting economic
freedom and the size of German FDI stocks. In addition, the question arises whether the presence of
investment guarantees affects the relationship between institutional quality and German FDI stocks.
Since investment guarantees protect foreign investments of German companies in newly
industrializing and developing countries against political risks, they could make FDI less dependent on
good institutional quality in the destination country. To answer this question, we introduce an
interaction term between the institutional quality variable (IG) and the investment guarantee
dummy (IG) into the estimation (see columns 2 and 4 of Table 1). Interestingly, the interaction effect
is positive and significant when FDI stocks are the dependent variable (column 2) but the coefficient
is somewhat smaller than that of IQ. 24 This implies that the positive correlation between institutional
quality and German FDI stocks is, on average, weaker in countries with a positive stock of investment
guarantees covered by the German Federal Government. It suggests that the institutional
characteristics of the recipient country are decisive but less important for the investment location
decision of German FDI in the presence of guarantees.

23
 Note that this result on the SEZ coefficient should be taken with a pinch of salt as it can hide some
heterogeneity within countries and between SEZs not observable to us but important for FDI. It also has to be
kept in mind that SEZs are mostly used as an instrument of developing and emerging countries to compensate
for weaknesses in the national business environment.
24
 The effects are qualitatively similar when the number of German companies is the dependent variable.
However, the interaction term is not statistically different from zero in this specification.

 20
KCG Policy Paper No. 5 | June 2020

5 Policy conclusions

Compared with other countries, German FDI in Africa is lagging behind. German investors have little
presence on the African continent and they are concentrated in a few African countries. With a series
of investment promotion measures, Germany is attempting to facilitate investments in Africa for
German companies. These include, among others, the investment guarantees of the German Federal
Government, which protect German companies against political risks when investing in developing
and emerging countries, or the German Chambers of Commerce abroad, which provide information
on local business opportunities and partners. More recently, new initiatives such as German Desks
and AfricaConnect have been introduced. They rely on private-public partnerships to facilitate access
for foreign investors to local business opportunities and to third markets in neighboring countries.

Based on an analysis of German FDI in 115 countries since 2010, we confirm that the presence of a
German Chamber of Commerce (AHK) in a country is related to higher German FDI stocks in this
country. AHKs act as intermediaries between investors and recipient countries; the bilateral network
can fulfill an important function for German investors. To the extent that current initiatives such as
the German Desks or Compact with Africa contribute to creating new links between Germany and
recipient countries, they have the potential to reduce costs and barriers to German FDI in the future.
Moreover, our analysis shows that German investment guarantees help to reduce negative effects of
low institutional quality. Thus, investment guarantees seem to partially compensate for poorer
institutions and low legal protection of assets. They are nevertheless only a second best option as
compared to improving institutional quality in recipient countries. In sub-Saharan Africa the
investments of German entities as well as the investment guarantee volume remain at a low level
even though the overall guarantee volume has increased strongly in the last decades.

Recipient countries have also developed some investment promotion tools to attract FDI including
Investment Promotion Agencies (IPAs) and Special Economic Zones (SEZs). Especially in countries
with high bureaucratic barriers and information asymmetries, IPAs can facilitate FDI. A decisive factor
for their success is that they function well and can respond to the needs of foreign investors.
Similarly, SEZs can facilitate FDI if they are carefully planned and executed. In Africa, their track
record has so far been mixed at best but they still remain a popular instrument of industrial policy.
Our empirical results show no significant relation between SEZs and German FDI. However, this result
is not surprising in view of the observation that SEZs are established primarily in countries with a
weak institutional framework. In many African countries, a lack of national competitiveness and
inadequate planning and implementation of SEZs continue to prevent the development of potential
positive effects such as those observed in many Asian countries. Moreover, many African countries
set up SEZs only a few years ago so that an evaluation of their performance would be premature.

Assessing the impact of very recent initiatives such as the German Desks and AfricaConnect is also
less straightforward as those initiatives are still in their infancy. They have the potential to reduce
costly information barriers to FDI. Nevertheless, their beneficial effect on German FDI may take time
to materialize and depends strongly on a business friendly institutional environment and cross
border openness between African countries to FDI and trade.

 21
You can also read