Underlying Issue of Electricity Access in Togo - Carpophore NTAGUNGIRA - African ...
←
→
Page content transcription
If your browser does not render page correctly, please read the page content below
Note 03 | SePteMBeR 2015

Underlying Issue
of Electricity
Access in Togo
Carpophore NTAGUNGIRA
Disclaimer Clause
The results, interpretations and conclusions presented in this document are those
of the author(s) and do not necessarily reflect those of the African Development
Bank Group or its Board of Directors. When preparing this document, everything
was done to ensure that the information presented is as up-to-date and as accurate
as possible and clearly expressed. That said, errors might have inadvertently slipped
in and the laws, rules and regulations in force might have changed. The African
Development Bank Group publishes its documents without any guarantee
whatsoever. Consequently, it is not liable for any inaccuracies therein and any
consequences that might arise from their use.
UNDERLYING ISSUE OF ELECTRICITY ACCESS IN TOGO

                                                  TABLE OF CONTENTS

1                 INTRODUCTION                                                           8

2                 ELECTRICITY SUPPLY                                                    10
    2.1 Electricity Value Chain                                                         10
    2.2 Comparison with Countries of the Region                                         11
    2.3 Supply Trends                                                                   12
    2.4 Generation Facilities                                                           13
    2.5 Origin of Supply                                                                14
    2.6 Prices Offered by Electricity Producers                                         16
    2.7 Transmission                                                                    17
    2.8 Price Paid by the Distributor                                                   18

3                 ELECTRICITY DEMAND                                                    19
    3.1 Distribution Network                                                            19
    3.2 Access to Electricity                                                           20
    3.3 Geographic Distribution of Electricity                                          21

4                 PRICE OF ELECTRICITY                                                  23
    4.1 Pricing                                                                         23
    4.2 Comparison with Other Countries                                                 24
    4.3 Price Structure                                                                 24
    4.4 Social Tranche                                                                  25
    4.5 Graduated Rates                                                                 26
    4.6 Billing Structure                                                               28
    4.7 Comparing Bills of Twelve Towns of the World                                    31
    4.8 Alternative Cost of Electricity                                                 33

5                 CONCLUSION                                                            36

                  BIBLIOGRAPHY                                                          38

                  LIST OF GRAPHS
    Graph 1       National Electricity Generation and Consumption in Togo (1971-2013)   13
    Graph 2       Origin of Electricity Supplied in Togo (2013)                         15
    Graph 3       Prices Offered by Electricity Producers (Togo – 2013)                 16
    Graph 4       Wholesale Price of Electricity                                        18
    Graph 5       Electricity Consumption by Economic Agent                             21
    Graph 6       Turnover by Economic Agent                                            21
    Graph 7       Distribution of the Number of Subscribers per Economic Agent          21
    Graph 8       Rate in cents/kWh by Graduated Tranche in Togo (2013)                 27
    Graph 9       Comparing Electricity Bills, IT, in Towns across the World            29
    Graph 10      Electricity Bill, August 2014, Schaumburg (Illinois -US)              31
    Graph 11      Electricity Bill, August 2014, Lome (Togo)                            31
    Graph 12      Electricity Bill, August 2014, Princeton (New Jersey - US)            31
    Graph 13      Electricity Bill, August 2014, Bamako (Mali)                          31

                                                                        3
UNDERLYING ISSUE OF ELECTRICITY ACCESS IN TOGO
Graph 14 Electricity Bill, August 2014, Rabat (Morocco) 31
Graph 15 Electricity Bill, August 2014, Bujumbura (Burundi) 31
Graph 16 Electricity Bill, August 2014, Accra (Ghana) 32
Graph 17 Electricity Bill, August 2014, Dakar (Senegal) 32
Graph 18 Electricity Bill, August 2014, Trieste (Italy) 32
Graph 19 Electricity Bill, August 2014, Abuja (Nigeria) 32
Graph 20 Electricity Bill, August 2014, Cotonou (Benin) 32
Graph 21 Electricity Bill, August 2014, Abidjan (Cote d’Ivoire) 32
Graph 22 Loss of Value Attributable to Power Outages (% of Sales) 33
LIST OF TABLES
Tableau 1 Generation Facilities in 2013 14
Tableau 2 Electricity Transmission to Clients 17
Tableau 3 Determining Coverage Charges 23
Tableau 4 Billing the 30 kWh Social Tranche (in CFAF) 25
Tableau 5 Electricity Rate Structures for Clients 26
Tableau 6 Electricity Payments and Consumption per Quintile of
Domestic Subscribers (2013) 27
Tableau 7 Frequency of Power Outages in a Factory in Togo 33
Tableau 8 Share of Electricity in Production Costs in Togo (CFAF Million) 34
4West Africa Department
The African Development Bank’s West Africa Department covers fourteen countries
from Senegal to Benin. Its mission is to conduct dialogue with these countries,
programme activities therein, allocate resources to various sectors of activity and
define country-level and regional lending as well as work programmes. The
Department’s main outputs are Economic and Sector Works, Country Strategies,
Country Portfolio Performance Reviews, Country Economic Reviews. It also
coordinates country portfolio management efforts, contributes to sector analytical
works, supports regional organisations and represents the Bank in countries and
among donors.
The “West Africa Policy Notes” Series
The “West Africa Policy Notes” Series, a component of the West Africa Regional
Department’s knowledge management strategy, addresses the development
challenges posed in the region. The series offers a platform for the Department’s
economists to take part in the Bank’s mission of knowledge dissemination.
This study was conducted by Carpophore Ntagungira (Principal Country Economist
AfDB - ORWA Togo) with the participation of Firmin Bri (Senior Power Engineer, AfDB
-ONEC, Cote d’Ivoire); Bokar Toure (Senior Energy Economist, AfDB - ONEC, Nigeria);
Thierno Bah (Principal Energy Specialist, AfDB - ONEC, Ghana); Robil Nassoma (Power
Engineer, Ministry of Mines and Energy, Togo) and Adje Mensah (Power Engineer,
Princeton, NJ – US). The study was supervised by Emanuele Santi (Chief Regional
Economist, ORWA) under the direction of Janvier K. Litse (Acting Vice-President,
ORVP), Frank J.M. Perrault (Director ORVP) and Serge N’guessan (Resident
Representative, TGFO). The final document was revised by Maxime Weigert
(Consultant, ORWA), Mohamed El Dahshan (Consultant, ORWA), Callixte Kambanda
(Chief Infrastructure Specialist, ICA), Raymond Kitandala (Energy Expert, ONEC) and
Yannis Arvanitis (Principal Country Economist, ORWA). Publishing quality was assured
by Maxime Weigert (Consultant, ORWA) working closely with Yattien-Amiguet L. (Senior
Desktop Publishing Assistant, CERD).UNDERLYING ISSUE OF ELECTRICITY ACCESS IN TOGO
ABBREVIATIONS
ARSE Electricity Sector Regulatory Authority
CEB Electricity Community of Benin (Communauté d’électricité du Bénin)
CEET Togo Electricity Company (Compagnie énergie électrique du Togo)
CIE Ivorian Electricity Company (Compagnie ivoirienne d’électricité)
ECG Electricity Company of Ghana
ECOWAS Economic Community of West African States
GRIDCo Ghana Grid Company Limited
GT Gas Turbine
HV High Voltage
IPP Independent Power Producer
IT Inclusive of Taxes
LV Low Voltage
MV Medium Voltage
REGIDESO National Water and Electricity Production and Marketing Service (Burundi)
SBEE Benin Electricity Company (Société béninoise d’énergie électrique)
SCANTOGO Togo Clinker Production Plant
SCAPE Accelerated, Inclusive Growth and Employment Promotion Strategy
SNPT New Phosphates Company of Togo (Société nouvelle des phosphates du
Togo)
TCN Transmission Company of Nigeria
TFP Technical and Financial Partners
VRA West African Development Bank
WADB West African Economic and Monetary Union
WAEMU West African Cement (Togo)
WACEM West African Gas Pipeline Company
WAPCo West African Power Pool
6UNDERLYING ISSUE OF ELECTRICITY ACCESS IN TOGO
SUMMARY
his study shows that poor households in Togo, which do not have access to electricity,
use more costly sources of energy. The country’s electricity access rate, estimated at
27%, is the consequence of the absence of investment in, and restructuring of, the electricity
value chain, dominated for over 35 years by the public sector.
The generation, transmission, distribution and sale of electricity are neither adequately
segmented to achieve economies of scale nor competitive enough to achieve greater
effectiveness. From 1971 to 2013, electricity consumption increased nine-fold but generation
increased only twofold.
Applying a selling price that is lower than the local production cost, but higher than the price
of imported electricity remains a major challenge to be tackled. A structural, in-depth reform
of the entire electricity value chain, embracing private sector participation, is necessary as it
will help to give a clearer idea of the profitability of the different electricity segments. Such
restructuring will lead to other appropriate measures for large-scale electricity generation
and cost reduction in order to increase the level of access.
7UNDERLYING ISSUE OF ELECTRICITY ACCESS IN TOGO
INTRODUCTION
Ten candles supply one kWh of energy, for a cost of about USD1,
which is five times more than the cost of one kWh of electricity sold in
Togo. The candle has become more expensive but has remained a
source of lighting for poor homes.
T
homas Edison (1847-1931), the pioneer of electricity, had predicted that he
would make electricity so cheap that only the rich could afford the luxury of
using candles. For a long time now, candles have, in fact, become more
expensive than electricity. Ten candles supply one kWh of power, at a cost of about USD
1, which is five times the cost of one kWh electricity sold in Togo. Unfortunately, the now-
more-costly candle has remained in poor homes as a source of lighting. Unlike candle,
electricity does not pollute the home and does not consume material that needs to be
constantly renewed.
Specialised statistical directories are silent when it comes to information on
electricity consumption in Sub-Saharan Africa. Poor dissemination of data correlates
with the inability of countries to enable the greatest number to benefit from electricity. It
is more or less known that Togo’s energy sector is characterised by the predominance
of biomass (firewood, charcoal, vegetable waste etc...) which accounts for 71% of final
energy consumption in the country. Petroleum products account for 26% while electricity
meets only 3% of energy needs.1 One person in Togo consumes on average 118 kWh
yearly against 149 kWh in Nigeria, 212 kWh in Cote d’Ivoire, 344 in Ghana and 535 on
average for Sub-Saharan African countries. This figure stands at 7,292 kWh in France and
13,246 kWh in the United States2.
The bulk of Togo’s production comes from recently constructed thermal power
plants and the Nangbeto Hydropower Plant built in 1987. For 35 years, the State
dominated the electricity value chain, but undertook no major investment to boost
production. For that reason, the relative share of imports has risen sharply during the last
20 years, to 74% of the 1,286 GWh supplied in 2013.
For more than 20 years, donors like the African Development Bank (AfDB) and the
World Bank have remained sensitive to the issues of electricity in Togo. But the
many socio-political crises experienced by the country (1990 – 2005) led to an
interruption of international cooperation which did not allow for the construction of other
large generation units. The option adopted in 2010 of building a thermal power plant
within the IPP (Independent Power Producers) framework ran into difficulties due to gas
supply difficulties which increased electricity production costs twofold from USD 0.11 to
USD 0.21 per kWh. Due to the level of demand for electricity, which largely exceeds
supply, people not living in close proximity to the distribution network get connected
1
Intervention of Togo’s Minister of Mines and Energy, Noukopou Dammipi, during the World Energy Forum in Dubai
on 21 October 2013. See site http://www.republicoftogo.com, 22/10/2013.
2 World Bank (2014), Global Development Indicators: Energy and communication, http://donnees.banquemon-
diale.org, and CEET database, 2013 2014.
8UNDERLYING ISSUE OF ELECTRICITY ACCESS IN TOGO
through their duly subscribed neighbours. Behind every duly subscribed household hides
at least one undeclared household. Thus, the country estimates the electricity access
rate at 27.62%, even though those who pay electricity bills represent an access rate of
only 17%.
The country’s low electricity production and coverage rate is attributable to the absence
of investments in and restructuring of the electricity value chain. These issues of electricity
generation, rates, access and their consequences are analysed in greater detail in the
body of this document.
9UNDERLYING ISSUE OF ELECTRICITY ACCESS IN TOGO
ELECTRICITY SUPPLY
CEB and CEET, two cash-strapped State-owned companies, are
involved in the entire electricity value chain.
2.1 | Electricity Value Chain
T
he electricity bill that consumers in Togo receive is the last link in the chain that
connects enterprises of four distinct segments: (1) generation; (2) transmission;
(3) distribution; and (4) sale. In many countries, these specialised segments are
entrusted to separate enterprises for greater effectiveness. However, others, like Togo,
have kept them under State authority.
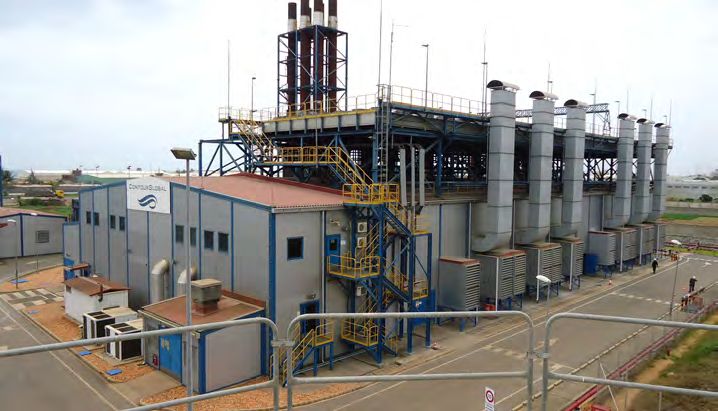
The electricity consumed in Togo is first produced by three locally registered
enterprises: CEB3 and CEET4, belonging to the State; and ContourGlobal, a Togo-
based US company under special contract with the State5. Supplementary electrical
power comes from four enterprises based abroad: VRA (Ghana); CIE (Cote d’Ivoire); TCN
(Nigeria) and NIGELEC (Niger). CEB has a monopoly in power transmission and purchase
in Togo and Benin. The corporate diagram depicting the electricity value chain in Togo is
presented below.
Enterprises in the Electricity Value Chain in Togo
Supply
Production Transmission Distribution
Sell
Togo
Niger Nigeria Cote d'Ivoire Ghana
Secteur informel
3
The Electricity Community of Benin (CEB) is a public establishment created by the Daho-Togolese International
Electricity Agreement of 27 July 1968, as amended by Act No. 2006-005 of 3 July 2006 instituting the Benin-Togo
Electricity Code, which defines the legal, regulatory and technical framework governing electricity value chain acti-
vities.
4
Ordinance No.63 – 12 of 20 March 1963, establishing the Togo Electricity Company (CEET) for the generation,
transmission and distribution of electrical power in Togo. At inception of CEB in 1968, the activities of CEET were
redefined to focus on the distribution of electrical power in Togo.
5
The process of procuring a thermal power plant started in October 2006 with the signing of a 25-year concession
agreement between Togo and ContourGlobal Togo SA. This was followed by a power purchase agreement conclu-
ded with CEET on 5 June 2007. Financial papers were signed on 6 May 2009, thereby rendering effective the
concession agreement and the power purchase contract. The Plant activities started on 15 October 2010. The
100MW thermal power plant has an annual capacity of 780 GWh. These agreements culminated in a Take-or-Pay
contract; in other words, even without consuming, CEET pays ContourGlobal a fixed annual amount for a duration
of 25 years.
10UNDERLYING ISSUE OF ELECTRICITY ACCESS IN TOGO
Electricity is sold to the consumer mainly by two companies in Togo: CEB and
CEET. The Togolese electricity market is not yet liberalised to allow wholesalers and
consumers the free choice of their own power suppliers. CEB and CEET are State-owned
companies operating in the entire electricity value chain. CEB is a producer, transmitter
and supplier of electricity. Although its official role is limited to power generation and
transmission, CEB sells electricity to three big industries in Togo: WACEM; SNPT; and
SCANTOGO.
The Togolese authorities recognise that electricity companies, like many other
public commercial utilities (transport, telecommunication, energy) should align
themselves on the ongoing reform trends consisting in introducing competition in
sectors of activity where monopoly has traditionally held sway. These reforms are based
on the principle that a competitive enterprise will easily find capital on the market, spurred
by its performance in terms of productivity, creativity and dedication to the customer. In
light of this vision of the competitive enterprise, State monopolies are sometimes still
perceived as being inordinate or inadequate investments, a waste of resources with poor
staff incentives and indifference to the customer6.
However, the State must unfailingly ensure that competition is introduced in the
electricity sector without damage, and herein lies the dilemma for most public
decision-makers. The challenge for the Togolese State in the short and medium-term
is to define appropriate terms and conditions for competition among electricity producers
who are expected to sell to competing wholesale dealers, through transmission and
distribution networks that are not completely governed by market forces.
Togo can draw lessons from reforms undertaken in Ghana, Cote
d’Ivoire and Nigeria to successfully introduce competition in its
electricity sector without wreaking havoc.
2.2 | Comparison with Countries of the Region
In Nigeria, the 2005 Electric Power Sector Reforms Act7 put an end to the National
Electric Power Authority’s monopoly. From 2005 to 2014, this public company,
charged with electricity supply, was segmented into six electricity generation companies
and eleven distribution companies, which were later sold individually to private investors.
For a long time, Ghana’s electricity sector was dominated by one public institution,
the Volta River Authority (VRA), created in 1961. In 2005, VRA was split into several
entities8, with the creation of a transmission company (GRIDCo) and a distribution
company (ECG). So, VRA was left with just the generation segment. This saw the
emergence of independent producers who sell their power production directly to ECG.
6
Marcel Boiteux (2014), l’électricité entre monopole et compétition, (Electricity: Between Monopoly and Competition),
Académie des sciences morales et politiques, June 2004, p. 5.
7 Nigeria, Electric Power Sector Reforms Act, 2005.
11UNDERLYING ISSUE OF ELECTRICITY ACCESS IN TOGO
The legal status of ECG also changed from a State company to a private enterprise in
order to open the distribution sector to competition.
In the case of Côte d’Ivoire, the national electricity company (Société énergie
électrique de Côte d’Ivoire - EECI) created by the State in 1952 was able, for four
decades, to supply the bulk of electricity consumed. The Act of 29 July 1985 opened
the generation segment to private operators. The sector was restructured in the 1990s,
which allowed for the creation of the Ivorian Electricity Company (Compagnie ivoirienne
d’électricité - CIE), 85% of whose shares is held by the private sector and it is tasked with
ensuring the generation, transmission and distribution of electricity. Subsequent reforms
facilitated the influx of independent power producers (IPP), especially with gas-powered
thermal power plants. In 2013, these private enterprises produced 54% of the electric
power consumed in Cote d’Ivoire9. Togo can draw lessons from the reforms already
undertaken in these three ECOWAS countries (Ghana, Cote d’Ivoire and Nigeria) to further
build on the introduction of market forces into the electricity sector.
2.3 | Supply Trends
The history of electricity in Togo really began in 1926 with the construction of a
350 kVA plant. Following the creation of CEET in 1963, electricity consumption attained
140 million kWh in 1971. Generation facilities consisted exclusively of generators until
when an electricity-generation enterprise (CEB) was created in 1968. It took 20 years of
existence of CEB to construct the Nangbeto 65-MW hydropower plant in 1987. Ever
since, national electricity production has not been commensurate with local demand
which has grown very rapidly. Electric power consumption has grown unevenly,
exceeding 300 GWh in 1990, 500 GWh in 1999 and 1,000 GWh in 2012.
From 1971 to 2013, local electricity generation increased twofold
while consumption rose nine-fold.
From 1995, electricity consumption in the country grew by 5% yearly as opposed
to the national production level which fell significantly by 6% yearly. From 1971 to
2013 (Graph 1), national electricity production grew at an average annual rate of 2%, far
lower than consumption which grew by around 5% yearly. Over a period of 43 years,
national power generation increased twofold but consumption rose nine-fold, leading to
the country’s heavy dependence on imported electricity.
8Ghana, Volta River Development (Amendment) Act, 2005.
9Amidou Traoré (2013), Private Electricity Production: the Ivorian Model, in Secteur Privé & Développement, www.pro-
parco.fr, p. 7.
12UNDERLYING ISSUE OF ELECTRICITY ACCESS IN TOGO
Graph 1 National Electricity Generation and Consumption in Togo (1971-2013)
Consumption (GWh)
Local Production (GWh)
Source : CEET Database and
http://perspective.usherbrooke.ca/bilan/tend/TGO
Due to the failings of CEB, the electricity producer, CEET, the
distributor, acquired its own means of production.
2.4 | Generation Facilities
Originally, the national electricity generation facilities (Table 1) comprised just the Nangbeto
hydropower plant, which dates back to 1987, and whose production was unstable. From
a good rainy season to a bad dry season, the Nangbeto hydropower plant’s output can
fluctuate from 65 MW to 10 MW. Between 1990 and 2010, the country gradually
procured 7 thermal power plants with firm power of 10 MW. In 2010, the US company,
ContourGlobal, installed a 100-MW thermal power plant which has six Wärtsilä 50-DF
engines that can be fired by natural gas, diesel and heavy fuels.
All the generation facilities of CEB – the historic State-owned producer – guarantee only
70MW of firm power. In the face of the failings of the designated power producer, CEB,
the distributor, CEET, acquired more generation facilities which guarantee 100 MW of
electricity. External suppliers guarantee a firm power of 175 MW10, which raises the
country’s total to 275 MW.
10 In 2013, CEB (Togo and Benin) guaranteed 372 MW for the two member countries: 47% for Togo, or 175 MW.
13UNDERLYING ISSUE OF ELECTRICITY ACCESS IN TOGO
table 1 Generation Facilities in 2013 : Power (MW)
Installed Available Firm
CEET POWER PLANTS TOGO 128 100
Lome A Thermal Power Plant (Sulzer) Diesel 2X8 7 10
Lome B Thermal Power Plant (CTL site) Diesel 1X14 14
Kara Thermal Power Plant, Diesel 16 4
Sokode Thermal Power Plant, Diesel 4 1.5
Kpime Plant, Turbine 2 X 0.78 1.5
ContourGlobal Thermal Power Plant, Engine 6 X 16.6 100 90
CEB SOURCES (TOGO AND BENIN) 407 372
Imported TCN (Nigeria) - 200 200
Imported VRA (Ghana) & CIE (Cote d'Ivoire) - 102 102
Lome Thermal Power Plant TAGS 2 X 25 40 40
Nangbeto Power Plant (Hydro) 2 X 32.8 65 30
S/total CEB dedicated to Togo (47%) - 191 175
TOTAL POWER
Source PLANTS
: Base de AND
données CEBetTOGO
CEET enquête étude 2014. 329 275
Togo benefited from a WAEMU grant to implement the Regional Renewable Energy
Development and Energy Efficiency Programme (PRODERE) which made it
possible to electrify 22 localities using solar photovoltaic kits. The total installed
power of 252.6 kW is mainly used for the electrification of social infrastructure: schools,
dispensaries and drinking-water-pumping equipment in rural areas.
The 5.7 kW installed wind power is used for pumping drinking water in rural areas,
precisely at Atalote (Keran Prefecture) by reverend sisters.
Independent producers are essentially big industries like the New Phosphates
Company of Togo (Société Nouvelle des Phosphate du Togo - SNPT), the New
Oilseeds Industry of Togo (Nouvelle Industrie des Oléagineux du Togo - NIOTO),
WACEM and some hotels. Their production was estimated at about 4.6 GWh in 2013.
2.5 | Origin of Supply
In 2003, the ECOWAS Member States signed an Energy Protocol A/P4/1/03 which
allowed for the creation of a regional market giving third-party access to the
national electricity grid. Since 2008, faced with the steadily growing gap between
supply and demand, CEB became a net importer of energy from neighbouring countries
(Ghana, Niger, Nigeria and Cote d’Ivoire). It is within this partnership framework that out
of 1,286 GWh consumed in Togo in 2013, imports accounted for 74%. Electricity imports
are mainly from Ghana’s Volta River Authority (VRA) since 1997, the Ivorian Electricity
Company (CIE) since 1995, the Transmission Company of Nigeria (TCN) since 2007 and
NIGELEC (Niger) since 2003.
14UNDERLYING ISSUE OF ELECTRICITY ACCESS IN TOGO
Imports account for 74% of the 1,286 GWh of electricity consumed in
Togo in 2013.
CEB’s production for Togo in 2013 represented only 6.2% of the total electric power
consumed (Graph 2). This company had been created in 1968 to ensure the generation
and transmission of electric power in Togo and Benin. Since 1988, Togo and Benin put
in place an investment programme that was to enable them achieve electricity self-
sufficiency by 2003. The attainment of this objective was contingent upon implementation
of the Adjarala and Kétou hydro-power developments as of 1995, the pre-feasibility
studies of which date back to 1984.
Efforts to mobilize resources from the traditional institutions (WB, AfDB, IsDB,
WADB, BADEA, etc.) and at regional level (WAEMU, ECOWAS) yielded no fruit. The
Adjarala hydropower development is currently under serious negotiation with Chinese
Cooperation agencies.
In 2003, the electricity shortage and CEB’s inability to invest11 prompted Togo and
Benin to interrupt its production monopoly in order to attract IPPs. It is in this
framework that in 2008, a private company, ContourGlobal12 signed a 25-year Agreement
with the State of Togo to produce electricity. In 2013, this company’s market share in the
production of electricity consumed in Togo was 13.7%.
Graph 2 Origin of Electricity Supplied in Togo (2013)
.
.
. Electricity Supplied (2013)
.
.
.
.
.
Source: CEET and 2014 exploratory survey
11 CEB cannot cope with heavy investments with long amortisation periods due to its financial deficit resulting from
outstanding payments to its clients, including distribution companies in Togo and Benin.
12 It will be recalled that ContourGlobal started its activities in Togo in 2010 with a capacity of 100 MW. This involves
an investment project of USD 192.4 million.
15UNDERLYING ISSUE OF ELECTRICITY ACCESS IN TOGO
Over time, electricity supply in Togo became not only dependent on external
sources but also unstable, fluctuating widely depending on climate and the producing
countries’ energy needs. During electoral periods and times of broadcast of widely-
viewed sports events in Ghana and Nigeria, the quantities of electricity supplied to Togo
would automatically diminish. Togo’s heavy dependence on foreign countries for electricity
stems from its limited capacity to invest in energy production.
2.6 | Prices Offered by Electricity Producers
The prices offered by the region’s electricity producers often vary and are set
differently depending on the companies concerned (Graph 3). The generation cost
of ContourGlobal, which is an IPP, is determined jointly by the producer (ContourGlobal)
and the distributor, CEET, taking into account that the State, represented by the buyer
(CEET), pays for fuel to operate the thermal plant.
Since the creation of ContourGlobal, the State has been experiencing an external
shock: Nigeria has not been supplying gas via the West Africa Gas Pipeline
(WAGP)13 as had been initially planned. Due to the lack of gas, ContourGlobal operated
its thermal plant with light crude which cost three times more than gas and raised
production costs.
Under its 25-year concession agreement, ContourGlobal was expected, as from
2010, to supply electricity at an average price of 14 US cents/kWh, or CFAF
60/kWh. It had already been envisaged that this price would exceed the average price
of the combination of imported and locally-produced electricity, which was 13 US cents
(CFAF 55/kWh).
Graph 3 Electricity Producer’s Price (Togo – 2013)
Rate: USD1 = CFAF 511
.
.
Cents $/kWh
.
.
.
.
Source: CEET and 2014 exploratory survey
16UNDERLYING ISSUE OF ELECTRICITY ACCESS IN TOGO
The State undertook to subsidise this USD 1 cent/kWh gap in the short term. But,
the observation in the short- and medium-terms, is that this gap has grown wider since
production costs rose to 21.92 US cents/kWh instead of 14 cents/kWh as initially
estimated by the project.
The two local producers’ (CEB’s and ContourGlobal’s) operating costs are too high
to be competitive. The cost of electricity supplied by foreign companies varies
depending on supply and demand. In due course, Ghana and Nigeria put in place
arrangements to facilitate price liberalisation and indexing. It is noteworthy that it is private
enterprises in Ghana and Nigeria that negotiate quantities and prices with the public
institutions of Togo. In 2013, the prices offered by Ghana to Togo ranged from 6.7 to 7.6
cents/kWh and those of Nigeria from 3.9 to 5.4 cents/kWh.
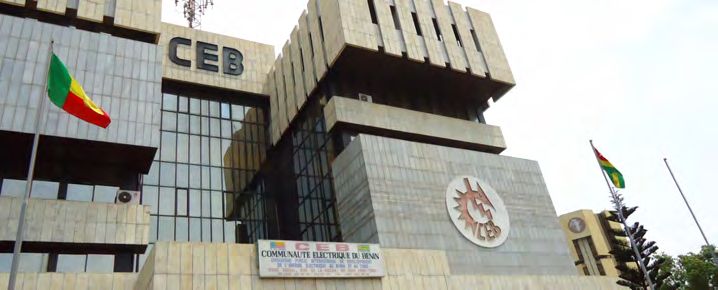
2.7 | Transmission
Electricity transmission on the national territory is handled by the Electricity
Community of Benin (Communauté Electrique du Bénin- CEB), a State-owned
company whose capital is held by the Governments of Benin and Togo. The
agreement of both States was revised with regard to CEB’s mandate and monopoly
on electricity transmission. Today, CEB’s transmission network comprises lines of 330
kV; 161 kV; 63 kV and 20 kV spread across the territories of Togo and Benin. There
are 18 sub-stations associated with these transmission lines, of which 3 are being
reinforced and 3 others are in the project pipeline. The capacity of sub-stations
installed in Togo is 367.17 MVA. CEB has always found it difficult to develop its
investment programme for power transmission since its financial resources come
exclusively from Member States.
CEB transmits electricity to the authorised distributor, CEET, and towards two
production plants (Table 2). Aging electricity transmission and distribution
installations and the supply system in place cause losses estimated at 20% of
electricity supply.
table 2 electricity transmission in togo (MWh)
Recipients 2008 2012 2013 %
CEET 609,621 886,413 892,069 86%
WACEM 106,116 103,606 91,771 9%
SNPT 39,336 51,663 53,531 5%
Total 755,073 1,041,682 1,037,371 100%
Source: CEB, Ministry of Mines and Energy
17UNDERLYING ISSUE OF ELECTRICITY ACCESS IN TOGO
Selling electricity at a price that is lower than the average unit cost of
production is a major constraint for Togo.
2.8 | Price Paid by the Distributor
CEB whose prerogatives include electricity generation and transmission has two
categories of clients – one national distributor (CEET) and three large enterprises
(WACEM, SCANTOGO and SNPT). The prices paid by the national distributor and these
enterprises are not the same (Graph 4). Included in the prices are costs linked to: (a) the
generation and importation of electricity; (b) its transmission; and (c) all other management
costs. Pursuant to the 1968 Agreement between Togo and Benin, CEB’s prices are
approved by a High State Council upon proposal of a High Authority. In a certain sense,
these two institutions constitute the General Assembly and Board of Directors,
respectively, of CEB’s shareholders, which are the States of Togo and Benin13.
Since 1994, prices have been modified only four times (1994, 2001, 2012 and 2013).
Over the last 20 years, several price-change proposals made to the State Council have
fallen through. Important decisions concerning rate setting and major investment projects,
in particular, are taken at the level of the Council of Ministers. Selling electricity at a price
that is lower than the average unit cost of production is a major constraint for Togo in the
governance of the electricity value chain.
Graph 4 Wholesale Price of Electricity
Selling price to enterprises
Selling price to CEET
Source: CEET and 2014 exploratory survey
13 The High State Council is chaired by the Minister in charge of Energy. It is composed of 8 ministers (4 for Togo and
4 for Benin) in charge of: (1) Energy, (2) Finance, (3) Foreign Affairs, and (4) Planning. The 8 ministers form the Ge-
neral Assembly of shareholders. Below this Council comes the High Authority of CEB which can be likened to the
Board of Directors. It is composed of 8 senior executives of the above- mentioned ministries, in addition to 2 others
coming from the Ministries in charge of Labour of the two co- contracting countries.
18UNDERLYING ISSUE OF ELECTRICITY ACCESS IN TOGO
ELECTRICITY DEMAND
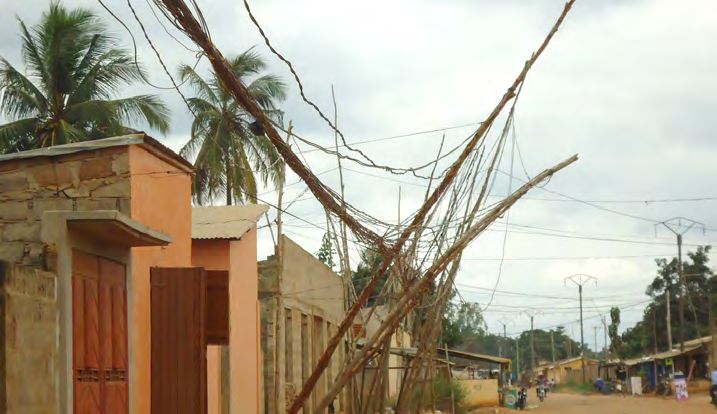
Since the level of demand for electricity far exceeds that of supply,
a phenomenon commonly called “cobweb” has emerged
3.1 | Distribution Network
Electric lines crossing
at almost ground level
in the Zangué ra Canton
(Maritime Region) 07/2015
T
he Togo Electricity Company (Compagnie énergie electrique du Togo –
CEET), responsible for electric power distribution in Togo, operates with
aging installations linked to a 4,000-km low and medium voltage network.
CEET’s distribution network cannot meet the high demand for electricity in the country.
Since the level of demand for electricity far exceeds that of supply, a phenomenon
commonly called “cobwebs” has emerged. It concerns people who (i) do not pay for their
consumption because they are illegally connected to electric lines crossing their area of
residence; or (ii) obtain electricity supply from their legally subscribed neighbour in
exchange for an amount to be paid to that neighbour at the end of every month.
Five years ago, CEET decided to track down the cobweb system but has not yet
been able to do so. The practice continues to claim victims who are electrocuted while
handling live lines. The phenomenon is recurrent in the suburbs of Lome and throughout
the Togolese national territory. Since the demand for electricity connections exceeds
supply, the populations are obliged in some places to weave “cobwebs” along several
roads.
A project financed by WADB (BOAD) and the Government helped to add 34 km to
the medium-voltage network and 378 km to the low-voltage network to serve
40,000 additional subscribers, the ultimate objective being to dismantle these
“cobweb” networks. Unfortunately, just when the project was being completed in 2013,
19UNDERLYING ISSUE OF ELECTRICITY ACCESS IN TOGO
demand had again outstripped the project’s capacity, thus leading to the concurrent
multiplication of disorderly and informal power distribution networks.
The distribution of electric power in Togo registers financial losses estimated at
37%. This is broken down as follows: 20% attributable to technical losses due to the
poor state of the transmission/distribution network and the remaining 17% are
commercial losses caused mainly by subscribers who fail to pay their bills. International
standards place a ceiling of a total of 10% on these two types of losses.
In 2001, electricity distribution was privatised. But after a period of 5 years (2001-
2005) of unsatisfactory performances, it was handed back to the State- owned company
(CEET) in 2006. CEET not only distributes electric power to economic operators within
the country, but also produces electricity on a one-off basis in areas not served by CEB
network.
The electricity access rate of 27.62% is below the West African
average of 40%.
3.2 | Electricity Access
At end-December 2013, CEET had 233,036 electricity subscribers in Togo, 83.1%
of them households. Out of an estimated total of 1.3 million households, 17% have
formally subscribed to CEET services. Official figures estimate this access rate at 27.62%
in 2013 when account is taken of informal connections.
An in-depth analysis of electricity access reveals that poor and rural households
cannot afford the relatively high connection cost (CFAF 120,000). So, it is estimated
that behind every connected household lurks at least one other undeclared household.
In light of the foregoing, it is estimated that the access rate is very close to the published
official figure (27.62%). However, this access rate remains below the Sub-Saharan
average of 35% and the West African average estimated at 40%.
Subscribed enterprises represent 16% of CEET’s clients. Over 90% of them are in
the category of professionals and production units that subscribed for low voltage power
of 13.2 kVA or more. In all, 588 producer enterprises subscribed to the medium voltage
power category, but only 14% of them subscribed to over 500 kVA.
Average electricity consumption per capita per annum in Togo is 118kWh against
149 kWh in Nigeria, 212 kWh in Cote d’Ivoire, 344 in Ghana and 535 for the average
of Sub-Saharan countries. This figure is 7,292 in France and 13,246 kWh in the United
States14. On average, each subscribed household paid USD 375 yearly for its electricity
supply, corresponding to about 59% of GDP per capita (USD 636.44).
14 World Bank (2014), Global Development Indicators: Energy and communication: http://donnees.banquemon-
diale.org, and CEET data (2014).
20UNDERLYING ISSUE OF ELECTRICITY ACCESS IN TOGO
Graph 5 Electricity Consumption Graph 6 Turnover by Economic Agent Graph 7 Distribution of Number of
by Economic Agent Subscribers by Economic Agent
Grap 7 Distribution of Number of Subscrib
Graph 5 Electricity Consumption by
Economic
g Agent
Economic Agent g
Domestic Enterprises Domestic Enterprises Enterprises
Domestic Pub. adm. TFP Domestic Enterprises
Domestic Enterprises Pub. adm. TFP
Pub. adm. TFP Pub. adm. TFP Pub. adm. TFP
2% 2% 1,3% 0,1%
9% 12% 15,6%
39%
41% Turnover Subscribers
Consumption
186 millions $ 233, 036
784 GWh
47% 47%
83,1%
b Adm. : Public Administration ; TFP : Tech l Parte
Pub. Adm.: Public Administration; TFP: Technical and Financial Partners. Source: CEET and 2014 exploratory survey.
3.3 | Geographic Distribution of Electricity
The electrification rate of households in Togo was 27.62% in 2013, against 15% in
2000, equivalent to a 4.8% yearly increase. The electrification rate is 50% in urban
areas and 5% in rural areas. The map of Togo on the following page shows that electric
power consumption diminishes as the distance of the residences from the Atlantic coast
and the capital city Lome increases. This is partly due to the fact that a large part of
industries and the population are established in Lome.
Electricity access remains very difficult for poorer people given the high per-
household connection cost of about 59% of GDP per capita. The consumption
differences by administrative region in Togo are due to geographic, demographic and
industrial factors. Electricity consumption by region reflects rural and urban lifestyles as
well as remoteness from or closeness to the Atlantic Ocean and industrial zones. The
three most rural regions (Savanes, Kara and Central), which are farthest from the Atlantic
Ocean, consume only 9% of the country’s electricity whereas they are home to 36% of
the population.
21UNDERLYING ISSUE OF ELECTRICITY ACCESS IN TOGO
The Maritime region which occupies 10% of the country’s land area
concentrates 42% of the total population and consumes 86% of the
country’s electricity
Electric power consumption by the five
regions in Togo
The Central region which is home to 10% of the population and covers
23% of the national land area is also the least populated and least
connected to the power grid, with a share of 2% of the total consumption
of the country (Map of Togo).
The population is unequally distributed on the territory. People settle
in the most lit parts of the country. The Maritime Region which covers
10% of the land area of the country concentrates 42% of the total
population and consumes 86% of its electric power. More globally, 60%
of the population, who are rural dwellers, consume only 6% of total
electricity in the country.
A 2010 study showed that the alternative cost of electricity is higher
for households without electricity when they use candles, charcoal,
gas or kerosene15. The study also demonstrated that rural dwellers
without electricity spend more on energy than those with electricity, not
considering the negative impact the means they use (candle, charcoal,
gas or kerosene) have on the environment and health.
15 SOFRECO (2010), Conduct of electricity sub-sector strategic study in Togo, p 54 – 56.
22UNDERLYING ISSUE OF ELECTRICITY ACCESS IN TOGO
PRICE OF ELECTRICITY
The average selling price of electricity is CFAF 122/kWh which is lower
than the cost price of CFAF125
4.1 | Pricing
table 3 Determining Cost Coverage
2008 2013
Production and purchases (MWh) 641,100 967,597
Energy sold (MWh) 507,030 783,868
Losses (MWh) 134,070 183,113
% loss 21% 18.93%
Turnover IT (CFAF Million) 48,720 95,277
Selling price, IT (CFAF/kWh) 95.4 121.55
Average purchase price CFAF/kWh 50,0 58.01
Annual costs (CFAF Billion) 49.5 52.7
Generation cost (CFAF/kWh) 97.6 125.3
Cost coverage rate 95.6% 97.0%
Source: CEET database and 2014 exploratory survey
T
he method of electricity price determination in Togo is rigid and not
necessarily adapted to the economic context. Rates are set by inter-ministerial
order, the last of which dates to 26 November 2010. Since 1995, CEET
introduced an annual system whereby the competent authorities consider rate-change
proposals. On average, one rate modification is adopted every four years. The State
offers stabilised prices over several years because it is aware that the domestic client
cannot bear fluctuations in electricity rates. Whenever CEET feels that revenue can no
longer cover costs, it sends a rate-revision proposal to the Minister in charge of Energy.
In turn, the Government seeks the technical opinion of the Electricity Sector Regulatory
Authority (ARSE). When the Government is not in agreement with this proposal, it
implicitly accepts to subsidise the State-owned distribution company’s lost earnings.
CEET’s average kWh (IT) selling price in 2013 was CFAF 122 FCFA against a production
cost (IT) of CFAF 125/kWh and average electricity purchase price of about CFAF 58/kWh
(Table 3).
23UNDERLYING ISSUE OF ELECTRICITY ACCESS IN TOGO
In Togo just as in Burundi, administered electricity prices do not make it
possible to cover operating costs
4.2 | Comparison with Other Countries
Unlike Togo, electricity rates are determined in Ghana depending on several
contextual and structural variables. There are two kinds of adjustments: minor and
major. A minor adjustment, which occurs quarterly, uses an automatic adjustment formula
which takes into consideration such contextual variables as the exchange rate, the inflation
rate and the cost of fuel supply. With regard to major adjustment, each company in the
electricity value chain (VRA for production, GRIDCo for transmission and ECG for
distribution) sends an application for revision to the regulator PURC16 which arbitrates and
approves a rate adjustment as a result.
In Togo and in Burundi, administered electricity prices do not make it possible to
cover operating costs. In these two countries, State enterprises of the electricity value
chain are deep in debt, despite the near-total monopoly they enjoy. Prices offered in
Burundi (14 cents/KWh) are lower than in other East African countries (20 to 27
cents/kWh). In contrast, Togo has one of the highest prices in the WAEMU region (29
cents against 12 to 29 cents/kWh respectively). These imbalances in each of the two
countries cannot be resolved without in- depth restructuring of the electricity value chain.
However, pricing will raise more challenges as the electricity market is opened to
competition. In this context, the productivity level must be optimal so that the minimum rate
of the kWh should remunerate all the factors of production on the electricity value chain.
4.3 | Price Structure
The current electricity rate system is governed by Inter-ministerial Order No. 019
of 2010 setting the selling price of electric power in Togo. This rate system combines
seven criteria17 including: (1) two voltage categories ; (2) eight levels of power; (3) six
types of destination; (4) three periods of the day; (5) five consumption tranches; (6) fifteen
payment rates; and (7) three categories of fees. Electricity bills in the world conform to the
same logic. However, some countries are increasingly undertaking reforms to simplify the
rate structure.
Globally, the rate system applicable to households has two components: one fixed
and the other variable. The fixed component is subdivided into three sets. The first has
to do with the contracted load whose price ranges from CFAF 250 to 1,500. The second
and third, each comprising a lumpsum amount, covers rental of electricty metres and
connection maintenance. The variable component is characterised by the social tranche
and a graduated structure analysed in the following sections.
16 Public Utilities Regulatory Commission (PURC) in Ghana.
17 1) two voltage categories (high and low), 2) eight levels of contracted load from 2.2 to 5,000 kVA; 3) six types of
destination of electricity (domestic, non-domestic, CEET agents, public lighting, free area, CEET pre-payment and
concession); 4) three periods of the day (slack, full and peak); 5) five kWh consumption tranches from 0 to more
that 350 ; 6) fifteen payment rates in CFAF (63, 73, 74, 77, 81, 84, 85, 86, 88, 90, 93, 94, 96, 114, 120); and 7)
three fee categories (connection maintenance, metre rental and wattage fee).
24UNDERLYING ISSUE OF ELECTRICITY ACCESS IN TOGO
In Togo, the complaint of poor clients is not so much to benefit from
the social tranche rate of the kWh as to obtain a reduction of the
amount of fixed charges payable.
4.4 | Social Tranche
The State instituted a social tranche in the pricing system to offer the poor an
opportunity to have access to electricity. The social tranche is not an integral part of
the graduated electricity rate system. It is treated separately and concerns only the small-
consumer category.
The smallest contracted load (CL) on which the social rate is applied in Togo is 2.2
kVA (or 2.2 kW). The 2.2-kVA contracted load corresponds to one installation in small
homes, the sum of whose used wattage does not exceed 2,200 watts (equivalent of 22
100-W bulbs). The kWh price for 2.2kWh CL is slightly lower than for other wattages
when placed within the consumption segment called the “social tranche” from 0 to 40
kWh of consumption. The latter benefits from a special single rate of CFAF 63/kWh.
table 4 Billing the Social tranche of 30 kWh (in CFAF)
HEADING Unit Quantity Unit Price, NT VAT Price
Price (18%) IT
Variable Charges 1,920 2,260
Social Tranche kWh 30 63 1,890 340 2,230
Tranche 1 kWh - 84 - - -
Tranche 2 kWh - 114 - - -
Tranche 3 kWh - 120 - - -
Public Lighting Fee kWh 30 1 30 30
Fixed Charges 1,550 279 1,829
Wattage Fee KVA 2.2 250 550 99 649
Electricity-Metre Rental Lumpsum 1 500 500 90 590
Connection Maintenance Lumpsum 1 500 500 90 590
TOTAL 3,470 4,089
Table 4 reveals that the social tranche client’s financial concern is not so much the
level of the price/kWh consumed as much as the proportion of fixed charges in
the bill paid. A social tranche client who pays CFAF 4,089 for 30 kWh consumed per
month pays 45% of fixed charges in his electricity bill (Table 4). Raising the kWh price to
CFAF 84 instead of CFAF 63/kWh of the social tranche will be more profitable if not
accompanied by the payment of fixed charges (metre rental, connection maintenance
and wattage fee). Raising the price to CFAF 84/kWh for the poorest segments, in lieu
and place of the CFAF 63 rate which is coupled with payment of fixed charges, appears
as a radical increase of the kWh price. However, in reality, the net result would be: a 27%
drop in the bill of the social client consuming 30kWh monthly; a 40% drop for the average
social client consuming 20 kWh; and at least a 61% drop for small clients consuming less
than 10 kWh, based on the bills paid in 2014. The challenges before the country are not
posed in terms of rates, which have to be social, but in terms of economies of scale,
which must foster wide social coverage of electricity.
25UNDERLYING ISSUE OF ELECTRICITY ACCESS IN TOGO
In poor neighbourhoods, several neighbours or families depend informally on the
same metre. Poor and close families subscribe to a common metre and share the same
bill. They are not concerned with rates reserved for the social tranche because their
combined consumption always exceeds the 40 kWh minimum per month. The social
tranche depends on the contracted load which should not be higher than 2.2 kW.
Technically, the tri-phase connections (4 wires) often used for the “cobwebs” that
characterise poor neighbourhoods do not benefit from social tranche because their
contracted load generally exceeds the wattage of 2.2 kVA.
Like most WAEMU countries, Togo’s particularity is that it has a social
tranche ranging from 0 to 40 kWh and 3 graduated tranches.
4.5 | Graduated Pricing System
The graduated pricing system consists in differentiating the price/kWh based on
consumption such that the rate, which is a unit price, increases by fixed tiers
depending on consumption tranches. The more consumption falls within a higher
tranche, the higher the rate/kWh.
About 55% of countries worldwide use graduated electricity pricing (Table 5). On
the European continent, 70% of countries do not use the graduated system. All ECOWAS
member countries, except Niger, apply the graduated pricing system.
table 5 electricity Price Structures for Residential Clients by Continent (2014)
Single Graduated Mixed No Response Total
Africa 10 31 1 12 54
Latin America 1 20 6 27
North America 2 2 4
Asia 3 18 1 22
CIS 6 4 10
Europe 28 11 1 40
Middle East 1 10 1 12
Oceania 1 2 1 4
Total 50 96 6 21 173
% 29% 55% 3% 12% 100%
Source : http://tarification-progressive-de-lenergie.com
Managing the billing system becomes complicated as the number of tranches
increases.
Although these tranches hardly exceed six, Congo holds the record in Africa with eleven
tranches, while Ecuador holds the world record with fourteen.
Like most WAEMU countries, Togo’s particularity is that it has a social tranche of
0 to 40 kWh and 3 graduated tranches: (a) 0 to 200 kWh; (b) 201 to 350 kWh; and
(c) over 350 kWh. In some countries, the rate applied to the last tranche can be up to 11
26UNDERLYING ISSUE OF ELECTRICITY ACCESS IN TOGO
times that of the basic tranche. For Togo, the difference is about twofold from CFAF 63
to CFAF 120/kWh (Graph 8). The global trend today is to gradually reduce the number
of tranches to a total of three as well as the price difference between the first and last
tranche to a factor of three as well.
Graph 8 Price in Cents/kWh by Graduated Tranches in Togo (2013)
Graph 8 Price in Cents/kWh by Graduated Tranches in Togo (2013)
Tranche 3 (Plus de 350 kWh) 23
Tranche 2 (200-350 kWh) 22
Tranche 1 (41-200 kWh) 16
Social tranche (0-40 kWh) 12
0 5 10 15 20 25
Cents $/kWh
Source: Togo – 2010 ministerial decree fixing the electricity rate.
Graduated pricing aims to make electricity more accessible and lift the population
out of poverty. At present, Togo’s problem is not access to gradual pricing but rather
access to electricity, of which over 70% of the population is deprived. The pricing
arrangement in place does not allow for reducing the bills for the poorest quintile of the
population, which is offset by the higher bills paid by the richest quintile. Rather, the cost
of connection which is on average CFAF 120,000 per household should be reduced to
eliminate the “cobweb” phenomenon, mostly in rural areas, and to have more formal
subscribers. Even if the kWh price were to increase, it is important that the cost of
connection remains low.
table 6 Payments and Consumption of electricity by Quintile of Residential
Subscribers (2013)
Absolute terms %
Payments (CFAF) including: 37,368,253,633 100%
• top quintile (20%) 18,664,809,603 50%
• bottom quintile (20%) 1,391,216,237 4%
Consumption (kWh) including: 321,928,209 100%
• top quintile (20%) 147,295,782 46%
• bottom quintile (20%) 11,509,746 4%
Source : CEET database.
27UNDERLYING ISSUE OF ELECTRICITY ACCESS IN TOGO
The graduated arrangement in place makes it possible for the richest not to
consume more electricity than is necessary. Thus, graduated pricing is indirectly a
success as far as the environment is concerned since price elasticity of electricity is both
strong and negative. When the price of electricity increases, the quantity demanded
diminishes significantly. It prompts energy sobriety by the simple fact that as from 201
kWh consumed per month, the rate jumps from CFAF 84 to CFAF 114/kWh, or a 36%
price increase. Similarly, the consumption tranche above 350 kWh per month is billed at
the rate of CFAF 120/kWh instead of CFAF 114/kWh, or a 5% unit increase.
Graduated pricing in Togo will become more effective for the poor when it is
possible to conduct an inventory of households which partner to share the same
electricity bill. By this means, the cobweb system, or quite simply the association of
several poor households for the same metre, will be taken into consideration. For now,
this data has not been collected.
At end-2013, CEET had 233,036 subscribers, 83% of them households, which use
electricity for domestic needs. It is observed that the top quintile, i.e. the one with
households that pay the highest bill, contribute 50% of CEET’s revenue while the bottom
quintile contributes 4% (Table 6). Under such conditions, applying different tranches
cannot generate beneficial effects as envisaged.
Before contemplating price differentiation according to various social categories,
the State should first prioritise investment in order for the greatest number of
Togolese to have access to electricity. Price graduation cannot correct the fact that the
top quintile of households pay and consume at least ten times more electricity than the
bottom quintile. Rather, with it, less money will enter the coffers of CEET since electricity
metres will be tampered with.
4.6 | Billing Structure
The tendency in Togo, like in the rest of the world, is to compare domestic
electricity rates, without taxes and fixed charges. These partial rates do not give a
good indication of the pressure that is placed on household incomes.
After tax, electricity weighs heavier on household budgets in Lome
(29.0 cents/kWh) than in Abuja (8.2 cents/kWh).
Let’s take the example of the bills of twelve households situated in 12 towns across
the globe: Abidjan, Abuja, Accra, Bamako, Bujumbura, Cotonou, Dakar, Lome,
Princeton, Rabat, Schaumburg and Trieste. Each of these households theoretically
consumes 1,000 kWh of electricity per month. We have taken 1,000 kWh as a target so
as to be able to treat all levels of rates applied according to different graduated tiers of
electricity consumption. A residential house of ten 50-W bulbs and 4 air-conditioners
running six hours a day easily consumes 1,000 kWh per month.
28UNDERLYING ISSUE OF ELECTRICITY ACCESS IN TOGO
Graph 9 Comparing Electricity Bills, IT, in Towns of the World
Graph 9 Comparing Electricity Bills, IT, in Towns of the World
Abuja(NGA) 8.2
Trieste(ITA) 11.2
Cents $/kWh
Rabat(MAR) 11.4
Illinois(USA) 11.6
Abidjan(CIV) 12.6
Bujumbura(BDI) 14.1
Princeton(USA) 18.8
Accra(GHA) 19.2
Dakar(SEN) 26.9
Lomé(TGO) 29
Bamako(MLI) 29.4
Cotonou (BEN) 29.9
0 10 20 30 40
Source : Processing of residents’ bills and city rates.
The bills considered in our sample show that the kWh price, inclusive of taxes,
ranges from simple to more than triple from one town to another (Graph 9).
Electricity takes up a larger share of household budgets in Cotonou (29.9 US cent/kWh),
Lome (29.0 US cent), Bamako (29.4 US cent) and Dakar (26.9 US cent).
Electricity bills across the world have three major components. The first component
is the quantity of electricity really consumed, the second deals with the electricity
conveyance cost and the third and last specifies the different taxes. Togo has designed
a model electricity supply bill which is sub-divided into three parts: charges, consumption
and taxes. This three-part organisation is almost similar in all countries but the appellation
differs from one country to another.
The first component of the electricity bill comes from the rate of the energy
effectively consumed and expressed in kWh. As an example, a 100-W bulb lit for ten
hours will have consumed 1000 Wh, equivalent to 1 kWh, which is the unit of
measurement of the electricity rate. In our example, this component represents 78% of
the total domestic electricity bill in Togo. With 23 cents per kWh for the last tranche, the
rate applied in Lome for residents is one of the highest.
29UNDERLYING ISSUE OF ELECTRICITY ACCESS IN TOGO
The relative share of taxes in the price of electricity is 5% in Abuja and
15% in Lome.
The maximum rate per kWh for households is also among the most expensive in Cotonou
and Dakar (22 US cents) as well as Bamako (25 US cents). The four towns with the
cheapest electricity rates in our sample are Schaumburg and Abuja (7 US cents), Trieste
(8 US cents) and Rabat (9 US cents). Furthermore, as Graphs 10 to 12 below show, a
cheap unit rate in a country does not necessarily mean that its relative share in the overall
price is less high.
The second component deals with charges and covers all costs incurred upstream
and linked to the supply of electricity as well as monthly service amortization and
contracted loads. Togo’s billing structure features three charges. The first concerns the
contracted load, the second relates to connection maintenance and the third is for metre
rental. These amounts are generally fixed but, like in Italy and elsewhere, they may also
be variable amounts related to the voltage or kWh. The proportion of these charges in the
overall bill varies from country to country and also depends on the distribution companies.
Naturally, the share of these charges is much higher in the small consumers’ bill. For our
example of 1,000 kWh of monthly consumption, it varies widely from 1 to 39% of the total
amount of the bill. The proportion increases in countries where electricity supply costs are
relatively higher than the consumption of power itself. With 9% of the overall bill, Togo is
among countries which have the smallest share in our sample.
Headquarters of
CEB in Lome
In the price of electricity paid, there is also a component related to taxes and other
contributions. The latter cover many areas depending on the country. These include
taxes for rural electrification, environmental protection, stabilisation and VAT. In our
sample, the relative share of taxes in the price of domestic electricity is lowest in Princeton
(4%) and Abuja (5%) as well as in Bujumbura where no VAT is levied on electricity. Taxes
represent a significant portion of the final price of domestic electricity in Italy (26%) and
Cote d’Ivoire (21%). Togo finds itself at the intermediate level with 15%. In Denmark,
which is not part of our sample, over half of the price paid by consumers of domestic
electricity serves to cover taxes.
30You can also read