Vietnam's EVN Faces the Future: Time to Get Renewables Right - Ieefa
←
→
Page content transcription
If your browser does not render page correctly, please read the page content below
Melissa Brown, Director Energy Finance Studies, Asia                                    1
Thu Vu, Energy Finance Analyst
September 2020

Vietnam’s EVN Faces the Future:
Time to Get Renewables Right
The Key to Success for PDP 8 Will Be Investment
in New Renewables Technology and the Grid
Executive Summary
Vietnam has previewed its power development plans for the next decade, featuring
a well-timed move away from over-reliance on inflexible coal-burning independent
power projects (IPPs) and a pivot toward renewables and LNG.

IEEFA has analyzed Electricity of Vietnam’s (EVN) financial outlook to understand
how the company can manage the dual challenges of meeting its growing fixed
payment obligations to independent power producers (IPP) and realizing the goals
laid out in the country’s latest power development plan, PDP 8.

Given EVN’s constrained financial position, the key will lie in embracing flexibility
and avoiding lock-in — a scenario where the build-up of high-cost fixed IPP
obligations is so rapid it prevents Vietnam’s from implementing the cost-effective
power market innovations that will certainly emerge over the next five years.

The most dynamic aspect of the PDP
pathway will rest on the ability of EVN
and the Ministry of Industry and Trade
(MOIT) to optimize renewables—the
best options for obtaining new sources of           EVN has a unique
financing and a rapid pathway to low-             opportunity to attract
cost capacity. With the right policies to          competitively priced
support market development, EVN has a
unique opportunity to attract
                                                 investment in the most
competitively priced investment in the          cost-effective renewables.
most cost-effective renewables
technologies and much-needed grid
infrastructure.

Critical questions remain over EVN’s ability to win support for tariff increases and
to find a cost-effective way to scale liquefied natural gas (LNG). Implementation
risks may be higher than some analysts expect due to global market instability and
geopolitical cross currents.

Vietnam’s power industry will be widely scrutinized this year as policymakers
decide on the sector’s size and structure for the next decade. The policy choice in
favor of a transition to clean, renewable energy is clear. The Power Development
Master Plan for 2021-2030 with a vision to 2045 (PDP 8) will elaborate on the
parameters of this transition, establishing the exact room for growth for each
Vietnam’s EVN Faces the Future:
Time To Get Renewables Right 2
energy type, the accompanying infrastructure, and the role to be played by different
market actors.
EVN will be at the center of this decision-making process, with the state utility
group’s operational and financial capacities not only influencing the shape of PDP 8,
but also determining how policies will be implemented.
For the past decade, the Vietnamese government, led by the MOIT and EVN, has
been in a race to expand capacity. Electricity consumption has grown by an
aggressive 10% annually and the system has been under pressure to keep pace with
the economy’s rising growth potential. Between 2015 and year-end 2019 alone,
Vietnam’s installed power capacity grew by 42.3% to 54.9 GW while GDP grew
30.0%.
This pressure for rapid capacity build-up has triggered significant changes in
market structure. EVN is financially constrained by limited sources of domestic
funding and lacks direct access to international capital markets for low-cost
financing. EVN has, therefore, had to rely on international developers with access to
low-cost capital to finance power generation, retaining full control only in
transmission and distribution activities, at least for now. Over the past five years,
EVN’s own generation capacity shrank from 61% to 52% of the total system, a ratio
we expect to fall even more rapidly in coming years.
Table 1: Vietnam Power Sector
2015 2016 2017 2018 2019
Year-end installed capacity (MW) 38,553 42,135 45,400 48,563 54,880
EVN (MW) 23,580 25,884 27,065 28,159 28,769
EVN (%) 61.2% 61.4% 59.6% 58.0% 52.4%
Total system output (kWh million) 159,678 177,234 192,914 212,895 230,774
CAGR (%) 9.6%
Total sales (kWh million) 143,682 159,793 174,653 192,360 209,768
CAGR (%) 9.9%
Source: EVN, IEEFA estimates.
EVN’s reliance on foreign-funded coal IPPs to provide baseload capacity has now
resulted in the same financial and environmental problems that have undermined
the growth of coal globally. Project development in Vietnam has slowed
dramatically because of community push-back, opaque deal structures, and growing
awareness of the risk of lock-in due to inflexible capacity payment structures. These
issues have encouraged MOIT to develop incentives for the adoption of renewable
energy.
In 2017, MOIT turned to renewable energy to quickly fill the gap left by unrealized
fossil power plants and was proven right. Vietnam’s energy mix now has 5.1 GW of
solar power, with the government intent on replicating this success in the future.
These shifts in the market’s ownership structure and generation mix will have a
highly material impact on EVN’s financial health and future planning of the system.Vietnam’s EVN Faces the Future:
Time To Get Renewables Right 3
The state utility needs to anticipate the rapid build-up of guaranteed IPP obligations.
This fixed cost structure is challenging to manage when revenues are reliant on
politically sensitive tariffs that are more resistant to adjustments. At the same time,
EVN also needs to prioritize a system infrastructure upgrade to manage load more
efficiently and help optimize a new energy portfolio consisting of variable
renewable energy sources. The latter has been a pain point in the past year.
Building on the last decade’s growth trajectory, the preliminary draft of PDP 8
published by MOIT in July put forward an aggressive capacity expansion plan for
Vietnam’s power system. Total installed capacity is set to more than double to
138GW in 2030 and reach 222GW in 2040.
Unlike previous plans, however, the
expansion will be driven primarily by
new solar and wind energy projects and
gas-fired power plants. These sources
combined will make up 47% of the
EVN’s fixed cost structure
system in 2030, rising to 60% in 2040. is challenging to manage
Acknowledging the many problems when revenues are reliant
with coal IPPs, PDP 8 cancels and
on tariff increases.
postpones until after 2030 up to 17GW
of coal-fired capacity, or nearly half of
the pipeline.
PDP 8 is a step change for EVN. Such ambition will naturally call for new policies.
Luckily, the Vietnam market’s demand growth potential is well understood by
potential partners, thanks to Vietnam’s strong track record of attracting investment
in new supply chain manufacturing capacity and positive trends in the domestic
consumer market.
Less clear is how much of this proposed growth can be funded directly by EVN and
its ratepayers, and how much will be financed indirectly by IPPs and other funding
partners. Setting realistic tariff and funding expectations will be crucial for both
analysts and investors who want to understand EVN’s capacity to implement
ambitious new system development plans.Vietnam’s EVN Faces the Future:
Time To Get Renewables Right 4
EVN Today – A Financial Scorecard
Table 2: EVN Consolidated Income
VND million 2015 2016 2017 2018 2019
Net sales 240,733,913 272,702,522 294,846,997 338,500,266 394,889,987
Cost of sales (204,486,242) (233,671,119) (250,742,125) (285,341,478) (343,852,003)
Gross profit 36,247,671 39,031,403 44,104,872 53,158,788 51,037,984
Financial expenses (net) (17,456,063) (18,083,814) (18,435,078) (25,391,488) (18,522,849)
Profit sharing from JVs, associates 311,515 427,465 699,186 569,873 498,392
Selling expenses (5,237,475) (5,989,331) (6,525,795) (6,711,690) (7,134,349)
General and administration expenses (9,440,747) (10,535,903) (12,068,204) (13,301,134) (13,635,568)
Net operating profit 4,424,901 4,849,821 7,774,981 8,324,349 12,243,610
Net accounting profit before tax 4,595,181 5,164,742 8,144,629 9,076,043 12,499,984
Net profit after tax 3,699,242 4,431,569 6,593,474 6,817,761 9,720,033
Margins
Gross margin 15.1% 14.3% 15.0% 15.7% 12.9%
Net operating margin 1.8% 1.8% 2.6% 2.5% 3.1%
Net profit margin 1.5% 1.6% 2.2% 2.0% 2.5%
% of total sales
Cost of sales 84.9% 85.7% 85.0% 84.3% 87.1%
Materials 21.0% 23.0%
Amortization and depreciation 21.0% 23.0%
Outside purchasing services (IPPs) 33.4% 39.9%
Financing costs 8.1% 8.2% 7.5% 8.6% 5.7%
Source: EVN. Note: cost of sales details available only for 2018 and 2019.
Because EVN is Vietnam’s monopoly power system operator, it is important to
understand the company’s financial performance between 2015-2019 to assess its
financial capacity and ability to drive the power sector growth strategy envisioned
by PDP 8. With 2019 net sales of VND 394.9 billion (USD 16.9 billion)1, EVN is a
modestly profitable entity, having managed so far to cover operational and financial
costs with mild tariff increases. Net sales growth has been robust with a compound
annual growth rate (CAGR) of 13.2% in 2015 to 2019, supported by healthy
underlying unit sales growth of 9.9% and effective tariff increases totaling 14.4%
during the period.
Over that time, notably in 2019, EVN saw a sharp erosion of its gross margin
reflecting a rise in generation costs as new high cost coal-fired IPPs began to re-
shape EVN’s financial performance. This resulted in a 2.8 percentage point drop in
the gross margin that will likely continue as more IPP capacity with fixed capacity
payments comes online. The hit to EVN’s net margin was offset by tariff increases
totaling 12.6% that took effect in 2018 and 2019. The shift to greater reliance on
IPPs for new capacity was also a factor in the decline in financing costs in 2019,
which provided a small cushion for the operating margin as well.
While weak net margins are not unusual in the Asian power utility sector, they are a
1 Exchange rate 1 USD = 23,361 VND. This exchange rate is used throughout this report.Vietnam’s EVN Faces the Future: Time To Get Renewables Right 5 reminder of the trade-offs typically faced by the power companies in energy growth markets. Vietnam has a good track record relative to its South and South East Asian peers with electrification having already reached 100%.2 Nonetheless, maintaining profitability and positive cash flow in order to meet credit market norms for eventual bond issuance has EVN walking on a tightrope. If EVN cannot add capacity fast enough, economic growth may not meet its potential, but EVN also has little margin for error if its investment in long-lived power assets fails to produce a cost- effective solution for future power needs. Tariff Capacity. Over the past five years, EVN’s average effective tariffs rose 15.0% to VND 1,876 per kWh (USD 0.08 per kWh) to help offset higher financial and operating expenses. This is a meaningful accomplishment because the capacity to raise tariffs is a critical metric in any rating agency’s evaluation of a power company’s creditworthiness. EVN’s tariff adjustments are largely administered by the state, with MOIT having veto power over price increases between 5-10%, and the Prime Minister responsible for approving increases of more than 10%. Since 2015, official tariff levels have been raised only three times, in March 2015, December 2017, and March 2019. EVN’s recent tariff increases have been critical to the company’s sustained record of profitability. Two successive increases of effective tariffs totaling 12.6% in 2018 and 2019 boosted total revenues by VND 59.4 trillion (USD 2.5 EVN’s recent tariff billion)—an amount that was critical to increases have been critical sustaining EVN’s profitability, positive to the company’s sustained cash flow, and debt coverage ratios. This makes assumptions about EVN’s record of profitability. tariff profile particularly important to future expectations concerning EVN’s growth profile and near-term risks from the COVID-19 slowdown. Capex Growth. EVN’s capex peaked in 2016 at VND 127.3 trillion (USD 5.5 billion) before falling 61.2% in 2019. This dramatic shift in capital spending reflects a series of policy decisions taken since 2004 to reposition EVN away from being a traditional vertically integrated power company to be the market operator.3 Future development of new generation capacity has been shifted to developers via IPPs and two state-owned entities — the Vietnam Oil and Gas Group (PetroVietnam) and Vietnam Coal and Mining Group (Vinacomin). EVN also has three generating companies (gencos) that have been identified as spin-off targets. From a financial perspective, policy decisions taken over the past decade should mean that EVN’s future capex burden will reflect its role as the system operator with responsibility for system-level grid operations and development. For this reason, 2World Bank. Sustainable Energy for All Database. 3World Bank. Learning from Power Sector Reform Experiences – The Case of Vietnam. March 2020
Vietnam’s EVN Faces the Future:
Time To Get Renewables Right                                                               6

given the need for upgraded transmission and distribution infrastructure, the VND
49.4 trillion (USD 2.1 billion) capex made in 2019 should be viewed as a starting
point for estimating EVN’s medium-term capex needs, especially in light of the
growing diversity of the generation mix.

Debt Capacity. EVN’s total debt grew by 8.9% between 2015-2019, to VND495,046
billion (USD 21.2 billion), following the 2016 peak in capex. EVN’s debt growth was
mostly funded indirectly by international sources via government on-lending at
below-market terms.

EVN’s lack of direct access to adequate international funding is a crucial factor in
decisions about its growth strategy. Vietnam can no longer access concessionary
funding for low-income countries from multi-lateral development banks thanks to
its strong growth track record. Nonetheless, Vietnam is not yet rated investment
grade by the credit rating agencies due to structural weaknesses in the banking
sector. The absence of a long-term deposit base restricts the banks’ ability to
provide long-term financing. In addition, Vietnam has limited foreign currency
hedging capacity which leaves EVN exposed to foreign exchange risks.

Taken together, the lack of access to the USD bond market and limited availability of
attractively priced debt at home, EVN has had little choice but to turn to foreign
investors in IPPs. By seeking project sponsors who can access credit enhanced
terms, thanks to export credit agencies, project sponsors have provided the
necessary funding in exchange for development returns and risk mitigation through
long-term power purchase agreements (PPAs).

For EVN, the net effect of this approach is that its limited debt capacity has played an
outsized role in dictating Vietnam’s power development strategy. EVN’s role in
developing generation has been restricted, prompting high reliance on IPPs and
partnerships with international sources of capital. One consequence of this situation
is that rather than raising debt to finance EVN’s own asset base, it now faces the risk
that if tariff increases cannot keep pace, new debt will be needed to help meet the
company’s growing IPP payment obligations.
Vietnam’s EVN Faces the Future:
Time To Get Renewables Right                                                                                       7

Table 3: EVN: Balance and Cash Flow Items
                 VND million                 2015           2016          2017           2018         2019
    Balance sheet items
    Total debt outstanding                 370,152,351 396,591,441 404,444,512 405,077,268 398,750,367
    Financial expenses/debt outstanding            5.3%        5.6%        5.5%        7.2%        5.6%
    Debt/equity (x)                                 2.4         2.4         2.3         2.2         2.2
    Cash flow items
    Capex                                  87,456,028    127,312,625    74,016,256     63,550,735    49,425,195
    Net debt flows (proceeds-repayments)   22,397,267     22,318,727     6,074,313     (8,304,421)   (8,237,439)
    Funds from operations (FFO)            75,695,666     88,220,064    98,416,620    107,650,350    99,331,610
    Cash debt service                      75,424,719     55,929,941    63,636,495     82,943,711    74,180,774
    FFO/cash debt service                          1.0            1.6           1.5            1.3           1.3
    FFO adjusted net leverage x                    4.9            4.5           4.1            3.8           4.0
    Cash and cash equivalents              41,968,868     41,513,150    45,704,037     50,205,261    53,601,031
Source: EVN, IEEFA.

Financial Metrics. EVN’s debt burden is high, with a debt-to-equity ratio averaging
2.3 times, albeit declining. Thanks to strong revenue growth, the company has been
operating cash flow positive and generated net cash in 2017 through 2019.

EVN is currently rated BB stable by Fitch—a sub-investment grade notch in line
with Fitch’s rating for the Vietnam sovereign.4 The company’s standalone credit
profile reflects EVN’s mixed credit fundamentals. Although EVN is profitable, low
returns on assets and unstable funding options leave the utility vulnerable to
unhedged foreign exchange risks. According to Fitch, this vulnerability results in a
delicately balanced credit position, leaving EVN exposed in the event of urgent
capital spending requirements or a shortfall in collections.

In recent commentary reflecting the first stages of the COVID-19 shock, rating
agency Fitch took note of EVN’s decision to cut tariffs for some customers by 10%
and to cut its 2020 unit sales growth expectations to 4%. Fitch expects EVN to have
headroom to manage these cuts without threatening its current rating. However, the
agency does expect EVN’s debt metrics to suffer in 2020 with funds from operations
(FFO) adjusted net leverage rising to 4.5 times or higher if receivables increase.

EVN’s Financial Constraints
PDP 8 decisions will not be taken in isolation. The twin imperatives of managing
rapid capacity expansion and optimizing a more diverse power system will require
significant ongoing grid investment by EVN. It is therefore critical to understand the
pressure EVN will face in debates around PDP 8. Based on IEEFA’s analysis, EVN is
entering a period of heightened financial risk as the utility’s operations shift from
dependence on its own internally-funded capacity to external coal IPPs and more
guaranteed capacity payments that will result in less operational flexibility.

The guaranteed capacity payments associated with new coal PPAs will also distort
dispatch decisions and limit EVN’s ability to manage variable demand, accentuating

4   Fitch Ratings. EVN Standalone Profile Steady Vietnam Tariff Cut Collection Delays. April 2020
Vietnam’s EVN Faces the Future:
Time To Get Renewables Right 8
the challenge of COVID-19 disruptions.
To explore EVN’s ability to manage this
transition, we have created a baseline
forecast to test the importance of key
variables to EVN’s financial health and
what policy questions may emerge as
EVN implements the program envisioned
in PDP 8. Table 4 below presents a
baseline forecast of EVN’s key income
and cash flow items through 2023.
Guaranteed capacity
In common with all its peers in South
payments will distort
East Asia, EVN faces a challenging 2020
that is expected to result in a net loss for dispatch decisions and limit
the year due to depressed unit sales EVN’s ability to manage
growth and the tariff rebate. Total sales variable demand.
in the first six months rose only 2.3%
year-on-year 5 versus the usual double-
digit growth rate. The short-term impact
of tariff rebates is estimated to have cost
VND 6.8 trillion (USD 291.1 million) in
the second quarter. At the same time,
fixed costs related to new IPP generating
capacity is forecast to rise 24.8%
contributing significantly to a weaker
gross margin.
Vietnam has done an excellent job of controlling the impact of the COVID-19
pandemic. Nonetheless, any forecast for the 2021 to 2023 period will naturally be
subject to higher-than-normal forecast risk. IEEFA estimates unit sales growth to be
constrained at 2.2% in 2020, in line with EVN’s latest annual growth forecasts 6 and
9.0% for the subsequent years. These are well below the 10.3% average of the 2015
to 2019 period.
To ensure the forecast’s neutral character for the 2021-2023 forecast period, we
assumed a fixed effective tariff increase of 3.6% annually and have limited forecast
capex to VND 68.4 trillion (USD 2.9 billion) annually, in line with the World Bank’s
estimates for required transmission and distribution spending.7
5 EVN. Operational Report for the First Six Months of 2020. 11 July 2020.
6 EVN. Assessment of Power Supply Situation in the Last Four Months of 2020 and Preliminary
Outlook for 2021. 31 August 2020.
7 World Bank: Vietnam—Maximizing Finance for Development in the Energy Sector. January
2019.Vietnam’s EVN Faces the Future:
Time To Get Renewables Right 9
Table 4: EVN Baseline Forecast
2019 2020E 2021E 2022E 2023E
Net sales 394,889,987 396,594,941 455,975,555 516,315,994 584,495,644
Cost of sales 343,852,003 370,650,137 408,675,159 455,345,886 525,495,405
Gross profit 51,037,984 25,944,804 47,300,397 60,970,108 59,000,239
Gross margin 12.9% 6.5% 10.4% 11.8% 10.1%
Net operating profit 12,243,610 (14,948,211) 6,265,592 19,774,259 17,623,515
Net operating margin 3.1% -3.8% 1.4% 3.8% 3.0%
Pre-tax profit 12,499,984 (14,575,627) 6,649,353 20,169,533 18,030,647
Net profit after tax 9,720,033 (14,539,864) 5,254,041 15,864,405 14,185,850
Net profit margin 2.5% -3.7% 1.2% 3.1% 2.4%
Net cash flow 3,444,452 (23,557,979) (2,216,395) 11,306,713 10,960,800
Cash and equivalents 53,601,031 30,043,052 27,826,657 39,133,370 50,094,170
Source: IEEFA estimates.
IPP Payment Burden. Before 2020, EVN maintained profitability in the face of high
capex levels, largely thanks to aggressive tariff hikes in 2018 and 2019. Over the
course of the next three years the picture will change as EVN faces lower capex
obligations but higher fixed payment obligations that will put pressure on the
utility’s core profitability and ability to finance new investment.
The most significant fixed financial obligation during the forecast period is rising
IPP payments, which are forecast to grow steadily. We estimate an average 4.4GW
will be brought online by IPPs over 2020-2022, and an estimated 6.1GW in 2023,
most of it from coal-fired and renewable energy sources.
Table 5: New Capacity Additions 2020-2023
2020E 2021E 2022E 2023E
Total additions (MW) 4,411 5,252 3,400 6,870
EVN 269 50 - 750
IPPs 4,142 5,202 3,400 6,120
Source: IEEFA estimates based on MOIT reports and project announcements.
Estimating EVN’s future IPP costs is subject to forecast risk due to limited disclosure
of PPA terms and norms for the dispatch of renewables. Under any scenario,
however, EVN’s gross margin will depend on its ability to integrate IPPs with fixed
capacity payments and new renewables with constrained transmission
infrastructure. IEEFA estimates that EVN’s cost of purchased power will rise 70.5%
during the forecast period to VND335.3 trillion to account for 60.1% of EVN’s
operating costs.Vietnam’s EVN Faces the Future:
Time To Get Renewables Right 10
Table 6: Cost of Sales—IPP Payments
2019 2020E 2021E 2022E 2023E
Total cost of sales 343,852,003 370,650,137 408,675,159 455,345,886 525,495,405
Outside purchasing services cost 42.7% 49.3% 53.9% 57.1% 60.1%
Material costs 24.6% 19.7% 17.3% 16.4% 16.0%
Amortization and depreciation expenses 18.7% 17.4% 15.9% 14.3% 12.8%
Source: IEEFA estimates.
Some of this rise in IPP costs is because of changes in the generation mix. Hydro is
the lowest-cost power in EVN’s generation mix, but its reliability and thus utilization
have declined in recent years due to heightened risks from climate change and
human-induced hydrology risks. In the first half of 2020, hydropower accounted for
only 18% of the generation mix, down from 25% a year earlier.8 This shortfall in
available generating capacity highlights the growing importance of renewables, with
their shorter development time, in filling gaps in Vietnam’s new power pipeline. It
will, however, increase the average cost of generation until enough grid capacity is
in place to realize system efficiencies.
Tariff Headroom. The most sensitive variable in IEEFA’s baseline scenario for EVN
is the tariff. This is critical in assessing EVN’s ability to identify the best strategies
for implementing PDP 8. The PDP 8 planning documents imply a relatively benign
cost pathway for the period, but the data provided cannot be linked to EVN’s current
reported financials without further disclosures.
Table 7: PDP 8—Average Cost of Power Production Estimates
2020 2025 2030 2035 2040 2045
USD/kWh 0.070 0.080 0.078 0.080 0.083 0.085
YoY % change 14.3% -2.5% 2.6% 3.8% 2.4%
Source: IEEFA estimates based on MOIT’s Draft PDP8 (July 2020).
Because EVN is not a publicly listed
company, there has been surprisingly
little analysis of how partners or investors
in Vietnam’s power sector should view Fitch: “EVN's financial
EVN’s ability to cover rising operating profile can be significantly
costs and investment needs via tariff
increases. For example, recent World
affected if tariffs are not
Bank reports envision an eventual tariff adjusted regularly as it faces
threshold of USD 0.12 per kWh, a level major hydrology, currency,
that assumes public resistance to sharp
and demand risks.”
tariff increases. That is an assumption that
should be revisited in the light of
Vietnam’s current socio-political realities
and post-pandemic economic revival agenda.
8 EVN. Operational Report for the First Six Months of 2020, 11 July 2020.Vietnam’s EVN Faces the Future: Time To Get Renewables Right 11 It is also notable that Fitch refers frequently to tariffs as a potential barrier to upgrading EVN’s rating. According to Fitch, EVN’s standalone credit profile is “constrained at 'bb' due to the lack of a longer record of tariff adjustments that reflect cost changes”. Fitch then links this shortcoming to other concerns, noting that “EVN's financial profile can be significantly affected if tariffs are not adjusted regularly as it faces major hydrology, currency and demand risks, in our view”.9 Vietnam’s recent track record of meaningful tariff increases has created a buffer for EVN and should foster confidence for lenders, but it may be time for a short-term reset of tariff expectations. Vietnam, like many North Asian countries, relies on consumers to subsidize industrial users. While this strategy supports job creation, it also raises social tensions when households are under pressure. EVN had plans for another round of tariff hikes earlier this year, despite an effective increase in tariffs of 12.6% over the past two years, but Prime Minister Nguyen Xuan Phuc was quick to brush that off in February when Vietnam registered its first cases of COVID-19. Not only operating on the premise of no rates increase through 2020, EVN also had to offer a 10% cut in billings to customers during April-July which by late June, amounted to VND 6,800 billion (USD 291 million), or 1.7% of last year’s revenue. As the COVID-19 pandemic continues to unfold in unpredictable ways in Vietnam and globally, the priority of Prime Minister Phuc’s government has been to protect jobs, keep factories open and to stand with the public. There has been a consistent focus on efforts to keep inflation below 4%, backstopped by heightened urgency to promote Vietnam’s regional cost-competitiveness to foreign investors. Recent episodes of customer complaints that could reach as high as the top leadership also suggest that EVN will have to manage its cost-revenue narrative carefully to justify future price hikes. Better operational transparency and information disclosure will be critical for EVN to work effectively with an increasingly populist government and customers’ heightened awareness of their rights. 9Fitch Ratings. EVN Standalone Profile Steady Despite Vietnam Tariff Cut Collection Delays, April 21, 2020.
Vietnam’s EVN Faces the Future:
Time To Get Renewables Right                                                            12

Table 8: EVN Tariff Increase Scenarios
                                      2021E         2022E         2023E
Tariff increase assumptions
Neutral baseline                       3.6%          3.6%          3.6%
Front-loaded                           6.0%          2.0%          3.0%
Low                                    2.0%          2.0%          2.0%
Net income (VND million)
Neutral baseline                      5,254,041    15,864,405    14,185,850
Front-loaded                         13,543,786    18,848,352    14,887,697
Low                                    (272,456)    3,445,387    (6,740,153)
Net cash flow (VND million)
Neutral baseline                     (2,216,395)   11,306,713   10,960,800
Front-loaded                          8,346,753    15,108,986   11,855,123
Low                                  (9,258,494)   (4,518,131) (15,704,010)
Source: IEEFA estimates.

Given these cross currents, IEEFA’s baseline forecast for EVN adopts a relatively
neutral posture with tariff increases of 3.6% annually in 2021 through 2023. This is
roughly in line with the average tariff increase over the previous three years and
would result in an average effective tariff of USD 0.089 per kWh at the end of the
forecast period. Based on relatively restrained operating cost and investment
assumptions, the baseline forecast indicates that EVN would have adequate
operational flexibility, but the company would not be well positioned to weather
unexpected financial pressure or to take on extensive grid investment.

The sensitivity analysis also highlights EVN’s financial risk in the event of a more
subdued outlook for the Vietnam economy that might call for tariff increases of only
2% annually in the 2021 through 2023 period. This “low” scenario with tariff
increases of only 6% in total is forecast to expose EVN to losses in 2021 and 2023 as
new coal, gas and renewable capacity comes into the generation mix. It would also
deplete existing cash buffers. By contrast, a more aggressive “front-loaded” tariff
increase of 6% in 2021 followed by increases of 2% and 3% would boost EVN’s net
income and cash position significantly throughout the period, raising an incremental
VND 15.3 trillion (USD 653 million) of net cash over the baseline scenario.

New Sources of Funding. For investors and developers, the message concerning
the IPP payment burden and the tariff outlook is clear. EVN has done well in recent
years to balance financial risks with opportunities. Nevertheless, forecast risk for
the 2020 to 2023 period is high and questions about funding sit at the center of any
forecast of EVN’s future performance. High reliance on IPPs solved the problem of
lack of direct access to lower cost USD debt for the PDP 7 period, but higher tariffs
are essential if EVN is to stay on steady financial footing. This will be crucial for
EVN’s efforts to achieve a credit rating that would unlock direct access to more
affordable USD debt.

EVN’s positioning relative to direct financial market access matters in the near-term
because efforts to raise capital by divesting stakes in its generation companies
(gencos) have stalled. In line with traditional World Bank advice, EVN had hoped to
Vietnam’s EVN Faces the Future:
Time To Get Renewables Right 13
spin off its gencos to encourage the development of a competitive wholesale power
market and provide cash to EVN for capex. This has not worked out as hoped. The
planned February 2018 initial public offering of GENCO3, the second largest
company by installed capacity, was largely shunned by investors.
To date, the state holds a 99% stake in GENCO3, well above the 51% target set for
year-end 2019. The government, however, continues to press ahead with the sale of
GENCO2, now scheduled for December 2020. With 4.4 GW of installed capacity and a
generation portfolio largely dominated by coal-fired and hydropower, GENCO2 was
valued by the state at VND 46.1 trillion (USD 2.0 billion). There are reasonable
grounds to doubt the success of this second IPO.
The implementation of PDP 8 will
necessarily be influenced by the path of
Vietnam’s recovery from the COVID-19 The implementation
pandemic and its associated economic of PDP 8 will necessarily
fallout. Consequently, the funding picture
be influenced by how well
for continued investment will depend not
just on Vietnam’s financial positioning, but Vietnam recovers from
also on developments in regional capital the COVID-19 pandemic.
markets and how EVN markets its
performance potential.
EVN’s broader funding picture will be influenced by the growing demand for clean
energy infrastructure assets. Evidence of this trend is clear in the strong response
from developers to EVN’s solar and wind feed-in-tariff programs. Although the PPA
for the solar FIT was initially judged as “unbankable” by foreign banks, developers
see the Vietnam market in positive terms and regard EVN as a steady partner once
terms are agreed. This bodes well for Vietnam as regional banks and developers
look for markets that are working to meet the standards required for targeted green
finance instruments and facilities.
The PDP 8 Opportunity
This picture of stable but constrained growth sets the backdrop as the much-
awaited policy shift to PDP 8 will dominate debate over Vietnam’s power sector in
the next six months. The government has bold energy transition ambitions, and the
plan represents a step-change with a generation mix focused on a new commitment
to renewable energy alongside LNG-fired IPP capacity, rather than coal-fired
generation.
The initial response to the plan has been positive, but the coming months will be
critical to how potential project sponsors and investors respond to new
opportunities. Based on IEEFA’s analysis, three key issues will be critical to ensuring
that EVN can become a more effective system operator with a sustainable financial
profile:
New Grid Investment. The importance of timely investment in transmission and
distribution cannot be overlooked, even in systems that are more oriented toVietnam’s EVN Faces the Future: Time To Get Renewables Right 14 generation-focused planning disciplines. As the IEA noted in its World Energy Investment 2020 report, “Much-needed investment in electricity networks and storage can ensure that tomorrow’s power systems remain resilient and reliable even as they are transformed by the rise of clean energy technologies.”10 As EVN continues to bring more renewables into the generation mix, it will be in its own interest to focus on new grid investment. A reliable transmission system would not only help to optimize variable renewables in the generation mix but would also be critical to securing lower power purchasing costs for EVN. As Vietnam transitions to competitive solar and wind auctions as soon as 2021, EVN’s ability to get the best possible pricing will depend on developers’ certainty that dispatch risk has been minimized and future grid design supports the integration of competitively priced renewables. Meanwhile, the allure of “green” grid investments to support renewables will attract external financing, relieving EVN’s capital access problems and enabling it to rely on investment in cost-effective tactical renewables, including storage. In this respect, MOIT and EVN appear to be on the right track. Within the past year, their flexible approach to the interpretation of existing legislation has facilitated the country’s first privately-funded and built transmission project in the southeast province of Ninh Thuan in April, albeit on a pilot basis. This was followed by steps to remove legal uncertainty with the June adoption of the Law on Public-Private Partnerships which specifically targets power grids as an eligible area for private sector participation. This reform creates a solid legal basis for future private financing of transmission infrastructure. Private sector interest in transmission development is clear and will be led initially by entities with direct interests in beneficiary renewable power plants. As acknowledged by an EVN executive at the Vietnam Energy Summit 2020, private developers need much less time than EVN to develop a 500 kV transmission line because they are not constrained by the complex bureaucracy and regulatory burdens of public investment. Both MOIT and EVN seem willing to further capitalize on the private sector’s interest in transmission projects. In a best-case scenario, careful planning and the identification of attractive projects could also mobilize capital from new sources of green finance. This could enable EVN and public-private partnerships (PPP) to tap new sources of funding for much-needed new grid capacity on internationally competitive terms. Economic Efficiency. Vietnam is well positioned to capture economic benefits from supply chain development and competitive energy auction pricing. Industry players generally agree on Vietnam’s existing civil engineering capabilities, prospects for more local sourcing, and the potential for returns to scale. Official announcements related to the management of the renewables sector affirm policymakers will adopt best-practice strategies to ensure renewables become increasingly cost-competitive. 10 IEA World Energy Investment 2020.
Vietnam’s EVN Faces the Future:
Time To Get Renewables Right 15
This optimism is supported by the fact that Vietnam has vast untapped solar and
wind potential and the commitment needed to ensure that the incremental 15.6 GW
of solar and wind capacity expected by 2025 will attract funds from new and
existing investors. It is, however, notable that PDP 8 relies on conservative
estimates concerning cost improvements of only 26.8% for offshore wind, 30.5% for
onshore wind, and 28.7% for solar over the next 25 years.
Table 9: PDP 8—Cost Estimates for Renewables
Improvement vs base year price
Base year
price
2025-2029 2030-2039 2040-2045
(USD/MW)
Onshore wind (>= to 6 m/s) 1.7 -10.7% -18.3% -24.5%
Onshore wind (5.5-6m/s) 2.0 -10.7% -21.4% -29.2%
Onshore wind (4.5-5.5m/s) 2.0 -10.7% -21.4% -26.7%
Onshore Wind Average 1.9 -10.7% -20.4% -26.8%
Offshore wind (fixed foundation) 3.1 -2.3% -17.3% -23.2%
Offshore wind (floating) 4.3 -2.3% -16.1% -37.9%
Offshore Wind Average 3.7 -2.3% -16.7% -30.5%
Large-scale solar 1.1 -10.4% -20.8% -29.8%
Rooftop solar -10.4% -20.8% -29.8%
Solar Average -7.8% -19.2% -28.7%
Source: MOIT Draft PDP 8 (July 2020).
IEEFA’s review of the preliminary PDP 8 shows that the potential for renewables
cost improvements has been underestimated, creating added upside for EVN if it can
find cost efficiencies than are not in the modeled scenarios. This view is based on
renewables equipment providers’ demonstrated track record of achieving rapid cost
improvements via technological improvements, economies of scale and competitive
market policies such as reverse auctions.
The experience of comparable markets, and announcements from key technology
suppliers suggest that more cost-competitive outcomes are highly likely. Major
Chinese solar module manufacturers have made significant announcements in 2020
indicating that leading manufacturers will be moving from 1-2GW manufacturing
facilities to a new standard of 5-10GW. These scale improvements are coming into
view just as solar spot module prices have fallen 20% year-on-year.11
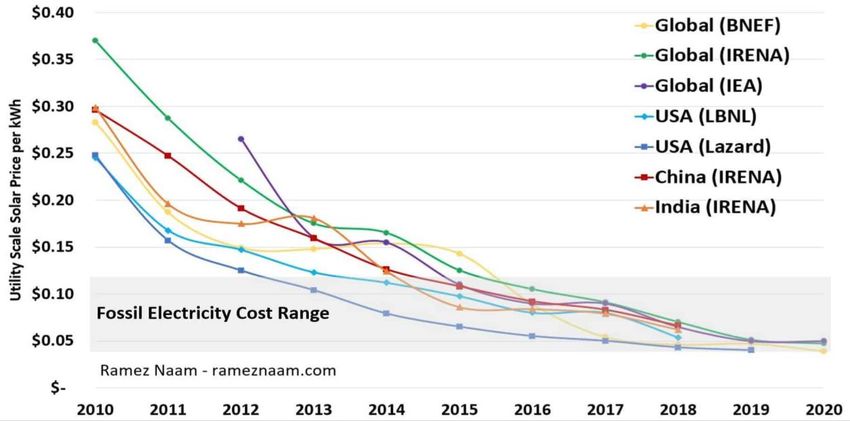
Analysts of the solar power sector have struggled with forecasting errors for more
than a decade. Even global organizations such as the IEA and IRENA have
consistently lagged market trends. Commentators such as Ramez Naam12 have
shown that greater accuracy requires a focus on learning rates as the solar industry
expands and cuts capital costs. This focus on funding costs is one that IEA shares,
noting that lower debt funding costs can deliver cost savings on the order of 38%
when funding costs can be brought below the 8.0% weighted average cost of capital
11 IEEFA. Renewables Continue to Break Records Despite COVID-19 Impacts. June 2020.
12 Ramez Naam. Solar's future is insanely cheap. 2020.Vietnam’s EVN Faces the Future: Time To Get Renewables Right 16 (WACC) often used in conventional solar modeling exercises. 13 Both are factors from which EVN should hope to benefit. Figure 1: Solar Costs Dropped by a Factor of 5 Since 2010 Source: Ramez Naan. Solar’s Future is Insanely Cheap. 2020. New research from Europe on rapid cost improvements in offshore wind reinforces the message that, although offshore wind is often priced at a premium in the early stages of development, auction bids in 2019 were delivering new capacity at USD 0.059/kWh.14 Recent auction bids in Germany and the Netherlands were regarded as “subsidy-free” because they were in line with existing wholesale market prices. One key element in this notable improvement in reported auction outcomes is a pattern of cost reductions driven by economies of scale that have exceeded the expectations embedded in research from global bodies such as the IEA. The European researchers found that “offshore wind cost reductions has proceeded more rapidly than was widely anticipated”. They cite a 2016 study using expert surveys to forecast future wind power costs and note that “the prices received in recent auctions have already fallen below the expectations for 2050”. This research should give EVN and MOIT policymakers more confidence that well- structured competitive auctions and targeted grid investment should enable EVN to align with industry-leading developers in driving down the cost of renewables in the Vietnamese market. Much will depend on how decisions to be made over the next year will set the tone for the renewables market. The preliminary MOIT draft for the solar competitive auction mechanism, which could be implemented next year, suggests that the regulator is looking to find the right balance between (i) trying to 13 IEA World Energy Investment 2020, p. 81. 14 Nature Energy. Offshore wind competitiveness in mature markets without subsidy. July 2020.
Vietnam’s EVN Faces the Future:
Time To Get Renewables Right                                                           17

secure lower-cost power through auctions, (ii) managing the risk of grid constraints
through sub-station auctions and designated solar park auctions, and (iii) securing
rapid addition of capacity by offering guaranteed PPAs for the 1 GW of projects
actioned before June 2021.

System Flexibility. One challenge that the PDP 8 planning team has clearly worked
hard to address is the importance of building a more flexible power system with
market structures that will enable EVN to optimize a more diverse generation mix.
Moving from baseload-oriented planning to operating a more flexible system will
require new management tools and system services. The preliminary PDP 8
document accurately highlights the importance of taking system level operating
costs into account, including full generation and transmission costs, environmental
impacts, and system services such as storage. There is also a much-needed
recognition of the importance of diverse energy sources and the risk associated with
dependence on imported fuels.

Modeling all these variables is difficult and working on a 25-year time horizon can
increase the risk of forecasting errors. To provide just one example of an
opportunity that was overlooked in the PDP 8 modeling, it is worthwhile to consider
the benchmarks that were used for estimating
solar capacity factors.

IEEFA’s review suggests the PDP 8
planning document may have used
conservative assumptions about the likely
capacity factors of new solar units.              As market operators
Estimates for the South, the Central South,   learn to optimize renewable
and Central Highlands—with the best               capacity, renewables
solar resource in Vietnam—appear to
imply an estimated capacity factor of                climb steadily in
roughly 19%, while the outlook for the             the generation mix.
Middle Central, the Central North, and the
North are clustered in the 14 to 16%
range.

These estimates reflect a cautious approach to variable renewable intermittency
that is not supported by trends in markets as diverse as Germany, California, Tamil
Nadu, or South Australia. IEEFA research found that as market operators learn to
optimize renewable capacity, it is not uncommon to see renewables climb steadily
in the generation mix to reach the 30% to 50% range. The key to this, which is
acknowledged in PDP 8, is steady progress on grid balancing, the development of
cost-effective storage options, and gas-peaker generators to provide extra power at
periods of high demand.

The good news for EVN is that any step taken to realize more value from variable
renewables will be a plus for EVN’s operating cost profile. Power systems structured
to optimize the use of variable renewables, with their deflationary cost
characteristics, can deliver cost savings for market operators that can tilt the
generation mix and displace higher-cost baseload capacity.
Vietnam’s EVN Faces the Future:
Time To Get Renewables Right                                                                   18

The preliminary PDP 8 document includes a targeted list of recommendations that
should serve as a to-do list for policymakers and EVN over the coming year. The list
mandates a greater focus on system flexibility post-2025, with steps related to tariff
support for storage and ancillary services, a transmission link from the Central
South to the North, and new measures to encourage large-scale solar and rooftop
solar in the North to address daytime peak demand.

One final opportunity acknowledged in PDP 8 is to make tactical use of Vietnam’s
existing grid interconnections with neighboring Laos and China to import power at
the margin. Importing low-cost electricity could give EVN breathing room from
capacity build-up, and more importantly would enable Vietnam to avoid the risk of
premature baseload lock-in, including large scale LNG-fired power plants, while still
meeting medium-term generation targets.

Table 10: Potential Sources of Imported Power
                         Current                             Capacity
                                    2023-2025   2026-2030                2030 GWh
                          (MW)                              2030 (MW)
North                         700         630         402        1,732       7,075
China                         700                                  700       3,360
Laos hydro                                630         402        1,032       3,715
Central North                             445         145          590       2,006
Laos hydro                                445         145          590       2,006
Middle Central                250       1,099       1,020        2,369       8,655
Laos hydro                    250         199         420          869       2,955
Laos wind                                 600                      600       1,380
Xekong coal                               300         600          900       4,320
Highland                      322         -           667          989       3,264
Laos hydro                    322                     667          989       3,264
                 Total      1,272       2,174       2,234        5,680      21,000
Source: MOIT Draft PDP 8 (July 2020).

While MOIT and EVN will naturally prioritize domestic capacity and cost
optimization, the planners rightly understand that imported power could, under
certain circumstances, enhance EVN’s market reach with cost-competitive regional
developers. The Laos wind project identified in Table 10 will be developed by
Bangchak Corporation PLC, an experienced Thai energy and renewables company,
that has already participated in Vietnam’s renewables market.15 Lower cost power
from Laos means that Vietnam can benefit from cheaper and less controversial
imports of renewable power. The price of wind power from Laos is capped at USD
0.069 per kWh, or almost 20% lower than the domestic rate.16

EVN’s Politics of the Possible – The 2020 Watch List
The financial uncertainties that emerge from our analysis of EVN underscore the
nature of the risks and opportunities for MOIT and EVN. Vietnam’s growing

15IEEFA. Thai firm to build 600MW wind farm in Laos, 29 July 2020.
16VnExpress. Vietnam caps price of wind power to be imported from Laos at 6.95 cents, 21 May
2020.
Vietnam’s EVN Faces the Future:
Time To Get Renewables Right 19
economy needs clean, affordable power and the ability to integrate new energy
technology in a cost-competitive way over the longer term. The key to this is to
embrace flexibility and to avoid lock-in – a scenario in which the build-up of high-
cost fixed IPP obligations is so rapid that it constrains Vietnam’s ability to benefit
from the cost-effective power market innovations that will certainly emerge over
the next five years. MOIT has demonstrated considerable insight in working with
the market on the development of the first-round solar and wind FIT programs.
Similar pragmatism may be needed as the policies and market responses framed by
PDP 8 progress.
As PDP 8 takes its final form in coming months, analysts and investors will benefit
from monitoring two critical issues—one strategic and one practical—that will
determine the medium-term direction of Vietnam’s power sector reforms.
Plan vs. Roadmap. Perhaps the most common mistake analysts make when
tracking developments in Asian power markets is failing to differentiate between
the formal policies and regulations that define current market activity and the plans
that are used to shape policy choices. Whether it is China’s five-year plans or
Indonesia’s RUPTL, investors have often struggled to find the correct way to
translate these comprehensive planning exercises into reliable assumptions about
market developments. To state the obvious, some plans are more likely than others
to become immediate market developments.
Taking into account the many dynamic
factors defining the COVID-19 market
environment, analysts may be best
served if they assess PDP 8 as a
directional roadmap, rather than as a
rigid master plan with fixed milestones.
Experience with PDP 7 has shown that
sectoral master plans in Vietnam are best
Analysts are best served
understood as being aspirational in if they assess PDP 8 as a
nature. They are significant because they directional roadmap, rather
serve the administrative purpose of
than as a rigid master plan
laying the legal basis for project
approvals. But, when market conditions with fixed milestones.
change, revisions are to be expected. If
the past three years have been any
indication, provincial and central
authorities are willing to revise power
master plans as long as the new
investments make socio-economic sense.
Given the burden of COVID-19 recovery and dramatic shifts in the technology
pipeline, adaptability will be a strategic asset for EVN. For investors and analysts
focusing on EVN’s role in developing Vietnam’s power market, near-term forecast
risks are set to remain high given uncertainties around the tariff outlook and capex
funding options. But the picture may well prove to be quite different for projectVietnam’s EVN Faces the Future: Time To Get Renewables Right 20 developers and investors with a long-term commitment to the Vietnam power sector. The behavioral differences between investors with a short-term view versus a long- term view will foreshadow which players emerge as leaders in the Vietnamese power market. To date, the players best positioned to align with EVN for the longer term have been renewables developers and investors with ready access to capital markets and existing banking relationships that can now tap into growing sources of green financing for clean energy. By contrast, foreign developers reliant on traditional fee-heavy project finance structures for large-scale fossil fuel IPPs may struggle to gain traction as the PDP 8 roadmap evolves. The LNG Funding Question. While new sources of green financing may provide support for EVN’s PDP 8 renewables and grid investment requirements, it is less clear how the funding for the remaining coal pipeline will progress. The more significant long-term question for PDP 8 is how the proposed LNG projects will develop. PDP 8’s aggressive embrace of LNG comes at a time when there are is little clear information concerning Vietnam’s LNG development policies. Based on the preliminary PDP 8 data and IEEFA research, it appears that as much as 12,800 MW of LNG-fired combined-cycle gas power has been approved as part of the PDP 7R and PDP 8 roadmap for the coming seven years. Table 11: LNG Project Pipeline Source: MOIT, IEEFA research. Note: Includes only projects that have been added to the master plan, except for project Ke Ga (Phase 1) which received preliminary in-principle approval from Prime Minister Nguyen Xuan Phuc.17 Project details are subject to change. 17 Cong Thuong Newspaper. Binh Thuan aims to become a national energy center. 31 July 2020.
Vietnam’s EVN Faces the Future:
Time To Get Renewables Right                                                                        21

This embrace of LNG comes at a time when 80% of Vietnam’s offshore gas output is
used for power generation. Domestic natural gas production has been expected to
peak by 2026, although the recent announcement of a new offshore gas discovery by
ENI may extend this forecast.18

Vietnam’s pivot towards LNG-fired capacity was confirmed earlier this year by the
country’s political leadership in Resolution 55. Despite clear signs of policy
commitment, it is notable that many fundamental questions about how the links in
the LNG value chain will evolve in Vietnam have yet to be answered. At a time when
the global gas market is facing existential questions about long-term market
structures, this is not a minor issue. As a result, the full cost of integrating a large
commitment to LNG into Vietnam’s energy and power markets is not yet fully
understood domestically, or by regional analysts.

Vietnam’s LNG sector is in the early
stages of its development. There are
currently two LNG terminals under
construction, both located in the
southern coastal province of Ba Ria-Vung
Tau. Hai Linh LNG terminal, which is                   Despite rapid progress,
wholly privately owned and operated, is                   there is neither a
expected to enter operation in 2021 with             comprehensive master plan
an initial capacity of 2-3 MMTPA. It is the
first LNG import and regasification                        nor a centralized
facility in the country.19 The Thi Vai LNG             management model for
terminal, owned by PVGas, the natural                  Vietnam’s LNG industry.
gas arm of state-owned oil and gas group
PetroVietnam, is expected to come online
in 2022 with an initial capacity of 1
MMTPA, and an additional 3 MMTPA in
2023.

Despite rapid progress on the LNG terminals, there is neither a comprehensive
master plan nor a centralized management model for Vietnam’s LNG industry. LNG
terminals and gas-fired power projects are currently governed under two separate
sectoral master plans and recently integrated LNG-to-power projects proposals are
scattered across the country. This underscores the need for systematic planning of
“LNG hubs” to ensure that investment in the LNG terminals is linked efficiently to
downstream power plants and industrial consumers.

PetroVietnam’s role in the LNG sector is uncertain. Under the PDP7R framework,
PetroVietnam was given tasks such as developing the LNG importing model and
partnering with domestic and foreign investors in LNG infrastructure development.
This has not materialized in practice, however. Citing examples from Bangladesh,
Pakistan, Malaysia, and Thailand, PVGas has made the case that it should become the
“LNG aggregator” to handle supply sourcing and distribution in the early stage of the

18Offshore Energy. Eni confirms gas potential in discovery offshore Vietnam. July 2020
19S&P Global Platts. Vietnam’s first LNG terminal Hai Linh to conduct test run late 2020, 10 June
2020.
Vietnam’s EVN Faces the Future:
Time To Get Renewables Right                                                              22

LNG market development. PVG as has been granted the exclusive rights to import
LNG via its Thi Vai terminal to fuel the group’s gas-fired power plants, but it remains
unclear if those rights will apply elsewhere.20

Despite the lack of policy clarity, there has been a surge of interest in integrated
LNG-to-power project investments from foreign developers, most of which are US-
linked. The first of the projects to have been granted an investment license is LNG
Bac Lieu, a USD 4.0 billion project involving a floating storage regasification unit
(FSRU), a gas pipeline, and a 3.2 GW power plant, to be developed by Singapore-
based Delta Offshore Energy. Meanwhile, AES of the USA is developing the 2.2 GW
Son My 2 power plant project in Binh Thuan province and is negotiating to develop
the Son My terminal with PVGas.

This apparent disconnect between planning and execution raises questions about
EVN’s ability to manage the cost of LNG-fired IPPs. Building the necessary LNG
infrastructure is destined to be costly. If history is any guide, MOIT will need to
drive an extremely hard bargain with gas suppliers and should push back against
the fixed contract terms that financially constrained US developers may seek.

The next question is how much of the cost of the associated infrastructure—
regasification, storage, and transport—will be passed through to EVN?

Investors will need to pay close
attention to this issue. Disclosures in
the preliminary PDP 8 documents
suggest that EVN’s LNG prices will only
include a pipeline transportation                   MOIT will need to drive
charge but not a charge for the cost of
LNG infrastructure. Recent IEEFA
                                                  an extremely hard bargain
research into China’s gas market                    with gas suppliers and
development experience suggests that               should push back against
this may not be a realistic expectation
and that the development of China’s
                                                   the fixed contract terms.
gas market may not favor high-cost
American LNG producers over the long
term.21

The complex cost structure of U.S. LNG, which includes anything from feedstock
costs, liquefaction fees and shipping costs to regasification and pipeline
transportation fees, means that any moderate increases in these cost components
could easily make U.S. LNG uncompetitive against cheaper pipeline imports,
domestic gas or other global LNG suppliers.22

At this stage, the regulatory and market realities that will determine EVN’s ability to
pay for a major shift toward gas-fired power capacity remain in flux. As a result, it
will be crucial to track developments in the global LNG market. Many American

20 Allens. Report: Vietnam LNG Sector Update. September 2019.
21 IEEFA. US LNG Buildout Faces Price Resistance from China. July 2020
22 Ibid.
You can also read