2Q 2018 Investor Relations - Daniel Fairclough, Member of Group Management Committee, VP Investor Relations - ArcelorMittal
←
→
Page content transcription
If your browser does not render page correctly, please read the page content below
2018 Industrial Conference
         New York

El Romero solar farm using ArcelorMittal’s Magnelis® coated steel.

  2Q 2018 Investor Relations
  Daniel Fairclough, Member of Group Management Committee, VP Investor Relations
                                                                                   August 7, 2018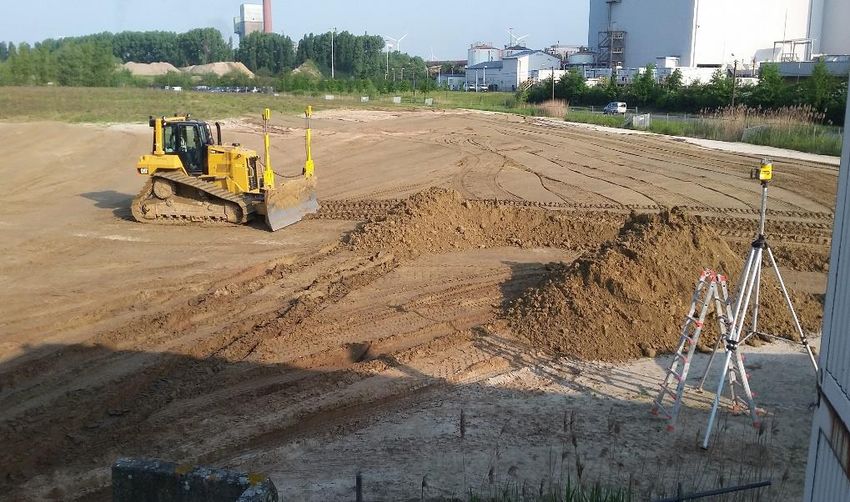
Disclaimer
Forward-Looking Statements
This document may contain forward-looking information and statements about ArcelorMittal and its subsidiaries.
These statements include financial projections and estimates and their underlying assumptions, statements
regarding plans, objectives and expectations with respect to future operations, products and services, and
statements regarding future performance. Forward-looking statements may be identified by the words “believe”,
“expect”, “anticipate”, “target” or similar expressions. Although ArcelorMittal’s management believes that the
expectations reflected in such forward-looking statements are reasonable, investors and holders of ArcelorMittal’s
securities are cautioned that forward-looking information and statements are subject to numerous risks and
uncertainties, many of which are difficult to predict and generally beyond the control of ArcelorMittal, that could cause
actual results and developments to differ materially and adversely from those expressed in, or implied or projected by,
the forward-looking information and statements. These risks and uncertainties include those discussed or identified
in the filings with the Luxembourg Stock Market Authority for the Financial Markets (Commission de Surveillance du
Secteur Financier) and the United States Securities and Exchange Commission (the “SEC”) made or to be made by
ArcelorMittal, including ArcelorMittal’s latest Annual Report on Form 20-F on file with the SEC. ArcelorMittal
undertakes no obligation to publicly update its forward-looking statements, whether as a result of new information,
future events, or otherwise.

                                                                                                                            1
Positioned to deliver value
• Continued improvement in results, reflecting structurally improved
  industry backdrop and Action 2020 benefits
• Unique global portfolio of competitive well-invested assets
• Industry leader in product and process innovation
• Action 2020 continues to structurally improve profitability
• Investing with focus and discipline
• Investment grade balance sheet, progress towards net debt target
  to accelerate
• Base dividend reinstated with intention to increase capital returns
  once net debt target achieved
            Capital allocation policy to maximise value for shareholders
                                                                           2
Safety is our priority
Health & Safety Lost time injury frequency (LTIF) rate*
Mining & steel, employees and contractors
                                                                                                                        Health & Safety performance

                                                                                                                        • LTIF rate of 0.71x in 2Q’18 vs. 0.62x in 1Q’18 and
                                                                                                                          0.72x in 2Q’17
                     3.1
                                                                                                                        • The Company’s efforts to improve the Group’s
                                                                                                                          Health and Safety record will continue
                                  2.5
                                                                                                                        • The Company is focused on further reducing the
                                                                                                                          rate of severe injuries and fatality prevention
                                               1.9
                                                            1.8

                                                                         1.4

                                                                                      1.0
                                                                                                  0.85         0.85        0.81        0.82   0.78           0.71
                                                                                                                                                     0.62

                   2007         2008         2009         2010         2011         2012         2013         2014         2015        2016   2017   1Q18 2Q18

                                           Our goal is to be the safest Metals & Mining company
* LTIF = Lost time injury frequency defined as Lost Time Injuries per 1.000.000 worked hours; based on own personnel and contractors                                           3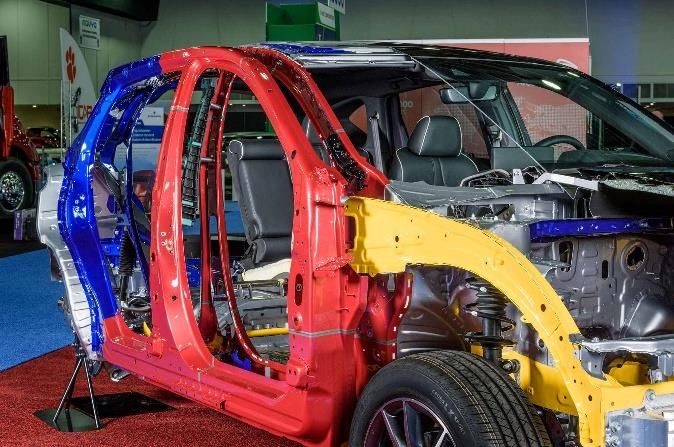
Sustainable development - key to our resilience

• Sustainable Development is driven by our vision to make steel the material
  of choice for the low carbon and circular economy

 – Product innovation (e.g. S-in-
   motion solutions for automotive)
 – Contribution to low carbon and
   circular economy (e.g. LanzaTech
   project on Carbon Capture and
   utilisation)
 – Drive the development of
   environmental and social
   certification schemes for steel and
   mining

                     Leadership in response to long term trends
                                                                               4
Performance significantly improved
• Operating results are beginning to reflect the structural improvements to
  the business and the industry
                                                                                                        EBITDA (US$ billion)
                                                                                                                                           +107%
                                                                                                                                                                            5.6
        – ROE* of 14.7% in 1H’18
                                                                                                                                               4.3
        – ROCE** of 13% in 1H’18
        – Best performing first half EBITDA                                                                       2.7
          since 2011
        – All segments supporting the
          improved Group performance

                                                                                                               1H’16                        1H’17                        1H’18

                                                                  Significant EBITDA improvement
* Return on equity (ROE) is defined as net income divided by total shareholder equity; **Return on capital employed (ROCE) is defined as operating income plus impairments, income from equity method
investments and other income minus tax (20% rate) divided by capital employed (defined as total equity plus net debt); Both ROE and ROCE calculated 1H’18 annualised basis
                                                                                                                                                                                                        5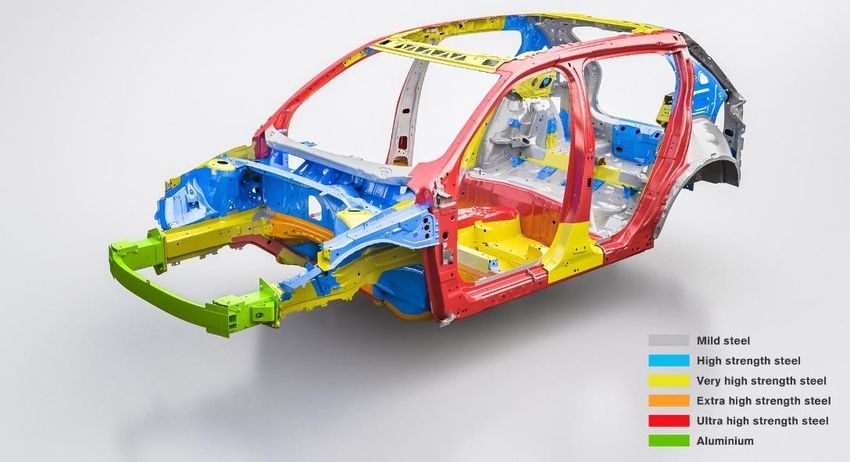
Balance Sheet: deleveraging ongoing priority
                                                                                                 Net debt ($billion)

                                                                                                  21.8
   • Investment grade rating
                                                                                                                           17.4    16.6
     achieved from all 3 rating                                                                                                                          -1.4
                                                                                                                                           12.7
     agencies*                                                                                                                                     11.9
                                                                                                                                                            10.5

   • 1H’18 interest costs ~65%                                                                  Dec 31,                   Jun 30, Jun 30, Jun 30, Jun 30, Jun 30,

     lower than 1H’12                                                                            2012                      2014    2015    2016    2017    2018

                                                                                                 Net interest ($billion)
   • Lower interest costs will
     ensure greater translations                                                                                                  -68%
                                                                                                   1.9         1.8
     of EBITDA to FCF                                                                                                      1.5
                                                                                                                                   1.3     1.1
                                                                                                                                                   0.8
                                                                                                                                                                0.6

                                                                                                  2012       2013         2014    2015    2016    2017 FY’18F

                                  Investment grade rating achieved from all 3 rating agencies
* Investment grade credit rating upgrades: S&P in February 1, 2018, Moody’s in June 22, 2018 and Fitch in July 13, 2018
                                                                                                                                                                      6
Disciplined capital allocation
• Deleveraging remains our priority building the strongest platform for
consistent capital returns to shareholders
Targeting $6bn net financial debt (NFD) to ensure lowest cost
Robust balance sheet
balance sheet Maximise FCF potential
Investing in opportunities with focus and discipline Grow
Invest in strengths
FCF potential of the business
Returns to Base dividend reinstated Capital returns to shareholders
shareholders will increase to a portion of FCF once NFD target achieved
Capital allocation policy to maximise value for shareholders
7
Steel industry reform
• Several government initiatives to protect against global
unfair trade
• Global steel industry operating at high rates of capacity
utilisation
• More effort required in the ongoing government support to
protect against global unfair trade
• Section 232 and provisional European safeguard measures
in place insulate ArcelorMittal’s core operations from
unfairly traded imports
There is still more to be done to thoroughly address the issue of global excess capacity
8
Structural improvement: Action 2020
Action 2020 cumulative EBITDA improvement
• Europe: Transformation progressing well achievement vs. targets ($billion)
• Savings in procurement/ productivity on track
• Enhanced use of digitalisation in the 3.0
manufacturing process, supply chain and
commercialisation
• NAFTA:
• Restoration of 80” hot strip mill and Indiana
Harbour finishing ongoing – expected 1.5
completion end of 2018
• Calvert utilisation 88% in 1H’18 0.9
• Mining: Remain focussed on – Product quality,
service and asset reliability. FCF breakeven
level of $40/t China CFR 62% Fe
2016 2017 2020
Target
Transformation of the business ongoing Action 2020 drives sustainable improvement
9Disciplined growth Prioritising deleveraging and
balance sheet strength
Brazil: Votorantim acquisition strengthens
long products business in Brazil
➢ Minimal initial balance sheet impact from debt
assumed
➢ Value to be created from significant synergies
Deleveraging is
our priority…
Italy: Restore ILVA as leading Italian steel
supplier
… creating the
➢ Acquisition cost spread over several years*
strongest
foundation for
sustainable
India: Essar Steel; a high growth market
returns
➢ Joint Venture with Nippon Steel
➢ ArcelorMittal to finance its share of the equity
component of the JV finance structure
Capturing the best opportunities for growth whilst maintaining strict balance sheet discipline
* Purchase price of €1.8bn will be reduced by annual instalments of €180m for a minimum of 2 years 10Transformation technologies: LanzaTech
installation, Gent (Belgium)
• €150million project between ArcelorMittal & LanzaTech in Gent, Belgium, broke ground June 2018
• Technology to potentially revolutionise the capture of BF carbon gas and convert it into bioethanol
• Licensed by LanzaTech, a proprietory microbe feeds on carbon monoxide to produce bioethanol, to be
used as transport fuel or potentially in the production of plastics
• Annual production of bioethanol from this demonstration expected to reach around 80m litres, which
will yield an annual CO2 saving equivalent to 600 flights from London to New York
• The new installation will create up to 500 construction jobs over the next two years and 20 to 30 new
permanent direct jobs. Commissioning and first production is expected by mid-2020
Technology to potentially revolutionise the capture of BF carbon gas and convert it into bioethanol
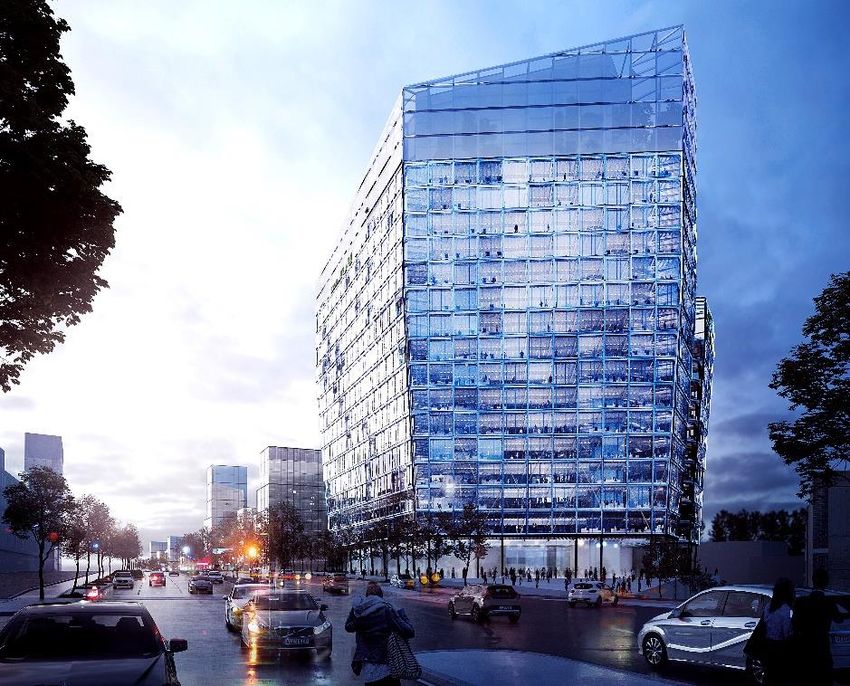
11Steligence® - the intelligent construction choice
A radical new concept for the use of
steel in construction
• Steligence® is based on extensive scientific
research, independently peer-reviewed
• Makes the case for a holistic approach to construction
that breaks down barriers, encouraging collaboration
between construction industry professionals
• Designed to resolve the competing demands of
creativity, flexibility, sustainability and economics
• Delivers efficiencies, benefits and cost savings to
architects, engineers, construction companies, real
estate developers, building owners, tenants and
urban planners
• Will facilitate the next generation of high performance
buildings and construction techniques, and create a
more sustainable life cycle for buildings
• Our new Headquarters building is designed to
showcase the Steligence® concept
Social, economic and environmental benefits
12Industry leadership
Industry awards for service, quality, technology, innovation leadership
➢ Honda R&D Americas Inc. awarded The 2019 Acura
RDX features a
ArcelorMittal with its Excellence in Innovation 50% increase in
the use of
Award. UHSS steel
over the
previous model,
➢ General Motors awarded ArcelorMittal's AM/NS including the
first outer and
Calvert with its Supplier Quality Award and inner door ring
system.
ArcelorMittal with its Supplier Diversity Award
➢ Ford ranked ArcelorMittal #1 amongst its five
main suppliers for the seventh consecutive year
➢ Jaguar Land Rover awarded ArcelorMittal
Europe a bronze Supplier Excellence Award,
recognizing the high-quality of ArcelorMittal's
products, our outstanding delivery performance
Recent awards recognise ArcelorMittal as automotive steel leader
13Healthy demand environment
ArcelorMittal Global PMI*
57
55
53
51
49
47
45
43
41
39
37 (latest data point: Jun-2018, 53.9)
35
2006 2007 2008 2009 2010 2011 2012 2013 2014 2015 2016 2017 2018
Strong global economic fundamentals support further expected steel demand expansion in 2018
* ArcelorMittal estimates
14Demand outlook remains favourable
• Global steel outlook remains positive Growing demand in ArcelorMittal's
core markets
ArcelorMittal & WSA demand forecasts 2018
US EU28
CIS
ArcelorMittal China
ArcelorMittal ArcelorMittal
+2.0% to +3.0% ArcelorMittal
+2.0% to +3.0% +2.0% to +3.0%
(revised up from +1.0% to +2.0%
(revised up from +1.5% to +2.5%) WSA
+1.0% to +2.0%) (revised up from
WSA +2.3%
WSA -0.5% to +0.5%)
+2.7%
+2.0% World ex-China WSA
Brazil ArcelorMittal 0%
ArcelorMittal +3.0% to +4.0%
+5.5% to +6.5% WSA
(revised down from +6.5% to +7.5%) +3.4%
WSA - Central & South America World
+6.2% ArcelorMittal
+2.0% to +3.0%
(revised up from +1.5% to +2.5%)
WSA
+1.8%
Strong global economic fundamentals support further expected steel demand expansion in 2018
ArcelorMittal estimates; Worldsteel Association (WSA) Short range outlook, April 17, 2018
15Positioned to deliver value
• Continued improvement in results
Strategy delivering • Reflects strengthening market backdrop
and Action 2020 delivery
• Ex-China demand growth forecast to continue
Industry outlook
• Global capacity utilization improving
improving • S232 and European safeguards insulating the Building the
business from unfair trade
strongest
Investing with focus • Leveraging strengths to grow returns foundations for
& discipline • Capitalizing on M&A opportunities whilst
maintaining strict balance sheet discipline sustainable
value creation
• Net debt / EBITDA of 1.1x for 1H’18
Transformed
• Investment grade achieved
balance sheet • Deleveraging to continue
Commitment to • Dividends reinstated
return cash to • Commitment to increase capital returns to
shareholders shareholders once NFD target achieved
Capital allocation policy to maximise value for shareholders
16Section 1 APPENDIX
Focused investment
• Italy: Restore ILVA as leading Italian steel supplier
Capex in 2018 ($ billion) • Expanded product range with new HAV steel grades
3.7 • Synergies €310m of which €50m to benefit ArcelorMittal’s existing
operations
Primarily steel projects 0.1
focusing on • 2018 investment of ~$0.3bn for environmental capex (FY basis) -
downstream
0.1 ~$0.1bn in 2018
optimisation in Europe
and HAV in Canada & • EC approval May 2018; Completion extended to Sept 2018
Europe
0.3 • Mexico: $1.0bn three-year investment for construction of a new 2.5Mt
HSM
• High value return project improved HAV mix
• Capex investment of ~$350m in 2018 commenced
ILVA capex reduced by • Increase capability to serve domestic Mexican industry
$100m due to completion
0.3 delay
Project to start in 2019
• Brazil: 3Yr investment to expand rolling capacity construction of a
2.8 0.1 new 700kt CAL and CGL combiline
• Investment to serve domestic/Latin American markets
FY17 2017 Other Mexico ILVA Forex FY18F
• Strengthening ArcelorMittal’s position in automotive and construction
carry strategic
through Advanced High Strength Steel products (AHSS)
over projects
• Project completion expected 2021
Capitalising on high-return opportunities; Capex of $3.7bn in 2018
Note: HD refers to hot dipped; CR refers to cold rolled coil; CAL refers to continuous annealing line and CGL refers to continuous galvanising line
18Section 2 FINANCIALS
Significantly improved results in 1H’18
                                                               EBITDA progression ($ billion)
    • EBITDA +28.6% YoY to $5.6bn                                                  +107%
                                                                                                   5.6
    • Steel shipments +1.3% YoY to                                                   4.3
      43.1Mt                                                           2.7

    • Marketable iron ore shipments
      +5.4% YoY to 19.1Mt                                          1H’16            1H’17       1H’18

                                                               Net income ($ billion)
    • Net income +31.5% YoY to $3.1bn
                                                                                   +31.5%

    • Working capital investment of                                                          3.1

      $3.1bn reflecting stronger markets                                     2.3

    • Net debt down to $10.5bn
                                                                        1H’17               1H’18

                                      Significantly improved results
Note: YoY refers to 1H’18 vs. 1H’17
                                                                                                         20
Improved steel segments performance YoY
• Steel-only EBITDA up +39.1% YoY primarily due to Steel-only EBITDA ($bn) and EBITDA/t ($/t)
positive price-cost effect (PCE) and higher steel +39.1%
shipment volumes (+1.3%) 4.9
• 1H’18 steel-only EBITDA/t increased to $114/t from 3.5
$83/t in 1H’17 $114/t
1H’18 vs. 1H’17 highlights $83/t
• ACIS: EBITDA doubled YoY Positive PCE offset in
part by lower volumes (-6.1%) (Ukraine planned and 1H’17 1H’18
unplanned maintenance)
1H’17 to 1H’18 steel-only EBITDA ($bn)
• Brazil: EBITDA +81.9% YoY Positive PCE and
0.4 0.1 4.9
higher volumes (+9.6%)
0.3
• NAFTA: EBITDA +19.6% YoY Positive PCE and
0.4
higher volumes (+3.0%)
0.2
• Europe: EBITDA +18.3% YoY Positive PCE and 3.5
higher volumes (+2.6%)
1H’17 NAFTA Brazil Europe ACIS Others 1H’18
Steel-only EBITDA improvement across all segments
Note: YoY refers to 1H’18 vs. 1H’17
21Mining performance
EBITDA ($m)
• Performance: 1H’18 EBITDA declined 18.1% YoY -18.1%
due to lower seaborne iron ore market prices (-5.7%) 799
654
and lower market priced coal shipments offset in part
by higher market priced iron ore shipments (+5.4%)
• Growth: Market priced iron ore shipments volume on
track to grow ~10% in 2018
1H’17 1H’18
➢ Liberia: Feasibility study launched to identify the
optimal concentration solution in a phased
Iron ore price ($/t)**
approach for utilising Tokadeh ores; result
expected by the end of 2018
-5.7%
• Focus on quality: Strategy to maximise value in use 74.4
through product quality, service and delivery
70.2
• Cost: FCF breakeven point maintained at $40/t*
1H’17 1H’18
Mining profitability positively impacted by higher shipments; focus on quality and cost
* CFR China 62% Fe ** Index of spot market Iron Ore prices delivered to China, normalized to Qingdao and 62% Fe US $ per tonne Daily 22Cash needs of the business
Cash needs of business ($ billion)
• Cash needs of business* in 2018 of $5.8
billion increase of $0.2 billion vs.
previous estimate driven by: 5.6 5.8
a) Lower CAPEX (decrease from $3.8bn to $3.7bn 1.2 1.5 Taxes, pension and other**
reflecting delay in anticipated ILVA capex) 0.6 0.6 Net interest
b) Other cash needs to increase by $0.3bn** due
to expected increases in cash taxes driven by
3.8 3.7 Capex
improved earnings
Working capital requirements to be driven by
market conditions 2018F 2018F
previous revised
guidance guidance
ArcelorMittal remains focussed on controlling its cash requirements
* Cash needs of the business defined as: capex, net interest, cash taxes, pensions and other cash costs but excluding working capital investment and exceptional items. (Exceptional items: In July 2018, as a
result of a settlement process, the Company and the Federal Cartel Office reached agreement as to a €118 million ($146 million) fine to be paid by ArcelorMittal Commercial Long Deutschland GmbH ending
the investigation as concerns the ArcelorMittal entities ** Estimates for cash taxes in 2018 have been updated to reflect latest consensus forecast (previous estimate based on 2017 taxable profit)
23Liquidity and debt maturity profile
Liquidity at Jun 30, 2018 ($ billion) Debt maturities at Jun 30, 2018 ($ billion)
8.6
Other loans Commercial paper Bonds
0.5
Cash 3.1
2.0
0.2
0.4 0.2
2.8
Unused credit lines 5.5 0.4
0.1 1.9
1.5
1.3 1.3
0.9
Liquidity at 2018 2019 2020 2021 2022 ≥2023
Jun 30, 2018
Liquidity lines: Debt maturity: Ratings*:
• $5.5bn lines of credit refinanced and • Continued strong liquidity • S&P: BBB-, stable outlook
extended in Dec 2016; two tranches: • Average debt maturity 4.9 Yrs • Moody’s: Baa3, stable outlook
• $2.3bn matures Dec 2019 • Fitch: BBB-, stable outlook
• $3.2bn matures Dec 2021
Investment grade rated by all three rating agencies
* Investment grade credit rating upgrades: S&P in February 2018, Moody’s in June 2018 and Fitch in July 2018 24Section 3 ILVA
ILVA – a tier 1 steel asset
• ILVA is the perfect opportunity for ArcelorMittal                                                                                                                      97Mt
                                                                                                                                                                  Total European Flat
   – Italy is the 2nd largest steel consuming                                                   Novi Ligure: Cold rolling mill to serve end-
                                                                                               users customers (e.g. packaging, white goods)
                                                                                                                                                                   Steel demand in
                                                                                                                                                                         2015
     country in Europe (Mt)
   – Large scale, underperforming asset requiring
     turnaround
   – Significant cost improvement potential and
     synergies identified
   – Opportunity to leverage AM strengths in R&D
     and product leadership and service                                                                                                                                Taranto

   – Ilva will be re-established as a tier one supplier
     to European & Italian customers                                                                  Genova: Cold rolling, hot dip galvanising
                                                                                                                                                   Taranto: Integrated plant for production
                                                                                                                                                  and sale of HRC, plates, pipes and tubes
                                                                                                              and tin plate capacities

• Minimal Balance sheet impact, EBITDA accretive
  Year 1
• EC Merger clearance received: This approval its
  subject to the sale of an agreed package of remedy
  assets and that process is now underway.
• Completion extended to Sept 15, 2018 to conclude
  with the new Italian government

                         ILVA is a strong fit within ArcelorMittal’s existing business & strategy
Source: World Steel, Steel Statistical Yearbook 2015; Notes: *Iberia defined as Spain + Portugal                                                                                          26
Our vision for ILVA
ILVA Today ILVA’s Future
• Become a world-class player in terms
• Significant environmental issues – of competitiveness, sustainability,
need to bring ILVA up to and beyond EU environmental performance, value-add
environmental standards
• Leading presence in Italy, adding
• Industrial challenge: investment and value to the Italian industrial fabric
expertise to improve operational
performance of ILVA’s assets • A company recognised for
environmental performance
• Poor financial performance: material excellence: emissions to be reduced to
decline in revenue since 2011, loss- best practice levels, in line with and
making for the past 4 years beyond European environmental
• Low share of high-value added steels standards and legislation
in the portfolio of ILVA • A sustainably profitable company:
• Need to rebuild client confidence: one that creates value for all
product quality, innovation, supply chain stakeholders, and the Italian economy
A clear vision of long-term, sustainable success for ILVA
27Investment plan to revitalise ILVA
CAPEX commitments (€bn)
• €1.15bn environmental investment
plan to materially improve
0.3 performance, including:
– €0.3bn stock pile coverage
1.15 – €0.2bn investment at coke ovens
– €0.2bn in waste water treatment
– €0.3bn environmental remediation
2.1 (clean-up) which will be financed with
2.4
funds seized from the Riva Group
• €1.25bn industrial investment plan to
1.25 rapidly restore and improve:
– ‘catch-up’ capex for delayed
maintenance
– capex program for blast furnaces
Industrial Environmental Total CAPEX Riva Funds Net CAPEX and steel plants
utilised
– includes full €0.2bn re-vamping of
BF#5
Commitment to invest €2.4 billion
28ILVA impact on ArcelorMittal financials
• Following completion of transaction, ArcelorMittal will fully consolidate ILVA
• Purchase price of €1.8bn, will be recognized on the BS as a payable, reduced by
the quarterly instalments of €45mn that will flow through investing activities in CF
• New ILVA will be transferred with circa €1bn of net working capital and free of long
term liabilities and financial debt
• New ILVA will be transferred to ArcelorMittal with a re-calibrated labor force
• ArcelorMittal will immediately commence the environmental capex plan and other
investments
• ILVA is expected to be accretive to ArcelorMittal EBITDA in Year 1 and
accretive to ArcelorMittal cash flow in Year 3 (based on 2016 steel spreads)
On completion ILVA will be fully consolidated by ArcelorMittal
29Section 4 STEEL INVESTMENTS
Votorantim acquisition completed
    - creates new Brazil Longs market leader
•    Consolidating the long products market in Brazil by combining Votorantim into
     our business with combined annual crude steel capacity of 5.1Mt.
•    ArcelorMittal becomes long product market leader in Brazil absorbing 12%
                                                                                           Barra Mansa
     market share
•    Combined businesses production facilities are geographically complementary,           Resende

     enabling higher service level to customers, economies of scale, higher utilization
     and efficiencies.
•    ~$110m of identified synergies to drive value creation
ArcelorMittal & Votorantim long businesses        Combined operating footprint            ~$110m synergies
                                                  crude steel capacity (Mt)
                                                                                          ✓   Commercial
                         Minas Gerais
                                                                                          ✓   Manufacturing
                                Monelevade
                                                 Votorantim                               ✓   Procurement
                                 Juiz de Fora
                                                                                          ✓   Logistics
                         Rio de Janeiro
                                                              5.1MT                       ✓   SG&A
         Sao Paulo
                               Piracicaba                                 ArcelorMittal

                             Barra Mansa plant
                                 Resende plant
      Unique opportunity to strengthen AM’s presence in one of the premier emerging markets
                                                                                                              31
Disciplined capital allocation focused on value
driven strategic initiatives: Mexico HSM
• US$1.0bn 3Yr investment commitment
Construction of a new 2.5Mt hot strip mill
• Investments to sustain the competitiveness of
mining operations
• Modernizing its existing asset base
• Expected capex of ~350m in 2018
• In-line with Action 2020 plan Project
completion expected in 2020 ArcelorMittal Mexico:
• Current Status: • Current production 4Mt increasing to ~5.3Mt
(2.5Mt flat; 1.8Mt long and
No.1Mt semi-finished
3SP: New #2
• OEM long lead equipment purchasing slabs)
complete Caster
Indiana Harbor • Vertically integrated with flat and long product
• Fabrication proceedingPlant
on schedule
capabilities
• Site handover to OEM complete. Deep
foundation works ongoing. • ArcelorMittal Lazaro Cardenas’s raw materials
and slabs shipped through a dedicated port
• OEM basic engineering 100% complete facility (Mexico’s largest bulk handling port)
• Detail engineering proceeding on schedule
Mexico currently heavily reliant on imports of value-added steel; high growth expected
32• 3 year investment to expand rolling capacity increase hot dipped / cold rolled coil
capacity and construction of a new 700kt continuous annealing line (CAL) and
continuous galvanising line (CGL) combiline
• Project scope
• Investment to sustain ArcelorMittal Brazil growth
strategy in cold rolled and coated flat products to
serve domestic and broader Latin American markets
• Strengthening ArcelorMittal’s position in automotive
and construction through Advanced High Strength
Steel products (AHSS) No. 3SP: New #2
• New CAL and CGL combiline to address a wide Caster
Indiana
range of products andHarbor
applications
Plant to maximize site
• Optimization of current facilities
capacity and competitiveness; utilizing
comprehensive digital and automation technology New CAL/CGL line
• Project completion expected 2021
Growing high added value products in one of the most promising markets
33Section 5 MACRO HIGHLIGHTS
Trade cases: Ongoing focus
US EUROPE
• All key flat rolled steel products AD/CVD cases have • All key flat rolled steel products Anti-dumping and
been implemented countervailing duty cases have been implemented
• The DOC made final affirmative determinations in the anti- • Monitoring for unfairly traded imports ongoing
circumvention investigations for CRC & CORE imported
(through Vietnam) on May 16, 2018 Safeguard duties
• On June 12, 2018, the US industry filed anti-circumvention
petitions with DOC for CRC and CORE imported from • On July 19, 2018 EU commission initiated provisional
Korea and Taiwan (through Vietnam) safeguard duties on 23 products (5 excluded from
original investigation) with a maximum duration of 200
Section 232 days
• 100% quota based on average imports between 2015-
• 25% tariffs imposed on all steel product categories began
2017 export volumes implemented
on March 23, 2018
• The tariff rate quotas in operation for 200 calendar
• 25% tariffs imposed on steel products in Europe, Canada
days (4 Feb’19) set at pro-rata level to the annual
& Mexico effective June 1, 2018 with following exceptions:
figure
• South Korea: Quota of 70% of 2015-2017 average export
• Imports exceeding the quotas face a 25% tariff
volumes into US
• For countries which have AD/CVD duties in place, will
• Brazil: Quota of 2015-2017 average export volumes into
continue to be imposed during the quota period; Once
US 70% for finished products; 100% for semi-
quota reached higher of AD/CVD or 25% tariffs will
finished products
apply
• Argentina: Quota of 135% of 2015-2017 average exports
• Certain 'developing' countries* with a share of imports
• Australia completely exempt from tariffs and quotas ofGlobal ASC rates
Global apparent steel consumption (ASC)* (million US and European apparent steel consumption
tonnes per month) (ASC)* (million tonnes per month)
China Developing ex-China Developed US ASC (GSM) EU28
70 17
65
15
60
55 13
50
11
45
9
40
35 7
30
5
25 (latest data point: May-2018)
(latest data point: May-2018)
20 3
• Global ASC +6.6% in 2Q’18 vs. 1Q’18 • US ASC +4.5% in 2Q’18 vs. 1Q’18
• Global ASC +4.6% in 2Q’18 vs. 2Q’17 • US ASC +3.0% in 2Q’18 vs. 2Q’17
• Global ASC +2.7% in 1H’18 vs. 1H’17 • US ASC +2.9% in 1H’18 vs. 1H’17
• China ASC +10.7% in 2Q’18 vs. 1Q’18 • EU ASC -3.5% in 2Q’18 vs. 1Q’18
• China ASC +6.0% in 2Q’18 vs. 2Q’17 • EU ASC +3.0% in 2Q’18 vs. 2Q’17
• China ASC +3.1% in 1H’18 vs. 1H’17 • EU ASC +3.4% in 1H’18 vs. 1H’17
Global ASC improvement of +2.7% 1H’18 vs 1H’17
* Source: AISI, Eurofer and ArcelorMittal estimates 36Construction markets in developed market
United States US residential and non-residential construction
indicators (SAAR) $bn*
• Construction spending has maintained its strong start Residential Non residential
since the beginning of the year. As of May 2018, 700
construction spending reached a record high 600
seasonally adjusted annual rate (SAAR), up +5.2%
over 2017 average (SAAR) 500
• Residential construction spending was up +7.2% vs. 400
2017 average and +21.1% vs. 2016, while non- 300
residential construction spending reached a record (latest data point: May-2018)
high in May 2018 up +3.7% vs. 2017 average 200
• The American Institute of Architects are projecting a
+4% increase in total construction spending in 2018 Eurozone and US construction indicators**
Europe 65 Architecture Billings Index (USA) Eurozone construction PMI
• Construction increased 2.6% YoY in May 2018 after a 60
+3.5% increase in 2017 and +1.8% in 2016 55
• Growth in construction was led by Eastern European 50
countries, particularly Poland, Hungary and Slovenia, 45
all growing double digits in May, YoY 40
• Overall, construction activity in H1’18 was supported 35
(latest data point: Jun-2018)
by robust GDP growth at +2.3% YoY 30
• Eurozone construction PMI remained >50 since end-
2016
Construction growth continues during H1 2018
* Source: US Census Bureau; ** Source: Markit and The American Institute of Architects
37China overview
China China construction % change YoY, (3mth moving av.)*
• Economic growth has begun to gradually decelerate to 100%
Residential floor space sold (6 month lag)
6.7% YoY in 2Q’18 reflecting the impacts of tighter
80%
domestic financial policy Residential floor space started
60%
• Any disruptions to US-China trade has the potential to
negatively impact Chinese steel demand given that 40%
~20% of the ca. 40Mt of steel contained in metal 20%
product exports (machinery, domestic appliances) from 0%
China goes to the US
-20%
• However, real estate sales and new housing starts have (latest data point: Jun-2018)
-40%
continued to grow (+3.3% and +11.8% YoY 1H’18 2008 2009 2010 2011 2012 2013 2014 2015 2016 2017 2018
respectively). While sales should moderate in time, the
strength of new starts should keep construction Crude steel finished production and inventory (mmt)
Steel inventory at warehouses (RHS) (latest data point: May-2018)
demand robust during 2H’18 75
Steel inventory at mills (RHS)
25
• Supported by growth in auto, domestic appliances and Finished steel production (LHS)
20
machinery and without a drag from real estate, ASC 65
forecast to continue to grow in 2018 within a range of 15
+1% to +2% YoY 55
• Chinese steel production has been strong during 10
May/June, but there is no evidence of over-production 45
5
in the inventory data (both warehouse and mills
inventory continue to decline) suggesting that real 35 0
demand has been robust 2007 2008 2009 2010 2011 2012 2013 2014 2015 2016 2017 2018
2018 China ASC demand growth increased to +1% to +2% (from -0.5% to +0.5%)
* Source: China National Bureau of Statistics, China Real Estate Index System (via Haver) and ArcelorMittal estimates; Source: NBS, CISA, WSA, Mysteel, ArcelorMittal Strategy estimates 38Regional inventories
German inventories (000 Mt) US service centre total steel inventories (000 Mt)
Germany Stocks (latest data point: Jun-2018) (latest data point: Jun-2018)
5.0 13,000 3.4
1,400 Months supply (RHS) 12,000 USA (MSCI) 3.2
4.0 11,000
1,200 Months Supply (RHS) 3.0
10,000
3.0 2.8
1,000 9,000
2.6
800 2.0 8,000
7,000 2.4
600 1.0
6,000 2.2
400 0.0 5,000 2.0
Brazil service centre inventories (000 Mt) China service centre inventories* (Mt/mth) with ASC%
Flat stocks at service centres
1,400 7.0 Flat and long (latest data point: Jun-2018)
Months Supply (RHS) (latest data point: Jun-2018) 25 50%
% of ASC (RHS)
1,200 6.0
20 40%
1,000 5.0
15 30%
800 4.0
10 20%
600 3.0
400 2.0 5 10%
200 1.0 0 0%
Low/balanced inventory levels in key regions
*Source: WSA, Mysteel, ArcelorMittal Strategy estimates 39Global steel demand for 2018 remains solid
Global ASC 2018 vs. 2017* ArcelorMittal ASC demand estimates 2018
• Global apparent steel consumption to
US** +2.0% to +3.0% Revised up from
grow by +2.0% to +3.0% in 2018 vs. 2017 +1.5% to +2.5%
• Healthy demand backdrop maintained in Revised up from
EU28 +2.0% to +3.0%
Europe and US +1.0% to +2.0%
• China: Positive demand growth due to
China +1.0% to +2.0% Revised up from
better than expected real estate demand, –0.5% to +0.5%
ongoing strength in machinery and
automotive offset by slowdown in Brazil +5.5% to +6.5%
Revised down from
infrastructure +6.5% to +7.5%
• Brazil: Demand slightly moderated to CIS +2.0% to +3.0%
reflect impacts of nationwide truck strike
and cautions sentiment ahead of elections Global ex China +3.0% to +4.0%
• CIS: Reflecting strong consumption,
particularly a rebound in auto sales and Global +2.0% to +3.0% Revised up from
+1.5% to +2.5%
production in Russia
2018 Global ASC growth expectation increased to +2.0% to +3.0%; positive outlook for 2018
Source: *ArcelorMittal estimates ** Includes tubular demand. 40China addressing excess capacity; more needs to be
done
• Chinese government committed to tackle overcapacity and
environmental issues 115Mt permanent capacity
closed further 25Mt
• Capacity reduction ahead of expectations: net capacity targeted in 2018
reduction achieved vs. 140Mt target
• Steel replacement policy in favour of EAF v BF; no new Additional ~120Mt illegal
capacity to be built ratio 1:1 for EAF and 1:1.25 for BF- induction furnace capacity
closed
BOF
• Industry operating at high rates of capacity utilisation
higher domestic steel spreads Industry capacity
utilization
• Stronger domestic fundamentals plus global trade ~85-90% today
restrictions reduced incentive to export
• “Winter shutdowns” supporting fundamentals through
Steel exports reduced
seasonally weaker demand period
• 3yr “Blue Sky Defense War” should have similar impact
to winter 2017/2018 constraints
• Domestic capacity must
Supply side reflectprogressing
reform demand outlook
yet global overcapacity still a concern
41Lower Chinese exports
(latest data point: Jun-2018)
12
Exports of steel products
Imports of steel products
10
Net-trade
8
6
4
2
0
-2
-4
2007 2008 2009 2010 2011 2012 2013 2014 2015 2016 2017 2018
• Jun’18 finished steel exports of 6.9Mt (~71Mt YTD annualized), up ~1% MoM,
up ~2% vs Jun’17 6.8Mt
• Production cuts should constrain exports in short term
1H’18 annualized Chinese exports ~71Mt vs 76Mt in 2017
Source: ArcelorMittal Corporate Strategy team analysis Highly Restricted
42
42Section 6 AUTOMOTIVE
No1 in automotive steel: Maintaining
leadership position
• ArcelorMittal is the global leader in steel for Tesla Model 3
automotive 40% market share in our core markets
• Global R&D platform sustains a material
competitive advantage
• Proven record of developing new products and
affordable solutions to meet OEM targets
• Advanced high strength steels used to make
vehicles lighter, safer and stronger
• Automotive business backed with capital with
ongoing investments in product capability and AM/NS Calvert
expanding our geographic footprint:
• AM/NS Calvert JV: Enhancing our NAFTA
automotive franchise
• VAMA JV in China: Auto certifications progressing
• Dofasco: Galvanizing line expansion
• Europe: AHSS investments
Group continues to invest and innovate to maintain leadership
44Global presence and reach
Automotive production facilities
Alliances & JVs
Commercial teams
R&D centres
Vehicle production 2017
> 20 M veh
> 15 M veh & < 20 M veh
> 10 M veh & < 15 M veh
> 5 M veh & < 10 M veh
> 2.5 M veh & < 5 M veh
> 1 M veh & < 2.5 M veh
< 1 M veh
Global supplier with increasing emerging market exposure
Source: LMC figures for Western and Eastern Europe and Russia; IHS figures for all other regions; personal cars and light commercial vehicles < 6t 45Automotive growth in developed world
USA / Canada and EU28 + Turkey vehicles production
million units
• USA and Canadian automotive
23
20.5
production stabilized
21
19 • Stability supported by replacement
17
13.2
(average age of fleet 11.5 years),
15
continued economic and population
13
11
growth
9
• EU28 and Turkey production reached
7
record highs in 2017 and further growth
5
expected
USA+CANADA (LMC) USA+CANADA (IHS) EU28+Turkey (LMC)
USA/Canadian production stable, EU28 & Turkey continue to recover
46Automotive emerging market growth
China vehicle production (‘000s)
40,000 33,506
35,000
China • China production to grow steadily by +6mvh
27,636
30,000
25,000 in 2017 to ~33mvh by 2025
20,000
15,000 • India production to increase ~80% by 2025
10,000
5,000 (from 4.5mvh in 2017 to 8mvh in 2025)
0
• Mexico production is expected to increase
Brazil, India, Russia & Mexico vehicle production (‘000’s) by 6.3% (2017 vs 2025)
9,000
8,000
Russia India Brazil Mexico 8,027 • Brazil production growth expected to
7,000
6,000
continue and reach 3.9mvh in 2025
4,456 4,193
5,000
4,000 • Russia production is expected to recover
3,946
3,000 3,928
2,000 2,637 and reach 2013 level in 2022
1,000 2,327
1,446
0
Strong growth expected in India, China and Brazi
Source: IHS 47ArcelorMittal’s S-in motion®
Demonstrating the weight saving potential of new products
ArcelorMittal generic steel solutions includes body-in-white, closures, and chassis parts
From steel provider to global automotive solutions provider
48Continuous innovation
Jet Vapor Deposition (JVD) line : Jetgal ® Steel remains material of choice
• JVD line is a breakthrough technology to
produce Jetgal®, a new coating for AHSS steels
for automotive industry
New press hardenable steels (PHS) Usibor®2000 &
Ductibor®1000
• Bring immediate possibilities of 10% weight
saving on average compared to conventional
coated PHS produced by ArcelorMittal
• Electric vehicles (EV) to favour lightweight
3rd Generation AHSS products designs (similar to traditional vehicles)
CR980HF & CR1180HF • EV employ AHSS to achieve range goals
• HF / Fortiform® provide additional weight
reduction due to enhanced mechanical properties
compared to conventional AHSS
The mass-market Tesla Model 3 body and
chassis is a blend of steel and aluminium,
Electrical steels
unlike the Tesla Model S which is an aluminium
iCARe®, 2nd Generation body (Source: Tesla website+)
• Family of electrical steels for electrified powertrain
+ https://www.tesla.com/compare
optimization and enhanced machine performance,
Save*, Torque** and Speed*** are specifically http://automotive.arcelormittal.com/ElectricVehiclesImpactOnSteel
designed for a typical electric automotive
application.
Steel to remain material of choice for automotive
-
* Save (Steels with very low losses): Ideal for the efficiency of the electrical machine. Their key role is maximize the use of the current coming from the battery.
** Torque (Steels with high permeability): They achieve the highest levels of mechanical power output for a motor or current supply for a generator
*** Speed (Steels for high speed rotors): Specific high strength electrical steels which maintain high level of magnetic performance. They allow the machine to be more compact and have a higher power density. 49Continued investment in R&D supports
Portfolio of Next Generation Auto Steels
Fortiform® Third-generation UHSS for cold MartINsite® A family of cold rolled fully
martensitic steels with current
HF Grades stamping. Fortiform® and HF steel
grades allow OEMs to realize tensile strengths from 900 to 1700
lightweight high-strength structural MPa. ArcelorMittal’s martINsite®
elements using cold forming cold roll family of fully martensitic
methods such as stamping. steels is perfect for anti-intrusion
Commercially launched in Europe parts such as bumper and door
in 2014 and available in North beams. Some are also available
America at Calvert undergoing in with an electrogalvanized
customer qualifications coating (ArcelorMittal’s
Electrosite® family of martensitic
steels) or with Jetgal®.
Press hardenable steels (PHS) / hot JVD is a breakthrough process, In
Usibor® 2000 stamping steels offer strengths up to JVD® -Jetgal® production and product
development.
2000 MPa. Usibor® 2000 and
Ductibor®1000 Ductibor® 1000 can also be Jetskin™ Jetgal®: JVD zinc coating applied
combined thanks to laser welded to steel grades for the automotive
blanks (LWB) to reduce weight while industry. Developed for steels
achieving optimal crash behavior. including UHSS Fortiform®;
Both currently available in Europe; Jetskin™: JVD zinc coating
Usibor ® 2000 is commercially applied to steel grades for
available in Europe and available for industrial applications such as
qualification testing in North America household appliances, doors,
; Ductibor® 1000 is commercially drums and interior building
available in Europe and Nafta applications.
Widest offering of AHSS steel grades which can be implemented into production vehicles
502019 CHEVY SILVERADO REDUCES WEIGHT
AND INCREASES STRENGTH WITH AHSS
Chevrolet claims its all-new 2019 Silverado is 450 pounds (204 kg)
lighter due to the extensive use of mixed materials.
For example, a higher-grade alloy is used in the
roll-formed, high-strength-steel bed floor,
contributing to a bed that is more functional
and lighter weight.
The safety cage features significant use of
advanced high strength steels, each
tailored for the specific application.
“This use of mixed materials and advanced
manufacturing is evident throughout the
Silverado, resulting in a significant reduction in
total vehicle weight and improved performance
in many measures.”
Source: Chevrolet’s press release about its all-new Silverado, December 2017.
2019 Chevrolet Silverado reduces weight through AHSS
51AUTOMOTIVE INDUSTRY LEADERSHIP: AUDI
SWITCHED BACK TO STEEL FOR ITS NEW A8
MODEL
• Audi switched back to steel for its
2018 A8 model, with a body
structure made up of more than
40% steel including 17% PHS
New Audi A8 2018 model
“There will be no cars made of aluminium alone in the future.
Press hardened steels (PHS) will play a special role in this development.
PHS grades are at the core of a car’s occupant cell, which
protects the driver and passengers in case of a collision.
If you compare the stiffness-weight ratio,
PHS is currently ahead of aluminium.”
Dr Bernd Mlekusch, head of Audi’s Leichtbauzentrum
Leveraging R&D for new products, solutions and processes
52VOLVO XC40, 2018 EUROPEAN CAR OF THE
YEAR, MAKES USE OF AHSS AND BORON
STEELS FOR SAFETY
The safety cage around the occupants of Volvo’s new XC40 is almost
entirely made from steel including hot-formed boron grades.
The steel cage provides maximum occupant protection in all types of crash
scenarios.
Volvo Car Group President & CEO Håkan AHSS makes up most of the XC40’s safety cage
Samuelsson at the European Car of the [Images courtesy Volvo Car Group]
Year award ceremony
Hot-formed boron steel accounts for 20% of the XC40’s total body weight
53VAMA greenfield JV facility in China
• 1.5 MT state-of-the-art production facility
VAMA: Valin ArcelorMittal Automotive target
• Well-positioned to serve growing automotive market areas and markets
• China 2017 output 27.6mvh (IHS) +3.2% YoY
• VAMA has successfully completed homologation on FAW-VW &
BMW
UHSS/AHSS with key tier 1 auto OEMs (~60% complete)
Daimler &
Nissan
Latest development:
• Strong sales & order book for licensed USIBOR 1500 Beijing
• VAMA started the first commercial supply of exposed
products in 4Q 2017
• Start of production ceremony for downstream ATSs BYD, Changan,
Geely, VW, GM, KIA,
SAIC & Chery
Suzuki, CFMA &
project in 4Q 2017 FAW-VW Shanghai
Changfeng, Fiat,
DPCA, Dongfeng,
VAMA Honda, JMC & Suzuki
Loudi
SAIC, Toyota, GM,
Honda, Nissan & BYD Guangzhou
Furnace of CGL and CAL on both sides VAMA HQ in Loudi city, Hunan Province • Central office in Changsha with satellite offices in proximity
to decision making centers of VAMA’s customers
VAMA well positioned to supply growing Chinese auto market
BYD: Build Your Dreams; CFMA: Changan Ford Mazda Automobile; SAIC: Shanghai Automotive Industry Corporation; JMC: Jiangling Motors Corporation 54INDIA auto JV with SAIL
Passenger vehicles AHSS++ penetration
production (%) INDIA AUTO OUTLOOK
Million
30 ▪ 2017-2025: India passenger vehicle segment is
28% expected to grow at 8-8.5% CAGR
10
▪ New safety regulation would accelerate
25 penetration of AHSS+ UHSS steel in passenger
23%
8.2 vehicles and LCV to meet safety norms*
8
2.2 20 PV
exports INDIA AUTO JV with SAIL
6 5.8 ▪ ArcelorMittal & SAIL entered into a MoU on May
14% 15 22, 2015 for setting up an automotive steel
1.0
facility under a joint venture agreement.
4 10% 3.8 ▪ Venture to offer technologically advanced steel
3.2 0.6 5.1 10 PV
domestic products to rapidly growing automotive industry
0.5 4.0 in India.
2 2.2 2.7 5 ▪ Feasibility study currently underway for 1.5Mtpa
in phase 1 incl. PLTCM, CAL & CGL (Pickling
0.6 0.5 0.7 0.9 LCV Line & Tandem Cold Mill, Continuous Annealing
0 0 Line, Continuous Galv. Line)
2010 2015 2020 2025
2.4 2.7 4.2 5.8
Medium to high grade steel demand from auto sector, MT
Robust automotive growth / new regulation will drive demand for high grade automotive steel
*(BNVSAP) & emission standards (BS VI): Bharat New Vehicle Safety Assessment Program is a proposed new car assessment program for India; BS-VI is the last norm on emission standard (Bharat Stage Emission Standards BSES) 55Section 7 GROUP HIGHLIGHTS
Group performance 1H’18 v 1H’17
1H’18 v 1H’17 analysis:                                                EBITDA ($ Millions) and EBITDA/t
                                                                         $98/t      $118/t          $141/t   $102/t            $130/t
 • Crude steel production decreased by 0.6% to 46.5 Mt with
   decreases in ACIS (-9.6%) and NAFTA (-1.4%) offset in part by                           +22.3%
   increase in BRAZIL (+9.0%). Europe remained stable YoY.                                                            +28.6%
 • Steel shipments for 1H’18 increased 1.3% to 43.1Mt, primarily due                2,512       3,073
                                                                          2,112                                               5,585
                                                                                                              4,343
   to higher steel shipments in Brazil (+9.6%), NAFTA (+3.0%), and
                                                                         2Q’17      1Q’18       2Q’18         1H’17           1H’18
   Europe (+2.6%) offset by ACIS (-6.1%) (impacted by planned and
   unplanned maintenance in Ukraine).                                  Average steel selling price $/t
 • Sales for 1H’18 increased by 17.6% to $39.2bn, primarily due to                          +2.1%                     +16.7%
   higher average steel selling prices (+16.7%) and higher steel
   shipments (+1.3%).                                                      680       768            784        665             776
 • EBITDA improved 28.6% primarily due higher volumes and ASP in
   the steel businesses.
                                                                          2Q’17     1Q’18       2Q’18         1H’17           1H’18

                                                                       Steel shipments (000’t)
                                                                                            +1.8%                     +1.3%

                                                                         21,483    21,349       21,731       42,541        43,080

                                                                          2Q’17     1Q’18       2Q’18         1H’17           1H’18

                                               Group profitability increased YoY
                                                                                                                                     57
Group performance 2Q’18 v 1Q’18
2Q’18 v 1Q’18 analysis: EBITDA ($ Millions) and EBITDA/t
• Crude steel production decreased by 0.6% to 23.2Mt with $98/t $118/t $141/t $102/t $130/t
decreases in Europe (-2.0%) and ACIS (-9.2%) offset in part by +22.3%
increases in NAFTA (+1.4%) and Brazil (+11.1%). +28.6%
• Steel shipments in 2Q’18 were 1.8% higher at 21.7Mt primarily due 2,512 3,073
2,112 5,585
to higher steel shipments in Brazil (+14.0%) (including the scope 4,343
effect of the Votorantim acquisition net of divestments (+0.2Mt) an 2Q’17 1Q’18 2Q’18 1H’17 1H’18
adversely impacted from a nationwide truck strike (0.1Mt)), NAFTA
Average steel selling price $/t
(+4.4%), and ACIS (+1.0%) (despite negative impact of unplanned +2.1% +16.7%
maintenance in Ukraine), offset in part by lower steel shipments in
Europe (-1.7%) 768 784 776
680 665
• Sales in 2Q’18 were 4.2% higher at $20bn primarily due to higher
ASP (+2.1%), higher steel shipments (+1.8%), and higher market- 2Q’17 1Q’18 2Q’18 1H’17 1H’18
priced iron ore shipments (+9.3%), offset in part by lower seaborne
Steel shipments (000’t)
iron ore reference prices (-11.3%).
+1.8% +1.3%
• EBITDA improved 22.3% primarily due to positive price cost effect
and higher steel volumes.
21,483 21,349 21,731 42,541 43,080
2Q’17 1Q’18 2Q’18 1H’17 1H’18
Group profitability increased QoQ
58NAFTA performance 2Q’18 v 1Q’18
2Q’18 v 1Q’18 analysis: EBITDA ($ Millions) and EBITDA/t
$93/t $79/t $136/t $93/t $108/t
• NAFTA segment crude steel production increased by 1.4% to
5.9Mt in 2Q’18. +79.8%
• Steel shipments increased by 4.4% to 5.8Mt, driven primarily by 19.6%
improved market demand in the US. 791
506 440 1,030 1,231
• Sales in 2Q’18 increased by 12.7% to $5.4bn, primarily due to
2Q’17 1Q’18 2Q’18 1H’17 1H’18
higher steel shipment volumes and higher ASP +9.4% (for both
flat products +10.0% and long products +7.9%). Average steel selling price $/t
• EBITDA in 2Q’18 increased by 79.8% to $791m primarily due to +9.4% +10.5%
significant positive price-cost effect driven by higher ASP (+9.4%)
and higher steel shipment volumes (+4.4%). 760 779 853 739 817
2Q’17 1Q’18 2Q’18 1H’17 1H’18
Steel shipments (000’t)
+4.4% +3.0%
5,419 5,559 5,803 11,029 11,362
2Q’17 1Q’18 2Q’18 1H’17 1H’18
Performance improved due to significant positive price-cost effect and higher volumes
59Improvement
NAFTA
Crude steel achievable capacity (million Mt)
16.3 100.0%
Flat 82.0%
Flat
6.2 5.6
Long Long 18.0%
USA Canada Mexico NAFTA
Number of facilities (BF and EAF)
NAFTA No. of BF No. of EAF
USA 7 2
Canada 3 4
Mexico 1 4
Total 11 10
NAFTA leading producer with 28.1Mt /pa installed capacity
Note: IH Bar facility closed in June 2015; Georgetown wire rod facility closed in August 2015, Vinton and LaPlace sold in 2Q 2016 60BRAZIL performance 2Q’18 v 1Q’18
2Q’18 v 1Q’18 analysis: EBITDA ($ Millions) and EBITDA/t
$77/t $149/t $157/t $92/t $153/t
• Brazil segment crude steel production increased by 11.1% to 3.1Mt
in 2Q’18 primarily due to an increase in long products resulting from +19.9%
+81.9%
the integration of Votorantim.
• Steel shipments in 2Q’18 increased by 14.0% to 2.8Mt, primarily 370 443 813
201 447
due to a seasonal increase in flat product steel shipments (primarily
2Q’17 1Q’18 2Q’18 1H’17 1H’18
export) and long products.
• 2Q’18 steel shipments were positively impacted by the scope effect Average steel selling price $/t
of the Votorantim acquisition net of divestments (+0.2Mt), and -3.2% +11.0%
adversely impacted by a nationwide truck strike (0.1Mt).
• Sales increased by 10.2% to $2.2bn, due to higher steel shipments 655 752 728 666 739
(+14.0%), offset in part by lower ASP (-3.2% due primarily to
2Q’17 1Q’18 2Q’18 1H’17 1H’18
exchange effects).
• EBITDA in 2Q’18 increased by 19.9% to $443m due to a positive Steel shipments (000’t)
price-cost effect and higher steel shipment volumes.
+14.0% +9.6%
2,622 2,483 2,831 4,848 5,314
2Q’17 1Q’18 2Q’18 1H’17 1H’18
Performance improved primarily due to positive price-cost effect and higher volumes
61Improvement
Brazil
Crude steel achievable capacity (million Mt) Geographical footprint and logistics
10.5 100.0%
Flat 54.0%
Flat
Monlevade
Long 46.0%
Long 1.4 Tubarao
Votorantim
Juiz de Flora
Brazil Argentina Brazil Vega
Number of facilities (BF and EAF)
Acindar
No. of BF No. of EAF
BRAZIL facilities
Flat 3 -
Flat
Long 3 6 Long
Total 6 6
The map is showing primary facilities excl. Pipes and Tubes.
Brazil leading producer with 13.3t /pa installed capacity
Note: The figures in the tables do not reflect Votorantim scope inclusion net of remedy assets sold - this change will be updated at 2018 year end.
62EUROPE performance 2Q’18 v 1Q’18
2Q’18 v 1Q’18 analysis: EBITDA ($ Millions) and EBITDA/t
$90/t $98/t $109/t $90/t $103/t
• Europe segment crude steel production decreased by 2.0% to
+9.6% +18.3%
11.0Mt in 2Q’18 primarily on account of the impact of floods in
Asturias, Spain and blast furnace reline in ArcelorMittal Zenica,
942 1,044 1,145 1,851 2,189
Bosnia.
• Steel shipments in 2Q’18 decreased by 1.7% to 10.5Mt primarily on 2Q’17 1Q’18 2Q’18 1H’17 1H’18
account of floods in Asturias, Spain and impact from rail strikes in
France.
Average steel selling price $/t
stable +18.8%
• Sales in 2Q’18 were $10.5bn, 1.1% lower as compared to 1Q’18,
with lower steel shipments. (Selling prices in local currency
698 801 800 674 800
increased by 3.1%).
• EBITDA in 2Q’18 increased by 9.6% to $1,145m primarily due to a
2Q’17 1Q’18 2Q’18 1H’1 1H’18
positive price-cost effect offset in part by lower steel shipment
volumes and foreign exchange translation impact. Steel shipments (000’t)
-1.7% +2.6%
10,466 10,697 10,516 20,674 21,213
2Q’17 1Q’18 2Q’18 1H’17 1H’18
Performance improved due to positive price-cost effect offset in part by lower volumes
63Improvement
Europe
Crude steel achievable capacity (million Mt) Geographical footprint and logistics
~ 53.0
Hamburg
100.0% Bremen EHS
Dabrowa
Duisburg
Ghent Krakow
Dunkirk Liège
Flat Ostrava
Florange
Flat 73.0% Belval; Differdange
Zenica
Galati
Asturias Fos
Long
Long 27.0%
Europe
Number of facilities (BF and EAF)
EUROPE No. of BF No. of EAF
EUROPE facilities
Flat (*) 20 5 Flat
Long
Long 5 8
Flat and Long
Total (*) 25 13
(*) Excludes 2BF’s in Florange
The map is showing primary facilities excl. Pipes and Tubes.
Europe leading producer with ~53.0Mt /pa installed capacity
Note: Following merger clearance granted by EC on May 7, 2018 for the companies acquisition if ILVA in Italy, the Company has committed to dispose of assets in the divestment package in Italy, Romania, Macedonia, Czech Republic, Luxembourg and Belgium).
The deal is expected to be concluded September 15,, 2018 an as such not reflected in the map or figures represented on the sl ide (to be updated as part of the full year 2018 reporting). 64You can also read