Short overview of the Regional Comprehensive Economic Partnership (RCEP) - BRIEFING - europa.eu
←
→
Page content transcription
If your browser does not render page correctly, please read the page content below
BRIEFING
Requested by the INTA committee

                Short overview
        of the Regional Comprehensive
         Economic Partnership (RCEP)

                   Policy Department for External Relations
                 Directorate General for External Policies of the Union
                             PE 653.625 – February 2021
                                                                          EN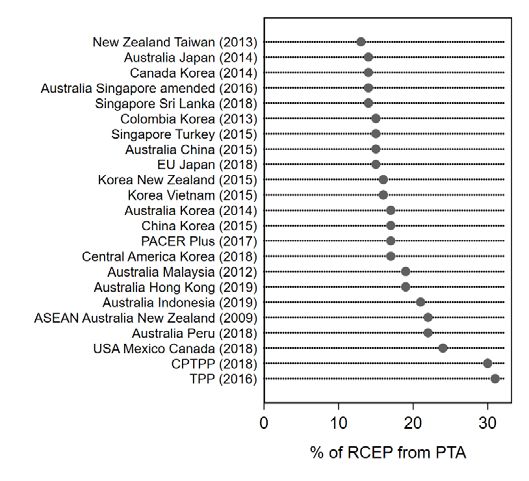
DIRECTORATE-GENERAL FOR EXTERNAL POLICIES
 POLICY DEPARTMENT

                                            BRIEFING
               Short overview of the
         Regional Comprehensive Economic
                 Partnership (RCEP)

       ABSTRACT
       15 countries signed the Regional Comprehensive Economic Partnership (RCEP) on 15
       November 2020. Upon ratification, it will become the largest preferential trade agreement
       by economic output in the world, with the potential to increase trade and integration
       among the economies of East Asia. This briefing presents the structure and the content of
       the agreement, its relationship to existing cooperation in the region, and discusses
       important economic and political implications. Several notable takeaways stand out. First,
       we highlight the economic and political significance of RCEP for the region stressing that it
       is the culmination of past efforts by East Asian countries to pursue economic integration.
       Second, we show that the agreement itself is considerably less ambitious than comparable
       agreements such as the Comprehensive and Progressive Transpacific Partnership (CPTPP)
       and European Union Free Trade Agreements with Asian countries. Third, we document that
       the final legal text itself does not seem to be dominated by any specific party. Fourth,
       despite its lack of ambition, the agreement is still expected to provide substantial trade
       gains for signatories, especially if it helps to consolidate global supply chains based in the
       region. Fifth, because of its structure, it is likely to be an important focal point for trade
       liberalization in the future providing European companies with important opportunities.

EP/EXPO/INTA/FWC/2019-01/LOT5/3/C/06                                                                    EN
February2021                                                                           © EuropeanUnion, 2021
Policy Department, Directorate-General for External Policies

This paper was requested by the European Parliament's Committee on International Trade.
English-language manuscript was completed on 9 February 2021.
© European Union, 2021
Printed in Belgium.
Authors: Joseph FRANCOIS, Manfred ELSIG
Officials Responsible: Mario DAMEN
Editorial Assistant: Balázs REISS
Feedback is welcome. Please write to: mario.damen@europarl.europa.eu.
To obtain copies, please send a request to: poldep-expo@europarl.europa.eu
This paper will be published on the European Parliament's online database, 'Think tank'.
The content of this document is the sole responsibility of the author and any opinions expressed therein do not necessarily
represent the official position of the European Parliament. It is addressed to the Members and staff of the EP for their
parliamentary work. Reproduction and translation for non-commercial purposes are authorised, provided the source is
acknowledged and the European Parliament is given prior notice and sent a copy.
ISBN: 978-92-846-7790-0 (pdf)                           ISBN: 978-92-846-7791-7 (paper)
doi: 10.2861/001684 (pdf)                               doi: 10.2861/341729 (paper)
Catalogue number: QA-02-21-155-EN-N                     Catalogue number: QA-02-21-155-EN-C (paper)
Short overview of the Regional Comprehensive Economic Partnership (RCEP)

Table of contents
1   Overview of the Agreement                                                              4
    1.1   The parties to the Agreement                                                     4
    1.2   The objectives of the Agreement                                                  8
    1.3   The structure and content of the Agreement                                       9
2   The implications of RCEP                                                             12
    2.1   The implications for the Asia-Pacific region                                   12
    2.2   Implications for Europe                                                        16
3   Annex                                                                                21
4   References                                                                           23

                                        3
Policy Department, Directorate-General for External Policies
1 Overview of the Agreement
1.1 The parties to the Agreement
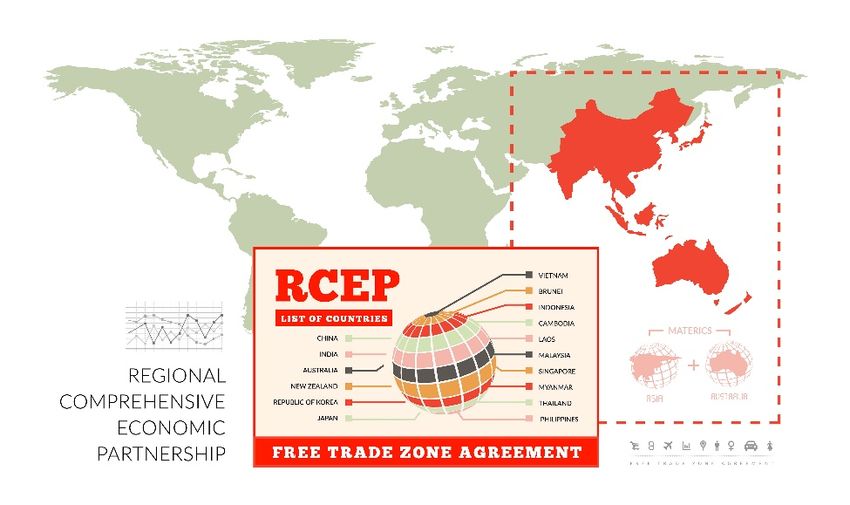
The Regional Comprehensive Economic Partnership (RCEP) is composed of 15 signatories: Australia, Brunei,
Cambodia, China, Indonesia, Japan, Laos, Malaysia, Myanmar, New Zealand, the Philippines, Singapore,
Vietnam, South Korea, and Thailand. Negotiations among the parties began in 2012 and originally included
India, which dropped out of the negotiations in 2019. The Agreement was signed on 15 November 2020.
It will enter into force 60 days after ratification by at least six countries of the Association of South East
Asian Nations (ASEAN) and three non-ASEAN countries. 1 Figure 1 shows the geographic distribution of the
RCEP parties. The Agreement itself seeks to unify and deepen economic activities among the existing ten-
member ASEAN trade bloc (shaded in blue) with five other East Asian economies, including China, Korea,
and Japan (commonly referred to as ASEAN + 3 and shaded in light blue), and Australia and New Zealand
(commonly referred to as ASEAN + 5 and shaded in purple).
Figure 1: RCEP membership
Source: Authors’ illustration.
Table 1 highlights several economic and trade-related institutional features of the RCEP parties. The
Agreement incorporates five of the six biggest economies in the region, China, Japan, South Korea,
Australia, and Indonesia, along with several mid-sized countries (Malaysia, Thailand, Singapore, Vietnam,
New Zealand, and the Philippines). The economies of Laos, Brunei, Cambodia and Myanmar are
substantially smaller. Many of the economies are already well connected through trade and investment,
both through existing economic agreements such as ASEAN, and through the growth of global supply
chains in East Asia over time. 2
1
These conditions are found in Chapter 20 article 6 of the Agreement.
2
In East Asia the development of supply chains is often referred to as the “flying geese pattern”, where early industrializers such
as Japan seek to offshore jobs to lower cost locations as their labour costs raise (see Baldwin, 2012, p. 27; Kojima, 2000).
4Short overview of the Regional Comprehensive Economic Partnership (RCEP)
China and Japan are the first and fourth largest exporters in the world respectively, and several other RCEP
countries are particularly well integrated in global trade networks including South Korea, Singapore,
Australia, Thailand, and increasingly Vietnam. Trade is also important for many of the smaller, less-
developed countries in the region, who have relatively high trade shares relative to their gross domestic
product (GDP) and who view integration in regional supply chains as a path to economic success. 3
The RCEP membership exhibits considerable economic heterogeneity, in terms of overall size, level of
development, economic structures, and resources. Moreover, the RCEP parties have also shown different
proclivities towards the signing of economic agreements in the past. Singapore, China, South Korea, Japan,
Australia, and Malaysia have been actively signing trade and investment agreements, whereas countries
such as Myanmar, Brunei, and Cambodia have rarely stepped beyond the bounds of ASEAN. Currently, four
RCEP countries have preferential trade agreements (PTAs) with the European Union (EU): Japan, Singapore,
South Korea and Vietnam. Negotiations with Australia, Indonesia, the Philippines, Thailand and New
Zealand are ongoing.4 The EU has a separate investment agreement with some RCEP countries in addition
to a PTA. In its relations with China, the EU has reached an investment agreement (in principle) in December
2020. 5
Table 1: Economic and trade-related characteristics of RCEP parties
PTA CPTPP
Country GDP Total trade PTAs BITs Income level
with EU member
Australia 1450.50 492.57 22 15 no yes High Income
Brunei 14.01 12.14 11 6 no yes High Income
Cambodia 20.92 35.42 6 16 no no Lower Middle Income
China 11537.48 4577.84 18 107 no no Upper Middle Income
Indonesia 1204.48 338.96 15 25 no no Lower Middle Income
Japan 6210.70 1426.52 18 29 yes yes High Income
Laos 13.20 12.02 10 21 no no Lower Middle Income
Malaysia 398.95 443.19 19 54 no yes Upper Middle Income
Myanmar 86.93 36.72 6 8 no no Lower Middle Income
New Zealand 191.73 81.88 17 2 no yes High Income
Philippines 360.86 183.84 12 32 no no Lower Middle Income
Singapore 335.54 750.03 27 38 yes yes High Income
Vietnam 200.86 518.18 15 48 no yes Lower Middle Income
South Korea 1482.76 1045.58 21 89 yes no High Income
Thailand 452.67 482.53 15 36 no no Upper Middle Income
Notes: GDP and trade are in billions of United States Dollars (USD). GDP, trade, and income level from the World
Bank's World Development Indicators 2019. Information on Trade Agreements are from the Design of Trade
Agreements (DESTA) data (Dür et al., 2014). Information on bilateral investment treaties (BITs) is from the Electronic
Database of Investment Treaties (EDIT) (Alschner et al., 2021). Only BITs in force included. Income levels are based
on standard World Bank categorization.
Source: Authors’ calculation.
RCEP is one of two so-called “mega-regional” trade agreements in East Asia. The other is the
Comprehensive and Progressive Agreement for Trans-Pacific Partnership (CPTPP), which came into force
in 2018, and currently counts eleven parties: Australia, Brunei, Canada, Chile, Japan, Malaysia, Mexico, New
Zealand, Peru, Singapore, and Vietnam. The CPTPP emerged from the original Trans-Pacific Partnership
3
See Petri and Plummer (2020a).
4
In this briefing, we use the terms PTA and Free Trade Agreement (FTA) interchangeably.
5
EU-China Comprehensive Agreement on Investment, https://trade.ec.europa.eu/doclib/press/index.cfm?id=2115.
5Policy Department, Directorate-General for External Policies
(TPP) after the United States (US) pulled out of the agreement following the election of Donald Trump in
2016. 6 Currently, seven RCEP members are also members of the CPTPP.
Upon entry into force, RCEP will become one of the most important trade areas in the world. Table 2
demonstrates how it compares to several other regional trade agreements. The size of the Agreement is
notable along several dimensions: first, RCEP will become the world’s largest PTA by GDP, encompassing
around 28.7 % of the world’s economic activity based on 2019 figures; second, RCEP will be the second
largest in terms of overall merchandise trade (behind only the EU), comprising nearly 27.8 % of global
merchandise trade; third, RCEP will be number one in terms of population. Thus, it is larger than the CPTPP
and is substantially bigger – across all metrics – than most other regional agreements.
Table 2: Comparing RCEP to other regional trade agreements7
Global
Global Global
Agreement Parties popula-
GDP % trade %
tion%
Regional Comprehensive Economic
15 28.70 27.80 29.65
Partnership (RCEP)
Comprehensive and Progressive Agreement
11 15.03 15.43 6.64
for Trans-Pacific Partnership (CPTPP)
United States-Mexico-Canada Agreement
3 25.82 16.11 6.45
(USMCA)
Mercosur 4 3.44 1.49 3.49
African Continental Free Trade Agreement
54 3.07 2.79 17.04
(AfCFTA)
Gulf Cooperation Council (GCC) 8 1.84 3.44 0.75
Notes: All underlying data calculated from World Bank's World Development Indicators. Global GDP % is the sum of
GDP in US dollars in 2019 (indicator NY.GDP.MKTP.KD) for each agreement signatory divided by the world total.
Global Trade is the sum of each agreement signatory's merchandise imports and exports divided by the world total
(indicators NE.EXP.GNFS.ZS and TM.VAL.MRCH.CD.WT). Global Population % is the sum of each agreement
signatory divided by the world total (indicator SP.POP.TOTL).
The share of exports to GDP varies substantially between the RCEP parties. It ranges from less than 20 %
for Indonesia to more than two thirds for countries like Cambodia, Malaysia, Singapore, Thailand and
Vietnam. The main traded goods of RCEP economies are manufacturing goods.8 RCEP accounts for nearly
half of world manufacturing output. As Figure 2 shows, exports of manufactured goods and machinery and
transport equipment dominate the exports from the region, as more than half of all exports from the region
fall in these categories. The region focuses particularly on the production of automotive and electronics:
around half of global automotive and nearly 70 % of electronics world-wide are produced in the region.
With major suppliers and producers of electronics like Samsung or Apple and automobile suppliers and
factories in the region, many electronics and machinery components are sourced from these economies.
6
Many of the original TPP provisions were drawn from previous US PTAs and reflected US preferences (see Allee and Lugg, 2016).
Upon US withdrawal from TPP several of the provisions were renegotiated among the remaining signatories, including most
notably the chapters on investment and intellectual property (see Goodman, 2018).
7
The numbers most commonly used in media coverage of RCEP are that it is roughly 30 percent of the world’s total population,
GDP, and trade. These seem to be based on a joint statement released by the RCEP signatories in November (see “Summary”
2020), but it is unclear which measures are being used and how world totals are computed. Our estimates are based on 2019
World Bank statistics and include all countries and territories for which there are statistics. Thus, our estimates are likely to be
more conservative.
8
Manufacturing goods comprise commodities in SITC section 5 (Chemicals and related products, n.e.s.), 6 (Basic manufactured
goods), 7 (Machinery and transport equipment) and 8 (miscellaneous manufactured goods).
6Short overview of the Regional Comprehensive Economic Partnership (RCEP)
For countries like China and Japan, more than 85 % of merchandise exports are manufacturing goods. But
the less developed parties like Cambodia, Laos, Myanmar and Vietnam have rapidly increased their
manufacturing output, mainly in low-tech manufacturing output. For example, Vietnam nearly doubled its
share in manufacturing exports from 42 % in 2000 to 83 % in 2018. This growth was partly achieved with
the help of foreign direct investments (FDI). Despite the global trend of stagnating FDI in the past decade,
RCEP member countries experienced an increase of FDI. The region, particularly ASEAN and China, is
attractive for new investment projects and export-oriented investments (UNCTAD, 2018).
On average, more than one third of all exports from a RCEP member is imported by another RCEP party.
China is an important trade partner, but also trade between ASEAN members is particularly strong.9 Most
countries participating in RCEP are well integrated into global value chains (GVCs). Figure 2 shows that not
only the high income countries like Japan and Australia are well integrated into GVCs, also less developed
economies like Brunei, Thailand and Vietnam. The volume of trade within GVCs has increased drastically
between 2000 and 2018. In the past decade, in particular the less developed members increased their
participation in global production by on average 15 percentage points. Most firms in these global
production networks provide inputs for further production in other countries, often within the region. The
Asia-Pacific region is characterized by strong intra-regional value chain trade amounting to USD 1.5 trillion
in 2017 (UNCTAD, 2018).
Figure 2: Sectoral distribution of exports in goods from RCEP parties, in percent of total exports in goods, 2018
0% 10% 20% 30% 40% 50% 60% 70% 80% 90% 100%
AUS
BRN
CHN
IDN
JPN
KHM
KOR
LAO
MMR
MYS
NZL
PHL
SGP
THA
VNM
0: Food and live animals 1: Beverages and tobacco
2: Crude materials, inedible, except fuels 3: Mineral fuels, lubricants and related materials
4: Animal and vegetable oils, fats and waxes 5: Chemicals and related products, n.e.s.
6: Basic manufactured goods 7: Machinery and transport equipment
8: Miscellaneous manufactures articles 9: Commodities and transactions, n.e.s. )
Notes: The trade categories correspond to the Standard International Trade Classification (SITC) Revision 3. Source:
UNCTAD Comtrade database; authors’ calculations.
Among RCEP economies, the regional value chain linkages are centred around a few economies, in
particular around China (Figure 3). China, Japan, Singapore and South Korea are major hubs for inter-
regional as well as international trade. RCEP members account for 37 % of GVC trade within RCEP parties
and for 24 % of total value added in global value chain trade world-wide in electronics and machineries.
9
See as well Figure 7 in section 2.2.
7Policy Department, Directorate-General for External Policies
Figure 3: Trade in global value chains Figure 4: Value chain connections within RCEP parties,
relative to total trade (in %) 2018
CHN
0% 20% 40% 60% 80% KHM
IDN
AUS
BRN
BRN
JPN
KHM
CHN AUS
IDN
LAO
JPN
KOR VNM
LAO
MYS MYS
MMR THA
NZL
PHL MMR
SGP SGP
THA NZL
KOR
VNM PHL
2018 2000 ASEAN other RCEP
Notes: Global value chain participation is measured as the share of a country’s exports used in a multi-stage
multi-country production process, i.e. it accounts for the foreign value added in domestic production
(backward integration) as well as domestic value-added used in third countries exports (forward
integration). The thickness of the lines in Figure 4 represent the volume of value chain trade with other RCEP
members. Only trade in GVCs with volumes above 5 billion USD are represented. The size of the node
denotes the importance of the country as trading partner.
Source: UNCTAD EORA database (2019) and authors’ calculations.
1.2 The objectives of the Agreement
The general objectives are outlined in chapter 1.3 of the Agreement, namely establishing a modern
economic partnership agreement to facilitate trade and investment focusing in particular on trade in
goods and services liberalization and working towards a competitive investment environment. One of the
main drivers in launching the RCEP negotiations in 2012 was to consolidate and bundle all existing
ASEAN+1 agreements into one trade agreement. 10 These ASEAN+1 deals had different levels of ambition
depending on the partner 11 and most of them lacked important trade and trade-related commitments (e.g.
digital trade, intellectual property rights).12 Also, RCEP was designed to create new trade relations to evolve
under a PTA. What is novel is that RCEP allows China and Japan, as well as Japan and South Korea to be
10
ASEAN had negotiated before the start of the RCEP negotiations ASEAN+1 agreements with China, Japan, South Korea, India,
and Australia/New Zealand. During the RCEP negotiations an agreement with Hong Kong was added.
11
Dür et al. (2014) and Baccini et al. (2015) refer to the depth of an agreement as the amount of liberalization envisaged by an
agreement. The authors calculate a depth index ranging between 1 (shallow) and 7 (deep). According to their Design of Trade
Agreements (DESTA) dataset, the agreement between ASEAN-Australia-New Zealand (2009) is the deepest ASEAN+1 agreement
(depth equals 6), followed by the ASEAN-China Services agreement (2007, depth 3), the ASEAN-Japan agreement (2008, depth 3),
the ASEAN-Korea Services agreement (2007, depth 3), the ASEAN-China Goods agreement (2004, depth 2), the ASEAN-India
agreement (2009, depth 2) and the ASEAN-Korea Goods agreement (2006, depth 2).
12
See Elms (2021); also “Guiding Principles and Objectives for Negotiating the Regional Comprehensive Economic Partnership,”
accessed at: https://asean.org/wp-content/uploads/2012/05/RCEP-Guiding-Principles-public-copy.pdf.
8Short overview of the Regional Comprehensive Economic Partnership (RCEP)
part of the same trade agreement. In addition, it would have allowed India to embed its trade relations
through a contractual agreement with a substantial number of Asian countries. India, however, dropped
out in the final year of the negotiations. Most commentators emphasize that Indian politicians were
concerned about the potential impact of liberalization on politically important industries in the
manufacturing sector and in agriculture, as well as a long-standing commitment to self-sufficiency. 13
RCEP’s focus is on easing trade in goods and services across Asia generally and exploring additional
liberalization in market access generally by addressing the usual set of trade topics in modern trade
agreements (see section 1.3). However, it was clear from the beginning of the negotiations that the
ambitions of the Agreement would be affected by the membership constellation which involves countries
with very different levels of economic development. For this reason, the Agreement comes with flexibilities
and differentiated commitments. This is in particular evident in the number of different tariff schedules (38
in total), with tariff liberalization for some products to occur over long periods (20 years or longer) as well
as varied commitments in services liberalization and investment.14 Lower ambition is also reflected by
leaving out non-trade concerns, including environmental and labour rights and standards. In addition, it
was clear from the composition of treaty partners that substantial policy space for national security and
public health would be reflected in the legal texts.
1.3 The structure and content of the Agreement
The Agreement has a total of 20 chapters across 510 pages. 15 Following chapter 1 (Initial Provisions and
General Definitions), chapter 2 (Trade in Goods) includes obligations for trade in goods (national
treatment clause, elimination of customs duties, duty-free temporary admissions, customs valuation,
goods in transit, re-affirmation of World Trade Organization (WTO) commitments related to export
competition and export subsidies in agricultural products, quantitative restrictions, import licensing). It
also describes the process how to deal with tariff differentials (different tariff preferences applied by
parties); it foresees consultation on technical regulations and encourages to develop a work program on
sector-specific issues. The parties agree to reduce or eliminate customs duties imposed by each member
on originating goods by approximately 92 % over a period of 20 years. 16 Some tariffs are abolished
immediately, while others will be eliminated gradually according to schedules over 20 years. Overall, RCEP
will improve market access, with tariffs and quotas eliminated in over 65 % of goods traded. 17 This will,
however, not necessarily imply large tariff reductions for all parties as more favourable trade agreements
already exist between some parties.
Chapter 3 (Rules of Origin, ROO) determines which goods are originating under RCEP and therefore can
benefit from preferential tariff treatment. It has two sections. Section A sets out the requirement for
qualifying from the originating status. Section B sets out specific procedures related to the proof of origin
and other administrative procedures. The chapter has two annexes: (i) the Product-Specific Rules, which
cover all tariff lines at the HS 6-digit level; and (ii) Minimum Information Requirements, listing the required
information for a Certificate of Origin or a Declaration of Origin. It brings all origin rules originally stipulated
under the ASEAN-Plus-one and other bilateral PTAs together. So overall, RCEP consolidates ROO, by
making it easier for exporters to “cumulate” (more inputs) and rely on a single proof of origin.
13
See for example Gupta and Ganguly (2020). Moreover, other commentators stress that India was concerned about an influx of
Chinese products, lack of liberalization in the services sectors, and geopolitical dynamics with China (see Priya and Ghosh, 2020).
14
See Elms (2021).
15
See also ASEAN (2020).
16
Ministry of Trade and Industry of Singapore, Press Release, 15 November 2020; https://www.mti.gov.sg/-
/media/MTI/Newsroom/Press-Releases/2020/11/Press-Release-on-the-Regional-Comprehensive-Economic-P artnership-Signing-
15-Nov.pdf
17
https://asean.org/asean-hits-historic-milestone-signing-rcep/
9Policy Department, Directorate-General for External Policies
Chapter 4 (Customs Procedures and Trade Facilitation) includes trade facilitation provisions, such as
advance rulings, rules of origin, customs valuation; customs clearance of goods, risk management and
post-clearance audits. The details of implementation of commitments are provided in an annex to the
chapter which takes account of differentiated needs.
The next set of chapters covers non-tariff measures. Chapter 5 (Sanitary and Phytosanitary Measures)
relies significantly on established WTO law and practice as well as the work of the respective WTO
Committee on SPS. Further emphasis is given to transparency, cooperation and capacity-building.
Chapter 6 (Standards, Technical Regulations, and Conformity Assessment Procedures) relies signifi-
cantly on WTO law and practice, as well as the work of the WTO Committee on Technical Barriers to Trade
(TBT). Following the example of Chapter 5, cooperation among parties is encouraged.
Chapter 7 (Trade Remedies) covers both safeguards as well as anti-dumping and countervailing duties. In
both cases parties’ rights and obligations under WTO law are confirmed. In terms of safeguards a de minimis
rule of 3 % is mentioned and in terms of anti-dumping the practice of zeroing is explicitly prohibited.18 The
chapter further includes an annex on anti-dumping and countervailing duties proceedings to promote
transparency and best practice.
Chapter 8 (Trade in Services) includes provisions on market access, national treatment, most-favoured-
nation treatment, and local presence. These are all subject to Parties’ Schedules of Specific Commitments
or Schedules of Reservations and Non-Conforming Measures. Importantly, several parties 19 scheduled their
services commitments through a “negative list” 20 approach while the parties that have used a “positive
list” 21 for services commitments are required to transition to a negative list within six years of entry into
force of the agreement. Overall, it provides commitments for trade in services that go beyond
commitments in existing PTAs among the RCEP parties. It is foreseen that at least 65 % of services sectors
will be fully open with increased foreign shareholding in Professional Services, Telecommunications,
Financial Services, Computer and Related Services, and Distribution and Logistics Services. There are also
three specific annexes on financial services, telecommunications services and professional services
(including recognition of professional qualifications) with obligations and frameworks for increased
cooperation.
Chapter 9 (Temporary Movement of Natural Persons) covers rules regarding temporary entry and
temporary stay of natural persons related to trade, services and investment. It includes party-specific
schedules that are found in the appendix. Chapter 10 (Investment) covers the areas of investment
protection. It does not, however, offer refinements compared to the parties existing investment
agreements. Linked to the chapter are schedules of reservations and non-conforming measures following
a negative list approach with standstill and ratchet mechanism.22 What is noteworthy is that parties did not
agree on an investor-state dispute settlement (ISDS) mechanism which usually is part of most modern
investment chapters. 23 This is a notable difference with the EU’s investment agreements, concluded in
addition to the trade agreements with Singapore and Vietnam, which have set high investment protection
18
Zeroing is a contested calculation practice by the US to calculate dumping margins and therefore damages. This has led to
many WTO disputes where the WTO dispute settlement system has largely found the US practice not to be in compliance with
WTO obligations.
19
Australia, Brunei, Indonesia, Japan, Korea, Malaysia, and Singapore adopted a negative list approach for services liberalisation.
20
All services are considered liberalised unless otherwise indicated through lists of reservations.
21
Cambodia, China, the Lao PDR, Myanmar, New Zealand, the Philippines, Thailand, and Vietnam have opted for a positive list of
services commitments.
22
A ratchet mechanism means that if a party, after entry into force of an agreement, unilaterally removes a barrier to investment,
this automatically benefits all parties to the agreement and the barrier cannot be re-introduced at a later stage.
23
However, a work programme will be set up, no later than two years after entry into force, to consider whether or not RCEP
should include an ISDS.
10Short overview of the Regional Comprehensive Economic Partnership (RCEP)
standards and put in place ISDS mechanisms. Chapter 11 (Intellectual Property, IP) covers many of the
areas related to IP (Copyright, Trademarks, Geographical Indications, Patents, Industrial Design and Genetic
Resources, Traditional Knowledge and Folklore, Domain Names). It is over 40 pages long building mostly on
WTO law. It encourages members to accede to IP Conventions 24 and re-affirms the flexibilities related to
the WTO Doha Declaration on Trade-related Aspects of Intellectual Property Rights (TRIPS) Agreement and
Public Health. In terms of geographical indications, all parties must adopt or maintain transparency
obligations. The chapter is accompanied by a list of party-specific transition periods and a list of technical
assistance requests.
Chapter 12 (Electronic Commerce) calls for a framework for future liberalization in e-commerce. It covers
various topics that are usually part of an e-commerce chapter ranging from a commitment not to impose
customs duties for electronic transmission to an obligation to protect personal information, but it is less
ambitious than comparable agreements on issues such as data localization. Also, commitments do not
apply to financial services and include exceptions for national security or other public policy reasons.
Competition policy is covered in Chapter 13 (Competition). The chapter encourages parties to rely on
competition law to address non-competitive behaviour. It also encourages information exchange and
cooperation among regulatory agencies and support for capacity-building. There are additional transition
periods listed in specific appendices for less advanced economies. The chapter also calls on parties to
address consumer protection. Chapter 14 (Small and Medium Enterprises, SMEs) recognizes the role of
SMEs. It demands sharing RCEP-related information relevant to SMEs.
Chapter 15 (Economic and Technical Cooperation) provides a framework of cooperation, in particular by
calling for an establishment of a work programme. Chapter 16 (Government Procurement) sets out
provisions regarding transparency and acknowledges the need for future cooperation. Government
procurement was not part of the original mandate, but was added later in the negotiations. There are no
substantial commitments at this stage in government procurement, however it is the first time that ASEAN
as a whole, as well as a number of individual RCEP countries, incorporate rules on public procurement in a
trade agreement. Chapter 17 (General Provisions and Exceptions) covers transparency obligations with
respect to each Party’s laws and regulations. It also excludes investment screening from dispute
settlement, includes general security, balance of payment and other exceptions (Article XX of GATT and
Article XIV of GATS). Chapter 18 (Institutional Provisions) provides information about arrangements
regarding various bodies (meetings of RCEP ministers, RCEP joint committee) and 4 specific sub-Committees
(Goods, Services and Investment, Sustainable Growth and Business environments). Chapter 19 (Dispute
Settlement) follows a standard approach with the possibility to convene a panel of experts to administrate
an arbitration procedure. There is a strong expectation that panellists have previous experience in the WTO
dispute settlement system. There are detailed rules about procedures, implementation and compliance.
The chapter also foresees rights for 3rd parties. In cases involving least developed country parties, the
complaining party has the obligation to exercise its rights with restraint allowing for special and differential
treatment. Finally, chapters on Electronic Commerce and Competition are excluded from Dispute
Settlement. Chapter 20 (Final provisions) sets out, among other provisions, a general review mechanism
(after five years) and procedures for accession (without geographical restrictions) with explicitly
mentioning the possibility for India to joining without having to wait 18 months after RCEP’s entry into
force (Art. 20.9). There are four market access annexes: First, there are country-specific tariff schedules and
for some members, there are additional clarification for tariff differentials. Singapore’s tariff schedules are
noteworthy as the annex reads “Singapore shall eliminate the customs duties on all originating goods
under this Agreement, as from the date of entry into force of this Agreement.” Second, there are schedules
24
Such as the Paris Convention for the Protection of Industrial Property, the Berne Convention for the Protection of Literary and
Artistic Works, the Patent Cooperation Treaty, the Protocol Relating to the Madrid Agreement Concerning the International
Registration of Marks.
11Policy Department, Directorate-General for External Policies
of specific commitments for services for those members that follow a positive list approach. Third,
schedules of reservations and non-conforming measures for services and investment are listed. The fourth
annex consists of schedules of specific commitments on temporary movement of natural persons.
2 The implications of RCEP
RCEP reflects a commitment to follow a continued path to regional integration. Building on existing
frameworks for market access, trade and investment, the agreement could help to boost intra-regional
trade at a time of global economic and political uncertainty, foster investment links and enhance further
regional cooperation. Certainly, RCEP has important economic implications for trade, FDI and value chain
integration within and outside the country group, while posing new challenges to existing supply chain
structures. However, also political-economy implications are noteworthy.
2.1 The implications for the Asia-Pacific region
2.1.1 Political-economy implications
RCEP has the potential to shape global trade patterns and rules in the future. Although RCEP is not as deep
as CPTPP or EU’s FTAs in the region, it still is likely to generate significant trade gains for the signatories,
while reflecting the preferences of major players in the region (see Petri and Plummer, 2020a, 2020b).
As to potential effects, it is important to understand “who wrote RCEP”, in other words which past treaty
texts influenced the final legal text of RCEP. Having a better understanding about whose PTA models align
with RCEP provides information about costs and benefits for parties in terms of trade-related adaptations
to meet the agreements objectives. Figure 5 is based on a text-as-data analysis of 56 pervious PTAs signed
by the RCEP members since 2010 as well as all ASEAN+1 agreements. The analysis also includes the
Comprehensive Economic and Trade Agreement (CETA), TPP, and the United States-Mexico-Canada
Agreement (USMCA). Employing a methodology similar to Allee et al. (2017a,b) and Elsig and Klotz (2019),
Figure 5 shows that around 30 % of RCEP’s text are duplicated from CPTPP and TPP. The USMCA is the most
influential PTA of non-RCEP members. The five most influential EU agreements include the PTAs with Japan
(15 % text overlap), with Vietnam (10 %), with Singapore (10 %), with Canada (10 %), and with Korea (8 %).
Overall, above results indicate that there is no clear template around which the text of RCEP is based.(25)
Also, the results caution an interpretation that RCEP is mainly ASEAN-driven. Rather, portions of the
Agreement seem to represent a mixture of text from recent mega-regional agreements involving RCEP
signatories, such as the CPTPP, and also bilateral agreements involving ASEAN members and RCEP
signatories, while also containing commitments that were negotiated de novo. Ultimately, much of the
Agreement seems to reflect both an attempt to find mutually agreeable solutions to the inconsistent web
of regional and bilateral agreements that were already in place, while also pushing forward regional trade
rules that are preference compatible with the major players, including ASEAN, China, Japan, Australia, and
South Korea (see also Elms, 2021).
From a more overtly political standpoint RCEP represents a geopolitical win for the participating countries,
especially ASEAN and China. ASEAN’s “middle power” diplomacy helped facilitate the deal, proving that
the ASEAN approach to cooperation not only works, but can bring together countries with long-standing
animosities such as China, South Korea, and Japan (see Petria and Plummer, 2020a; Solís, 2021). Moreover,
the withdrawal of the United States from TPP under the Trump administration and attempts to isolate
China antagonized many countries in the region. With the US absent, this provided an opening for China
and others to write the rules of the road for future cooperation in the region. In this sense, RCEP represents
25
A textual analysis on the chapter level could provide additional insights as to which chapters have been influenced by which
specific trade agreements.
12Short overview of the Regional Comprehensive Economic Partnership (RCEP)
an effort by the East Asian countries to integrate their economies and establish compatible trade rules
without the pressure to make commitments from outside actors, such as the US.
Figure 5: PTAs which influenced RCEP
Source: Authors’ calculation and illustration.
That said, it is unclear at this point what steps the incoming Biden administration will take in an effort to
reinsert the US into the process of East Asian integration. The new administration has undone several of
Trump’s withdrawals from multilateral cooperation (e.g. in climate and health), but has not made concrete
steps to renegotiate or re-join the CPTPP, which would likely face domestic opposition from a variety of
quarters and is unlikely to be an immediate priority (see Tan, 2021). Importantly, RCEP provides a potential
forum for increased liberalization in Asia and Oceania. It is possible that other countries in Asia (e.g. India)
will join at a later stage. Moreover, it is not excluded that countries outside the region could join as well,
drawn by the promise of access to major East Asian markets, most notably China.
The creation of a permanent Secretariat is also notable, as this provides RCEP parties with a mechanism
through which to engage in continued negotiations, making future commitments as they become
politically feasible. Thus, there is a built-in agenda for further services liberalization and continued talks for
a range of subject areas, which should help sustain and build momentum for future negotiations centred
around the RCEP countries. A number of sub-committees have already been agreed to meet regularly (e.g.
on goods and on services). Other topics might well see a deepening of the commitments (e.g. public
procurement rules). This is especially important given that multilateral talks at the WTO remain stalled.
2.1.2 Estimated economic effects
Several studies attempt to estimate the economic and trade effects of RCEP for its member states. Francois
and Wignaraja (2008) and Francois et al. (2009) provide early assessments of alternative constellations of
Asian integration schemes. Focused more specifically on RCEP, several recent simulation studies indicate
that RCEP members gain from the Agreement, while non-members might lose (Kawasaki, 2015; Itakura and
Lee, 2019; Mahadevan and Nugroho, 2019; Petri and Plummer, 2020a). Particularly, the simplifications of
ROOs within the RCEP member states allows to easier manage regional value and supply chains. At the
same time, while not necessarily stressed in recent studies of RCEP, other existing agreements (for example,
the CPTPP) certainly matter in terms of the economic effects specific to this agreement. The existence of
overlapping agreement membership also points to potentially complex ROO challenges.
13Policy Department, Directorate-General for External Policies
According to simulations by Petri and Plummer (2020a) 26, RCEP is expected to substantially contribute to
GDP growth in the region by 0.4 percentage points by 2030 on a permanent base, which amounts to a raise
in annual real income by USD 187 billion. Trade is expected to increase within the region by over ten
percent in the next five years. Main beneficiaries are China, Japan and South Korea. These countries are the
main economic drivers of the region accounting for more than three quarters of the GDP of RCEP members.
Further, these countries are not yet part of deep PTAs in the region and benefit from a drastic tariff
reduction while other members already benefitted from the ASEAN Free Trade Area and low tariffs. RCEP
is expected to increase the real income of South Korea by one percent, amounting to an increase of USD
23 billion annually by 2030. Among Asian non-members, India and Taiwan are expected to lose in terms of
real income from the closer integration of RCEP members. India’s regional influence on trade is expected
to fade 27, similar to the importance of US for the region as trading partner.
The benefits from the Agreement might lower the losses of China from the US-China trade war. If the
tensions between the US and China continue, the benefits of RCEP are likely to be higher due to an even
stronger focus of China on the Asian market leading to even more efficient supply chains within Asia. RCEP
will replace some of the trade that was affected due to the US-China trade war. Substantial increases in
trade flows between USD 428 billion and USD 445 billion, depending on the trade environment, are
expected for the RCEP region (Petri and Plummer, 2020a). Trade mainly grows between RCEP members,
while it is expected to decline with countries outside of the Agreement. The closer economic integration
might increase world real income by around USD 209 billion annually by 2030, of which China gains around
USD 100 billion annually (Petri and Plummer, 2020a).
The benefits from RCEP are distributed over all sectors. While more developed RCEP countries like China,
Japan and South Korea are expected to experience an increase in the production of high-tech goods and
focus stronger on the service industry, low income RCEP members are expected to see an increase in light
manufacturing products. Thus, RCEP is likely to lead to a structural change for most of its members towards
manufacturing and services, away from agriculture (Kawaskaki, 2015; Itakura and Lee, 2019). Figure 6 shows
expected sectoral adjustments in 2035 for selected RCEP members based on estimates by Itakura and Lee
(2019). Taking GVC structures into account, Itakura and Lee (2019) estimate that the output of the
automotive industry particularly in Japan increases, while Singapore gains in terms of petroleum and
chemical products and Vietnam focuses more on trade in machinery and electronic equipment. The labour
intensive textile and apparel industry grows in low income RCEP countries. Thus, RCEP strengthens the
comparative advantages in manufacturing in the region, promotes intra-regional supply chain integration
and encourages international investments.
As UNCTAD (2020) argues, the intra-regional FDI flows are relatively low compared to other major
economic integrated areas such as the EU, the USMCA and CPTPP. Yet, the integration efforts of ASEAN led
to a rapid rise in intra-ASEAN investment and invite FDI to the region. With the new mega deal, further
investment expansions can be expected – opposing the global trend. Multinational enterprises in high-
income member states are expected to shift parts of the production from high-cost environments to lower
cost locations. Already prior to RCEP, activities of multinational enterprises in less developed countries in
Southeast Asia like Vietnam, Thailand and Malaysia increased. These investment flows might contribute to
enhancing development in these member states and close the large income gap between these members
and the other RCEP members. China, Japan and South Korea are major sources of investment flows within
RCEP. RCEP enhances the attractiveness of the region as whole for investments with complementary
26
Petri and Plummer (2020a) provide the most recent simulations with the most current data and RCEP negotiations. They
simulate a computable equilibrium model to estimate the potential income effect of CPTPP and RCEP for selected countries
assuming a scenario with and without continuing trade tensions between the US and China.
27
Petri and Plummer (2020a) estimate that India loses around USD 6 billion annually by 2030 due to its decision not to join RCEP.
If India decides to join RCEP, it can expect annual gains of USD 60 billion, 1.2 percent of India’s forecasted GDP in 2030.
14Short overview of the Regional Comprehensive Economic Partnership (RCEP)
location advantages. As UNCTAD (2020) stresses, the agreement provides new opportunities for market-
seeking investments also from outside the region.
Figure 6: Simulated sectoral output adjustments for selected countries in percentage change
JPN CHN IDN + PHL MYS THA VNM
25
20
15
10
5
0
-5
-10
-15
Agricultural products Fuels and other resources Food products
Textiles and apparel Petro and chemical products Metals
Machinery Electronic equipment Motor Vehicles
Other transport equipment Other manufactures Construction and utilities
Trade and transport Other services
Note: The sectoral output adjustments are simulated by Itakura and Lee (2019) using a dynamic global
computable general equilibrium model that takes the links of GVCs into account by using inter-country input-
output tables. Their scenario model assumes that RCEP is implemented from 2021 onwards and welcomes
Taiwan as new member in 2026. The tariff rates on goods other than agriculture and food products are
assumed to decline gradually over a period of 15 years to zero. RCEP includes in their simulations as well India,
however, this inclusion does not alter the simulated sectoral output adjustments much (see Itakura and Lee,
2020).
Source: Itakura and Lee (2019), Table 4.
2.1.3 Regional value chain implications
There has been a worldwide net decline for more than a decade in the value of intermediate goods that
are either imported to be re-exported or are exported to other countries for them to re-export. 28 This
decline has been further magnified by the international trade tensions occurred at the beginning of 2018
and the recent pandemic, with people unable to go to work, disrupted transportation systems, suppliers
shut downs and borders being more difficult to cross.
Despite these global trends, countries in the Asia Pacific region have overall demonstrated a relative
increase in their participation in GVCs. This has led to a specialisation in those activities where countries
have comparative advantage. The net effect has been an increase in income and an upgrade in production
along the value chains. A key strategy for countries in the Asia Pacific region has thus been to further invest
in those sectors where they produce relatively more efficiently than other economies. This has increased
the level of intra-regional trade flows and RCEP is going to provide further boost to this development.29 A
key factor is the strong diversity among the RCEP signatories as evidenced by complementary locational
advantages and catch-up development potential. The revealed comparative advantage indices calculated
for the timeframe 2007–2019 show that ASEAN countries have a competitive advantage in the low-
technology manufacturing sector. 30 Further, the most developed economies of East Asia (Japan, China, and
South Korea) display a steady comparative advantage in technology- and capital-intensive sectors. All
28
Source: UNCTAD-Eora Global Value Chain database.
29
UNCTAD (2020). Global Investment Trend Monitor, No. 37.
30
Asian Development Bank (2020). Key Indicators for Asia and the Pacific 2020.
15Policy Department, Directorate-General for External Policies
these countries are known manufacturing hubs for highly specialised electronic components used in
motor vehicles, machinery, and other equipment, and their revealed comparative advantage calculated for
the same timeframe reflects this specialization. Finally, while Australia’s revealed comparative advantage
indices show a strong competitive advantage for knowledge intensive services, New Zealand’s indices
show a competitive advantage in processed and unprocessed products in the food and fibre sectors. 31
Intensification of trade in intermediate inputs has resulted in major gains for economies such as China and
Vietnam over last two decades. This has strengthened their role as assembly hubs for global manufacturing
economies. Other economies in the region such as the Philippines and India have dominated the more
service-oriented parts of production through business process outsourcing. For India, the last moment
decision to drop out of RCEP is particularly significant. Indeed, compared to most of the other parties of
RCEP, India’s export basket is concentrated on the lower stages of manufacturing.
RCEP is expected to strengthen the value chains among its signatories. While countries wishing to
participate in GVCs may solely need the market access which can be guaranteed by a WTO membership,
much of the production of value chains occurs at regional level. It is usually only at the final demand stage
that the chains become global. Therefore, deeper integration, in areas such as investment facilitation and
protection, should be more easily achieved with RCEP. With as many as 27 existing PTAs and 44 BITs among
the RCEP signatories, the unification and standardisation of ROOs will represent a boost for trade and
facilitate investments, a key prerequisite for the development of regional value chains.
Despite the many advantages that RCEP may bring along in terms of development of regional value chains,
extended value chains can also be associated with increased uncertainty. This usually arises from greater
fluctuations in trading patterns. As this is especially true for smaller economies, policymakers in ASEAN
countries will have to be particularly careful in assessing these potential risks. To counterbalance these
risks, they may seek to diversify trading partners, so that they will be less directly dependent on shocks
occurring in a single export destination or import source.
2.2 Implications for Europe
2.2.1 Comparing RCEP with EU-Asia agreements
This section provides a brief overview comparing RCEP with agreements that the EU has concluded with
selected Asian partners, hereafter denoted as “EU-Asia agreements”.32 Table A1 in the Appendix compares
the coverage of EU-Asia agreements with RCEP.
RCEP’s tariff preferences are accompanied by an elaborated set of ROOs that should lead to a substantial
utilization rate. Product-specific rules, that are found in the ROO chapter annexes, allow to determine the
preferential origin status of goods, and are complemented with rules about minimal operations and
processes with non-originating materials. Furthermore, procedural aspects for the practical application of
the origin-based duty reductions are foreseen, including the use of a unique certificate of origin, facilitating
the integration of supply chains, enhancing flexibility and reducing transactional and administrative costs.
Noteworthy, the agreement foresees in the possibility for cumulation.33 Just as in the EU-Asia agreements,
RCEP’s ROO seek to find a balance between providing companies with flexibility to source parts from other
countries and establishing minimum conditions for products to benefit from preferences stated in the
31
Australia Government (2018). Industry Insights: Globalizing Australia; Ministry of Business, Innovation & Employment (2013). An
updated look at New Zealand's comparative advantage.
32
These agreements are the EU-South Korea FTA (2015), the EU-Singapore Trade and Investment Agreements (2019), the EU-
Japan EPA (2019) and the EU-Vietnam FTA (2019).
33
The cumulation rule states that originating goods from one member state can be used as material or input in the production of
a product in another member state, which will require origin in the latter member state.
16Short overview of the Regional Comprehensive Economic Partnership (RCEP)
agreements. Initially, only authorized exporters in RCEP countries are allowed to self-certify the origin of
exported goods. Others have to apply for a certificate of origin from the authorities in the country of export.
After an initial transition period, all exporters will be allowed to self-certify the originating status of
exported goods. In comparison, the past years, when negotiating its recent PTAs, the EU has been working
towards changing the system of governmental certification towards a system entirely based on self-
certification. The EU-Japan Economic Partnership Agreement (EPA, 2019) was the first agreement in which
the EU also gives importers the possibility to self-certify the originating status of traded goods (based on
‘importers knowledge’).34
As to tariff liberalization, RCEP will eliminate 92 % of the customs duties on goods from member states.
By comparison, the EU-Japan EPA will eliminate 97 % of the customs duties on goods from the EU (vice
versa even 99 %), the EU-Vietnam FTA 99 % and the EU-Singapore FTA even 100 %. Aforementioned
percentages refer to aggregate numbers, meaning that the reduction of customs duties shows differences
between the sectors. Also, in the EU PTAs with ASEAN members, tariffs reduction or elimination are
achieved in a shorter-term. For example, with the first trade and investment bilateral agreement concluded
between the EU and an ASEAN country, i.e. the EU-Singapore PTA , customs duties on goods of Singapore’s
domestic exports to the EU were removed of approximately 84 % on the day the agreement entered into
force on 21 November 2019, and the remaining 16 % of customs duties will be removed over a period of
five years. 35
Both RCEP and the EU-Asia agreements contain provisions on SPS, TBT, government procurement,
competition and investment policy. Yet substantial differences do occur in some chapters. For instance,
the government procurement chapter in RCEP is very modest compared to the EU-Asia agreements. RCEP
promotes governmental transparency but lacks significant market access commitments, which is
attributed to the fact that China still has to include these commitments in its bilateral agreements and that
many of the RCEP members are not part of the WTO’s plurilateral agreement on Government Procurement.
RCEP covers aspects of protection, liberalization, promotion and facilitation of investment. RCEP, however,
does not rely on an investor-state arbitration system. The EU-South Korea FTA does incorporate some
provisions on investments related to establishment, national treatment and MFN principles in a chapter
that includes also provisions on services and e-commerce. The same applies to the EU-Japan EPA, the EU-
Vietnam FTA and the EU-Singapore FTA. The EU has, however, negotiated a separate investment protection
agreement which includes investor-state arbitration with both Vietnam and Singapore. The negotiations
with Japan on a specific investment agreement are ongoing.
The EU FTAs with ASEAN members, i.e. Singapore and Vietnam, have introduced extensive and ambitious
provisions on trade in services, even though the EU has adopted a “positive list” approach in its FTAs, and
only the sectors and subsectors listed are liberalised in respect of service suppliers of the other party 36.
Unlike in the RCEP Agreement, there is no MFN clause generally applicable with respect to services and
investment in the EU-style FTA 37. Such MFN clauses, however, exist in the EU FTAs with South Korea, Japan
and Vietnam. While the EU FTAs exclude audio-visual services from national treatment provisions, RCEP
Parties have agreed on new commitments for the liberalisation of such services.
34
Appendix A2 provides an overview of ROO elements in RCEP and EU-Asia agreements.
35
European Commission (2019), European Union – Singapore Trade and Investment Agreements; available at
https://trade.ec.europa.eu/doclib/docs/2019/february/tradoc_157684.pdf.
36
European Parliament, Policy Department, Directorate-General for External Policies (2018) “Free Trade Agreement between the
EU and the Republic of Singapore – Analysis”; available at:
https://www.europarl.europa.eu/RegData/etudes/STUD/2018/603864/EXPO_STU(2018)603864_EN.pdf
37
Expect a partial MFN clause in the EUSFTA in relation to banking licences.
17Policy Department, Directorate-General for External Policies
Although RCEP covers many trade topics, parties have decided not to include provisions related to the
environment, labour, state-owned enterprises and government subsidies. In comparison, environ-
mental provisions are present in each of the four EU-Asia agreements. EU Asian agreements also tackle
sustainable management of natural resources, biodiversity and forests. In terms of labour rights, the EU
generally advocates in its FTAs the implementation of the core labour standards of the International Labour
Organization (ILO) and the support of the Paris Climate Agreement. The EU-Japan EPA (2019) goes even
further with a chapter on corporate governance, stating that Corporate Social Responsibility (CSR) should
be promoted, along with investment strategies that enhance sustainable development. Moreover, RCEP
does not address the role of state-owned enterprises. By comparison, obligations related to state-owned
enterprises are included in the EU-Japan EPA and the EU-Vietnam FTA. Noteworthy is the emphasis on
SMEs in RCEP compared to EU-Asia agreements (except for the EU-Japan EPA, which foresees the estab-
lishment a shared information database). RCEP introduces a platform to provide information on RCEP-
related content (tariffs, rules, regulations) that will be accessible to SMEs. Moreover, paperwork is reduced
for SMEs to promote better access to regional supply chains that are embedded in a larger market.
2.2.2 The possible impact on EU trade including EU GVC participation
RCEP might serve as catalyst for further growth of intra-regional GVCs. The EU has strong relations to the
member countries of RCEP. The importance of RCEP as export destination for European goods varies by
country. It ranges from a low share of imports of European goods for Singapore of roughly one percent to
around 20 % for Japan and New Zealand, with an average of 5.4 %. Similarly, the EU member states are an
important destination for goods produced in the RCEP region (see Figure 7). The share of trade coming
from or going to the EU is around nine percent on average.
For Japan, New Zealand, Cambodia, and Malaysia the EU, particularly the EU-15, is one of the most
important trading partners. However, if trade in goods and services among the Asian partners increases,
demand might decline for goods imported from European and other western trading partners. The trade
facilitation and reduction of trade costs among RCEP members might lead to a relative decline in compet-
itiveness of European products as a result of trade diversion. However, even though Europe might experi-
ence a slight decline in demand due to a redirection of trade flows 38, European firms might also benefit
from a closer integration of the region that might offset potential losses. The agreed ROOs allow for value
added from third country parties, thus, facilitating as well the participation of third country firms in the
growing markets of the RCEP region. Europe is expected to benefit from RCEP by an annual net income
increase of USD 13 billion by 2030 (Petri and Plummer, 2020a).
The reduction of non-tariff barriers through the harmonization of information requirements and local con-
tent standards for businesses facilitates not only local supply chain management, it also generates a more
stable environment for trade for European firms. A stronger regional trade integration makes the RCEP
countries more attractive to multinational firms for diversification of their supply chains. European compa-
nies can benefit from more resilient supply chains, lower transaction costs and the facilitation of exporting
to RCEP countries.
Given the technological advancements of China, Japan and South Korea, the focus of production of these
economies and the region is slowly moving to more differentiated, high-tech production. Exports in ad-
vanced manufacturing-sectors are expected to increase most, particularly for China, Japan and South Korea
(UNCTAD, 2020). Petri and Plummer (2020a) estimate that more than 30 % of the trade expansion of RCEP
can be attributed to an increase in advanced manufacturing, including electrical and electronic equipment
and automobiles. These products typically have extensive long multi-country supply chains and require
38
Petri and Plummer (2020a) estimate a reduction of trade among non-members by around $48 billion by 2030.
18You can also read