Global. Connected. Sustainable - INVESTOR PRESENTATION MAY 2019 Digital Realty the trusted foundation | powering your digital ambitions - AWS
←
→
Page content transcription
If your browser does not render page correctly, please read the page content below
Global. Connected. Sustainable.
INVESTOR PRESENTATION
MAY 2019

Digital Realty the trusted foundation | powering your digital ambitions

Business Highlights

1   Digital Realty Overview           Introduction

2   Introduction to Data Centers      Data center 101

3   Global Platform                   Growing world-wide demand from a diversified customer base

4   Connected Campus Strategy         Solving for the complete deployment; land and expand

5   Attractive Growth Prospects       Organic growth combined with lease-up opportunity

6   Prudent Capital Allocation        Disciplined investment criteria guided by Return on Invested Capital

7   Conservative Financial Strategy   Committed to maintaining a flexible balance sheet

8   Recent Results                    First quarter 2019 highlights

                                                 DIGITAL REALTY | INVESTOR PRESENTATION | MAY 2019 | 2
Digital Realty
Overview
INTRODUCTION

                 DIGITAL REALTY | INVESTOR PRESENTATION | MAY 2019 | 3
Digital Realty at a Glance (NYSE: DLR)
    DIGITAL Global
    Leading  REALTY    AT A
                     Data   GLANCE
                           Center REIT(NYSE: DLR)

                Investment Management                                                                                                                                             High-Quality Customer Base, including
                  Approach Focused on                                                                                                                                                   Global Companies Across
                Return on Invested Capital                                                                                                                                                 Various Industries

                 215Realty
             Digital
             Digital Realty
                          DATA CENTERS (1)
             Overview
             Overview                                                                       $26 Bn                          EQUITY MARKET
                                                                                                                            CAPITALIZATION (3)                                              2,000+    CUSTOMERS

                               36                                                           $38 Bn                          ENTERPRISE
                                                                                                                            VALUE (3)
                                                                                                                                                                                        Investment Grade Ratings (5)
    Leading          Global Data Center
                        METROPOLITAN
                         AREAS (1) (2)
    REIT                                                                                                                                                                                                                 BBB
                                                                                                         8th                LARGEST PUBLICLY
                                                                                                                            TRADED U.S. REIT (4)

                                                                                                                                                                                                                         Baa2
                            34+
                         MILLION RENTABLE
                                                                                                 2016                       ADDED TO THE
                                                                                                                            S&P 500 INDEX                                                                               BBB
                                                                                                          MAY
                          SQUARE FEET (2)                                                                                                                                                                               Positive
                                                                                                                                                                                                                        Outlook

Note: Data as of March 31, 2019 unless otherwise noted.
1) Includes 35 data centers held as investments in unconsolidated joint ventures.
2) Includes 3.2 million square feet of active development and 2.1 million feet held for future development.
3) Includes Digital Realty’s pro rata share of unconsolidated joint venture debt.
4) U.S. REITs within the RMZ. Ranked by market cap as of March 31, 2019. Source: FactSet
5) These credit ratings may not reflect the potential impact of risks relating to the structure or trading of the Company’s securities and are provided solely for informational purposes. Credit ratings are not recommendations to buy, sell or hold
   any security, and may be revised or withdrawn at any time by the issuing organization in its sole discretion. The Company does not undertake any obligation to maintain the ratings or to advise of any change in ratings. Each agency’s rating
   should be evaluated independently of any other agency’s rating. An explanation of the significance of the ratings may be obtained from each of the rating agencies.

                                                                                                                                        DIGITAL REALTY | INVESTOR PRESENTATION | MAY 2019 | 4
Navigating the Future
Sustainable Growth for Customers, Shareholders and Employees

      GLOBAL               CONNECTED                          SUSTAINABLE

                                    DIGITAL REALTY | INVESTOR PRESENTATION | MAY 2019 | 5
Supporting Our Customers’ Growth
    Full Spectrum of Data Center Solutions Across a Global Platform

                                    215              (1)
                                                                                  14                                      36                           34+
                                  DATA CENTERS                                  COUNTRIES (1)                       METROPOLITAN AREAS   (1)   MILLION RENTABLE SQ. FT. (1)(2)

    INTERCONNECTION                                                              COLOCATION                                         SCALE                               HYPER-SCALE

Note: Data as of March 31, 2019 unless otherwise noted.
1)    Includes 35 data centers held as investments in unconsolidated joint ventures.
2)    Includes 3.2 million square feet of active development and 2.1 million square feet held for future development.

                                                                                                                          DIGITAL REALTY | INVESTOR PRESENTATION | MAY 2019 | 6
Meeting Our Customers’ Growing Data Center Needs
Aligning Go-to-Market with Customer Buying Behavior

                                         Our Customers
   Aligning our Go-to-Market strategy with our customers’ unique needs and the way they buy

     Global, Diverse Customer Base                      Customer-Centric Alignment

   2,000+     Comprehensive          Global          Global           Enterprise         Network
  Customers   Product Offering   36 Metro Areas     Solutions         Solutions          Solutions

                                                     DIGITAL REALTY | INVESTOR PRESENTATION | MAY 2019 | 7
Aligning Core Competencies with Customers
Global Real Estate Reach, Complementary Product Mix

                                         Our Core Competencies
                Capitalizing on our competitive advantages that include large scale campuses,
            network-dense interconnection hubs and diversified product offering on a global basis

            REAL ESTATE                            EXPANSIVE                              COMPLEMENTARY
             EXPERTISE                           GLOBAL REACH                              PRODUCT MIX

                                             Meet our target customers’
Critical part of customer supply chain                                                     Seamless delivery of a
                                             needs for large and growing
    that starts with the real estate                                                          complementary
                                             footprints on a global basis
                                                                                                product mix
Not going up the stack to compete or
                                            Campus approach to land and
  staffing to sell direct to broader                                                 Scale, colocation and connectivity
                                           grow our customers – Singapore,
        enterprise customers
                                             Ashburn, London and beyond

                                                                  DIGITAL REALTY | INVESTOR PRESENTATION | MAY 2019 | 8
Introduction to
Data Centers
DATA CENTER 101

                  DIGITAL REALTY | INVESTOR PRESENTATION | MAY 2019 | 9
Data Center 101
    What is a Data Center?

                                                                                                                                                                   1   Building Shell
                                                                                                                                                                   2   Electrical Systems
                    Data Center Layout                                                                                                                             3   HVAC / Mechanical Systems
                                                                                                                      Building Shell                               4   Building Fit-Out / Site Work
       Data Centers                                                                                                                    HVAC
       Data centers are designed to                                                                                                       Electrical Utility Service
                                                                                                                                          ( Not Shown in Image)
       house servers and network                                                                                                             Mechanical Galleries
       equipment. Data centers
                                                                                                                                                     Power Distribution Unit (PDU)
       provide a highly reliable,
       secure environment with                                                                                                                            Electrical Rooms (UPS, Switchboard, etc.)
       redundant mechanical,
                                                                                                                                                                        Batteries
       cooling, electrical power
       systems and network
       communication connections.                                                                                                                                                       Generators

                                                                                                                                                                                         Shipping /
                                                                                                                                                                                         Receiving
       Servers                                                       Computer Servers                                                                                                    Area
       Computer servers, which                                              Raised Floor
       process and store data, are
       supplied and owned by
       customers.
                                                                                                                     Meet-Me-Room

Note: Data as of December 31, 2018 unless otherwise noted.                                                                 Lobby / Entrance
1) Includes investments in eighteen properties held in unconsolidated joint ventures.
2) Includes 3.4 million square feet of active development and 2.1 million square feet held for future development.

                                                                                                                            DIGITAL REALTY | INVESTOR PRESENTATION | MAY 2019 | 10
Data Center 101
What Goes into Building a Data Center?
1 BUILDING SHELL 2 ELECTRICAL SYSTEMS
Data Center Cost Distribution
• Building Shell Building • Generator
• Raised Floor Shell • Batteries
22% • Power Distribution Unit (PDU)
Electrical • Uninterruptible Power Supplies
Systems (UPS)
40%
3 HVAC / MECHANICAL SYSTEMS HVAC / 4 BUILDING FIT-OUT / SITE WORK
Mechanical
Systems
17%
Building Fit-Out
/ Site Work
21%
• Computer Room Air Conditioner • Lobby / Entrance
(CRAC Unit) • Meet-Me-Room
• Air Cooled Chillers • Shipping / Receiving Area
• Central Chilled Water Plant
Note: Percentage costs for data center development shown are based on a sample Digital Realty data center build and are not necessarily representative of all development projects.
DIGITAL REALTY | INVESTOR PRESENTATION | MAY 2019 | 11Focused Pursuit
Comprehensive Customer-Focused Product Suite
Flexible solutions meeting customers’ needs in space, colo and interconnection through one provider
SCALE COLOCATION CONNECTIVITY
Solution to scale from a medium Enabling small (one cabinet) to Connecting customers & partners
300+ kW to very large compute medium (75 cabinets) data center inside the data center
deployments deployments
Can execute a solution for medium Provides agility to quickly deploy Connecting across data centers in
to large deployment in weeks, computing infrastructure in days, the same metropolitan area
contracting for 5-10+ years contract for 2-3 years
Customize data center environment Consistent designs and Privately and securely connecting
to specific deployment needs operational environment and to cloud services
consistent power expenses
Due to size of deployments,
customers sometimes opt to have Leverage optional skilled remote Enabling Internet peering and
their own on-site staff hands and on-site customer multi-cloud access
support
DIGITAL REALTY | INVESTOR PRESENTATION | MAY 2019 | 12Interconnection
What is a Cross-Connect?
INTERCONNECTION
CONTENT NETWORK
CONNECTING PARTNERS AND NETWORKS
A cross-connect is a physical layer network connection between two
parties. The cross-connect is enabled by the installation of patch
cord(s) between ports of the respective parties’ interconnection panels.
79,000 $273mm
CROSS ANNUALIZED
CONNECTS REVENUE (1)
CONNECTING TO END USERS
By enabling companies to connect with their partners and network
providers, such as AT&T and Verizon, these same companies can
now deliver their content to billions of end users around the world.
As of March 31, 2019.
1) Annualized revenue defined as Interconnection & Other Revenue for 1Q19 multiplied by four.
DIGITAL REALTY | INVESTOR PRESENTATION | MAY 2019 | 13Home to the Hybrid Multi-Cloud Solution
Customers’ Desired IT End State
The majority of companies deploy some form of hybrid cloud solution to run and manage their IT needs
PRIVATE PUBLIC
CLOUD SOLUTIONS CLOUD SOLUTIONS
Single organization, Service providers,
dedicated environment many customers
3%
PRIVATE 69% 22%
PUBLIC
HYBRID(1)
ONLY(1) ONLY(1)
Scale Only Colocation Only Hybrid cloud architectures allow data center Infrastructure as a Service (IaaS)
providers to:
1 GROW WITH THEIR CUSTOMERS
Though early stage companies use public cloud
infrastructures to minimize capex, as they grow
Connected
and scale, public cloud solutions become quite
Campus
expensive and necessitate a migration to the
private cloud for portions of their IT workload
Software as a Service (SaaS)
2 ENABLE CLOUD-BASED SOFTWARE
APPLICATIONS
A hybrid cloud solution allows companies to store
their sensitive information on private servers
while using cloud-based applications (Office 365,
Salesforce) that reduce IT costs
1) Source: Rightscale 2019 State of the Cloud Report from Flexera. Based on 94% of respondents that are using the cloud.
DIGITAL REALTY | INVESTOR PRESENTATION | MAY 2019 | 14Next Generation Drivers
The Second Wave of Cloud
ARTIFICIAL INTELLIGENCE MARKET FORECAST (1) INTERNET OF THINGS (IoT) MARKET FORECAST (2)
$90 (IoT Units Installed in millions)
($ in billions)
$71
20,415
45% $53
34%
CAGR (‘16 - ‘25) $38 CAGR (‘16 - ‘20)
$26
11,197
8,381
$17
$11 6,382
$5 $7
$3
2016 2017 2018 2019 2020 2021 2022 2023 2024 2025 2016 2017 2018 2020
AUTONOMOUS VEHICLES MARKET FORECAST (3) VIRTUAL/AUGMENTED REALITY MARKET FORECAST (4)
(shipments in thousands) ($ in billions) $193
569
512
37% 426 78%
($ in billions)
CAGR (‘18 - ‘25) 320 CAGR (‘16 - ‘22)
213
107 149
64 $12 $20
$6 $14
2018 2019 2020 2021 2022 2023 2024 2025 2016 2017 2018 2019 2022
1) Source: Statista – June 2018 3) Source: BI Intelligence Estimates, 2017
2) Source: Gartner – January 2017 4) Source: IDC; Statista estimates, December 2018
DIGITAL REALTY | INVESTOR PRESENTATION | MAY 2019 | 15Multi-Billion-Dollar Businesses Growing at Healthy Double-Digits
Reports of Cloud CapEx Demise Greatly Exaggerated
Hyper-Scale Cloud CapEx vs. Revenue Growth Cloud Revenue Growth (4)
60% 1Q19 4Q18
Public Cloud YoY Revenue Growth(1)
45% 48%
45%
$9.6 Bn(3) $7.7 Bn (3)
45%
Forward
30%
Sale Agreements Proactively Address Near-Term 41% 38%
Cash Needs
$5.4 Bn(3) 25%
15%
-- 10% 20% 30% 40%
(1)(2)
Public Cloud YoY Capex Growth
Source: FactSet and public filings.
Note: Bubble size represents total 2019E cloud CapEx per RBC Capital Markets Research.
1) Based on public filings.
2) Represents FY2018 – FY2019E growth in cloud CapEx.
3) Cloud revenue as reported for 1Q19.
4) Year-over-year growth in cloud revenue for 1Q19 and 4Q18, respectively.
DIGITAL REALTY | INVESTOR PRESENTATION | MAY 2019 | 16Global
Platform
GROWING WORLD-WIDE DEMAND
FROM A DIVERSIFIED CUSTOMER BASE
DIGITAL REALTY | INVESTOR PRESENTATION | MAY 2019 | 17Covering the Waterfront
Over 200 Data Centers across more than 30 Metro Areas
Seattle Minneapolis /
St. Paul
Portland Toronto
Boston
New York Metro
San Francisco
Silicon Valley Denver Chicago Northern
Los Angeles Virginia
Tokyo Phoenix
Charlotte Manchester
Osaka Amsterdam
Dallas Atlanta
Austin Dublin
Houston
Hong Kong Miami London
Frankfurt
Fortaleza
Paris
Campinas Rio de Geneva
Janeiro
Singapore Sao Paulo
Santiago
Sydney
Melbourne
Geographically Diversified (1) Primarily Owned Real Estate (2) Primarily Unencumbered (2)
Asia Pacific Leased Encumbered
6% 7% 1%
Europe
North
14%
America Owned Unencumbered
80% 93% 99%
Note: Represents consolidated portfolio and investments in our unconsolidated joint ventures.
1) Calculated based on annualized base rent which represents the monthly contractual base rent (defined as cash base rent before abatements) under existing leases as of March 31, 2019, multiplied by 12.
2) Based on Net Operating Income as of March 31, 2019. For a definition of Net Operating Income, please see the Appendix.
DIGITAL REALTY | INVESTOR PRESENTATION | MAY 2019 | 18High-Quality, Diversified Customer Base
Numerous Customers with Multiple Locations Across the Portfolio
TOP 20 CUSTOMERS
CUSTOMER TYPE (% by ABR) (1)
Customer Rank Locations % of ABR(1) Customer Rank Locations % of ABR(1)
Fortune 500
1 19 7.2% 11 8 1.9% Network
SaaS Provider 18%
Fortune 50
2 18 6.6% 12 26 1.5% Financial
Software Company 12% Cloud
28%
3 28 6.4% 13 16 1.5%
Content
17%
4 Fortune 25 Investment 11 3.6% 14 11 1.5%
Grade-Rated Company
5 19 3.2% 15 6 1.3%
CREDIT RATING (% by ABR) (1)(2)
6 19 3.2% 16 56 1.3%
7 21 2.6% 17 81 1.2% Investment
Grade or
Equivalent
8 9 2.5% 18 9 1.2% > 50%
9 7 2.5% 19 10 1.1%
10 65 2.1% 20 Global Cloud 13 1.1%
Provider
TOTAL ANNUALIZED BASE RENT 53.5%
Note: As of March 31, 2019. Represents consolidated portfolio plus our managed portfolio of unconsolidated joint ventures based on our ownership percentage. Our direct customers may be the entities named in this table above or their
subsidiaries or affiliates.
1) Calculation based on annualized base rents (monthly contractual cash base rent before abatements under existing leases as of March 31, 2019 multiplied by 12).
2) Based on the credit ratings of Digital Realty’s top 100 customers against total ABR of $2.3 billion. Credit ratings from S&P, Moody’s and Fitch reflect credit ratings of customer parent entity. There can be no assurance that a customer
parent entity will satisfy the customer’s lease obligations upon such customer’s default.
DIGITAL REALTY | INVESTOR PRESENTATION | MAY 2019 | 19Global Service Infrastructure Platform
Deliver Basic Services, Enable Partners
Digital Realty is Focused on Providing the Real Estate Foundation to Enable Customers & Partners to Service Thousands of Their Customers
Focused on
Real Estate Foundation Funnel Approach
Towards Customers
CLOUD SERVICES
Thousands
IaaS
SaaS
of
PaaS Customers
Customers
& Partners
MANAGED SERVICES
Professional Services
Managed Hosting
Business Continuity
REAL ESTATE
FOUNDATION
Scale
Colocation
Interconnection
DIGITAL REALTY | INVESTOR PRESENTATION | MAY 2019 | 20Enabling Customers and Partners
Strategic Alliances Bearing Fruit
Strategic alliance for network-enabled colocation services
AT&T will continue to resell Digital Realty colocation capacity
AT&T AT&T Colocation Services Network-Enabled
Network from Digital Realty Colocation Services
• Global connectivity • Digital Realty colocation capacity • Complete solution with common
resold by AT&T providing wider processes for contracting & support
• Network technology leadership
geographic coverage and • Combined industry expertise
increased reach to enterprise • Simplified customer experience
+ clients
=
DIGITAL REALTY | INVESTOR PRESENTATION | MAY 2019 | 21Connected
Campus Strategy
SOLVING FOR THE COMPLETE
DEPLOYMENT; LAND AND EXPAND
DIGITAL REALTY | INVESTOR PRESENTATION | MAY 2019 | 22Multi-Tiered Cloud Architectures
Solving for the Complete Deployment; Land and Expand
Connected Campus
Network Access Nodes Higher
COLO • High network requirements to efficiently distribute and aggregate Performance
traffic
• Applications: network connectivity, network peering and WAN
optimization
• Primary networking gear installed (e.g., routers and switches)
• 1-20 cabinets
Service Aggregations Nodes
• Mission-critical and latency-sensitive deployments
• Applications: CDN infrastructure, cloud services
• Servers, storage, load-balancers and cache infrastructure
• 10-100 cabinets
Server Farms
• Large-scale computing and storage deployments
• Applications: back office, cloud and content infrastructure,
Higher
data analytics and web hosting
SCALE • 100+ cabinets Capacity
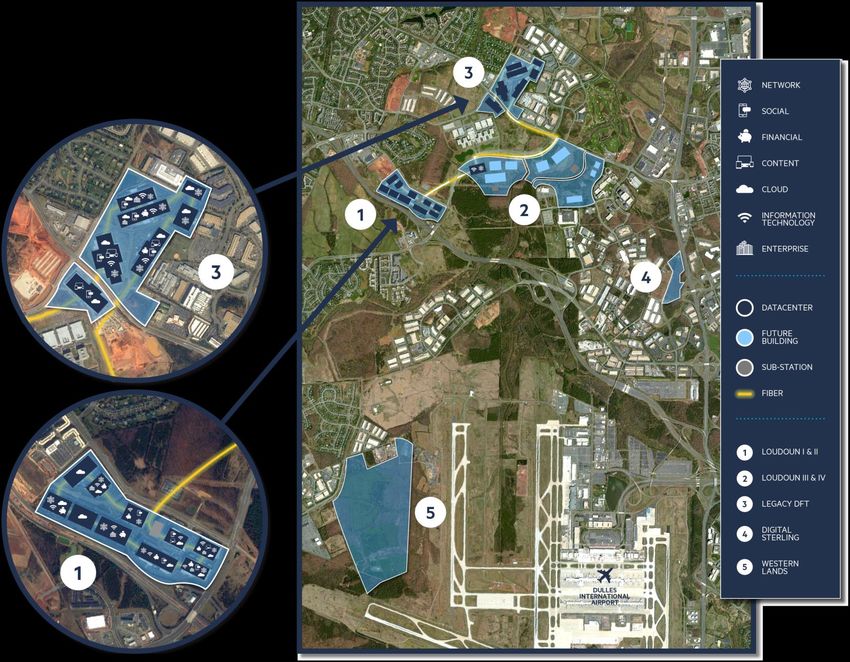
DIGITAL REALTY | INVESTOR PRESENTATION | MAY 2019 | 23The Connected Campus
Digital Ashburn
70% 70%
of the world’s web
traffic flows through
Loudoun County (1)
424
MW
Digital Realty has over
424 MW of capacity on
our existing Northern
Virginia campuses…
670
acres
370
…in addition to 670
W holdings
acres of land
that will support the
build-out of another
1000+ MW
1) Source: Loudoun County Department of Economic Development.
DIGITAL REALTY | INVESTOR PRESENTATION | MAY 2019 | 24Density at Scale and at Hubs
Expand, Tether, and Densify Data Center Campuses
CHICAGO CAMPUS NEW YORK CAMPUS DALLAS CAMPUS LONDON CAMPUS
350 E. CERMAK 111 8th AVENUE 2323 BRYAN STREET SOVEREIGN HOUSE
Connect@Scale suites, Connect@Scale suites, Connect@Scale suites, Connect@Scale suites,
Powered Base Building, Powered Base Building, Powered Base Building, Powered Base Building,
Connect@Gateway Connect@Gateway Connect@Gateway Connect@Gateway
colocation colocation colocation colocation
FRANKLIN PARK PISCATAWAY RICHARDSON WOKING
DIGITAL REALTY | INVESTOR PRESENTATION | MAY 2019 | 25Digital Realty is the Edge
Network Density That Promotes Innovation and Collaboration
12
CITIES
79k 1,600+ 10
ASSETS
CROSS-CONNECTS NETWORK INSTANCES
Globally Where Our GLOBALLY With Over 2,000
GLOBALLY
Internet Gateways Cross-Connects Each
Are Located
50,000+ Cross-Connects and 630+ Networks:
111 8th AVENUE 60 HUDSON 56 MARIETTA 350 E. CERMAK SOVEREIGN HOUSE SCIENCE PARK
DIGITAL REALTY | INVESTOR PRESENTATION | MAY 2019 | 26Diversifying Product Offerings
Facilitating Secure Connections to Multiple Service Providers
16
METRO AREAS
Private Access to
ACROSS SaaS Applications
NORTH AMERICA AND EMEA
A software-defined network (SDN) that allows a
customer to establish direct, private connections to
multiple cloud service providers, other participants 60
DATA CENTERS
$83 Bn
SaaS Market (1)
of the platform, and other data centers on the
connected network from a single interface
Note: Data as of March 31, 2019 unless otherwise specified.
1) Source: Gartner (April 2019) Represents estimated SaaS market size in 2019.
DIGITAL REALTY | INVESTOR PRESENTATION | MAY 2019 | 27Attractive
Growth Prospects
ORGANIC GROWTH COMBINED
WITH LEASE-UP OPPORTUNITY
DIGITAL REALTY | INVESTOR PRESENTATION | MAY 2019 | 28High Utilization Provides Downside Protection
Significant Customer Investment Drives Stable Retention
Historical Retention on Rentable Square Feet (1)
Trailing Twelve-Month Tenant Retention Long-Term Historical Average
$15 – $30
100%
million
approximate cost of a
new 1.125 MW data
center deployment(2)
90%
80%
$15 – $20
70% million
approximate cost to
migrate a 1 MW data
center to a new facility(2)
60%
2010 2011 2012 2013 2014 2015 2016 2017 2018 2019
Note: As of March 31, 2019.
1) Represents trailing 12-month average.
2) Estimates provided by Align Communications – March 2019.
DIGITAL REALTY | INVESTOR PRESENTATION | MAY 2019 | 29Data Center Migration
Projected Costs
Assumptions:
1.5 – 2 yrs
• 1 MW / 10K Ft2 data center with 2,000 devices
• Hyperconverged: 100% new hardware, factory built
cabinets with compute, storage and networking
1 - 1.5 yrs • Hybrid: Build new network, replace 33%-50% of
the existing hardware, migrate workloads over the
8 mos - 1 yr network
• Lift & Shift: physically move all hardware and stand
up new network
Note that costs may vary based on: data center network and
cabling design, the amount of seed hardware required, the use of
consulting vs internal resources, the distance between data
centers and other various factors
Source: Align Communications – March 2019.
DIGITAL REALTY | INVESTOR PRESENTATION | MAY 2019 | 30Evenly-Staggered Lease Expiration Schedule
Consistent, Modest Roll-Over Exposure in Any One Year
% of Lease Expirations by Annualized Base Rent (1)
Scale Colocation
30% 2% - 4%
Annual cash rental
rate increases (2)
20%
18.1%
14.2%
12.4%
11.5%
10.4%
10% 9.7%
7.6%
6.2%
5.1%
5.3 years
Weighted avg.
2.6% 2.2% remaining lease term
0%
2019 2020 2021 2022 2023 2024 2025 2026 2027 2028 >2028
Note: As of March 31, 2019
1) Represents consolidated portfolio plus our managed portfolio of unconsolidated joint ventures based on our ownership percentage. Annualized base rent represents the monthly contractual base rent (defined as cash base rent before
abatements) under existing leases as of March 31, 2019 multiplied by 12.
2) Excluding acquired leases, for which rent increases vary.
DIGITAL REALTY | INVESTOR PRESENTATION | MAY 2019 | 31Uninterrupted Growth throughout the Cycle
Cyclical Agnostic Performance Compares Favorably
Thirteen Consecutive Years of Positive Growth
Financial Crisis 2006 – 2019E FFO /
500 Share CAGR(1)
400 DLR: 11.4%
300 PSA: 9.0%
SPG: 6.6%
200 AVB: 6.3%
BXP: 3.5%
EQR: 3.2%
100
KIM: (3.1%)
0
2006 2007 2008 2009 2010 2011 2012 2013 2014 2015 2016 2017 2018 2019E
Sources: Company Filings and SNL Financial as of May 8, 2019.
1) 13-year FFO per Share CAGR calculated using 2006 – 2018 actuals and per SNL Financial. 2019E figure for DLR is at midpoint of guidance as of April 25, 2019. Index value starts at 100 and increases or decreases by annual percent
FFO per share growth. FFO is a non-GAAP financial measure. For a description of FFO and a reconciliation to net income, see the Appendix.
DIGITAL REALTY | INVESTOR PRESENTATION | MAY 2019 | 32Committed to a Secure and Growing Dividend
Fourteen Consecutive Years of Dividend Increases
(2)
Cash Dividend / Common Share AFFO Payout Ratio
$4.32
$4.04
$3.32 $3.40
$3.52
$3.72
4%
$3.12
DIVIDEND
$2.92 YIELD(1)
$2.72
$2.02
$1.47
$1.00 $1.08 $1.17 $1.26
11%
CAGR
93% 95%
84% 84% 86% (2005 – 2019E)
78% 79% 78%
65% 65% 69% 66% 68% 67% 68%
2005 2006 2007 2008 2009 2010 2011 2012 2013 2014 2015 2016 2017 2018 2019E
1) Dividend yield based on May 7, 2019 closing stock price of $117.42 and annualized 1Q19 dividend.
2) AFFO is a non-GAAP financial measure. For a description of AFFO and a reconciliation to net income, see the Appendix.
DIGITAL REALTY | INVESTOR PRESENTATION | MAY 2019 | 33Exceptional Risk-Adjusted Growth Track Record
Strong Growth, Moderate Volatility
Consistently Delivered Healthy Growth in FFO and Dividends per Share
13-Year FFO / Share Risk-Adjusted Growth(1) 13-Year Dividend / Share Risk-Adjusted Growth(2)
30.0% 30.0%
Median REIT
Median REIT
20.0% 20.0%
Above-average Above-average
(13 –Year Dividend / Share CAGR)
DLR growth relative to DLR growth relative to
volatility volatility
(13 -Year FFO / Share CAGR)
10.0% 10.0%
0.0% 0.0%
(10.0%) (10.0%)
Below-average Below-average
growth relative to growth relative to
volatility volatility
(20.0%) (20.0%)
0 20 40 60 80 100 0 20 40 60 80 100 120
Increased Volatility Increased Volatility
(Coefficient of Variation(3)) (Coefficient of Variation(3))
Source: SNL Financial.
1) 13-year FFO (Core FFO results are shown for 2009 to 2018; prior years reflect reported FFO results). FFO and Core FFO are non-GAAP financial measures. For description of FFO and Core FFO and reconciliations to net income,
see the Appendix.
2) Dividend per share CAGR calculated using 2005 and 2018 actuals.
3) Coefficient of variation is the standard deviation of annual observations divided by the mean for the 13 years ended 2018.
DIGITAL REALTY | INVESTOR PRESENTATION | MAY 2019 | 34Graham’s Golden Rules
Defensive Requirements for the Intelligent Investor (1)
1 Adequate Size of the Enterprise $38 Bn
ENTERPRISE VALUE (2)
2 Sufficiently Strong Financial Condition BBB / Baa2 / BBB
INVESTMENT GRADE BALANCE SHEET
3 Earnings Stability
GFC
+ GROWTH
IN CORE FFO / SH EACH AND EVERY YEAR
05 06 07 08 09 10 11 12 13 14 15 16 17 18
11%
4 Dividend Record CAGR
UNINTERRUPTED GROWTH IN DIVIDENDS PER SHARE
5 Earnings Growth 12% CAGR
IN CORE FFO PER SHARE SINCE 2006
6 Moderate Price / Earnings Ratio 18x
PRICE / 2019E CORE FFO (3)
7 Moderate Price to Assets Ratio 4%
PREMIUM TO CONSENSUS NAV (4)
1) Graham, B. (1949). The Intelligent Investor. New York, NY: Harper & Brothers.
2) As of March 31, 2019. Includes Digital Realty’s pro rata share of unconsolidated joint venture debt.
3) Based on closing stock price of $117.42 on May 7, 2019 and the mid-point of 2019 core FFO per share guidance of $6.60 - $6.70.
4) Based on SNL consensus NAV of $112.43 on May 7, 2019. For illustrative purposes only. Management does not confirm or endorse the estimates and cautions users to form their own view of NAV.
For a description of the components of Net Asset Value (NAV), please see our 1Q19 Earnings Press Release and Supplemental Information, which was furnished to the SEC on April 25, 2019.
DIGITAL REALTY | INVESTOR PRESENTATION | MAY 2019 | 35Delivering Superior Risk-Adjusted Returns
Investing Opportunistically to Expand the Global Platform
LONG-TERM VALUE CREATION
PRE-LEASING (%) 2017 2018
LEASE TERM (Years) 2017 2018
CREDIT QUALITY (% Investment Grade)(1) 2017 2018
SPREAD OVER
COST OF CAPITAL
Longer Lease Term
SPREAD OVER
COST OF CAPITAL TOTAL CONTRACT VALUE
Greater Volume
TOTAL CONTRACT VALUE ECONOMIC VALUE-ADDED
Meaningful
1) Credit ratings from S&P, Moody’s and Fitch reflect credit ratings of customer parent entity. There can be no assurance that a customer parent entity will satisfy the customer’s lease obligations upon such customer’s default.
DIGITAL REALTY | INVESTOR PRESENTATION | MAY 2019 | 36Prudent
Capital Allocation
DISCIPLINED INVESTMENT CRITERIA
GUIDED BY RETURN ON INVESTED CAPITAL
DIGITAL REALTY | INVESTOR PRESENTATION | MAY 2019 | 37Stringent Acquisition Criteria
Market Fundamentals, Accessibility, Stability and Risk
2010 2012 2015 2016 2017 2018
365 Main Sentrum European DuPont Fabros
Portfolio Portfolio Telx Acquisition Portfolio Technology Ascenty
Five assets in the Western Three assets in London 20 assets in 13 metro Eight assets in Europe 12 assets and six Eight assets and six
U.S. and Northern Virginia areas across the U.S. development projects development projects in
across the U.S. Brazil
June 2, 2010: June 26, 2012: July 14, 2015: May 16, 2016 June 9, 2017: September 24, 2018:
Announced $725 million Announced $1.1 billion Announced $1.9 billion Announced $875 million Announced $7.6 billion Announced $1.8 billion
acquisition acquisition acquisition acquisition acquisition acquisition and JV
June 2, 2010: June 26, 2012: July 14, 2015: May 16, 2016: June 9, 2017: September 24, 2018:
Announced $400 million Announced $800 million Announced $700 million Announced $1.4 billion 100% stock-for-stock Announced $1.1 billion
equity offering equity offering equity offering equity offering transaction equity offering
DIGITAL REALTY | INVESTOR PRESENTATION | MAY 2019 | 38Stringent Acquisition Criteria
Market Fundamentals, Accessibility, Stability and Risk
KEY ELEMENTS OF INVESTMENT UNDERWRITING
Market Fundamentals Accessibility / Business-Friendly /
Internet Proximity Stable Locations
▪ Core metro areas / major ▪ Access to fiber ▪ Accommodative local utility
central business districts ▪ Access to power providers
▪ Supply & demand dynamics ▪ Proximity to major airports ▪ Ease of doing business
▪ Customer verticals ▪ Broadband penetration ▪ Reasonable entitlement
approval process
▪ Land availability ▪ Subsea cable landings
▪ Low natural disaster-
▪ Construction costs
prone areas
▪ Utility rates
▪ Respect for property rights
▪ Financial projections and rule of law
▪ Tax regime
DIGITAL REALTY | INVESTOR PRESENTATION | MAY 2019 | 39Conservative
Financial Strategy
COMMITTED TO MAINTAINING
A FLEXIBLE BALANCE SHEET
DIGITAL REALTY | INVESTOR PRESENTATION | MAY 2019 | 40Prudent Financial Management
Positioning for Growth
INVESTMENT GRADE BALANCE SHEET
Consistently maintain balance sheet positioned for new investment
opportunities
ORGANIC GROWTH
Focus on driving higher same-capital cash NOI growth
RISK-ADJUSTED RETURNS
Earn higher risk-adjusted returns on our traditional asset base
BUILD AND EXPAND
Continue to prudently build out campuses and expand our global footprint
OPERATING EFFICIENCIES
Capitalize on operating efficiencies derived from our scale and expertise
STAKEHOLDER ALIGNMENT
Align our team with stakeholders
DIGITAL REALTY | INVESTOR PRESENTATION | MAY 2019 | 41Industry Leading Sustainability
Track Record and Commitment to Energy Efficiency
Award-winning
Management and Track record of data center
organizational sustainable Industry-leading designs and Thought leadership
commitment to project clean energy third-party and innovation in
sustainability investment solutions certification energy efficiency
• Full time REIT-sustainability • Successfully allocated • 288 MW of renewable • 62 green building • US DoE Better Building’s
expertise in-house $493 million of proceeds wind and solar projects certifications globally Challenge for data centers -
from data center under contract in the US (7.1 MSF) Achieved 25% savings in 2017
• Board oversight and senior
industry’s first green bond vs 20% target by 2024
executive with sustainability • Top 10 on EPA Green • 4 green building
management responsibility • 100% renewable energy Power Partnership Tech certifications in 2018 • 24 US EPA ENERGY STAR
for US colocation and and Telecom sector for (1.0 MSF) certifications (4.2 MSF)
• Integrated cross-functional
EMEA portfolios renewable energy
teams • 3 LEED certifications in • EU Code of Conduct for Data
• Issued €1.1Bn green bond 2019 (1.0 MSF) (YTD) Centres
• GRESB Green Star 2018
in first quarter of 2019
• NAREIT Leader in the Light,
Data Center Sector Leaser
DIGITAL REALTY | INVESTOR PRESENTATION | MAY 2019 | 42Credit Metrics Compare Favorably To Blue Chip REITs
Committed to a Conservative Capital Structure
Net Debt / LQA Adjusted EBITDA(1) Net Debt + Preferred / LQA Adjusted EBITDA(1)
8x 8x
7.2x
6.6x
6.5x 6.2x
6.0x 5.6x 5.5x
6x 5.5x 5.5x 5.3x 5.3x 6x 5.4x
4.6x 4.6x 4.4x 4.3x
4.4x 4.3x
4x 4x
2x 2x
-- --
BXP KIM HCP EQR FRT AVB PLD SPG KIM BXP FRT HCP EQR AVB PLD SPG
Interest Coverage(1)(2) Fixed Charge Coverage(1)(3)
12x 10x
9.6x 8.1x
10x 8.6x 8x
7.8x
8x 5.9x
6x 5.1x
6x 4.5x 4.2x 4.2x
4.6x 4.5x 4.4x 4.3x 4.3x 3.6x
3.6x 4x 3.0x 3.0x
4x
2x 2x
-- --
PLD SPG AVB FRT HCP KIM EQR BXP PLD AVB SPG HCP EQR FRT BXP KIM
Source: Company calculations based on 1Q19 data, unless otherwise indicated; peer metrics derived from public filings. Peers may calculate these or similar metrics differently. Please see Appendix for calculation of DLR ratios.
1) Adjusted EBITDA is a non-GAAP financial measure.
2) Based on GAAP interest expense plus capitalized interest for the quarter ended March 31, 2019.
3) Calculated as Adjusted EBITDA divided by fixed charges. Fixed charges consist of GAAP interest expense, capitalized interest, scheduled debt principal payments and preferred dividends for the quarter.
DIGITAL REALTY | INVESTOR PRESENTATION | MAY 2019 | 43Recent Results
FIRST QUARTER 2019
HIGHLIGHTS
Note: The slides in this section were originally posted to the Company's website on April 25, 2019 and have not been updated to reflect changes occurring after that date.
DIGITAL REALTY | INVESTOR PRESENTATION | MAY 2019 | 44Expanding Global Platform
Supporting Customer Growth
Tokyo
Chile
Chile
Singapore
3 Global Expansions
Securing our supply chain
to support customer growth
12 Acres 80+ MW
of Land of Potential IT Capacity
Singapore Tokyo
DIGITAL REALTY | INVESTOR PRESENTATION | MAY 2019 | 45Socially Responsible Investing
Delivering Sustainable Growth for Stakeholders
2012 2013 2014 2015 2016 2017 2018 2019
• Implemented majority • Approved new long-term • Board refreshment: • Provided stockholders the
voting standards for incentive plan tied to relative Mr. Mohebbi and ability to amend bylaws
director elections total stockholder return Mr. Patterson added
to Board • Board refreshment:
• Appointed first • Appointed new permanent CEO Ms. Earley resigned and
Independent Chairman, and Director, Mr. Stein Mr. Zerbst’s term expired
Mr. Singleton
• Board refreshment: • Established minimum • Appointed new Independent • Provided proxy access for
Mr. Kennedy and stock ownership Chairman, Mr. Chapman stockholders
Mr. LaPerch added guidelines
to Board • Board refreshment: • Amended corporate
Ms. Hogan Preusse governance guidelines to
added to Board clarify that director candidate
Mr. Coke and Mr. Roberts pools shall include candidates
added to Board with diversity of race,
ethnicity and gender
DIGITAL REALTY | INVESTOR PRESENTATION | MAY 2019 | 46Firm Fundamentals
Robust Demand, Rational Supply
NORTH AMERICA EMEA APAC
2,150 2,557 1,250 817 896
1,014
1Q18 1Q19
1Q18 1Q19 1Q18 1Q19
MEGAWATTS COMMISSIONED(1)(2) MEGAWATTS COMMISSIONED(1)(2) MEGAWATTS COMMISSIONED(1)(2)
91% 89% 89% 84% 90% 90%
DIGITAL DIGITAL REGION DIGITAL
REGION REGION REALTY
REALTY REALTY
OCCUPANCY RATE (1Q19)(1) OCCUPANCY RATE (1Q19)(1) OCCUPANCY RATE (1Q19)(1)
1.6x
Market Absorption-to-Available
1.6x
Market Absorption-to-Available
1.1x
Market Absorption-to-Available
Current Construction(3) Current Construction(3) Current Construction(3)
1) Management estimates, based on a sub-set of Digital Realty metros
(North America: Northern Virginia, Chicago, Dallas, Silicon Valley, New Jersey, Phoenix and Toronto; EMEA: Amsterdam, Dublin, Frankfurt, and London; APAC: Melbourne, Osaka, Singapore and Sydney).
2) Prior periods may be adjusted to reflect updated information.
3) Trailing 12-month market absorption divided by available data center construction.
DIGITAL REALTY | INVESTOR PRESENTATION | MAY 2019 | 47Supportive Economic Growth Outlook
Levered to Long-Term Secular Demand Drivers
4Q18 CALL CURRENT Better/
February 4, 2019 April 19, 2019 Worse 2019E 2020E
Global GDP Growth Forecast (1) 2019E: 3.5% 2019E: 3.3% q 3.3% 3.6%
MACROECONOMIC
U.S. GDP Growth Forecast (1) 2019E: 2.5% 2019E: 2.3% q 2.3% 1.9%
U.S. Unemployment Rate (2) 4.0% 3.8% q 3.7% 3.6%
(2)
Inflation Rate – U.S. Annual CPI Index 1.9% 1.9% tu 1.9% 2.1%
Crude Oil ($/barrel) (3) $54 $64 p $60 $65
Control of White House, Senate and HoR (4) R,R,D R,R,D tu R,R,D D,R,D
Three-Month Libor (USD) (2) 2.7% 2.6% q 2.7% 2.6%
INTEREST RATES
10-Yr U.S. Treasury Yield (2) 2.7% 2.6% q 2.8% 2.9%
GBP-USD (2) 1.30 1.30 tu 1.36 1.44
EUR-USD (2) 1.14 1.12 q 1.16 1.23
S&P 500 (2) 2,713 (YTD 8.3%); P/E: 18.1x 2,905 (YTD 16.6%); P/E: 19.0x p 17.5x 15.7x
EQUITIES
NASDAQ 100 (2) 6,942 (YTD 9.7%); P/E: 22.2x 7,690 (YTD 21.9%); P/E: 24.3x p 21.5x 18.9x
(2)(5)
RMZ 1,175 (YTD 11.1%); P/AFFO 18.0x 1,195 (YTD 14.3%); P/AFFO 18.3x p 18.3x 17.7x
IT Spending Growth Worldwide (6) 2019E: 3.1% 2019E: 3.2% p 3.2% 2.8%
INDUSTRY
Server Shipment Worldwide (7) 2019E: 4.1% 2019E: 4.0% q 4.0% 1.9%
Global Data Center IP Traffic (8) CAGR 2016 - 2021E: 25% CAGR 2016 - 2021E: 25% tu CAGR 2016 - 2021E: 25%
Global Cloud IP Traffic (8) CAGR 2016 - 2021E: 27% CAGR 2016 - 2021E: 27% tu CAGR 2016 - 2021E: 27%
1) IMF World Economic Outlook January 2019 and April 2019 5) Citi Investment Research - January 2019 and April 17, 2019
2) Bloomberg 6) Gartner: IT Spending, Worldwide (constant currency), December 2018 and February 2019
3) Bloomberg, NY Mercantile Exchange WTI Crude Oil (Front Month) 7) Gartner: Servers Forecast Worldwide, January 2019 and April 2019
4) FiveThirtyEight- January 2019 and April 2019 8) Cisco Global Cloud Index: Forecast and Methodology, 2016-2021 – November 2018
DIGITAL REALTY | INVESTOR PRESENTATION | MAY 2019 | 48Sunny Forecast for Cloud Growth
Global Interconnected Platform Poised to Capitalize
>50%
$250 Billion
32% 58% of public cloud compute
revenue milestone surpassed by
cloud vendors in 2018(1)
growth in cloud operator of enterprise cloud
and storage services users
and vendor revenues users employ a hybrid
have moved a workload
2x
from 2017(1) cloud model(2)
back on-premise(2)
overall market expected to double in
size in under four years(1)
1) Source: Synergy Research Group, January 2019
2) Source: IDC: Redefining hybrid cloud, April 2018
DIGITAL REALTY | INVESTOR PRESENTATION | MAY 2019 | 49Financial Results
DIGITAL REALTY | INVESTOR PRESENTATION | MAY 2019 | 50Lumpy But Healthy
Comprehensive Solutions Support Diverse Customer Base
HISTORICAL BOOKINGS
ANNUALIZED GAAP BASE RENT(1)(2)
$ in millions
Space & Power Interconnection
$100
$75
$50
$25
$0
2009 2010 2011 2012 2013 2014 2015 2016 2017 2018 2019
1Q19 BOOKINGS BY PRODUCT(1)(2)
$29.0 mm $4.9 mm $8.1 mm $0.3 mm $7.5 mm $49.8 mm
TURN-KEY POWERED BASE COLOCATION NON-TECHNICAL INTERCONNECTION TOTAL BOOKINGS
FLEX® BUILDING®
Note: Darker shading represents interconnection bookings. First quarter bookings are highlighted in lighter blue. First quarter of 2019 includes $8.6 million from Ascenty.
1) GAAP rental revenues include total rent for new leases and expansions. The timing between lease signing and lease commencement (and receipt of rents) may be significant.
2) Includes signings for new and re-leased space.
DIGITAL REALTY | INVESTOR PRESENTATION | MAY 2019 | 51Diversified
Global Demand
Toronto
Frankfurt
Toronto
Chile
Brazil Singapore
5 of Top 10 49% Chile Frankfurt
Metro Areas Outside the U.S. of Total 1Q19
(Annualized GAAP Signings) Signings
25+ Metro Areas
Signed in 1Q19
Singapore Brazil
DIGITAL REALTY | INVESTOR PRESENTATION | MAY 2019 | 52Diversified
Customer Base
1Q19 Signings by Vertical
Financial
Content 5% Cloud
8% Service
Provider
Enterprise 33%
9%
Autonomous Driving
Network
14%
IT
Services
31%
43 New Logos
Digital Wearable
Payments Healthcare
DIGITAL REALTY | INVESTOR PRESENTATION | MAY 2019 | 53Top-Line Step Function
Healthy Backlog Sets a Solid Foundation
BACKLOG ROLL-FORWARD COMMENCEMENT TIMING
$ in millions $ in millions
DLR Backlog Ascenty Backlog DLR Backlog Ascenty Backlog
$8 $7
$34 $45 $7
$5
$57 $14
$59 $59
$5
$38
$97 $85
$85 $75
4Q18 Backlog Signings Commencements 1Q19 Backlog 2019 2020 2021 Totals
Note: Totals may not add up due to rounding. Amounts shown represent GAAP annualized base rent from leases signed, but not yet commenced, and are based on current estimates of future lease commencement timing. Actual results may vary from current estimates.
The lag between lease signing and lease commencement (and receipt of rents) may be significant. Reflects expected commencement date at time of signing.
DIGITAL REALTY | INVESTOR PRESENTATION | MAY 2019 | 54Holistic Approach to Customer Relationship Management
Leveraging Multiple Touch Points to Maximize Relationship Value
1Q19 RE-LEASING SPREADS
As Reported
TURN-KEY FLEX® POWERED BASE BUILDING® COLOCATION TOTAL
RENTAL RATE CHANGE RENTAL RATE CHANGE RENTAL RATE CHANGE RENTAL RATE CHANGE
-5.9% -12.6% 2.5% -6.9%
CASH CASH CASH CASH
4.3% 11.0% 2.5% 7.1%
GAAP GAAP GAAP GAAP
Excluding Customers with New Leasing in the Last Six Months
Excluding global relationship customers that executed
$15 mm of annualized GAAP rental revenue in new deals -0.3%
CASH
across multiple metro areas over the past year, cash rent change is
virtually flat for the quarter 2.7%
GAAP
Note: Total represents Turn-Key Flex®, Powered Base Building®, Colocation, and Non-Tech leases signed during the quarter ended March 31, 2019.
DIGITAL REALTY | INVESTOR PRESENTATION | MAY 2019 | 55Constant-Currency Growth
FX Represents ~ 100 bps Drag on Reported Results
As Reported Constant-Currency Including Ascenty
10.7%
9.4%
7.6%
6.9%
6.3% 6.0%
-1.5%
-2.5%
1Q18 / 1Q19 1Q18 / 1Q19 Adj. 1Q18 / 1Q19 1Q18 / 1Q19 Core FFO
Revenue Growth EBITDA Growth(1) Stabilized Cash NOI per share Growth (1)
Growth (1)
Note: Constant-currency, Adjusted EBITDA, same-capital cash NOI and core FFO are non-GAAP financial measures. For a description of these measures, see the Appendix.
1) Net income for the for the quarter ending March 31, 2019 was $121 million. Net income for the quarter ending March 31, 2018 was $110 million.
DIGITAL REALTY | INVESTOR PRESENTATION | MAY 2019 | 56Putting Exposure in Perspective
Benefits of Scale and Diversification on Display
EXPOSURE BY REVENUE 2019 CORE FFO/SHARE EXPOSURE
USD CAD GBP EURO JPY HKD SGD AUD
0.6%
BENCHMARK
1% 9%
RATES
4% +/- 100 bps
82% 0% Midpoint of 0.3% 0.1%
Guidance
0% $6.60 – $6.70(1) GBP EUR
+/- 10% +/- 10%
4%
1%
EXCHANGE RATES(2) U.S. DOLLAR INDEX 1Q19
1Q18
U.S. DOLLAR / U.S. DOLLAR /
BRITISH POUND EURO
6.4%INCREASE
7.5%INCREASE
Source: FactSet
1) Based on the midpoint of 2019 core FFO per share guidance of $6.60 – $6.70. Core FFO is a non-GAAP financial measure. For a definition of core FFO and a reconciliation to its nearest GAAP equivalent, see the Appendix.
2) Based on average exchange rates for the quarter ending March 31, 2019 compared to average exchange rates for the quarter ending March 31, 2018.
DIGITAL REALTY | INVESTOR PRESENTATION | MAY 2019 | 57Four Quarter Two-Step
Beat, Dip, Shuffle, Bounce
2019E CORE FFO PER SHARE
1Q19 NOI Growth Brookfield JV Tax Benefit Forward Equity 2Q19 Lease 3Q19 4Q19
Funding Settlement Commencements
Note: Based on management estimates; actual performance may differ materially. Core FFO and NOI are non-GAAP financial measures. For descriptions and reconciliations to the closest GAAP equivalents, please see the
Appendix.
DIGITAL REALTY | INVESTOR PRESENTATION | MAY 2019 | 58Prudently Financed Transaction Enhances Credit Stats
Reflecting a Full-Quarter Contribution
(1) (2)
Net Debt to Adjusted EBITDA Fixed Charge Coverage Ratio
5.5x
0.4x 5.1x
4.1x
3.6x 0.5x
11% 0%
Floating Rate Floating Rate
Debt Debt(4)(5)
1Q19 Pro Forma for 1Q19 (4)(5) 1Q19 Pro Forma for 1Q19
(4)(5)
Reported Ascenty JV and As Adjusted Reported Ascenty JV and As Adjusted
Forward Equity (3) Forward Equity (3)
1) Calculated as total debt at balance sheet carrying value, plus capital lease obligations, plus our share of unconsolidated JV debt, less unrestricted cash and cash equivalents divided by the product of Adjusted EBITDA
(inclusive of our share of JV EBITDA) multiplied by four. Adjusted EBITDA is a non-GAAP financial measure. For a description of Adjusted EBITDA and the calculation of these ratios, see the Appendix.
2) Fixed charge coverage ratio is Adjusted EBITDA divided by total fixed charges. Total fixed charges include interest expenses, capitalized interest, scheduled debt principal payments and preferred dividends, excluding
bridge facility fees for the quarter ended March 31, 2019. Adjusted EBITDA is a non-GAAP financial measure. For a description of Adjusted EBITDA and the calculation of these ratios , see the Appendix.
3) Pro Forma for Ascenty JV at DLR’s share at 49% and assumed forward equity closing.
4) Adjusted to include a full quarter of Ascenty’s adjusted EBITDA, assuming DLR’s share at 49%.
5) Adjusted to reflect pro forma September 24, 2018 full settlement of the $1.1 billion forward equity offering executed on September 24, 2018. Assumes proceeds are used to repay borrowings under the global unsecured
revolving credit facility.
DIGITAL REALTY | INVESTOR PRESENTATION | MAY 2019 | 59Matching the Duration of Assets and Liabilities
Clear Runway on the Left, No Bar Too Tall on the Right
DEBT PROFILE
DEBT MATURITY SCHEDULE AS OF MARCH 31, 2019(1)(2)
(USD in billions)
Unsecured
99%
6 YEARS 3.4 %
Unsecured Secured
Weighted Avg. Weighted Avg.
Maturity(1)(2) Coupon(1)
Fixed
$2.4 89%
Fixed Floating
$1.6
$1.2
$1.0 $1.1
$0.8
$0.7 $0.7 USD
$0.5 £ € $0.5
$0.4
GBP
$0.1
€ ¥ £ £ € £ £ 47%
USD Euro
2019 2020 2021 2022 2023 2024 2025 2026 2027 2028 2029 2030
Other
Pro Rata Share of JV Debt Secured Mortgage Debt Unsecured Senior Notes
(3)
Unsecured Term Loan Unsecured Credit Facilities Unsecured Green Bonds
Note: As of March 31, 2019.
1) Includes Digital Realty’s pro rata share of four unconsolidated joint venture loans.
2) Assumes exercise of extension options.
3) Includes Yen Facility.
DIGITAL REALTY | INVESTOR PRESENTATION | MAY 2019 | 60Consistent Execution on Strategic Vision
Delivering Current Results, Seeding Future Growth
SUCCESSFUL FIRST QUARTER 2019 INITIATIVES
80+ MW
1. Extending our Global Footprint of Potential
Entered Chile, Acquired Strategic APAC Land Holdings IT Capacity
2. Delivering Sustainable Growth for All Stakeholders 3%
Provided Proxy Access, Adopted Rooney Rule stockholder for
three years
3. Growing the Dividend 14th
Raised the Common Dividend by Seven Percent Consecutive
Annual Increase
4. Strengthening the Balance Sheet
Redeemed High-Cost Capital, Locked in Attractive Long-Term Coupons
-30 bps
Weighted Average
Coupon
DIGITAL REALTY | INVESTOR PRESENTATION | MAY 2019 | 61Appendix
DIGITAL REALTY | INVESTOR PRESENTATION | MAY 2019 | 62Robust Long-Term Demand, Lumpy Near-Term Signings
Diverse Customer Base + Product Offerings
HISTORICAL BOOKINGS TRAILING FOUR-QUARTER AVERAGE
ANNUALIZED GAAP BASE RENT(1)(2)
$ in millions
Space & Power Interconnection
$80
$60
$40
$20
$0
2009 2010 2011 2012 2013 2014 2015 2016 2017 2018 2019
1Q19 TRAILING FOUR-QUARTER AVERAGE BOOKINGS BY PRODUCT(1)(2)
$44.9 mm $2.4 mm $9.0 mm $0.6 mm $7.3 mm $64.2 mm
TURN-KEY POWERED BASE COLOCATION NON-TECHNICAL INTERCONNECTION TOTAL BOOKINGS
FLEX® BUILDING®
Note: Darker shading represents interconnection bookings.
1) GAAP rental revenues include total rent for new leases and expansions. The timing between lease signing and lease commencement (and receipt of rents) may be significant.
2) Includes signings for new and re-leased space.
DIGITAL REALTY | INVESTOR PRESENTATION | MAY 2019 | 63Appendix
Management Statements on Non-GAAP Measures
The information included in this presentation contains certain non-GAAP financial measures that management believes are helpful in understanding our business, as further
described below. Our definition and calculation of non-GAAP financial measures may differ from those of other REITs, and, therefore, may not be comparable. The non-GAAP
financial measures should not be considered an alternative to net income or any other GAAP measurement of performance and should not be considered an alternative to cash
flows from operating, investing or financing activities as a measure of liquidity.
Funds From Operations (FFO): We calculate funds from operations, or FFO, in accordance with the standards established by the National Association of Real Estate Investment
Trusts, or NAREIT, in the NAREIT Funds From Operations White Paper - 2018 Restatement. FFO represents net income (loss) (computed in accordance with GAAP), excluding
gains (or losses) from real estate transactions, impairment of investment in real estate, real estate related depreciation and amortization (excluding amortization of deferred
financing costs), unconsolidated JV real estate related depreciation & amortization, non-controlling interests in operating partnership and after adjustments for unconsolidated
partnerships and joint ventures. Management uses FFO as a supplemental performance measure because, in excluding real estate related depreciation and amortization and
gains and losses from property dispositions and after adjustments for unconsolidated partnerships and joint ventures, it provides a performance measure that, when compared
year over year, captures trends in occupancy rates, rental rates and operating costs. We also believe that, as a widely recognized measure of the performance of REITs, FFO will
be used by investors as a basis to compare our operating performance with that of other REITs. However, because FFO excludes depreciation and amortization and captures
neither the changes in the value of our data centers that result from use or market conditions, nor the level of capital expenditures and capitalized leasing commissions
necessary to maintain the operating performance of our data centers, all of which have real economic effect and could materially impact our financial condition and results
from operations, the utility of FFO as a measure of our performance is limited. Other REITs may not calculate FFO in accordance with the NAREIT definition and, accordingly,
our FFO may not be comparable to other REITs’ FFO. FFO should be considered only as a supplement to net income computed in accordance with GAAP as a measure of our
performance.
Core Funds from Operations (Core FFO):
We present core funds from operations, or core FFO, as a supplemental operating measure because, in excluding certain items that do not reflect core revenue or expense
streams, it provides a performance measure that, when compared year over year, captures trends in our core business operating performance. We calculate core FFO by adding
to or subtracting from FFO (i) termination fees and other non-core revenues, (ii) transaction and integration expenses, (iii) loss from early extinguishment of debt, (iv)
severance, equity acceleration, and legal expenses, (v) loss on FX revaluation, (vi) gain on contribution to unconsolidated joint venture, net of related tax, and (vii) other non-
core expense adjustments. Because certain of these adjustments have a real economic impact on our financial condition and results from operations, the utility of core FFO as a
measure of our performance is limited. Other REITs may calculate core FFO differently than we do and accordingly, our core FFO may not be comparable to other REITs' core
FFO. Core FFO should be considered only as a supplement to net income computed in accordance with GAAP as a measure of our performance.
Adjusted Funds from Operations (AFFO):
We present adjusted funds from operations, or AFFO, as a supplemental operating measure because, when compared year over year, it assesses our ability to fund dividend
and distribution requirements from our operating activities. We also believe that, as a widely recognized measure of the operations of REITs, AFFO will be used by investors as a
basis to assess our ability to fund dividend payments in comparison to other REITs, including on a per share and unit basis. We calculate AFFO by adding to or subtracting from
core FFO (i) non-real estate depreciation, (ii) amortization of deferred financing costs, (iii) amortization of debt discount/premium, (iv) non-cash stock-based compensation
expense, (v) straight-line rental revenue, (vi) straight-line rental expense, (vii) above- and below-market rent amortization, (viii) deferred tax expense, (ix) leasing compensation
and internal lease commissions, and (x) recurring capital expenditures. Other REITs may calculate AFFO differently than we do and accordingly, our AFFO may not be
comparable to other REITs’ AFFO. AFFO should be considered only as a supplement to net income computed in accordance with GAAP as a measure of our performance.
DIGITAL REALTY | INVESTOR PRESENTATION | MAY 2019 | 64Appendix
Management Statements on Non-GAAP Measures
EBITDA and Adjusted EBITDA:
We believe that earnings before interest, loss from early extinguishment of debt, income taxes, depreciation and amortization, and impairment of investments in real estate, or
EBITDA, and Adjusted EBITDA (as defined below), are useful supplemental performance measures because they allow investors to view our performance without the impact of
non-cash depreciation and amortization or the cost of debt and, with respect to Adjusted EBITDA, severance, equity acceleration, and legal expenses, transaction and
integration expenses, (gain) loss on real estate transactions, equity in earnings adjustment for non-core items, other non-core adjustments, net, noncontrolling interests,
preferred stock dividends, including undeclared dividends, and issuance costs associated with redeemed preferred stock. Adjusted EBITDA is EBITDA excluding unconsolidated
joint venture real estate related depreciation & amortization, severance, equity acceleration, and legal expenses, transaction and integration expenses, (gain) on sale,
impairment of investments in real estate, other non-core adjustments, net, non-controlling interests, and preferred stock dividends, including undeclared dividends. In
addition, we believe EBITDA and Adjusted EBITDA are frequently used by securities analysts, investors and other interested parties in the evaluation of REITs. Because EBITDA
and Adjusted EBITDA are calculated before recurring cash charges including interest expense and income taxes, exclude capitalized costs, such as leasing commissions, and are
not adjusted for capital expenditures or other recurring cash requirements of our business, their utility as a measure of our performance is limited. Other REITs may calculate
EBITDA and Adjusted EBITDA differently than we do and accordingly, our EBITDA and Adjusted EBITDA may not be comparable to other REITs’ EBITDA and Adjusted EBITDA.
Accordingly, EBITDA and Adjusted EBITDA should be considered only as supplements to net income computed in accordance with GAAP as a measure of our financial
performance.
Net Operating Income (NOI) and Cash NOI:
Net operating income, or NOI, represents rental revenue, tenant reimbursement revenue and interconnection revenue less utilities expense, rental property operating
expenses, property taxes and insurance expenses (as reflected in the statement of operations). NOI is commonly used by stockholders, company management and industry
analysts as a measurement of operating performance of the company’s rental portfolio. Cash NOI is NOI less straight-line rents and above- and below-market rent amortization.
Cash NOI is commonly used by stockholders, company management and industry analysts as a measure of property operating performance on a cash basis. However, because
NOI and cash NOI exclude depreciation and amortization and capture neither the changes in the value of our data centers that result from use or market conditions, nor the
level of capital expenditures and capitalized leasing commissions necessary to maintain the operating performance of our data centers, all of which have real economic effect
and could materially impact our results from operations, the utility of NOI and cash NOI as measures of our performance is limited. Other REITs may calculate NOI and cash NOI
differently than we do and, accordingly, our NOI and cash NOI may not be comparable to other REITs’ NOI and cash NOI. NOI and cash NOI should be considered only as
supplements to net income computed in accordance with GAAP as measures of our performance.
DIGITAL REALTY | INVESTOR PRESENTATION | MAY 2019 | 65Appendix
Management Statements on Non-GAAP Measures
The information included in this presentation contains forward-looking statements. Such statements are based on management’s beliefs and assumptions made based on information currently
available to management. Such forward-looking statements include statements relating to: our economic outlook; public cloud services spending; the expected timing, locations, benefits and
product offerings for IBM Cloud and Service Exchange; our acquisition of Ascenty; our corporate governance; our sustainability initiatives; the expected effect of foreign currency translation
adjustments on our financials; demand drivers and economic growth outlook; business drivers; sources and uses; our expected development plans and completions, including timing, total square
footage, IT capacity and raised floor space upon completion; expected availability for leasing efforts and colocation initiatives; organizational initiatives; our expected product offerings; our expected
Go-to-Market strategy; joint venture opportunities; occupancy and total investment; our expected investment in our properties; our estimated time to stabilization and targeted returns at
stabilization of our properties; our strategic alliances and partnerships; our expected future acquisitions; acquisitions strategy; available inventory and development strategy; the signing and
commencement of leases, and related rental revenue; lag between signing and commencement of leases; future rents; our expected same store portfolio growth; our expected growth and
stabilization of development completions and acquisitions; our expected mark-to-market rates on lease expirations, lease rollovers and expected rental rate changes; our expected yields on
investments; our expectations with respect to capital investments at lease expiration on existing data center or colocation space; barriers to entry; competition; debt maturities; lease maturities; our
expected returns on invested capital; estimated absorption rates; our other expected future financial and other results, and the assumptions underlying such results; our top investment geographies
and market opportunities; our expected colocation expansions; our ability to access the capital markets; expected time and cost savings to our customers; our customers’ capital investments; our
plans and intentions; future data center utilization, utilization rates, growth rates, trends, supply and demand, and demand drivers; datacenter outsourcing trends; datacenter expansion plans;
estimated kW/MW requirements; growth in the overall Internet infrastructure sector and segments thereof; the replacement cost of our assets; the development costs of our buildings, and lead
times; estimated costs for customers to deploy or migrate to a new data center; capital expenditures; the effect new leases and increases in rental rates will have on our rental revenues and results
of operations; lease expiration rates; our ability to borrow funds under our credit facilities; estimates of the value of our development portfolio; our ability to meet our liquidity needs, including the
ability to raise additional capital; the settlement of our forward sales agreements; credit ratings; capitalization rates, or cap rates; market forecasts; potential new locations; the expected impact of
our global expansion; dividend payments and our dividend policy; projected financial information and covenant metrics; annualized; core FFO run-rate and NOI Growth; other forward-looking
financial data; leasing expectations; our exposure to tenants in certain industries; our expectations and underlying assumptions regarding our sensitivity to fluctuations in foreign exchange rates and
energy prices; and the sufficiency of our capital to fund future requirements. You can identify forward-looking statements by the use of forward-looking terminology such as “believes,” “expects,”
“may,” “will,” “should,” “seeks,” “approximately,” “intends,” “plans,” “pro forma,” “estimates” or “anticipates” or the negative of these words and phrases or similar words or phrases which are
predictions of or indicate future events or trends and discussions which do not relate solely to historical matters. Such statements are subject to risks, uncertainties and assumptions, are not
guarantees of future performance and may be affected by known and unknown risks, trends, uncertainties and factors that are beyond our control that may cause actual results to vary materially.
Some of the risks and uncertainties include, among others, the following: reduced demand for data centers or decreases in information technology spending; decreased rental rates, increased
operating costs or increased vacancy rates; increased competition or available supply of data center space; the suitability of our data centers and data center infrastructure, delays or disruptions in
connectivity or availability of power, or failures or breaches of our physical and information security infrastructure or services; our dependence upon significant customers, bankruptcy or insolvency
of a major customer or a significant number of smaller customers, or defaults on or non-renewal of leases by customers; breaches of our obligations or restrictions under our contracts with our
customers; our inability to successfully develop and lease new properties and development space, and delays or unexpected costs in development of properties; the impact of current global and
local economic, credit and market conditions; our inability to retain data center space that we lease or sublease from third parties; difficulty acquiring or operating properties in foreign jurisdictions;
our failure to realize the intended benefits from, or disruptions to our plans and operations or unknown or contingent liabilities related to, our recent acquisitions; our failure to successfully
integrate and operate acquired or developed properties or businesses; difficulties in identifying properties to acquire and completing acquisitions; risks related to joint venture investments,
including as a result of our lack of control of such investments; risks associated with using debt to fund our business activities, including re-financing and interest rate risks, our failure to repay debt
when due, adverse changes in our credit ratings or our breach of covenants or other terms contained in our loan facilities and agreements; our failure to obtain necessary debt and equity financing,
and our dependence on external sources of capital; financial market fluctuations and changes in foreign currency exchange rates; adverse economic or real estate developments in our industry or
the industry sectors that we sell to, including risks relating to decreasing real estate valuations and impairment charges and goodwill and other intangible asset impairment charges; our inability to
manage our growth effectively; losses in excess of our insurance coverage; environmental liabilities and risks related to natural disasters; our inability to comply with rules and regulations applicable
to our company; our failure to maintain our status as a REIT for federal income tax purposes; our operating partnership’s failure to qualify as a partnership for federal income tax purposes;
restrictions on our ability to engage in certain business activities; and changes in local, state, federal and international laws and regulations, including related to taxation, real estate and zoning laws,
and increases in real property tax rates. The risks included here are not exhaustive, and additional factors could adversely affect our business and financial performance. We discussed a number of
additional material risks in our annual report on Form 10-K for the year ended December 31, 2018 and other filings with the Securities and Exchange Commission. Those risks continue to be relevant
to our performance and financial condition. Moreover, we operate in a very competitive and rapidly changing environment. New risk factors emerge from time to time and it is not possible for
management to predict all such risk factors, nor can it assess the impact of all such risk factors on the business or the extent to which any factor, or combination of factors, may cause actual results
to differ materially from those contained in any forward-looking statements. We expressly disclaim any responsibility to update forward-looking statements, whether as a result of new information,
future events or otherwise.
Digital Realty, Digital Realty Trust, the Digital Realty logo, Turn-Key Flex and Powered Base Building are registered trademarks and service marks of Digital Realty Trust, Inc. in the United States
and/or other countries.
DIGITAL REALTY | INVESTOR PRESENTATION | MAY 2019 | 66You can also read