Life Cycle Assessment of Beer in Support of an Environmental Product Declaration
←
→
Page content transcription
If your browser does not render page correctly, please read the page content below
Life Cycle Assessment of Beer in Support
of an Environmental Product Declaration
September 2013

By: Seth Lalonde, Anna Nicholson and Rita Schenck
Contents
Introduction .................................................................................................................................................. 1
Goal and scope of the Study ......................................................................................................................... 1
   System Function and functional unit ........................................................................................................ 1
   System boundaries.................................................................................................................................... 1
   Impact Categories ..................................................................................................................................... 3
Life Cycle Inventory ....................................................................................................................................... 6
   Ingredients ................................................................................................................................................ 6
       Fertilizer and Pesticides ........................................................................................................................ 6
       Barley .................................................................................................................................................... 7
       Malt and Yeast ...................................................................................................................................... 8
       Hops and Hops Pellets .......................................................................................................................... 8
       Adjunct Farm Products ......................................................................................................................... 8
   Brewery Operations .................................................................................................................................. 8
   Packaging .................................................................................................................................................. 9
   Transportation .......................................................................................................................................... 9
   Distribution ............................................................................................................................................... 9
   Use .......................................................................................................................................................... 10
   Missing Data............................................................................................................................................ 10
   Calculations ............................................................................................................................................. 10
   Allocation ................................................................................................................................................ 10
   End of Life and Recycling ........................................................................................................................ 10
   Unit process description and data quality evaluation ............................................................................ 11
Life Cycle Impact Assessment ..................................................................................................................... 17
   Results ..................................................................................................................................................... 17
   Sensitivity Analyses ................................................................................................................................. 21
Interpretation ............................................................................................................................................. 27
Value Judgments and Assumptions ............................................................................................................ 27
Critical Review............................................................................................................................................. 27
Environmental Product Declarations (Website Version) ............................................................................ 28
Environmental Product Declarations (Print Version).................................................................................. 32
Appendix A Data Collection Spreadsheets.................................................................................................. 35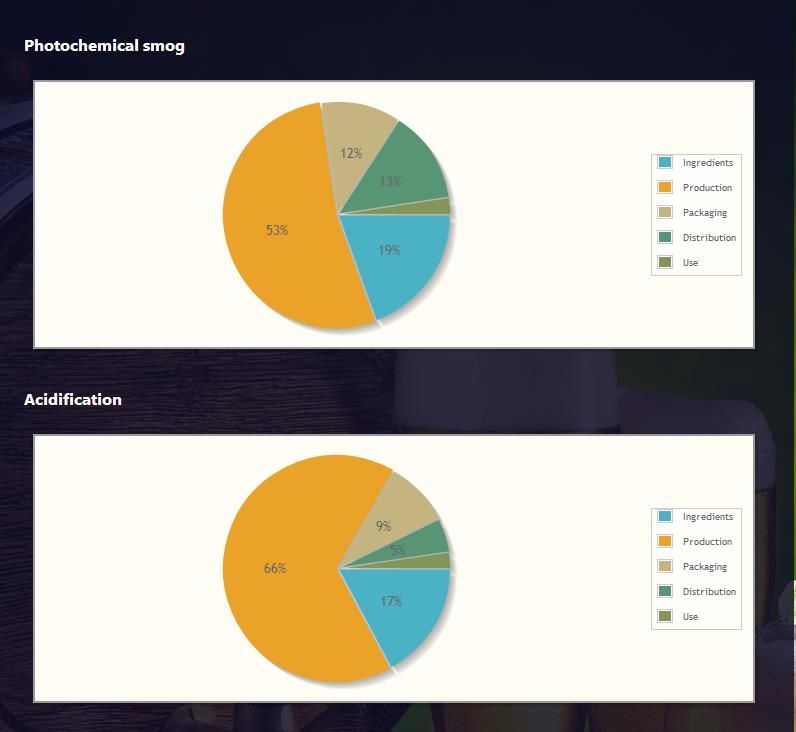
Appendix B Data Assumptions .................................................................................................................... 44
Appendix C Life Cycle Inventory ................................................................................................................. 47
Acknowledgements..................................................................................................................................... 48
References .................................................................................................................................................. 48
1

Introduction
This study is funded by a group of Beer producers, including American Brewing Co., Fort George
Brewery, Harmon Brewing Company, Hop Works Brewery, The RAM, Vashon Brewery, and by the City of
Tacoma Sustainability Program. They have retained the Institute for Environmental Research and
Education (IERE) to develop a product category rule and an environmental product declaration (EPD) for
their beer products. This document is the life cycle assessment of their beer products evaluated as part
of a pilot program allowing the breweries to produce EPDs using web-based application software.

IERE is a not-for-profit with a mission to undertake and disseminate comprehensive, fact-based research
for use in the development of responsible environmental policy, programs and decisions.

This analysis conforms to the Earthsure Beer Product Category Rule, number 50202201:2012i. This study
was carried out in conformity with ISO 14040ii, 14044iii and 14025iv.

Goal and scope of the Study
The goal of the study is to provide an Environmental Product Declaration for beer and to be the basis of
software automating the production of EPDs. The intended audiences are the general public, brewers,
purchasing agents, and consumers of the product. No comparative assertions are intended.

System Function and functional unit
The system function is the provision of brewed beer to the customer. The Functional Unit is 12 ounces
of beer consumed by a customer.

In accordance with ISO 14025, this report and the application software will be reviewed by a single,
independent LCA Certified Professional.

This EPD is reviewed by Tom Gloria, LCACP an external reviewer.

System boundaries
The scope of this study is cradle to grave. The system boundary of the analysis includes all life cycle
stages and is illustrated in Figure 1. Human waste from beer consumption is included in the system
boundary.

Per the Beer Product Category Rule, the system boundary excludes the production and disposal of
capital equipment, but includes the operation of the equipment. The personnel impacts (travel to/from
work; lunchroom operations and sanitary water treatment) are excluded. The office operations are
excluded. In accordance with the strict attributional approach, materials sent to recycling are excluded,
but any recycled materials used must be burdened by the impacts of the recycling. The system studied is
shown in Figure 1.
2

Figure 1 System boundary of the beer LCA study

                                                                                            Employee
                                                                                           Commuting

                                                                                           Barware
          Extraction                                                                      Manufacture
          of Natural
          Resources                                                                       Capital Goods
                                                                  Transport
                                                                                          Manufacture
           Farming
                                                  Grain
                                                                   Storage                  Materials
                                                 Crushing
           Chemical                                                                         Recycled
          Production                             Mash &
                                                                  Dispensing
                                                 Sparge

           Malting                                                  Waste
                                                   Boil
                                                                    Beer
             Yeast
                                             Chill/Filter         Packaging
          Production
                                                                   Disposal
          Packaging
                                                 Ferment          Packaging
         Manufacture
                                                                    Reuse
          Delivery to
           Brewery                               Package
                                                                 Brewhouse
                                                                  & Human
           Natural                                               Wastewater
            Gas                                  Storage
                                                                 Treatment
                                                                                              Primary
          Electricity                                            Spent Grains                  Data
                                                 Cleaning
                                                                                            Secondary
            Water                                                                              Data

                                                                                              Tertiary
                                                                                               Data

Data quality, sources and cutoff rules

The intent of the data collection was to gather primary data from all unit processes under the direct
control of the brewery, and to seek data from the first tier suppliers. Data on the ingredients used for
each beer was gathered using spreadsheets (see Appendix B). Since the production of malt and hops
occurs throughout the US, and because upstream vendors did not provide primary data, less than 17%
of the mass of the product was characterized using primary data. Agricultural production data was
provided from USDA National Agricultural Statistics Service Information, USDA National Agricultural
Library Digital Commonsv, and the Ecoinvent databasevi. First tier material content data for brewery
cleaning materials was provided by the Material Safety Data Sheets (MSDSs) provided by the first tier
suppliers. Life Cycle Inventory data was taken from the Ecoinvent database for the materials disclosed in
the MSDSs.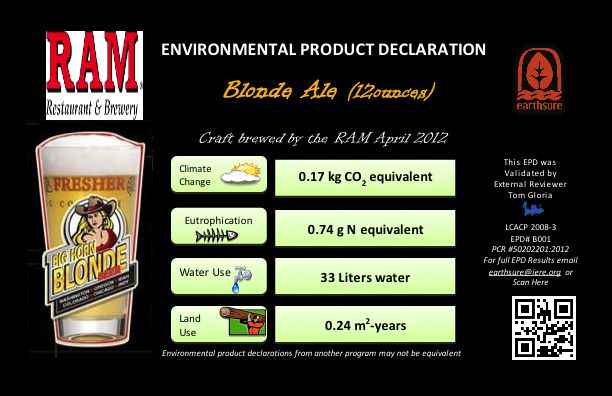
3

Primary data on hops production was gathered from an aggregator representing 24 producers and
approximately 25% of the total Hops production in the United States. However, it is not possible to trace
this data directly to any particular brewery, and thus represents secondary data in this study.

We preferred data from process LCI gathered within North America, and no more than ten years old. In
some cases, this quality criterion was not met, e.g. malt, steel, and container glass data from the US was
not available. We used data from OECD countries when US specific data was not available.

We used region specific process LCI data whenever possible. This included the creation of an electrical
grid mix to represent the current supply of the local electric utility of each brewery. When region
specific processes were not available, we employed process LCI data that represented US averages.

The cutoff rules used specified that at least 95% of all mass and energy and all known toxic materials are
included in the analysis. No product representing more than 1% of the total mass or energy of the
system was excluded.

Given the sale of spent grain in North America is a very rare occurrence and is typically given away as
animal feed, it is covered by a cutoff rule for recycled wastes. Packaging of farm inputs are expected to
be much less than one percent of the mass of the farm product outputs and are not included in this
analysis. All materials sent to recycling were outside the system boundary.

Impact Categories
The Life Cycle Impact Categories are those identified in the Product Category Rule. The majority of life
cycle impacts were calculated using the latest version of the US EPA Tool for the Reduction and
Assessment of Chemical and other Environmental Impacts (US EPA, 2012).

    Climate change is the result of the anthropogenic addition of greenhouse gases into the
    atmosphere. These gases trap heat in the atmosphere, leading to a wide diversity of effects,
    including sea level rise and acidification, extreme weather events such as hurricane and tornadoes
    and droughts and floods. Greenhouse gases are released primarily through combustion processes.
    Ruminant enteric fermentation and other biological processes also contribute to these emissions.
    Climate change ultimately yields effects such as crop failure and increased incidence of disease
    leading to human mortality and losses of species and ecosystems. The majority of greenhouse gases
    are derived from combustion, and all products include combustion in their value chains, even if only
    for the purpose of transportation.

    The midpoint indicator of climate change is the CO2 equivalents, a measure of infrared radiative
    forcing, using the most common and important (in terms of fraction of the greenhouse effect) gas,
    CO2. The lifetime of CO2 in the atmosphere is very variable, but a weighted average is near 100
    years, and thus the 100 year time horizon is selected. The characterization factors are derived from
        I    g v           l      l Cl       C    g ’               100-year horizon global warming
    potentials. In addition to CO2, N2O and CH4 are major drivers of climate change. Minor drivers of
    climate change include many refrigerants and some industrial chemicals. All of them must be
    accounted for in estimating the climate change impact.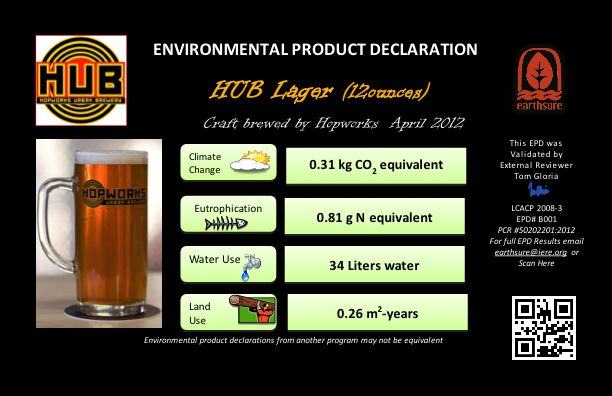
4

Acidification causes the destruction of aquatic and terrestrial ecosystems through the wet and dry
deposition of strong acids and ammonia. The acidification of soils mobilizes the aluminum in the
soils and this has direct toxic effects on fish and other species, as well as an indirect effect through
inhibition of uptake of potassium by plants, leading to loss of forest ecosystems. Acidification also
affects the built environment, causing the slow dissolution of buildings. We have chosen the
stoichiometric gram equivalents of hydrogen ion for emissions of oxides of sulfur and nitrogen,
ammonia, HCl, HF, H2SO4, and H3PO4.

Eutrophication is the overgrowth of biomass caused by the anthropogenic release of nutrients,
particularly fixed nitrogen and phosphorus. Eutrophied water bodies show early effects in terms of
species distribution and toxic algal blooms, and ultimately as algae decompose eutrophication
         x g        l     l     g f k ll . L g                 f       l ’      b            bj
to eutrophication seasonally. The most important causes of excess nutrient releases are agriculture,
human and animal wastes, and combustion processes. Beer and all food products contribute to
eutrophication.

I     1930’ A.C. R f l        v                    f b              g                            k
marine ecosytems was constant (C:N:P = 106:16:1, on an atom basis) and subsequently this ratio
was confirmed to be the same in freshwater systems. The Redfield ratio is the basis of all life cycle
impact models. We measure the Eutrophication potential in mass of nitrogen equivalents using the
US EPA TRACI 2.0 model.

Ozone Depletion occurs when reactive and persistent substances interact with the beneficial ozone
in the upper atmosphere, or stratosphere. This high altitude ozone filters out ultra-violet radiation
         l b x         l       f l lf f           bl                l      ’    f . R f g
and cold storage of beer are sources of ozone depletion. This impact category is measured in mass
unit equivalents of CFC-11, a refrigerant and powerful ozone depleting substance.

Ecotoxicity represent direct effects of releases of toxic materials on organisms. It is anticipated that
toxic materials will be emitted during the production and application of pesticides and fertilizers and
during the transportation of ingredients, packaging and beer in packaging. These are evaluated
using the USEtox model, latest version.

Photochemical smog is produced when oxides of nitrogen and volatile organic substances are
present in the atmosphere in the presence of sunlight. Ozone is formed, and this form of oxygen
causes many direct effects, reducing crop yields, asthma and other respiratory effects in humans
and animals. The production of ozone has been shown to be more related to the existence of oxides
of nitrogen (NOx) than to the release of volatile organic substances. All combustion processes in the
beer life cycle chain are potential sources of photochemical smog. Measurements of smog were
evaluated using the most recent U.S. EPA TRACI method, expressed in mass of ozone equivalents.

Water is an important component of beer and water is used in agriculture and in cleaning processes.
There is currently no consensus on how to measure water resource depletion, so at this time,
consumptive freshwater use shall be the indicator. Consumptive water use includes all the use of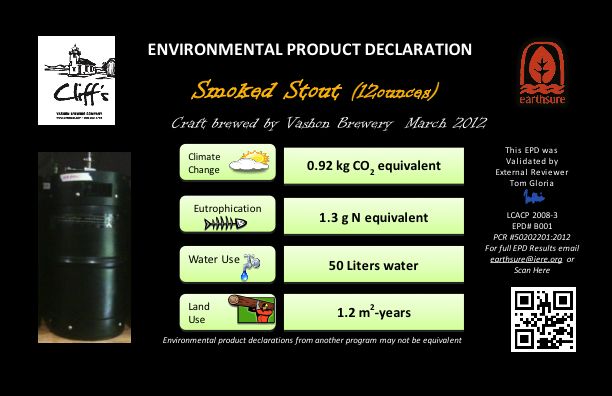
5

freshwater resources where the water is not replaced into the same watershed. Evaporation due to
irrigation is an example of consumptive water use

Land use is an important impact of all food products. Land that is not used for producing food or
fiber or wood can presumably be used for wildlife and native ecosystems. There are no good models
available for life cycle impacts of land use in North America, so as a default IERE simply reports the
impact in units of land occupation- m2-years.

Impact categories not considered
Human respiratory effects are caused by particulate matter, mostly derived from combustion
processes. We consider that combustion processes are addressed through the measurement of
photochemical smog and climate change impacts.

Human toxicity is not addressed because toxicity is covered by ecotoxicity and because the existing
models were considered to be too poor quality to provide reliable results.

Mineral resource depletion is not considered because there is relatively little mineral resource used
in the production of beer. This is especially the case here where the manufacture of equipment is
specifically excluded from analysis—this is where the majority of mineral resources might be used in
the life cycle.

Life cycle impact assessment results are relative expressions and do not predict impacts on category
endpoints, or the exceedance of thresholds, safety margins or risks.
6

Table 1 below summarizes these impact categories and the models used.

                                  Table 1 Life Cycle Impact Assessment Models

                Impact Category          Category Indicator           Model Source
                Climate Change           Mass of CO2                  Intergovernmental
                                         Equivalents                  Panel on Climate
                                                                      Changevii, most recent
                                                                      publication
                Acidification            Mass Hydrogen Ion            Stoichiometric
                                         Equivalents                  equivalents
                Eutrophication           Mass Nitrogen                Redfield Ratioviii,ix
                                         equivalents
                Ozone Depletion          Mass CFC-11                  UNEP-SETAC 2000
                                         equivalents
                Ecological toxicity      CTUe                         USEtoxx
                Photochemical Smog       Mass of Ozone                TRACI 2 (v4.00)xi
                                         Equivalents
                Water Use                Volume of fresh water        Inventory
                                         consumed
                Land Use                 Land occupied in m2yr        Inventory

Life Cycle Inventory
The following section explains the processes that contribute to the beer product life cycle. The processes
are organized into the following life cycle stages: Ingredients (agricultural food production), Brewery
Operations (beer production), Distribution (primary and secondary packaging, cold storage refrigeration,
and the transportation of product to beer retail), and Use (end consumer home refrigeration and human
waste). Specific assumptions for each process are explained in more detail in Appendix C.

Ingredients
Fertilizer and Pesticides
Multiple unit processes model the production of agricultural fertilizer and pesticide inputs including the
raw material extraction, beneficiation, and intermediate transportation to manufacturing locations.
Nitrogen, phosphorous, and potassium fertilizer unit processes are based on 2010 primary facility data
from Potash Corporationxii and represents from 30 to 70% of the total fertilizer production in North
America. Boron, lime, and sulfur fertilizer production processes as well as pesticide manufacturing are
modeled using Ecoinvent processes. All fertilizer processes are modeled and characterized.

The following pesticides, herbicides and fungicides are currently not modeled in USEtox, hence the
analysis is limited in estimating full ecological toxicity. No proxies were used to model these impacts.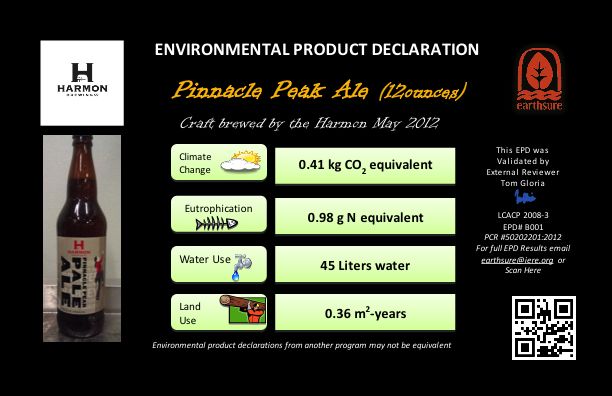
7

  Chemical                                         CAS No.             Function
  Barley at Farm
  Prothioconazol                                   178928-70-6         Fungicide
  Pyraclostrobin (prop)                            175013-18-0         Pesticide
  Dimethylamine dicamba                            2300-66-5           Pesticide
  Florasulam                                       145701-23-1         Pesticide
  Tralkoxydim                                      87820-88-0          Herbicide
  Thiamethoxam                                     153719-23-4         Insecticide
  Total mass uncharacterized: 6%

  Hops at Farm
  Abamectin                                        71751-41-2          Insecticide
  Isopropyl 2-(4-methoxy[1,1'-biphenyl]-3-
  yl)hydrazinecarboxylate (Bifenazate)             149877-41-8         Pesticide
  Copper oxychloride                               1332-65-6           Fungicide
  Pyraclostrobin (prop)                            175013-18-0         Pesticide
  Quinoxyfen                                       124495-18-7         Fungicide
  Trifloxystrobin                                  141517-21-7         Pesticide
  Total mass uncharacterized: 14%

  Corn at Farm
  Dicamba potassium salt                           10007-85-9          Pesticide
  Diflufenzopyr-sodium                             109293-98-3         Pesticide
  Dimethenamid-P                                   163515-14-8         Pesticide
  Foramsulfuron                                    173159-57-4         Herbicide
  Mesotrione                                       104206-82-8         Herbicide
  Dimethylamine dicamba                            2300-66-5           Pesticide
  Total mass uncharacterized: 1%

Barley
The unit process for growing barley includes transportation of chemicals and seed to the farm,
application of fertilizers and pesticides, machinery, any emissions on the farm, and terminates at the
farm gate. Irrigation equipment is also excluded from analysis as being part of the farm capital
equipment.
8

Barley production data is from USDA National Agricultural Statistics Service Information including the
2011 national crop summary (yield)xiii, 2011 chemical use survey (fertilizer and pesticide), 2008 census of
agriculture (irrigation)xiv, and 2008 agricultural greenhouse gas inventory (energy)xv. Nutrient content of
barley dry matter is based on data from USDA Natural Resources Conservation Service.xvi

The production of seed is calculated by reducing the yield by the amount of seed planted. Application of
mass balance principles is used to estimate fertilizer nutrient emissions to air and water by subtracting
the estimated nutrient content in the crop material from the total nutrient in the fertilizer applied.
Pesticides are modeled as releases to the soil.

Malt and Yeast
Primary data for the production of malt and yeast was not available. Thus, malt production is based on
a 2008 data set provided by Danish Malting Group A/Sxvii. The inputs of malt production include barley
and its transport from farm to factory, tap water, electricity, and natural gas. The yeast unit process is
an Ecoinvent process. Transportation of the ingredient packaging for malt, yeast, and hops is included in
the analysis where data are provided.

Hops and Hops Pellets
The unit process for growing hops contains the same types of inputs, outputs and fertilizer application
emission rate estimates as the unit process for barley. Hops trellis materials are included as an input to
the on-farm processes and their impacts are allocated based on a straight-line annualized depreciation
method. The modeled inputs of hop pellets production include electricity, fuel, nitrogen, and packaging
materials. The modeled outputs of hop pellets production include the pellets, packaging materials, and
emissions related to cold storage refrigeration.

All elements of hops production including yield, water, fertilizer, pesticide, and fuel use are based on a
2011 average dataset for a group of 24 growers in Washington State. Nutrient content of barley dry
matter is based on data from USDA Natural Resources Conservation Service. Hops pellet production is
based on a 2011 dataset for a specific hops pellet production facility in Washington State.

Adjunct Farm Products
Beers often have additional materials. These tend to be a small portion of the total dry weight of the
beer production. Where data on the particular crops are available, they must be used. Specific unit
processes for corn and wheat are implemented based on data from USDA National Agricultural Library
Digital Commons. Where crop data is not available, an average crop unit process is used for the
production of the ingredient. A sensitivity analysis is performed on the substitution. The average crop
unit process is based on data from USDA 2008 census of agriculture.

Brewery Operations
This unit process includes transport of all ingredients, packaging and ancillary materials to the brewery,
the production of the beer, the storage of beer and ingredients, cleaning of equipment, and the
packaging of the beer. All information about the brewing use of energy and materials is based on
primary information from the actual brewery location.
9

Several possible methods may be applied for quantifying energy resource consumption depending on
the resources available at each brewery. The first approach requires using metering equipment to
measure electricity and natural gas consumption for each step in the brewing process. A second
method is to record the electric nameplate of all equipment, measure the duration of each step in the
brewing process, and calculate electricity consumption by multiplying the duration by the voltage by
amperage. The final method is to utilize the monthly utility bill and divide the total electricity
consumption for the billing interval by the number of beer batches produced in the interval.

Electricity production is based on a specific utility electricity grid. Where natural gas is used, it is
modeled as combusted in an industrial boiler. Emissions due to cold storage refrigeration are based on
IPCC GHG reporting guidelinesxviii.

Packaging
This unit process includes the raw material extraction and beneficiation, production of packaging
materials, forming of the packaging and intermediate transport, ending at the gate of the brewery.
Bottles, cans, barrels and kegs are all potential container packaging options for beer.

Steel production is based on 2006/2007 World Stainless Steel LCIxix. Aluminum primary and secondary
ingot production data is from the US LCI Database, and aluminum can production in the US is based on
2010 PE Americas LCIxx. Container glass production is based on 2007 European Container Glass
Foundation (FEVE) life cycle inventoryxxi scaled by a factor to match the equivalent carbon footprint of
North American container glass.

Transportation
Processes representing the transport of goods by truck, rail, container vessel, and personal vehicle were
taken from the USLCI databasexxii. The transportation model will ideally be based on actual information
on fuel consumption and mode of transport. Default distances values for transporting goods to the
consumer are based on average mileage values reported in the 2007 Economic Census.xxiii

Distribution
This unit process includes the transportation, refrigerants, and electricity for delivering the beer product
from the brewery to the point of sale. There are two possible types of initial delivery locations for the
beer product from the brewery: distribution facility or direct retail outlet (pub/restaurant, convenience
store, drug store, liquor store, grocery store). If the beer is shipped to a distributor, it is assumed the
beer will also subsequently be transported to a retail outlet.

The cold storage emissions at distribution and retail facilities are based on IPCC GHG reporting
guidelines, and is calculated by multiplying the following factors: the fraction of the volume of beer over
the average occupied refrigeration volume, the fraction of days in a year held in refrigeration, the
refrigerant charge, and the annual refrigerants emissions rate. Allocation of electricity consumption due
to refrigeration for beer is calculated by multiplying the following factors: the fraction of the volume of
beer over the average occupied refrigeration volume, the fraction of days in a year held in refrigeration,
and the annual electricity consumption of the equipment.
10

The average cold storage capacity and electricity consumption of a distribution center is based on
estimates of AmeriColdxxiv, the largest cold storage facility by market share in the United States. An
estimate of the electricity consumed per cubic feet of cold storage space is estimated by dividing the
total cold storage space by the total electricity consumed at all facilities.

Use
The unit process includes the cold storage               ’ l     , human excretion from beer
consumption, toilet use, hand washing and drying, and human waste treatment. The inventory data for
human excretion is based on a model by Muñoz et al. (2007)xxv.

Missing Data
We were not able to obtain data on the typical refrigeration equipment used for cold storage of beer at
large supermarket retail locations. We assumed the refrigerant used is R-134a with similar charge and
annual emissions rate as smaller retail outlets.

We also were unable to locate data quantifying the amount of consumer transportation to retail outlets
that may be allocated to beer purchases versus other consumer purchases. Thus, transportation from
the retail outlet to the end consumer was not included.

Calculations
The data were entered into the SimaPro software package to perform both life cycle inventory and life
cycle impact assessment analyses.

Allocation
Allocation of electricity consumption and refrigeration for beer is performed by volume. All other
allocation decisions are based on the standards for the Ecoinvent center, e.g. for the production of cold-
rolled steel, and water.

End of Life and Recycling
All materials being recycled are modeled as a cutoff rule and leave the system boundary. All materials
are assumed to be virgin materials, with the exception of aluminum and steel, which represent North
American average production.
11

Unit process description and data quality evaluation
The unit processes covered in this analysis are shown below.

Table 1 Unit process descriptions

 Unit Processes                                        Data       Date    Geography        Source           Technosphere          UNSPSC
                                                       Level                                                   Output
 Beer, consumption                                     Primary    2012       USA          Breweries               Beer            50202201
                                                                                       Breweries, Munoz
 Beer, ingested by consumer                            Mixed      2012       USA                                  Beer            50202201
                                                                                            et al.
 Sulphite pulp, bleached, at plant/RER WITH US
                                                       Tertiary   2003       EU           Ecoinvent            Paper pulp         14101501
 ELECTRICITY U
 Soap, at plant/RER WITH US ELECTRICITY U              Tertiary   2003       EU           Ecoinvent              Soaps            53131608
 Sodium perborate, monohydrate, powder, at
                                                       Tertiary   2003       EU           Ecoinvent        Sodium perborate       51102728
 plant/RER S
 Treatment, sewage, to wastewater treatment,                                                               Sewage treatment
                                                       Tertiary   2009       EU           Ecoinvent                               76121701
 class 1/CH WITH US ELECTRICITY U                                                                              services
                                                                                                           Sewage treatment
 Wastewater Treatment, TPU                             Primary    2010     Tacoma       City of Tacoma                            76121701
                                                                                                               services
 Beer, distributed at sales location                   Primary    2012       USA          Breweries               Beer            50202201

 Beer, packed at plant                                 Primary    2012       USA          Breweries               Beer            50202201

 Beer, at plant                                        Primary    2012       USA          Breweries               Beer            50202201
                                                                                                                                  50221302
 Malt, at plant                                      Secondary    2005       EU          Novozymes            Barley malt
 Hop pellets, at plant                                                                                       Beverage crops
                                                       Primary    2011    Washington   Hops Producers                             70141505
                                                                                                          production (superset)
 Winter wheat, at farm                                            1996-                   LCA Digital       Grain or legume
                                                       Tertiary            Kansas                                                 70141512
                                                                  2009                    Commons         production (superset)
                                                                  1996-                   LCA Digital
 Corn, at farm                                         Tertiary              Iowa                                 Corn            50403200
                                                                  2005                    Commons
 General agricultural crop, at farm                                                                         Crop production
                                                       Tertiary   2008       USA        USDA Census                               70141500
                                                                                                              (superset)
12
Unit Processes Data Date Geography Source Technosphere UNSPSC
Level Output
Yeast paste, from whey, at fermentation/CH
Ferments or enzymes
WITH US ELECTRICITY U Tertiary 2006 Switzerland Ecoinvent 73101614
services (superset)
North Potash
Fertilizer - Nitrogen (N) at plant Secondary 2010 Nitrogenous fertilizer 10171601
America Corporation
North Potash
Fertilizer - Phosphorous (P) at plant Secondary 2010 Phosphatic fertilizer 10171603
America Corporation
North Potash
Fertilizer - Potassium (K) at plant Secondary 2010 Potassic fertilizer 10171602
America Corporation
Ammonium sulphate, as N, at regional
Tertiary 1998 EU Ecoinvent Sulphuric fertilizer 10171604
storehouse/RER WITH US ELECTRICITY U
Limestone, milled, packed, at plant/CH WITH
Tertiary 2003 Switzerland Ecoinvent Calcium fertilizer 10171611
US ELECTRICITY U
Chemical fertilizers
Sodium borates, at plant/US WITH US
Tertiary 2007 USA Ecoivnent and plant nutrients 10171600
ELECTRICITY U
(superset)
Liquified natural gas
Natural gas, processed, at plant/US Tertiary 2008 USA USLCI 15111511
LNG
Pesticide unspecified, at regional Pesticides or pest
Tertiary 2010 EU Ecoinvent 10191500
storehouse/RER WITH US ELECTRICITY U repellents
Diesel, combusted in industrial equipment/US Tertiary 2008 USA USLCI Diesel fuel 15101505
Liquefied petroleum gas, combusted in
Tertiary 2008 USA USLCI Kerosene 15101502
industrial boiler/US
Tractor, production/CH/I WITH US
Tertiary 2003 Switzerland Ecoinvent Agricultural tractors 25101901
ELECTRICITY U
Agricultural
Agricultural machinery, tillage,
Tertiary 2003 Switzerland Ecoinvent machinery for soil 21101500
production/CH/I WITH US ELECTRICITY U
preparation
Agricultural
Agricultural machinery, general,
Tertiary 2003 Switzerland Ecoinvent machinery for 21101600
production/CH/I WITH US ELECTRICITY U
planting and seeding
Harvester, production/CH/I WITH US
Tertiary 2003 Switzerland Ecoinvent Harvesters 21101703
ELECTRICITY U
Rough green lumber, softwood, at sawmill, US
Tertiary 2008 USA USLCI Pine wood 11121616
PNW/kg/US
Wire drawing, steel/RER WITH US Non electric iron and
Tertiary 2010 EU Ecoinvent 31152200
ELECTRICITY U steel wire
Galvanized steel sheet, at plant/RNA Tertiary 2008 USA USLCI Nails (subset) 3116200013
Unit Processes Data Date Geography Source Technosphere UNSPSC
Level Output
Yarn, jute, at plant/IN WITH US ELECTRICITY U Tertiary 2007 India Ecoinvent Jute yarn 11151710
Textile, jute, at plant/IN WITH US ELECTRICITY Hessian or hemp or
Tertiary 2007 India Ecoinvent 11162003
U jute cloth
Yarn, cotton, at plant/GLO WITH US
Tertiary 2007 China, USA Ecoinvent Cotton yarn 11151702
ELECTRICITY U
Tap water, at user/RER WITH US ELECTRICITY
Tertiary 2005 EU Ecoinvent Town water 83101508
U-fix
Tap Water, TPU
Primary 2010 Tacoma Tacoma Power Town water 83101508
Natural gas, combusted in industrial
Liquified natural gas
equipment/RNA Tertiary 2008 USA USLCI 15111511
LNG
Electricity, at grid, US/US Tertiary 2008 USA USLCI Electric utilities 83101800
Electricity, at grid, PP-OR 2010
Secondary 2010 Oregon Pacific Power Electric utilities 83101800
Washington Dept.
Electricity, at grid, PP-WA 2010 Secondary 2010 Washington Electric utilities 83101800
of Commerce
Washington Dept.
Electricity, at grid, BentonREA 2010 Secondary 2010 Washington Electric utilities 83101800
of Commerce
Electricity, at grid, PSE 2010 Washington Dept.
Secondary 2010 Washington Electric utilities 83101800
of Commerce
Electricity, at grid, SCL 2010 Washington Dept.
Secondary 2010 Seattle Electric utilities 83101800
of Commerce
TPU mix, to consumer Washington Dept.
Mixed 2011 Tacoma Electric utilities 83101800
of Commerce
Electricity, at grid, PGE 2010 Portland General
Secondary 2008 Portland Electric utilities 83101800
Electric
Transport, combination truck, diesel
Road cargo transport
powered/US Tertiary 2008 USA USLCI 78101800
(superset)
Transport, combination truck, REEFER, diesel Road cargo transport
Tertiary 2008 USA USLCI 78101800
powered/US (superset)
Transport, train, diesel powered/US Road cargo transport
Tertiary 2008 USA USLCI 78101600
(superset)
Transport, passenger car, gasoline powered Passenger transport
Tertiary 2011 USA USLCI 78110000
(superset)14
Unit Processes Data Date Geography Source Technosphere UNSPSC
Level Output
Transport, ocean freighter, average fuel
Marine cargo
mix/US Tertiary 2008 USA USLCI 78101700
transport
Gasoline, combusted in equipment/US Tertiary 2008 USA USLCI Gasoline or Petrol 15101506
Soybean methyl ester, at esterification
Tertiary 2006 USA Ecoinvent Biodiesel 15101801
plant/US WITH US ELECTRICITY U
Refrigerant R134a, at plant/RER WITH US
ELECTRICITY U Tertiary 2004 EU Ecoinvent Refrigerant (superset) 24131513
1,1-difluoroethane, HFC-152a, at plant/US
WITH US ELECTRICITY U Tertiary 2007 USA Ecoinvent Refrigerant (superset) 24131513
Chlorodifluoromethane, at plant/NL WITH US
ELECTRICITY U Tertiary 2003 Netherlands Ecoinvent Refrigerant (superset) 24131513
Ammonia, liquid, at regional storehouse/CH
Tertiary 2003 Switzerland Ecoinvent Refrigerant (superset) 24131513
WITH US ELECTRICITY U
Acetic acid
Acetic acid, at plant/kg/RNA Tertiary 2008 USA USLCI 51102706
antiseptics (subset)
Dipropylene glycol monomethyl ether, at
plant/RER WITH US ELECTRICITY U Tertiary 2007 EU Ecoinvent Propylene glycol 12352135
Hydrogen peroxide, 50% in H2O, at plant/RER
Hydrogen peroxide
WITH US ELECTRICITY U Tertiary 2003 EU Ecoinvent 51102709
antiseptics (subset)
Isopropanol, at plant/RER WITH US
ELECTRICITY U Tertiary 2003 EU Ecoinvent Solvents (superset) 12190000
Phosphoric acid, industrial grade, 85% in H2O,
at plant/RER WITH US ELECTRICITY U Tertiary 2004 EU Ecoinvent Solvents (superset) 12190000
Monoethanolamine, at plant/RER WITH US
ELECTRICITY U Tertiary 2003 EU Ecoinvent Solvents (superset) 12190000
Nitric acid, 50% in H2O, at plant/RER WITH US
Tertiary 2003 EU Ecoinvent Solvents (superset) 12190000
ELECTRICITY U15
Unit Processes Data Date Geography Source Technosphere UNSPSC
Level Output
Potassium hydroxide, at regional storage/RER
Tertiary 2005 EU Ecoinvent Potassium hydroxide 12352320
WITH US ELECTRICITY U
Propylene oxide, liquid, at plant/RER WITH US
Tertiary 2003 EU Ecoinvent Polypropylene oxide 13111050
ELECTRICITY U
Sodium carbonate from ammonium chloride
production, at plant/GLO WITH US Tertiary 2009 World Ecoinvent Solvents (superset) 12190000
ELECTRICITY U
Sodium hydroxide, production mix, at
Tertiary 2008 US USLCI Sodium hydroxide 12352316
plant/kg/RNA
Sodium metasilicate pentahydrate, 58%,
powder, at plant/RER WITH US ELECTRICITY Tertiary 2003 EU Ecoinvent Solvents (superset) 12190000
U
Sodium percarbonate, powder, at plant/RER S Tertiary 2003 EU Ecoinvent Solvents (superset) 12190000
Sodium phosphate, at plant/RER WITH US
Tertiary 2003 EU Ecoinvent Sodium phosphate 51171622
ELECTRICITY U
Sodium tripolyphosphate, at plant/RER WITH
Tertiary 2003 EU Ecoinvent Solvents (superset) 12190000
US ELECTRICITY U
Aluminum can
Secondary 2010 USA PE International Aluminum cans 24121806
Carbon dioxide liquid, at plant/RER WITH US
Secondary 2004 EU Ecoinvent Carbon dioxide gas 12142104
ELECTRICITY U
Aluminum ingot, production mix, at plant/US Tertiary 2008 USA USLCI Aluminum ingot 30265202
Container glass, at plant
Secondary 2007 EU FEVE Glass bottles 24122003
Polyethylene terephthalate resin, at Polyethylene
Tertiary 2008 USA USLCI 13102020
plant/kg/RNA Terephthalate PET
World Stainless
Stainless steel mix Secondary 2007 World Stainless steel coil 30264700
Steel
Franklin
Wood pallet Secondary 2009 USA Wood pallet 24112701
Associates16
Unit Processes Data Date Geography Source Technosphere UNSPSC
Level Output
Corrugated and other
Containerboard Tertiary 2009 USA USLCI supplies for 24112500
distribution (superset)
Franklin
Corrugated cardboard Tertiary 1998 USA Cardboard 14121503
Associates
Paper, woodcontaining, supercalendred (SC), Canning or bottling
Tertiary 2003 EU Ecoinvent 55121604
at plant/RER WITH US ELECTRICITY U labels
Franklin Unbleached
Paperboard Unbl. Semichem. FAL Tertiary 1998 USA 14121502
Associates paperboard
High Density
High density polyethylene resin, at plant/RNA Tertiary 2008 USA USLCI 13102017
Polyethylene HDPE
Polyvinyl Chloride
Polyvinyl chloride resin, at plant/RNA Tertiary 2008 USA USLCI 13102030
PVC
Low Density
Low density polyethylene resin, at plant/RNA Tertiary 2008 USA USLCI 13102018
Polyethylene LDPE
Polypropylene resin, at plant/RNA Tertiary 2008 USA USLCI Polypropylene PP 13102022
General purpose polystyrene, at plant/RNA Tertiary 2008 USA USLCI Polystyrene PS 13102026
Sulphite pulp, bleached, at plant/RER WITH US
Tertiary 2003 EU Ecoinvent Paper pulp 14101501
ELECTRICITY U
Three data sets are more than 10 years old. These inventories are related to paper-based packaging, and conversations with Franklin and
Associates confirmed that they had not changed significantly. Forty-five of the unit processes are based on either US or North American sources,
32 of the unit processes are from European sources, and five other global sources. We believe the production of these materials is quite similar
in OECD countries, so the use of this data is appropriate. Overall, this data set is considered to be good or very good. A full listing of the
inventory can be found in Appendix C.17
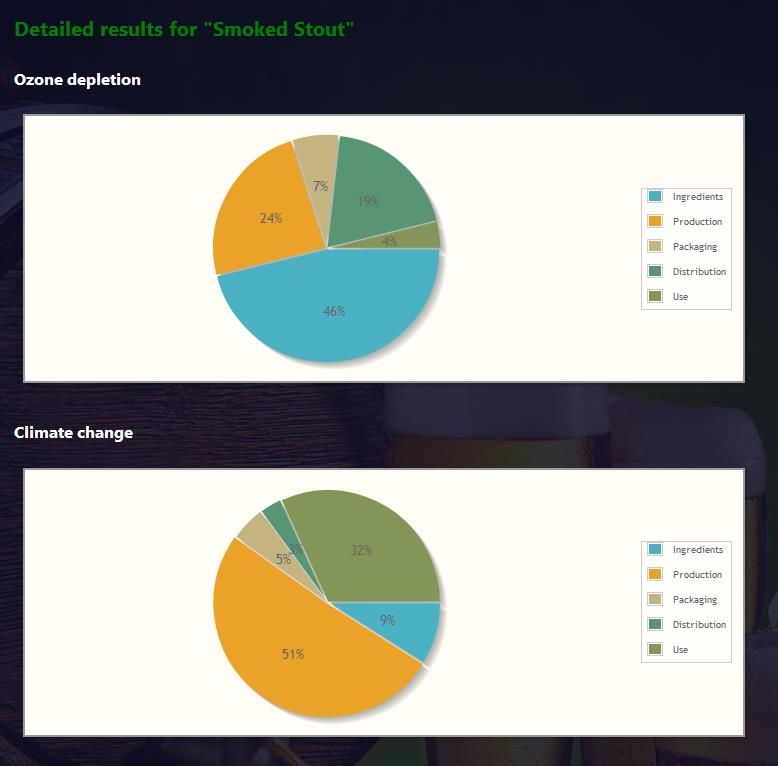
Life Cycle Impact Assessment
Results
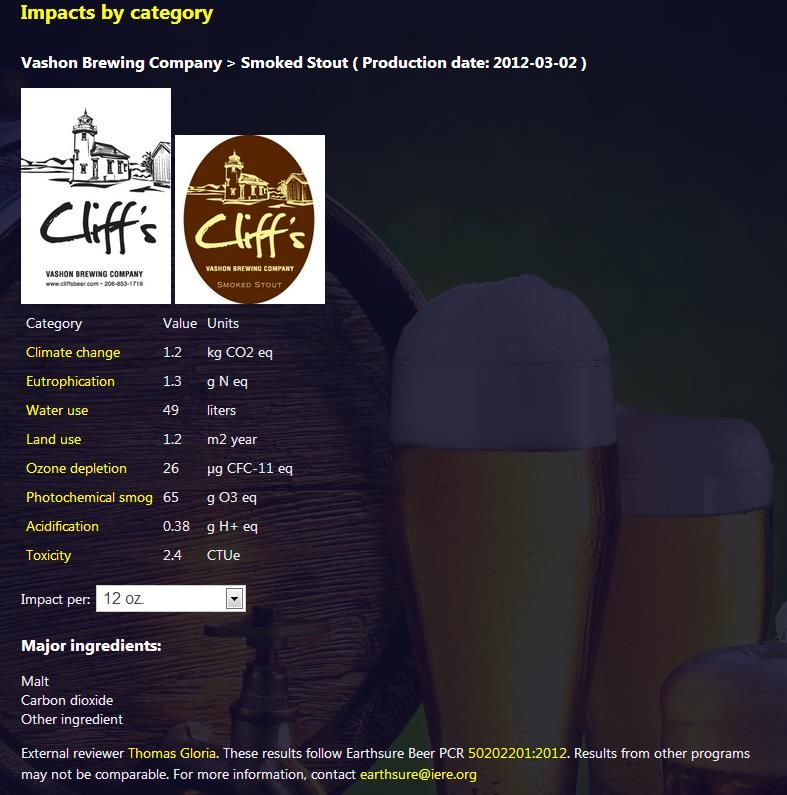
Table 2 Life Cycle Impact Assessment Results, per 12 oz. beer consumed, Smoked Stout, Vashon Brewing Company.
Impact Category Equivalent Ingredients Brewery Packaging Distribution Use TOTAL LCIA Method
Units
Climate Change kg CO2 0.13 0.58 0.056 0.036 0.38 1.17 IPCC, 100 yr
GWP
Ozone Depletion ug CFC-11 11 5.1 1.3 5.0 0.8 23.6 UNEP-SETAC
Acidification g H+ 0.07 0.24 0.03 0.02 0.009 0.37 TRACI 2 v4.00
Eutrophication gN 0.67 0.07 0.07 0.12 0.32 1.26 TRACI 2 v4.00
Toxicity CTUe 2.0 0.24 0.13 0.06 0.04 2.4 USETOX
Smog g O3 16 32 7.3 8.7 1.6 65 TRACI 2 v4.00
Water Use Liters 38 0.3 0.60 0.033 11 49.7 Inventory
Land Use m2-yr 0.36 3.4E-03 0.79 5.0E-05 0.030 1.2 Inventory
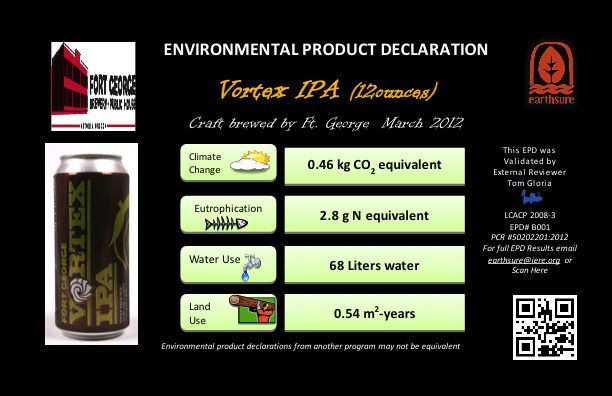
Table 3 Life Cycle Impact Assessment Results, per 12 oz. beer consumed, Vortex IPA, Fort George Brewery.
Impact Category Equivalent Ingredients Brewery Packaging Distribution Use TOTAL LCIA Method
Units
Climate Change kg CO2 0.18 0.13 0.064 0.019 0.39 0.78 IPCC, 100 yr
GWP
Ozone Depletion ug CFC-11 24.0 0.0 1.5 4.9 1.0 31.4 UNEP-SETAC
Acidification g H+ 0.10 0.05 0.02 7.3E-03 0.012 0.20 TRACI 2 v4.00
Eutrophication gN 1.09 0.02 1.37 4.3E-03 0.32 2.80 TRACI 2 v4.00
Toxicity CTUe 2.7 0.11 0.04 0.03 0.04 2.9 USETOX
Smog g O3 22 5 3.9 2.2 2.1 35 TRACI 2 v4.00
Water Use Liters 56 0.7 0.15 0.022 11 68 Inventory
Land Use m2-yr 0.51 8.6E-05 1.2E-02 8.0E-08 0.030 0.5 Inventory18
Table 4 Life Cycle Impact Assessment Results, per 12 oz. beer consumed, Pinnacle Peak Pale Ale, Harmon Brewing Company.
Impact Category Equivalent Ingredients Brewery Packaging Distribution Use TOTAL LCIA Method
Units
Climate Change kg CO2 0.11 0.01 0.031 0.017 0.39 0.56 IPCC, 100 yr
GWP
Ozone Depletion ug CFC-11 12 1.8E-02 1.6 5.0 1.0 19.4 UNEP-SETAC
Acidification g H+ 0.06 4.1E-03 8.8E-03 6.4E-03 0.013 0.094 TRACI 2 v4.00
Eutrophication gN 0.63 1.8E-03 8.1E-03 3.5E-03 0.32 0.96 TRACI 2 v4.00
Toxicity CTUe 1.7 4.2E-03 0.02 0.02 0.04 1.8 USETOX
Smog g O3 13 0.71 1.5 1.8 2.2 20 TRACI 2 v4.00
Water Use Liters 33 0.79 0.05 0.000 11 45 Inventory
Land Use m2-yr 0.32 4.2E-03 1.2E-02 8.1E-08 0.030 0.36 Inventory
Table 5 Life Cycle Impact Assessment Results, per 12 oz. beer consumed, HUB Lager, Hopworks Urban Brewery.
Impact Category Equivalent Ingredients Brewery Packaging Distribution Use TOTAL LCIA Method
Units
Climate Change kg CO2 0.07 0.14 0.003 0.017 0.39 0.62 IPCC, 100 yr
GWP
Ozone Depletion ug CFC-11 9.0 0.08 4.6E-02 4.9 0.9 15.0 UNEP-SETAC
Acidification g H+ 0.04 0.06 1.4E-03 6.4E-03 0.012 0.12 TRACI 2 v4.00
Eutrophication gN 0.42 5.1E-02 4.9E-03 7.7E-03 0.32 0.80 TRACI 2 v4.00
Toxicity CTUe 1.0 0.14 0.01 0.02 0.04 1.3 USETOX
Smog g O3 9.0 5.1 0.28 1.7 2.0 18 TRACI 2 v4.00
Water Use Liters 21 1.93 0.039 2.5E-03 11 34 Inventory
Land Use m2-yr 0.19 4.2E-04 3.2E-02 1.2E-03 0.030 0.26 Inventory19
Table 6 Life Cycle Impact Assessment Results, per 12 oz. beer consumed, Big Horn Blonde Ale, RAM Brewery.
Impact Category Equivalent Ingredients Brewery Packaging Distribution Use TOTAL LCIA Method
Units
Climate Change kg CO2 0.08 0.03 5.2E-04 0.010 0.39 0.50 IPCC, 100 yr
GWP
Ozone Depletion ug CFC-11 6.9 2.7E-02 1.6E-02 4.9 0.8 13 UNEP-SETAC
Acidification g H+ 4.0E-02 6.2E-03 1.8E-04 4.0E-03 8.8E-03 5.9E-02 TRACI 2 v4.00
Eutrophication gN 4.1E-01 3.7E-03 9.6E-04 1.1E-03 0.32 0.74 TRACI 2 v4.00
Toxicity CTUe 1.1 0.02 1.5E-03 3.4E-03 0.04 1.2 USETOX
Smog g O3 8.8 0.73 0.02 0.60 1.6 12 TRACI 2 v4.00
Water Use Liters 22 0.64 2.0E-03 2.6E-04 11 33 Inventory
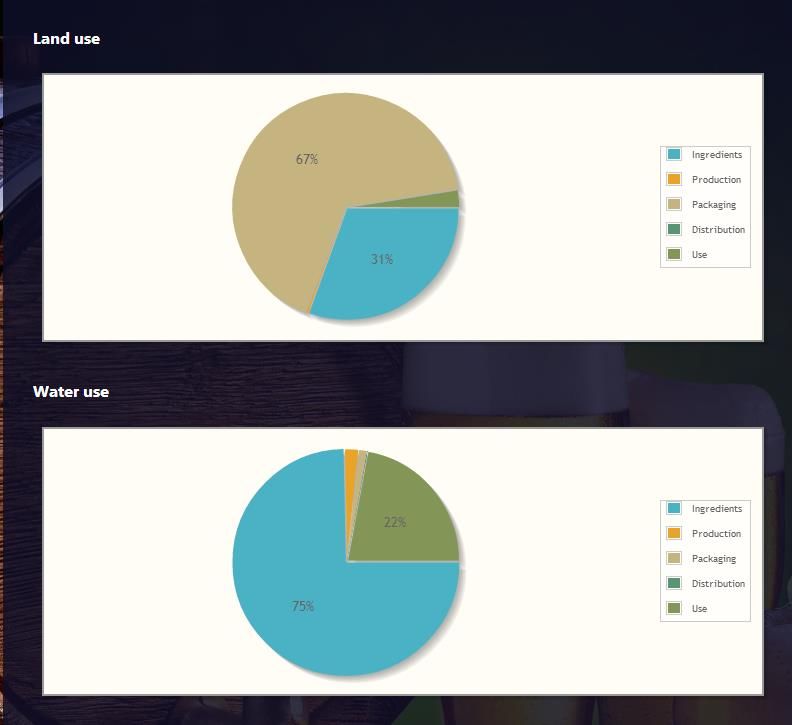
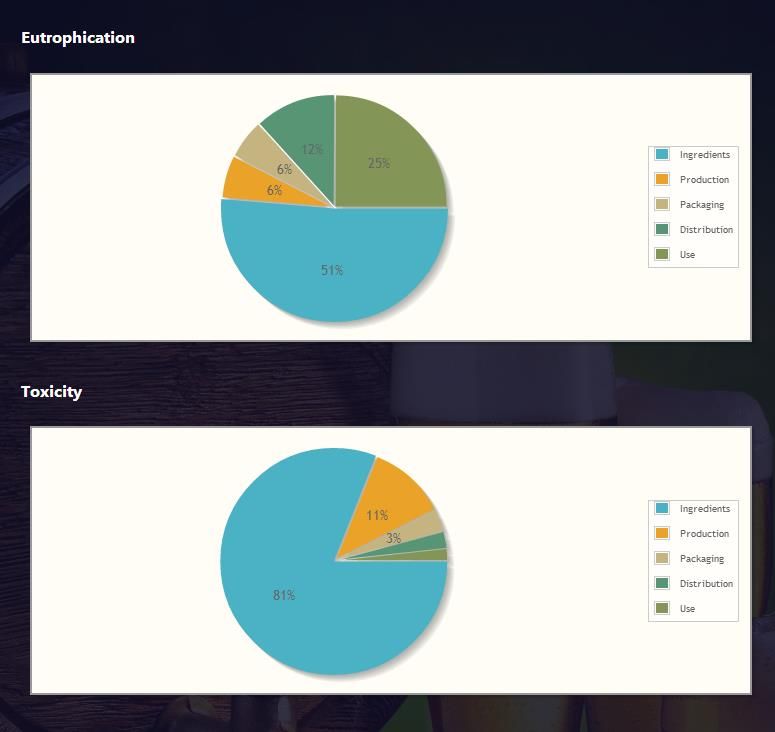
Land Use m2-yr 0.21 7.7E-04 9.3E-05 8.0E-08 0.03 0.24 Inventory20 The environmental impacts of beer consumption are primarily related to material inputs, brewery operations, and beer consumption. The ingredient phase of the life cycle is the main contributor to ecotoxicity, ozone depletion, and water use at all five breweries; it is also the prime factor in eutrophication, land use, and smog at four breweries. The brewery phase is the primary contributor to climate change and acidification at three breweries; this phase has the highest smog value at a single brewery. The consumer use phase contributes heavily to climate change given the release of CO2 when beer is consumed. The packaging phase is not a common prime source of impacts among the breweries; nonetheless, it is the main contributor to eutrophication and land use at an individual brewery. LCIA results are relative expressions and do not predict impacts on category endpoints, the exceeding of thresholds, safety margins or risks.
21
Sensitivity Analyses
In accordance with the product category rule, the following sensitivity analyses were performed:
Variability of barley production (plus or minus the measured standard deviation)
Variability of wood pallet lifetime use (range is half and double estimated value)
Variability of storage duration in refrigerated truck (range is half and double estimated value)
Variability of storage duration at distribution center (range is half and double estimated value)
Variability of storage duration at retail location (range is half and double estimated value)
Variability of storage duration in home refrigerator (range is half and double estimated value)
The results can be seen below. In each case, the middle figure represents the baseline scenario with the lower and upper scenarios to the left
and right, respectively.
Table 7 Sensitivity for barley production variation
Vashon Fort George Harmon Hopworks RAM
Units
Mean
Mean
Mean
Mean
Mean
Min
Max
Max
Max
Max
Max
Min
Min
Min
Min
Barley Production kg/FU 1.05 1.22 1.39 1.05 1.22 1.39 1.05 1.22 1.39 1.05 1.22 1.39 1.05 1.22 1.39
Climate Change kg CO2 1.16 1.17 1.19 0.76 0.78 0.80 0.54 0.56 0.57 0.61 0.62 0.63 0.49 0.50 0.51
Ozone Depletion Ug CFC-11 22 24 25 30 31 33 18 19 20 14 15 16 12 13 13
Acidification g H+ 0.37 0.37 0.38 0.19 0.20 0.21 0.09 0.09 0.10 0.11 0.12 0.12 0.05 0.06 0.06
Eutrophication gN 1.2 1.3 1.3 2.7 2.8 2.9 0.9 1.0 1.0 0.8 0.8 0.8 0.7 0.7 0.8
Toxicity CTUe 2.2 2.4 2.7 2.6 2.9 3.3 1.6 1.8 2.0 1.1 1.3 1.4 1.0 1.2 1.3
Smog g O3 64 65 67 33 35 37 18 20 21 17 18 19 11 12 12
Water Use Liters 45 50 54 61 68 74 41 45 49 32 34 37 30 33 36
2
Land Use m -yr 1.1 1.2 1.2 0.48 0.55 0.62 0.32 0.36 0.40 0.23 0.26 0.28 0.21 0.24 0.2722
Varying the input values of barley production causes all brewery impact category results to decrease and increase between 1-13% at a minimum.
The most significant variation occurs in land use and toxicity with changes up to 13%.
Table 8 Sensitivity for wood pallet lifetime
Vashon Fort George Harmon Hopworks RAM
Units
Mean
Mean
Mean
Mean
Mean
Min
Max
Max
Max
Max
Max
Min
Min
Min
Min
Wood Pallet Times 8 4 2 8 4 2 8 4 2 8 4 2 8 4 2
Lifetime Used
Climate Change kg CO2 1.2 1.2 1.20 0.78 0.78 0.78 0.56 0.56 0.56 0.62 0.62 0.62 0.50 0.50 0.50
Ozone Depletion ug CFC-11 23 24 25 31 31 31 19 19 19 15 15 15 13 13 13
Acidification g H+ 0.37 0.37 0.39 0.20 0.20 0.20 0.09 0.09 0.09 0.12 0.12 0.12 0.06 0.06 0.06
Eutrophication gN 1.2 1.3 1.3 2.8 2.8 2.8 1.0 1.0 1.0 0.8 0.8 0.8 0.7 0.7 0.7
Toxicity CTUe 2.4 2.4 2.5 2.9 2.9 2.9 1.8 1.8 1.8 1.3 1.3 1.3 1.2 1.2 1.2
Smog g O3 63 65 69 35 35 35 20 20 20 18 18 18 12 12 12
Water Use Liters 49 50 50 68 68 68 45 45 45 34 34 34 33 33 33
Land Use m2-yr 0.80 1.2 2.0 0.54 0.55 0.56 0.36 0.36 0.37 0.24 0.26 0.29 0.24 0.24 0.24
For most breweries, altering the wood pallet lifetime does not significantly alter the impact category results. However, Vashon Brewery has
relatively more pallet use than the other breweries and its land use result increases the most by 67% given two pallet uses and decreases by 33%
when used eight times.23
Table 9 Sensitivity for cold storage duration in truck
Vashon Fort George Harmon Hopworks RAM
Units
Mean
Mean
Mean
Mean
Mean
Min
Max
Max
Max
Max
Max
Min
Min
Min
Min
Truck Refrigeration Days 0.5 1 2 0.5 1 2 0.5 1 2 0.5 1 2 0.5 1 2
Climate Change Kg CO2 1.2 1.2 1.2 0.78 0.78 0.78 0.56 0.56 0.56 0.62 0.62 0.62 0.50 0.50 0.50
Ozone Depletion Ug CFC-11 23 24 24 31 31 32 19 19 20 15 15 16 12 13 13
Acidification g H+ 0.37 0.37 0.37 0.20 0.20 0.20 0.09 0.09 0.09 0.12 0.12 0.12 0.06 0.06 0.06
Eutrophication gN 1.3 1.3 1.3 2.8 2.8 2.8 1.0 1.0 1.0 0.8 0.8 0.8 0.7 0.7 0.7
Toxicity CTUe 2.4 2.4 2.4 2.9 2.9 2.9 1.8 1.8 1.8 1.3 1.3 1.3 1.2 1.2 1.2
Smog g O3 65 65 65 35 35 35 20 20 20 18 18 18 12 12 12
Water Use Liters 50 50 50 68 68 68 45 45 45 34 34 34 33 33 33
Land Use M2-yr 1.19 1.2 1.2 0.55 0.55 0.55 0.36 0.36 0.36 0.26 0.26 0.26 0.24 0.24 0.24
Ozone depletion is the only impact category significantly sensitive to changes in the length of storage duration in a refrigerated truck; climate
change impacts change by a maximum of 0.02%. Ozone depletion results for the Fort George, Harmon and Hopworks brewery are the most
sensitive, increasing by 4%, 5% and 6% respectively.24
Table 10 Sensitivity for cold storage duration at distribution center
Vashon Fort George Harmon Hopworks RAM
Units
Mean
Mean
Mean
Mean
Mean
Min
Max
Max
Max
Max
Max
Min
Min
Min
Min
Distribution Center Days 2.5 5 10 2.5 5 10 2.5 5 10 2.5 5 10 2.5 5 10
Refrigeration
Climate Change kg CO2 1.2 1.2 1.2 0.78 0.78 0.78 0.56 0.56 0.56 0.62 0.62 0.62 0.50 0.50 0.50
Ozone Depletion ug CFC-11 24 24 24 31 31 31 19 19 19 15 15 15 13 13 13
Acidification g H+ 0.37 0.37 0.37 0.20 0.20 0.20 0.09 0.09 0.09 0.12 0.12 0.12 0.06 0.06 0.06
Eutrophication gN 1.3 1.3 1.3 2.8 2.8 2.8 1.0 1.0 1.0 0.8 0.8 0.8 0.7 0.7 0.7
Toxicity CTUe 2.4 2.4 2.4 2.9 2.9 2.9 1.8 1.8 1.8 1.3 1.3 1.3 1.2 1.2 1.2
Smog g O3 65 65 65 35 35 35 20 20 20 18 18 18 12 12 12
Water Use Liters 50 50 50 68 68 68 45 45 45 34 34 34 33 33 33
Land Use m2-yr 1.2 1.2 1.2 0.55 0.55 0.55 0.36 0.36 0.36 0.26 0.26 0.26 0.24 0.24 0.24
No impact categories are significantly sensitive to changes in the value of storage duration at the distribution center. Global warming,
acidification, and smog results for the Fort George, Harmon and Hopworks breweries are impacted between -0.001% and 0.08%.25
Table 11 Sensitivity for cold storage duration at retail location
Vashon Fort George Harmon Hopworks RAM
Units
Mean
Mean
Mean
Mean
Mean
Min
Max
Max
Max
Max
Max
Min
Min
Min
Min
Retail Days 3.5 7 14 3.5 7 14 3.5 7 14 3.5 7 14 3.5 7 14
Refrigeration
Climate Change kg CO2 1.2 1.2 1.2 0.78 0.78 0.79 0.55 0.56 0.57 0.62 0.62 0.63 0.50 0.50 0.50
Ozone Depletion ug CFC-11 24 24 24 29 31 36 17 19 24 13 15 19 13 13 13
Acidification g H+ 0.37 0.37 0.37 0.20 0.20 0.20 0.09 0.09 0.10 0.12 0.12 0.12 0.06 0.06 0.06
Eutrophication gN 1.3 1.3 1.3 2.8 2.8 2.8 1.0 1.0 1.0 0.8 0.8 0.8 0.7 0.7 0.7
Toxicity CTUe 2.4 2.4 2.4 2.9 2.9 2.9 1.8 1.8 1.8 1.3 1.3 1.3 1.2 1.2 1.2
Smog g O3 65 65 65 35 35 36 19 20 20 18 18 19 12 12 12
Water Use Liters 50 50 50 68 68 68 45 45 45 34 34 34 33 33 33
Land Use m2-yr 1.2 1.2 1.2 0.55 0.55 0.55 0.36 0.36 0.36 0.26 0.26 0.26 0.24 0.24 0.24
Climate change and acidification are mildly sensitive to changes in the value of storage duration at retail locations increasing between 1-4%.
Ozone depletion is most sensitive for Ft. George, Harmon, and Hopworks breweries with differences ranging from a 13-28% increase given 14
’ g 7-14% g v 3.5 ’ g .26
Table 12 Sensitivity for storage duration in home refrigerator
Vashon Fort George Harmon Hopworks RAM
Units
Mean
Mean
Mean
Mean
Mean
Min
Max
Max
Max
Max
Max
Min
Min
Min
Min
Home Refrigeration Days 7 14 28 7 14 28 7 14 28 7 14 28 7 14 28
Climate Change kg CO2 1.2 1.2 1.2 0.78 0.78 0.79 0.55 0.56 0.57 0.62 0.62 0.63 0.50 0.50 0.50
Ozone Depletion ug CFC-11 24 24 24 31 31 32 19 19 20 15 15 15 13 13 13
Acidification g H+ 0.37 0.37 0.37 0.20 0.20 0.20 0.09 0.09 0.10 0.12 0.12 0.12 0.06 0.06 0.06
Eutrophication gN 1.3 1.3 1.3 2.8 2.8 2.8 1.0 1.0 1.0 0.8 0.8 0.8 0.7 0.7 0.7
Toxicity CTUe 2.4 2.4 2.4 2.9 2.9 2.9 1.8 1.8 1.8 1.3 1.3 1.3 1.2 1.2 1.2
Smog g O3 65 65 65 35 35 36 19 20 20 18 18 18 12 12 12
Water Use Liters 50 50 50 68 68 68 45 45 45 34 34 34 33 33 33
Land Use m2-yr 1.2 1.2 1.2 0.55 0.55 0.55 0.36 0.36 0.36 0.26 0.26 0.26 0.24 0.24 0.24
Varying the value of storage duration at the consumer home has little effect on the environmental impact results. Global warming, ozone,
acidification and smog results for the Ft. George, Harmon and Hopworks brewery are impacted between 1-4%.
There were no changes to the system boundary as a result of the sensitivity analyses.27 Interpretation The LCIA results show the life cycle impacts of consumption of 12 fl. oz of beer for the purpose of developing an environmental product declaration. Since no comparative assertions are intended, only internal information and comparison can be made. The impact assessment results reflect that the ingredients and brewery phases are the key contributors of impacts while the packaging phase may also be significant at specific breweries. Sensitivity analyses show that variation in barley production has a moderate impact on the overall environmental impact of the product, and that the duration of cold storage in refrigerated trucks and retail locations has a moderate to high influence on ozone depletion results. The data used in this study met the data quality requirements initially defined with the exception of the requirement that data representing 80% of product mass be derived from primary data sources. Only 17% of the mass of the product is represented by primary data. Value Judgments and Assumption The value judgments in this analysis are very limited: any value judgments were made in the product category rule. No weighting, grouping or normalization was performed in the study. Allocation of electricity consumption and refrigeration for beer was performed by volume. Data sources for the analysis were either from North American or from OECD countries. We have assumed that the production of malt, steel, container glass, chemical products, and tap water are similar in the EU and in the US. Critical Review In accordance with ISO 14025 and the Earthsure Program Guidance, this document was reviewed by a certified LCA professional, Thomas Gloria of Industrial Ecology Consultants, LCACP 2008-3.
28

Environmental Product Declarations (Website Version)
29
30
31
32

Environmental Product Declarations (Print Version)
33
34
35

Appendix A Data Collection Spreadsheets

 GENERAL INFORMATION
 Date Entry Completed By           John Doe
 Date of Data Entry                                         4/15/2012
 Brewery Name                      Example Brewing Company
                                   5013 North Pearl Street, Ruston,
 Location                          WA
 Zipcode                                                        98047

 UTILITIES
 Electric Utility                  Puget Sound Energy

 Natural Gas Utility               Puget Sound Energy
 Water Utility                     Tacoma Public Utilities

 RENEWABLE ENERGY
 Site Connected To Electric Grid   Yes
 Site Produces Renewable Energy    No
 Renewable Energy Type
 Annual Renewable Energy
 Produced (kWh)                                                 0.00
36
PRODUCT INFORMATION
Beer Product Name Beer ABC
Beer Product Type Lager
Beer Product Style vienna-style lager
Preferred EPD Functional Unit 16 ounces
Date Batch Produced 4/15/2012
WATER CONSUMPTION
Specify volumes used for one batch of beer
Volume Units
Beer Produced Per Batch 31.00 gallons
Water for Beer Per Batch 50.00 gallons
Water for Cleaning Per
Batch 20.00 gallons
WASTE MANAGEMENT
Specify amounts of waste produced for one batch of beer
Quantity
Waste
Waste Type (Weight / Units
Treatment
Volume)
Spent Grains animal feed 150.00 pounds
Trub / Hotbreak sewage 8.00 gallons
Coldbreak compost 4.00 gallons
Wastewater sewage 28.00 gallons
disposal
Hazardous Waste facility 0.00 gallons37
BEER REFRIGERATION
Specify refrigerator and time one batch of beer stored in refrigeration
Refrigerator Brand and Model SPT WA-6011S
Average Time in Refrigerator Units
7.00 Days
RECIPE INGREDIENTS
Specify weights of ingredients for one batch of beer
Organic
Ingredient Product Name Weight Units
(yes/no)
malt 6-Row Brewers Malt No 75.00 pounds
Aromatic Malt - European style 2-row
malt malt No 35.00 pounds
hops Apollo Pellet Hops Yes 8.00 ounces
hops Crystal Pellet Hops Yes 4.00 ounces
yeast Direct Pitch Activator unknown 11.50 grams
apricot California Apricot No 1.00 pounds38
Enter shipping transportation for each ingredient
Fuel
Location Shipped Supplier Fuel Type
Supplier Name Shipping Method Consumed Units
From Type (if self)
(if self)
Briess Malt & Ingredients Chilton, WI manufacturer common carrier: rail
Briess Malt & Ingredients Chilton, WI manufacturer common carrier: rail
common carrier:
Hops Direct Mabton, WA manufacturer truck
common carrier:
Hops Direct Mabton, WA manufacturer truck
Wyeast Laboratories Hood River, OR Distributor self: passenger car gasoline 2.00 gallons
Safeway Tacoma, WA Retailer self: truck diesel 2.00 gallons
Specify weights of ingredient packaging materials for one batch of beer
Packaging
Packaging Material Weight Units Waste
Treatment
plastic #4 (LDPE - low density
polyethylene) 10.00 pounds recycle
plastic #4 (LDPE - low density
polyethylene) 10.00 pounds recycle
Aluminum 10.00 pounds landfill
Aluminum 10.00 pounds landfill
Cardboard 10.00 pounds recycleYou can also read