Punt Road Public Acquisition Overlay Traffic and Transport Evidence - Planning
←
→
Page content transcription
If your browser does not render page correctly, please read the page content below
Punt Road Public Acquisition Overlay
      Traffic and Transport Evidence

Expert //          Reece Humphreys
Client //          VicRoads
Instructed by //   Norton Rose Fulbright
Reference //       16M1576000
Hearing Date //    9 February 2016
Report Date //     02/02/2016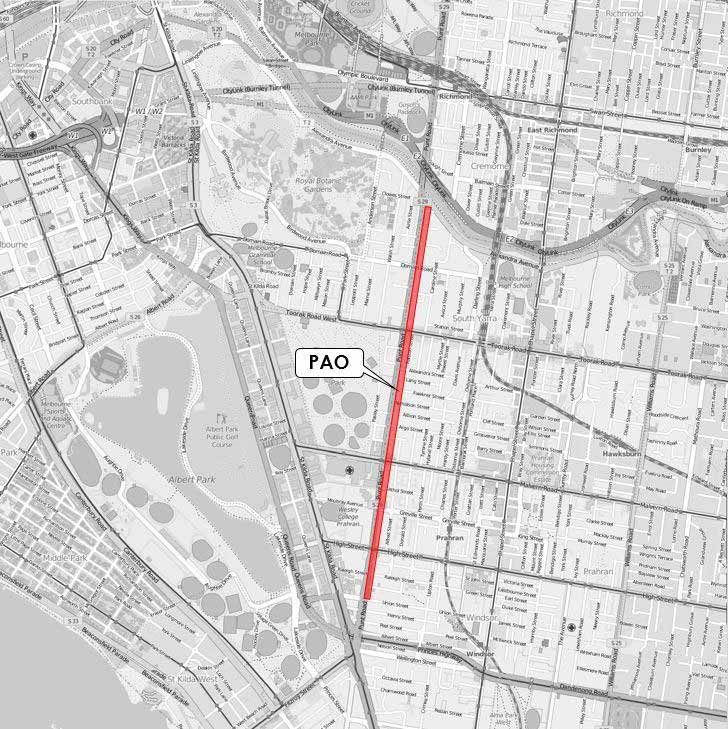
Punt Road Public Acquisition Overlay

                                                                                              Traffic and Transport Evidence
                                                                                                                  Issue: Final 02/02/2016

                                                                                                                        Client: VicRoads
                                                                                                                 Reference: 16M1576000
                                                                                                              GTA Consultants Office: VIC

                              © GTA Consultants (GTA Consultants (VIC) Pty Ltd) 2015
VCAT Evidence (150630 v2.6)

                              The information contained in this document is confidential and
                              intended solely for the use of the client for the purpose for which it has
                              been prepared and no representation is made or is to be implied as
                              being made to any third party. Use or copying of this document in            Melbourne | Sydney | Brisbane
                              whole or in part without the written permission of GTA Consultants
                                                                                                            Canberra | Adelaide | Perth
                              constitutes an infringement of copyright. The intellectual property
                              contained in this document remains the property of GTA Consultants.                Gold Coast | Townsville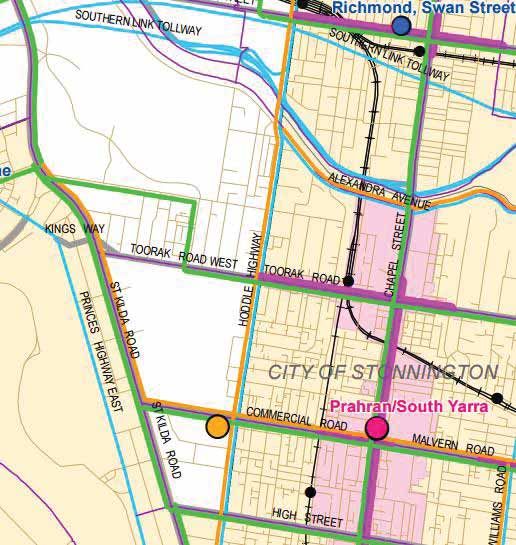
Table of Contents
1.   Introduction                                                                                   1
     1.1 Background                                                                                 1
     1.2 Instructions & Scope of Report                                                             1
     1.3 Expert Witness Details                                                                    2
     1.4 References                                                                                 2

2.   Punt Road Public Acquisition Overlay                                                           3
     2.1 Background                                                                                 3
     2.2 The PAO                                                                                    3
     2.3 Arup Options Report                                                                        4
     2.4 Anticipated Demographic Growth in Punt Road Corridor                                      6

3.   Strategic Transport Planning Evaluation                                                        7
     3.1 Preamble                                                                                   7
     3.2 Statutory & Other Key Legislative Controls                                                7
     3.3 Plan Melbourne                                                                            11
     3.4 PTV Bus Network Development Plan                                                          12
     3.5 VAGO Reports                                                                              12
     3.6 International Policy Example                                                              13
     3.7 Summary of Legislative, Best Practice and Policy Review                                   13

4.   Assessment of Options                                                                         14
     4.1 Introduction                                                                              14
     4.2 Network Performance                                                                       14
     4.3 Intersection Operation                                                                    16
     4.4 Public Transport                                                                          19
     4.5 Pedestrians                                                                               24
     4.6 Summary of Option Assessment                                                              24

5.   Response to Submissions                                                                       26
     5.1 Terms of Reference                                                                        26
     5.2 City of Melbourne – Council Report                                                        26
     5.3 City of Stonnington- Ratio Report                                                         27

6.   Retaining the PAO                                                                             30
     6.1 Conclusions                                                                               33

7.   Summary of Opinion                                                                            34
     7.1 Summary of Opinion                                                                        34

                                                                    16M1576000 // 02/02/2016
                                                  Traffic and Transport Evidence // Issue: Final
                                                        Punt Road Public Acquisition Overlay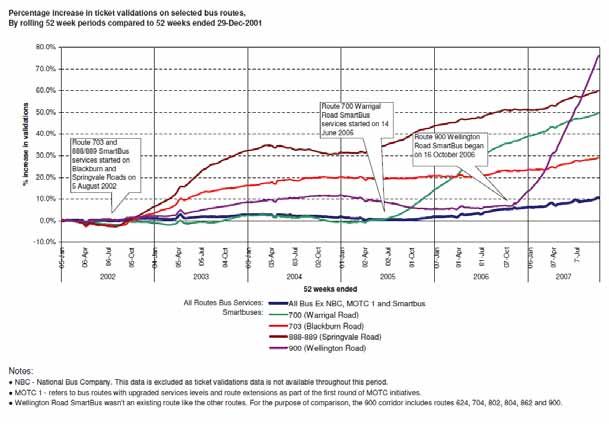
Appendices

    A:    Reece Humphreys– Curriculum Vitae
    B:    City of Stonnington Public Transport Map

Figures
    Figure 2.1:    Location of the Punt Road PAO                                                      4
    Figure 3.1:    SmartRoads Road Use Hierarchy – Punt Road and Surrounding Areas                    10
    Figure 4.1:    Arup SIDRA Assessment: Anticipated Northbound Queue lengths on Punt
                   Road (AM and PM Peak)                                                              17
    Figure 4.2:    Arup SIDRA Assessment: Anticipated Southbound Queue lengths on Punt
                   Road (AM and PM Peak)                                                              17
    Figure 4.3:    Arup SIDRA Assessment: Delays for Westbound through Movements (AM and
                   PM peak)                                                             18
    Figure 4.4:    Arup SIDRA Assessment: Delays for Eastbound through Movements (AM and
                   PM peak)                                                              19
    Figure 4.5:    Route 246 Customer Journey Purpose (Source: PTV)                                   20
    Figure 4.6:    Route 246 Customer Access and Egress Modes (Source: PTV)                           20
    Figure 4.7:    Percent Increase in patronage by Bus Route (Source: PTV)                           22
    Figure 5.1:    Punt Road Average Weekday Peak hour throughput (source: VicRoads)                  28
    Figure 5.2:    Punt Road Weekend Peak hour throughput (source: VicRoads)                          29

Tables
    Table 2.1:     VITM Model Land Use Forecasts for Zones within 800m of Punt Road                   6
    Table 4.1:     Arup VITM Two Way Estimated Daily Volumes in 2031                                  14
    Table 4.2:     Arup VITM Estimated PT Demands by Link (North-South Movements)                     21
    Table 4.3:     Arup VITM Estimated PT Demands by Link (East-West Movements)                       21
    Table 4.4:     Arup VITM two Hour Headways by Tram Route                                          23
    Table 4.5:     Arup SIDRA Assessment: Average Delay at Toorak Road Intersection
                   Pedestrian Crossings (seconds)                                                     24
    Table 5.1:     Public Transport Terms of Reference Response                                       26
    Table 6.1:     Transport Integration Act – Triple Bottom Line Assessment of the PAO Removal
                   V Retention                                                               31

                                                                       16M1576000 // 02/02/2016
                                                     Traffic and Transport Evidence // Issue: Final
                                                           Punt Road Public Acquisition Overlay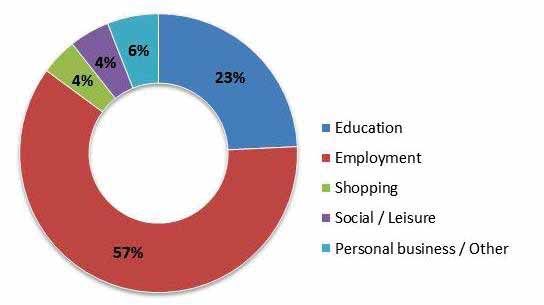
1.           Introduction
                                                                                                                 1
1.1          Background
An Advisory Committee (the Committee) has been appointed by the Minister for Planning to
consider the Punt Road Public Acquisition Overlay (PAO), between Alexandra Avenue in South Yarra
and Union Street in Windsor.

The Committee is seeking to review the future of the PAO affecting properties within the City of
Stonnington on the east side of Punt Road and to determine whether or not to retain, modify or
remove the overlay.

I have been instructed by Norton Rose Fulbright Australia in December 2015 to consider and address
the traffic and transport matters associated with the terms of reference of the PAO, the strategic
benefit of retaining the PAO having regard for the Concept Options 5, 6 and 7 in the Arup Options
report, and provide and prepare an expert evidence report on those issues for presentation at the
upcoming hearing.

In preparing this report, I have relied upon information prepared by VicRoads, Public Transport
Victoria (PTV) and Arup in forming my position. It is important to note that my report is an
independent traffic and transport evidence report and is not a peer review of the previous work
undertaken by others.

1.2          Instructions & Scope of Report
I have been engaged to prepare and present expert traffic and transport evidence as part of the
Advisory committee to consider the Punt Road Public Acquisition Overlay. Prior to preparing this
evidence I was briefed by Norton Rose Fulbright regarding the proposal via written instructions.

This evidence has been prepared having consideration of the following matters:
    i     A review of the relevant background material
    ii    The strategic traffic and transport context of the Punt Road Corridor in the local and
          wider network
    iii   Relevant traffic and transport matters set out in the Advisory Committee Terms of
          Reference dated 10th December 2015
    iv    The vehicular and public transport benefits of retaining the PAO as they specifically relate
          to the relevant Terms of Reference for the hearing
    v     The strategic benefit in retaining the PAO, particularly having regard to Concept Options
          5, 6 and 7 in the Arup Options Report.

                                                                                  16M1576000 // 02/02/2016
                                                                Traffic and Transport Evidence // Issue: Final
1                                                                     Punt Road Public Acquisition Overlay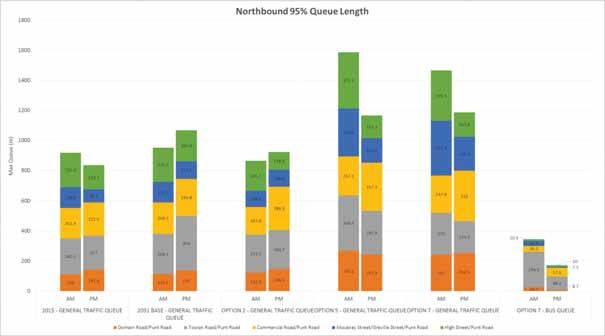
1.3       Expert Witness Details
Reece Humphreys BE (Civil)
Director – GTA Consultants (Vic) Pty Ltd
L25, 55 Collins Street, Melbourne
Areas of Expertise: Traffic Engineering & Transport Planning

I have a Bachelor of Engineering degree and over eleven years’ experience spanning transport
modelling, major event planning, traffic engineering design, land use development and traffic and
parking impact assessments. This experience covers a mixture of tasks ranging from microsimulation
modelling of large scale projects in Melbourne and Sydney to traffic engineering analysis and
advice on projects around Australia. I have had active roles in managing and delivering the
transport planning a variety of large major event planning projects for the Australian Open (tennis),
Commonwealth Games and Herald Sun/CityLink Run for the Kids Fun Run. I have also completed a
number of projects for VicRoads and the NSW RTA including a series of large regional transport and
microsimulation models, strategic corridor modelling, SCATSIM modelling and independent model
auditing. I have recently assisted with planning approval for a number of high profile rezoning and
development applications for large retail and residential uses in Melbourne.

In 2012 I was a finalist for the Engineers Australia Young Engineer of the Year Award. Currently I serve
as a committee member on the AITPM and as a member of the National AITPM Transport Modellers
Network.

Further details of my experience are provided in Appendix A.

1.4       References
In preparing this evidence, reference has been made to the following:
|     Stonnington and Melbourne Planning Scheme
|     Arup Options Report for VicRoads dated 14th October 2015
|     Concept Layout plans prepared by Arup as part of the Options Report
|     VicRoads Options Report August 2012
|     VicRoads and PTV submission to the Committee, Part A, dated 24 th December 2015
|     Plan Melbourne, May 2014
|     various technical data as referenced in this report
|     an inspection of the site and its surrounds.

                                                                                 16M1576000 // 02/02/2016
                                                               Traffic and Transport Evidence // Issue: Final
2                                                                    Punt Road Public Acquisition Overlay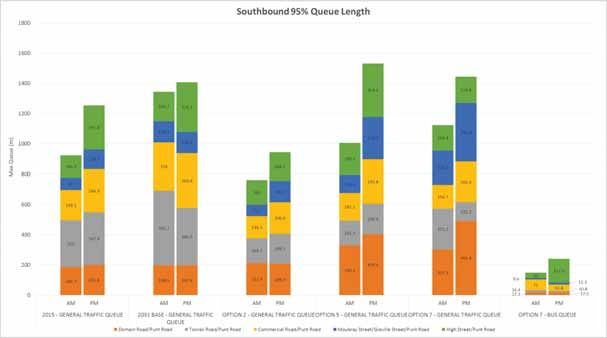
2. Punt Road Public Acquisition Overlay
2
2.1 Background
The Punt Road Public Acquisition Overlay (the “PAO”) has been in place since 1954 which reserves
the land to the east side of Punt Road (between Alexander Avenue in South Yarra and Union Street
in Windsor) for use by the government to undertake infrastructure works deemed important to the
strategic growth of Melbourne.
Work completed by VicRoads and other consultants have established that the corridor is heavily
congested during the transport network peaks as well as inter-peak and weekend periods, and that
its high casualty rates1 need to be reduced. Investigations into improvement works for optimising
and improving the operation of the Punt Road corridor are already warranted. It is the only major
north south arterial route in the eastern side of an expanded Central City making it vital to
Melbourne’s liveability and access as well as supporting economic growth.
Since the PAO has been implemented, VicRoads have either compensated or purchased all except
three properties affected by the amendment. The Committee has been requested to review all
relevant information on the current status of planning and the PAO, and recommend whether to
retain, modify or remove the overlay.
2.2 The PAO
The PAO reserves the land adjacent Punt Road protecting its use for potential improvements to Punt
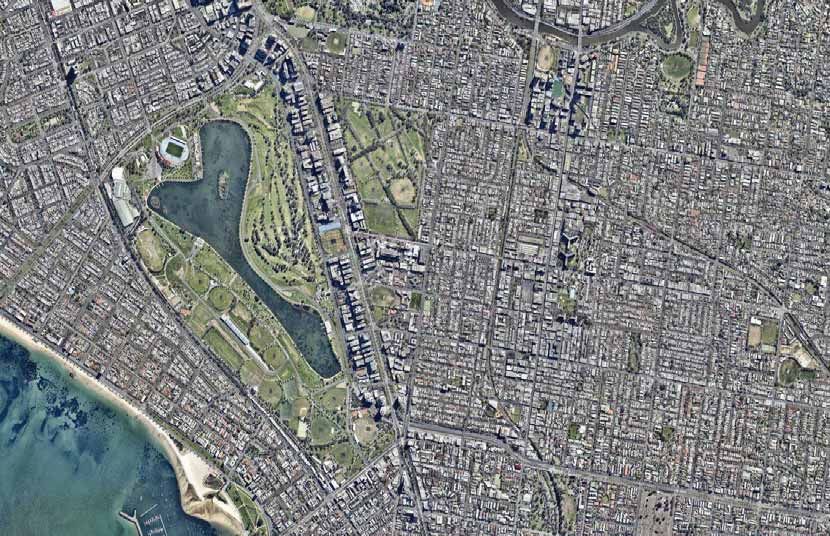
Road in the future. The location of the Punt Road PAO has been reproduced in Figure 2.1.
1 Refer to Trafficworks Background Conditions Report dated 21/4/2015
16M1576000 // 02/02/2016
Traffic and Transport Evidence // Issue: Final
3 Punt Road Public Acquisition Overlay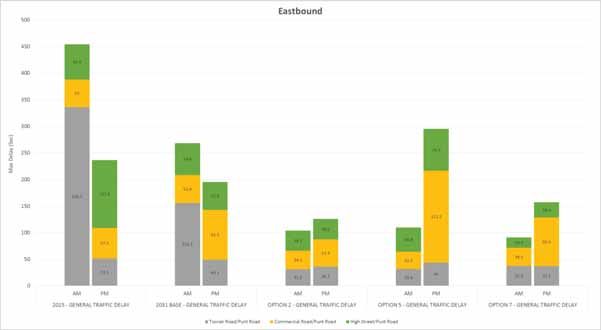
Figure 2.1: Location of the Punt Road PAO

The PAO consists of approximately 20 metre wide strip of land on the east side of the current Punt
Road alignment. All properties affected by the PAO are located in the City of Stonnington, except
for a small strip of land on the southern end of Punt Road which is located within the City of Port
Phillip. It is also noted that properties located on the west side of Punt Road are located within the
City of Melbourne.

Punt Road is nominated as a Road Zone Category 1 (RZ1) in the Victorian Planning Scheme and is
managed and controlled by VicRoads.

2.3       Arup Options Report
VicRoads engaged Arup Consultants to develop a series of improvement concepts for the corridor
and assess their relative merit, which were presented in their report dated 14th October 2015. Seven
concepts where developed which are all at-grade configurations, noting that grade separated
solutions and major new transit corridors were not considered as part of the Arup engagement.

The various concepts require different use of the PAO land, noting that concept Options 1, 2 and 3
do not require use of the PAO. Briefly, the Concept Options are discussed as follows:

                                                                              16M1576000 // 02/02/2016
                                                            Traffic and Transport Evidence // Issue: Final
4                                                                 Punt Road Public Acquisition Overlay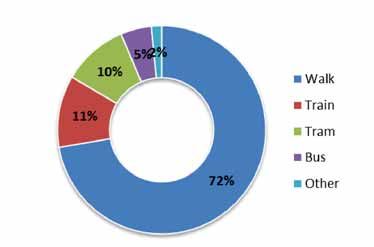
|    Concept 1 - 24 hour Clearways;
|    Concept 2 - 4 Lane: Central Right Turn Lane;
|    Concept 3 - 4 Lane: Narrow Central Median;
|    Concept 4 - 5 Lane: Reversible Lane;
|    Concept 5 - 4 Lane/6 Lane: Widening Intersections;
|    Concept 6 - 6 Lane: Dual Carriageway; and
|    Concept 7 - 4 Lane/6 Lane: Bus Lanes.

Each of the concepts are discussed broadly below with layouts detailed in Appendix A of the Arup
Report.

Concept 1 - 24 hour Clearways
Concept 1 can be implemented without using PAO land and involves the removal of kerbside
parking along the length of Punt Road (on both sides) and 100m on east-west arterials that intersect
Punt Road. It is noted that clearways currently operate along Punt Road during the peak AM and
PM periods and therefore benefits would only be realised outside of these times.

Further, it is noted that all concept options propose 24-hour/7-day clearways and the conversion of
PAO properties, owned by VicRoads, into public off-street parking areas.

State government announced on 31 January 2016 that 24 hour clearways will be introduced by the
middle of 2016.

Concept 2 - 4 Lane: Central Right Turn Lane
Concept 2 extends on the clearways described in Concept 1 by incorporating a linemarked central
right turning lane which provides continuous opportunities for right turns into frontage properties and
local streets. Additionally, this option would include improved tram priority lanes for east west routes,
upgrades to stops and simplified traffic signal operations.

This option can also be implemented without using PAO land, however the concept, as well as
Concepts 3 to 7, potentially requires acquisition of a small parcel of park land (Fawkner Park) outside
the PAO. Further discussion on the Fawkner Park land is provided in Section 5.2.

Concept 3 - 4 Lane: Narrow Central Median
Concept 3 adopts the same arrangement as Concept 2, however the central lane would be a solid
median (instead of a right turn lane) preventing right turns at minor midblock locations. All right turns
would be required to take place at signalised intersections.

Concept 4 - 5 Lane: Reversible Lane
Concept 4 provides five lanes with a reversible central lane, however this concept has since been
deemed unacceptable by VicRoads as a result of safety and space implications and is not being
considered any further.

Concept 5 - 4 Lane/6 Lane: Widening Intersections
Concept 5 builds on Concept 2 by providing additional capacity at major signalised intersections.
The approach and departure sides of intersections would be flared (or widened) to increase
capacity for vehicular throughput, whilst the option also provides an opportunity to allocate an
additional lane to public transport.

Approximately 65 of 140 properties within the PAO would be impacted by this arrangement.

Concept 6 - 6 Lane: Dual Carriageway
Concept 6 proposes three continuous traffic lanes in each direction (plus additional lanes at key
intersections), whilst maintaining the modification to right turn movements in Concepts 2 and 3 to

                                                                                16M1576000 // 02/02/2016
                                                              Traffic and Transport Evidence // Issue: Final
5                                                                   Punt Road Public Acquisition Overlay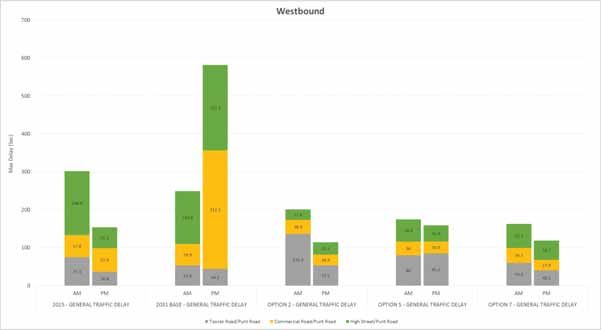
simplify the traffic signal operations. In addition, existing footpaths are proposed to be widened and
a dedicated bicycle path constructed to the east of Punt Road.

According to the plans prepared by Arup, this option would require full use of the PAO and
approximately 130 properties.

Concept 7 - 4 Lane/6 Lane: Bus Lanes
Concept 7 is a combination of options 5 and 6. As an alternative to providing three continuous
traffic lanes at midblock locations, one of the lanes in each direction would be allocated to buses.
As with concept 6 this option would require full use of the PAO. It would include the same simplified
traffic signal operations and would alter the proposed cycle path in Option 6 (due to the bus lanes)
and narrowing of roadside verges at major intersections.

Similar to Option 6, this option would require full use of the PAO and approximately 130 properties.

2.4                                  Anticipated Demographic Growth in Punt Road Corridor
I have extracted some of the inputs from the Victorian Integrated Transport Model (VITM) Reference
Case to understand in more detail the predicted changes in land use within 800m of the Punt Road
Corridor. The land use forecasts within VITM are ratified by the Department of Economic
Development, Jobs, Transport and Resources (DEDJTER) and were most recently updated in 2014.

My review was to seek to understand the projected land use change abutting Punt Road in both a
local and Melbourne wide Context and how this applies to transport integration.

A summary of the existing (2011) and forecast future land uses is provide in Table 2.1. The analysis
includes the land use forecasts for zones located within an 800m wide strip of land along each side
of Punt Road.
Table 2.1:                             VITM Model Land Use Forecasts for Zones within 800m of Punt Road
                                                                                               Land Use Forecast
                                 Design Year                       Population                      Employment                         Education
                                                                (no. of residents)                 (no. of jobs)                 (no. of enrolments)
                                          2011
                                                                      16,564                           34,960                            10,772
                                        (Existing)
      Punt Road Corridor [1]

                                          2021                        25,079                           40,607                            11,661
                                          2031                        28,275                           50,266                            13,781
                                          2046                        36,149                           59,937                            16,698
                                      Net Change                     +11,711                          +15,306                            +3,009
                                      (2011-2031)                    (+171%)                          (+144%)                           (+128%)
                                      Net Change                     +19,585                          +24,977                            +5,926
                                      (2011-2046)                    (+218%)                          (+171%)                           (+155%)
 Net Change (Metropolitan                                           +1,763,000                        +920,000                          +475,000
   Melbourne 2011-2031)                                              (+143%)                          (+143%)                           (+139%)
 Net Change (Metropolitan                                           +3,103,000                       +1,735,000                         +794,000
   Melbourne 2011-2046)                                              (+176%)                          (+180%)                           (+166%)
[1]                            Includes VITM Zones. Located within 800m of Punt Road between St Kilda Junction and Alexander Avenue

The outputs show that population and employment growth within the corridor is forecast to be
generally at or above that of Melbourne’s rate to 2031 with the exception of enrolments. The
forecast growth in the corridor and resultant activity will place additional demand on the transport
system, in particular for public transport (and access thereto and from), walking and cycling and
their level of accessibility.

I also note that the 2046 forecasts highlight the forecast growth of Melbourne’s population is
expected to reach 7.2 million.

                                                                                                                       16M1576000 // 02/02/2016
                                                                                                     Traffic and Transport Evidence // Issue: Final
6                                                                                                           Punt Road Public Acquisition Overlay
3. Strategic Transport Planning Evaluation
3
3.1 Preamble
There are a number of key policy and best practice planning documents which provide guidance
on matters relating to traffic and transport planning for Punt Road.
Those considered most important to any evaluation of the strategic need for the PAO are set out in
the following sections together with a brief summary of their application. Further to these
documents, detail is also provided on case studies and investigations which further explain the
significant of the Punt Corridor and broader road network transport planning issues for inner
Melbourne.
3.2 Statutory & Other Key Legislative Controls
3.2.1 Road Management Act (2010)
The Road Management Act (RMA) is the overarching form of governance for the road network, its
management and performance. It is a statutory framework that provides a set of principles for the
management of the road system. There are a number of components within the RMA that are of
relevance to this hearing which I draw attention to, most notably, Section 20 Part 1A of the Act notes
the following:
“In giving effect to the principal object of road management consistent with the transport system
objectives under the Transport Integration Act 2010, the road network is to be managed to reflect
the priorities of different modes of transport having regard to the intended function or functions of
different parts of the road network.”
This overarching statement sits well with not only the current role but any future role that Punt Road
as a transport corridor will play. The need to provide a transport system that accommodates the
movement of people relates to not only Punt Road itself but the wider network. Future population
growth in Melbourne lead to the necessity that parts of the road network will require some form of
capacity improvement over time to ensure that the objectives of the act are met.
3.2.2 Transport Integration Act (2004)
The Transport Integration Act (TIA) is the primary transport statute for Victoria, and has caused
significant change to the way transport decisions are undertaken. The TIA requires that all transport
agencies work together to achieve an integrated and sustainable transport system. The TIA is
designed to consider all users and modes against a set of objectives and principles.
The TIA:
| unifies all elements of the transport portfolio to ensure that transport agencies work together
towards the common goal of an integrated transport system
| provides a framework for integrated and sustainable transport policy and operations
| recognises that the transport system should be conceived and planned as a single system
performing multiple tasks rather than separate transport modes
| integrates land use and transport planning and decision-making by extending the framework
to land use agencies whose decisions can significantly impact on transport ("interface bodies")
| re-constitutes transport agencies and aligns their charters to make them consistent with the
framework.
16M1576000 // 02/02/2016
Traffic and Transport Evidence // Issue: Final
7 Punt Road Public Acquisition OverlayThe TIA forms an overarching legislative framework for transport related state planning policies and
has been integrated within the Victoria Planning Provisions (VPP).
The transport system as defined in Section 3 of the Act comprises of all components which make up
the system for the movement of persons and goods. The first three definitions for the management
of components are:
| strategic planning including plans for building the network, acquiring vehicles, reserving
land for future development and business continuity;
| operations planning including business plans, corporate plans, operations plans and
contingency plans;
| operational matters required to operate the transport system including schedules,
timetables and ticketing systems;
The PAO sits comfortably within each of these components in particular the right to reserve land for
future development and business continuity. The information provided by both VicRoads and PTV as
part of this process has identified both an immediate and contingent need for use of the PAO that
would benefit the transport network.
In terms of decision making, the TIA provides a framework being a triple bottom line assessment
approach. Decision makers must have regard to the following objectives and principles:
| social and economic inclusion
| economic prosperity
| environmental sustainability.
The relevance of each of these objectives to the PAO are explored in more detail in Section 6 of my
evidence.
3.2.3 Clause 18 of the Victorian Planning Provisions
Clause 18 of the Planning Scheme is designed to reflect the intent of State Government guidance
and contains objectives and strategies in relation to Transport which are relevant to the Punt Road
PAO, including, but not limited to:
| Create a safe and sustainable transport system by integrating land-use and transport.
| Coordinate development of all transport modes to provide a comprehensive transport
system.
| Reserve land for strategic transport infrastructure.
| Upgrade and develop the Principal Transport Network and local public transport network
in Metropolitan Melbourne.
| Provide a Principal Public Transport Network that allows for circumferential, in addition to
radial movements.
| Manage the road system to achieve integration, choice and balance by developing an
efficient and safe network and making the most of existing infrastructure.
| Facilitate and safeguard pedestrian and cyclists’ access to public.
| Promote the use of sustainable personal transport.
| Integrate planning for cycling with land use and development planning and encourage as
alternative modes of travel.
| Achieve greater use of public transport by increasing densities, maximising the use of
existing infrastructure and improving the viability of the public transport operation.
This clause sets out a range of objectives and strategies which seek to support population and
employment growth together with a need to manage the by-product of that growth in the form of
increased demand on the transport system.
16M1576000 // 02/02/2016
Traffic and Transport Evidence // Issue: Final
8 Punt Road Public Acquisition OverlayTransport choice is one the desirable outcomes of planning for growth whereby real alternatives exist
for people to travel by private car in-road, public transport, as well as walking and cycling.
3.2.4 Clause 45.1 Stonnington Planning Scheme – Public Acquisition
Overlay
The Stonnington Planning Scheme identifies the purpose of a PAO as the following:
“To implement the State Planning Policy Framework and the Local Planning Policy Framework,
including the Municipal Strategic Statement and local planning policies.
To identify land which is proposed to be acquired by a Minister, public authority or municipal
council.
To reserve land for a public purpose and to ensure that changes to the use or development of the
land do not prejudice the purpose for which the land is to be acquired.
To designate a Minister, public authority or municipal council as an acquiring authority for land
reserved for a public purpose.”
The scheme identifies and reinforces the original purpose of the PAO which is to safeguard it against
development, with the responsible authority being VicRoads.
3.2.5 VicRoads SmartRoads
SmartRoads is a VicRoads policy which sets ‘modal’ priorities on the road network and underpins
many of the strategies for public transport prioritisation. The policy is reproduced as follows:
“SmartRoads is an approach that manages competing interests for limited road space by giving
priority use of the road to different transport modes at particular times of the day. All road users will
continue to have access to all roads. However, certain routes will be managed to work better for
cars while others will be managed for public transport, cyclists and pedestrians.”2
The SmartRoads approach is used by VicRoads as a decision making tool in relation to any projects
that impact on the network. The SmartRoads network in the vicinity of Punt Road is shown in Figure
3.1.
2 Source: www.vicroads.gov.au.
16M1576000 // 02/02/2016
Traffic and Transport Evidence // Issue: Final
9 Punt Road Public Acquisition OverlayFigure 3.1: SmartRoads Road Use Hierarchy – Punt Road and Surrounding Areas
Source: VicRoads SmartRoads
Figure 3.1 indicates that in the vicinity of the corridor, Punt Road is identified as a Preferred Traffic
Route and Bus Priority Route, Toorak Road as a Pedestrian Priority Area and Tram Priority Route and
Commercial Road and High Street as Tram, Bicycle and Bus Priority Routes. Overall, Punt Road
exhibits a range of competing demands moving along or across it. In relation to north south traffic,
Punt Road is one of two identified traffic routes that cross the Yarra River for an 8km (approx.) stretch
between Richmond and CityLink.
SmartRoads supports the notion of a need to manage competing demands on Punt Road and its
intersecting arterials, and any improvements to Punt Road must have regard for the competing
routes.
16M1576000 // 02/02/2016
Traffic and Transport Evidence // Issue: Final
10 Punt Road Public Acquisition Overlay3.3 Plan Melbourne
The Victorian Government released the Metropolitan Planning Strategy, Plan Melbourne (The Plan) in
May 2014. The Plan is intended to guide Melbourne’s housing, commercial and industrial
development through to 2050. It is noted that the plan is currently going through a ‘refresh’, and will
build on the work already undertaken – the plan refresh is due for release as ‘Plan Melbourne 2016’,
it will continue to be reviewed and updated every 5 years.
A refresh discussion paper was released in 2015 that provided documentation on options to be
included in the 2016 update that resulted from the 2015 ministerial advisory committee review.
Notwithstanding, the 2014 Plan identifies the role that transport plays in underpinning the liveability,
efficiency and productivity of Melbourne. “A More Connected Melbourne” identifies the need for
commuter capacity on public transport and road systems, such as those in inner Melbourne. Further,
it identifies the need to invest in improving road efficiency and public transport services.
The Plan Melbourne strategy is underpinned by six major objectives for Melbourne:
i Delivering jobs and investment – create a city structure that drives productivity, supports
investment through certainty and creates more jobs.
ii Housing choice and affordability - provide a diversity of housing in defined locations that
cater for different households and are close to jobs and services.
iii A more connected Melbourne – provide an integrated transport system connecting
people to jobs and services and goods to market.
iv Liveable communities and neighbourhoods – create healthy and active neighbourhoods
and maintain Melbourne’s identity as one of the world’s most liveable cities.
v Environment and Energy – protect our natural assets and better plan our water, energy
and waste management to create a sustainable city.
vi Implementation: delivering better governance – achieve clear results through better
governance, planning regulation and funding options.
Punt Road has the potential to provide for a transport system that aligns with the objectives
presented above and in doing so can be a more efficient use of existing infrastructure as well as
encouraging more desirable future travel behaviour.
Further, Plan Melbourne (2014) identifies a number of short-term priorities under Initiative 3.1.3,
including:
“Prepare a road-use strategy to ensure trams and buses can operate efficiently alongside other
vehicles, particularly as land use changes”
The subsequent discussion paper from the 2015 ministerial advisory committee recommended that
this priority be maintained as part of the refresh.
In the case of Punt Road, this priority means that planning for the corridor must have regard for an
outcome that enables it to co-mingle buses with other on road vehicles. The current cross section of
Punt Road which is discussed in Section 4 of my report outlines deficiencies in the ability for buses
and vehicles to operate efficiently and meet this objective.
The Plan also strives to improve bus services in initiative 3.1.4 as follows:
“Support growing areas of the central city by strengthening bus services to and around Central
Melbourne”
Buses are shifting to performance based systems that seek to improve both reliability and patronage.
It is also worth noting that Direction 3.5 of Plan Melbourne relates to “Improve the efficiency of freight
networks while protecting urban amenity”. The direction discusses the importance of Freight to the
16M1576000 // 02/02/2016
Traffic and Transport Evidence // Issue: Final
11 Punt Road Public Acquisition Overlaystates’ economy as documented in the report entitled ‘Victoria - The Freight State’ with a long term
objective to:
“Ensure investment in the arterial road network in metropolitan Melbourne improves the level of
service for freight, to reduce pressure for the diversion of freight transport onto local roads”
Map 23 in Plan Melbourne identifies Punt Road as a principal link in the 2050 freight network. Whilst it
is highlighted that limited planning for Punt Road as a Freight Route has been undertaken, it currently
performs an important role for local freight and commercial deliveries.
3.4 PTV Bus Network Development Plan
I have requested from PTV the status of their PTV Bus Network Development Plan which is similar to
the heavy rail network development plan document released by PTV. The Bus Network
Development Plan document will provide direction and guidance on the future planning of
Melbourne’s bus network, and it is identified in Plan Melbourne as an action item for its delivery.
PTV have provided the following comment in relation to the plan:
“In 2012 PTV completed the first of these Network Development Plans for the Metropolitan Rail
Network. This plan provided the government with a comprehensive plan for the development of
Melbourne’s rail system over a 40 year time frame for its consideration. The Regional Network
Development Plan is currently under development. Following the completion of the regional plan,
PTV will then seek to complete the Tram and Bus (On Road) Network Development Plan.
Not with standing this, as Route 246 is currently the ninth most popular bus service in Victoria, a major
bus route operating along the Punt Road corridor into the future will be part of the On Road NDP.
Punt Road is also a key link on the Principal Public Transport Network.”
3.5 VAGO Reports
The Victorian Auditor-General's Office is a public sector audit organisation providing auditing
services to the Victorian Parliament and Victorian public sector agencies and authorities.
The office assists the Auditor-General, who is an independent officer of Parliament, appointed under
legislation to examine and report to Parliament and the community on the efficient and effective
management of public sector resources, and provide assurance on the financial integrity of
Victoria's system of government.3
Managing Traffic Congestion (April 2013)
The Victorian Auditor General released its audit report on Managing Traffic Congestion (April 2013). The
study highlights the primary trip generators in peak periods as those associated with employment and
education. Most importantly, the report notes that in recent times:
“….congestion management strategies remain heavily weighted towards the supply side with little
attention to demand management. Continuing this approach poses a significant risk for achieving
any congestion reduction benefits attached to the MPS’ preferred vision for Melbourne’s future
growth.”4
A key outcome of the VAGO report is the need to plan the road network to ensure that it has the
ability to operate and function for vehicles and public transport services.
The report also makes a number of recommendations relating to the Department of Transport (as
they were known at the time), Public Transport Victoria and VicRoads insofar as developing a
3 Source: http://www.audit.vic.gov.au/about_us.aspx
4 Source: Victorian Auditor General’s Report on Managing Congestion, Page xiii
16M1576000 // 02/02/2016
Traffic and Transport Evidence // Issue: Final
12 Punt Road Public Acquisition Overlaybalanced approach to delivering network upgrades under the regulatory framework established
under the Transport Integration Act (2010).
3.6 International Policy Example
Safeguarding and protecting land is increasingly difficult as cities around the world are experiencing
growth and the pressures of maintaining a functioning transport network increases. This is an issue
that is not confined to Melbourne and is something that interstate and international cities are
addressing by safeguarding land for transport. One such example that I have sourced is the Policy
for the City of London5. The London ‘Land for Transport’ Policy highlights the economic and social
viability for land retention:
It is recognised in the Mayor’s London Plan that transport plays an essential part in keeping the city
prosperous economically and socially. Ensuring that land is available for transport functions close to
the market it serves helps reduce the cost of provision, improve reliability and reduce transport’s
energy consumption. It may also help ensure operational staff can access their place of work more
easily.
Further reading of the document in relation to road congestion highlights a requirement for schemes
that have the impact of reducing road capacity for the urban realm or walking and cycling must
‘take into account the impact on congestion and reliability for all road users, and on the bus
network in particular’.
3.7 Summary of Legislative, Best Practice and Policy Review
My review of policy, strategic and best practice literature documents as part of this study raises a
number of key transport themes which have relevance to the PAO.
It is evident that the Committee has access to a raft of planning tools and reference documents
which will assist it in determining the acceptability of transport planning outcomes. These tools at the
highest level deliver a strong strategic platform in support of a state wide transport system which is
“sustainable” but also “deliverable”.
It is also conceivable through this documentation that policy supports the need to deliver
improvements to both private vehicle and on road public transport. VicRoads has identified Punt
Road as both a traffic and public transport priority route and as such the development of transport
system improvements must have regard for the ability to deliver across all modes.
The themes identified in the policy and best practice documents identified are all contained under
the umbrella of the Transport Integration Act. The TIA defines and guides the way transport decisions
are undertaken in order to achieve an integrated and sustainable transport system. This is more
evident now given the forecast growth in both the immediate and wider areas.
Overall, there is strong strategic justification within both state and local policy identifying at the very
least a need to protect assets such as the Punt Road PAO for the future legacy of the transport
network.
5 Source: London Plan, Supplementary Planning Guidance on Land for Transport (2012)
16M1576000 // 02/02/2016
Traffic and Transport Evidence // Issue: Final
13 Punt Road Public Acquisition Overlay4. Assessment of Options
4
4.1 Introduction
As part of my brief I have been requested to investigate the merits of options 5, 6 and 7 of the Arup
Report, and in particular whether or not the PAO should be retained. Whilst these options are the
primary focus of my evidence, I have had some regard for Options 1-3 as these also demonstrate
the maximum level of operation possible without the PAO.
This section looks at key traffic and transport components of the corridor being the network
demands, intersection performance, public transport and pedestrian movement. It also focuses
(where possible) on formulating responses to the key traffic and transport matters that have been
stated as part of the terms of reference and/or submissions.
I note that each of the options that activate the use of the PAO also require improvements to
Hoddle Street (including Yarra Bridge) and the St Kilda Road-Punt Road intersection. I have not
undertaken a critical review of these improvements as they do not impact directly on the PAO
4.2 Network Performance
4.2.1 Victorian Integrated Transport Model (VITM) Outputs
Through the process of preparing my report I have reviewed the available VITM outputs provided
from Arup as they directly relate to traffic movement in and around the areas south of the Yarra
River. Link Volumes on four key roads that relate to north-south flow south of Toorak Road are
reproduced in Table 4.1.
Table 4.1: Arup VITM Two Way Estimated Daily Volumes in 2031
Arup Options (2031)
Location 2013
Do Nothing Options 1-3 Option 5 & 6 Option 7
Punt Road – South of Toorak Road 32,000 34,000 30% 65% 64%
St Kilda Road – South of Toorak Road 44,000 47,000 1% -3% -2%
Chapel Street – South of Toorak Road 17,000 19,000 -5% -9% -8%
Williams Road – South of Toorak Road 23,000 25,000 -6% -10% -10%
Total 116,000 125,000 7% 13% 13%
* VITM outputs reproduced from Table 3 of Arup Options Report
* Option increases are those increases or decreases against the ‘Do Nothing’ Option
* Total is the percentage of total of each link calculated from individual percentages
Interrogation of the volumes identifies that with the expected population and employment growth,
and maintaining the Punt Road corridor as it currently stands (i.e. do nothing scenario), the north-
south routes are anticipated to increase by approximately eight percent. The growth is expected to
vary across each of the four corridors of between two and three thousand additional vehicles per
day.
It is sensible that Options 5 and 6 from a strategic (VITM) perspective have been modelled as similar
options given that the throughput at each of the intersections would be generally similar to a
degree. I would expect Option 6 may have a marginal higher level of throughput given the
reduced levels of merging and diverging upstream and downstream of the intersections.
The capacity improvements provided with Options 5, 6 and 7 show a large uplift in throughput as a
result of the additional capacity. In broad terms, an additional lane on Punt Road would be
16M1576000 // 02/02/2016
Traffic and Transport Evidence // Issue: Final
14 Punt Road Public Acquisition Overlayexpected to provide more than 50% additional throughput in each direction. This higher level of
throughput in the options highlights that demand in the network exists regardless of the level of
capacity improvement provided. Whilst the strategic model does not include the local street
network, the higher level of demand increase in Options 5, 6 and 7 suggests that there will also be
increased pressure on the local road network. This is on the basis that the forecast population,
employment and educational increases in the immediate vicinity of the corridor (refer to Table 2.1
earlier in this report) will create additional demand on the local road network with residents and
workers trying to access jobs and housing.
The increased capacity of Punt Road in Options 5, 6 and 7 makes this an attractive route for north
south movements and results in a net decrease on the three competing routes. There are a number
of reason for this in my view with the key reasons being the higher speeds on Punt Road with the
increased capacity as well as the connectivity that the corridor plays both north and south of its
extents (i.e. it is a continuous corridor as opposed to the other three routes).
4.2.2 Victorian Mesoscopic Model (VMM) Outputs
The performance of the corridor was also completed by Arup using mesoscopic modelling.
Mesoscopic models are operational models that are able to assess the performance of the network
(using demands from the strategic model) under the operational conditions such as signal control,
lane controls and closures, speed changes and localised turns and movements.
Traditionally these models also provide outputs by vehicle type (i.e. on road and public transport)
which I was advised have not been refined to this level of detail. This would have been beneficial for
this process in identifying the level of throughput and operational performance for public transport.
Notwithstanding, the outputs do provide an indication of the benefits of the corridor under each of
the options.
Of note, the outputs reported show that with options 5, 6 and 7, the throughput growth is higher than
that forecast in VITM, being between 70% improvements in throughput realised in the morning peak,
140% improvements in throughput in the midday peak, and 65% improvement in throughput in the
afternoon peak.
The section of Punt Road between Toorak Road and Commercial Road highlight that in each of
Options 5, 6 and 7 the average speeds on this link will be marginally higher than that of the current
conditions. It is not surprising as the level of throughput and demand is significantly higher in each of
the options with increased capacity. It is also highlighted that the options with lower capacity (and
demand) are expected to operate at higher speeds. What is not shown is whether or not the
remainder of the route as well as parallel and competing east west routes benefit from the
increased throughput on these roads, although the VITM outputs do consider the broader network
implications.
Notwithstanding, I am satisfied that based on the level of throughput achieved Options 5, 6 and 7
provide benefits to both the immediate corridor and the wider north south movements.
4.2.3 East West Traffic
VITM outputs provided in the Arup Options Report indicate that the three key roads crossing Punt
Road (Toorak Road, Commercial Road and High Street) are anticipated to experience varying
degrees of growth both to 2031 and for each of the options. The two southern routes of Commercial
Road and High Street experience increases whilst Toorak Road is expected to experience marginal
decreases when compared to both 2013 and 2031 demands. The low growth on Toorak Road
highlights the deficiencies in its capacity, as well as the role that Commercial Road and High Street
provide in feeding other routes to get to Punt Road.
16M1576000 // 02/02/2016
Traffic and Transport Evidence // Issue: Final
15 Punt Road Public Acquisition OverlayThe predicted marginal increase in throughput on the east west routes make sense given the relative
catchments (when compared to the wider metropolitan network) for each of the east west roads
crossing Punt Road and the high level of public transport options available. A more detailed
interrogation of the east west routes is provided in the intersection and public transport assessments
in the following sections.
4.3 Intersection Operation
4.3.1 North South
The proposed approach to provide improved throughput in each of the options is fundamentally
driven by improving the operating characteristics at each of the signalised intersections. Each of the
options aim at removing or relocating key right turn movements on the majority of approaches
which has the benefit of providing more green time allocation to the through movements both north
to south and east to west. Cycle times for each intersection would be reduced from approximately
130 seconds to 110 seconds for each intersection meaning that the wait time between the start and
finish of a green phase is lower. Reducing the cycle time is becoming more common place for
corridor demand management in congested environments, and also provides a better outcome for
pedestrian and cycle accessibility.
As stated previously, a limitation of the Victorian Mesoscopic Model, which was the model used to
understand the operational performance of the corridor, is that it did not separate public transport
vehicles in its reporting. In order to understand in more detail the benefits that the options would
provide both passenger vehicles and public transport I have obtained the SIDRA outputs from Arup.
It is important to recognise that a limitation of SIDRA is that it is not able to model upstream and
downstream flow as an isolated intersection tool, and its application in this instance should be to
compare options against one another rather than as a combined outcome. I also note that this
does not represent travel time or delay, as whilst they are comparable, they should be looked at as
a system rather than individually.
A summary of Arup the northbound and southbound SIDRA 95%ile queue lengths anticipated on
Punt Road for key intersections is provided in Figures 4.1 and 4.2.
16M1576000 // 02/02/2016
Traffic and Transport Evidence // Issue: Final
16 Punt Road Public Acquisition OverlayFigure 4.1: Arup SIDRA Assessment: Anticipated Northbound Queue lengths on Punt Road (AM and PM
Peak)
Figure 4.2: Arup SIDRA Assessment: Anticipated Southbound Queue lengths on Punt Road (AM and PM
Peak)
It is assumed that results for Options 5 and 6 would be the same as each other as the intersection
treatments are identical. Further, public transport queues in all options excluding 7 would be the
same as the general traffic queues due to the fact that they share the same road space as one
another.
By undertaking a comparison between the queues presented in Figures 4.1 and 4.2, the ‘bus lanes’
and ‘general traffic lanes’ indicated that Option 7 buses will experience substantially lower queuing.
In some instances, the introduction on bus lanes will mean that buses would sit in total queues up to
1.2km less than if they were not introduced. By virtue of their own lane, the resultant lower travel
16M1576000 // 02/02/2016
Traffic and Transport Evidence // Issue: Final
17 Punt Road Public Acquisition Overlaytime and delays are and will be substantial when considering the role that the bus lanes will play on
the movement of people.
It is also noted that overall queuing for general traffic will generally be comparable or better than
the ‘2031 Do Nothing’ scenario. Whilst queueing would be similar, the level of throughput on the
corridor is substantially more (approximately 50% increase) in Options 5, 6 and 7.
4.3.2 East West
By virtue of the lower cycle times, east west routes would be expected to improve as they also have
the benefit of less wait time between cycles. In addition, the removal of some of the right turn
movements have resulted in minimal obstructions to trams which are often delayed by right turning
vehicles.
The approach delays for the tram lanes have also been extracted from the SIDRA results provided to
represent in more detail the benefits expected to east west public transport services. Figure 4.3 and
Figure 4.4 show the total delay experienced for westbound and eastbound tram lanes, noting that
Option 5 results are the same as Option 6 from a SIDRA perspective.
Figure 4.3: Arup SIDRA Assessment: Delays for Westbound through Movements (AM and PM peak)
16M1576000 // 02/02/2016
Traffic and Transport Evidence // Issue: Final
18 Punt Road Public Acquisition OverlayFigure 4.4: Arup SIDRA Assessment: Delays for Eastbound through Movements (AM and PM peak)
The results show that for Options 2, 5 and 7, improvements in delays for both eastbound and
westbound movements will be realised when compared to both the existing situation and the ‘Do
Nothing’ in 2031. These outcomes indicate that trams on the east west routes would benefit from the
introductions of the options and the resultant outcome would be a more reliable and attractive
services.
Further discussion on these benefits is provided in the following section.
4.4 Public Transport
4.4.1 Current Usage of Punt Road Public Transport
Route 246 is a bus service which operates on Punt Road which is part of a strategic and important
service connecting Elsternwick Station to Clifton Hill bus and tram interchange. Its context in relation
to Punt Road and the wider network is shown in Appendix B. Information provided from PTV indicate
that there were just over 1.5 million passenger boarding’s in the last financial year (2014/15), making
it the ninth busiest bus route in Victoria. Surveys obtained from PTV in relation to customer trip
purpose have indicated that 57% of trips are work related and 23% educational, as reproduced in
Figure 4.5.
16M1576000 // 02/02/2016
Traffic and Transport Evidence // Issue: Final
19 Punt Road Public Acquisition OverlayFigure 4.5: Route 246 Customer Journey Purpose (Source: PTV)
The service provides connections to 10 train lines at Clifton Hill, Richmond and Elsternwick stations as
well as 15 crossing tram routes and 27 bus routes. In addition to the journey purpose, the connections
from and to other modes has been provided by PTV, which is also reproduced in Figure 4.6.
Figure 4.6: Route 246 Customer Access and Egress Modes (Source: PTV)
26% of Route 246 users transferred from or onto another form of public transport as part of
completing their journey highlighting the importance of the connections that the route provides to
other models.
As it relates to Punt Road, 72% of patrons accessing the route do so by the walking. This suggests
that the catchment of the bus route is that of a walk up function whether it be from a person’s home
or to a place of employment, further highlighting its role in serving the local community.
4.4.2 Forecast Patronage Growth
Public Transport Victoria and ARUP have provided information on the patronage forecasts for the
corridor based on outputs from strategic modelling undertaken in VITM. I have assessed the
expectant growth by taking a screenline of north south movement immediately south of Toorak
Road and a screenline of east west movement immediately west of Punt Road, which is summarised
in Table 4.2 and Table 4.3.
16M1576000 // 02/02/2016
Traffic and Transport Evidence // Issue: Final
20 Punt Road Public Acquisition OverlayTable 4.2: Arup VITM Estimated PT Demands by Link (North-South Movements)
Arup Options (2031)
Location 2013
Do Nothing Options 1-3 Option 5 & 6 Option 7
Bus
Punt Road – South of Toorak Road 3680 5080 8.5% 22.4% 22.4%
St Kilda Road – South of Toorak Road 2250 2130 -0.5% 3.2% 3.2%
Sub-Total 5930 7210 5.8% 16.8% 16.8%
Tram
St Kilda Road – South of Toorak Road 16420 34130 0.9% -0.6% -0.6%
Chapel Street – South of Toorak Road 3180 5480 3.5% 7.1% 7.1%
Sub-Total 19600 39610 1.2% 0.5% 0.5%
Total 25530 46820 1.9% 3.0% 3.0%
* Based on VITM outputs provided by PTV/Arup
* Option increases are those increases or decreases against the ‘Do Nothing’ Option
The outputs show that bus patronage is expected to increase by almost 22% and that tram
patronage on St Kilda Road is anticipated to more than double the current patronage. It is noted
that the bus patronage is the resultant of one bus route whereas the tram patronage is a multiple of
three tram routes, all operating at high frequencies than existing.
Extrapolated annually, the forecasts suggest that patronage on Route 246 would carry between 2.1
and 2.5 million passengers by 2031.
Table 4.3: Arup VITM Estimated PT Demands by Link (East-West Movements)
Arup Options (2031)
Location 2013
Do Nothing Options 1-3 Option 5 & 6 Option 7
Bus
Commercial Road, west of Punt Road 2040 1500 -0.7% 2.0% 2.0%
Tram
Toorak Road, west of Punt 6580 11580 -0.2% 0.3% 0.3%
Commercial Road, west of Punt 5840 10670 -1.0% -3.2% -3.2%
High Street, west of Punt 5520 10920 -0.1% -0.3% -0.3%
Sub-Total 17940 33170 -0.4% -0.9% -0.9%
Total 19980 34670 -0.4% -0.9% -0.9%
* Based on VITM outputs provided by PTV/Arup
* Option increases are those increases or decreases against the ‘Do Nothing’ Option
The east west tram routes crossing Punt Road show patronage increases of almost 80% when
compared to 2013. The modelled patronage forecasts show a decrease in usage of Commercial
Road buses, which can be attributed to some passengers switching to tram (as reflected in the
growth in tram usage) from bus and assumed modelled changes in service levels of Route 220, 219
and 216. In all options the east west demands demonstrate little variation from one another,
suggesting that the patronage is an outcome of more of a localised growth and demand, rather
than network capacity.
The larger increase in tram versus bus is expected due to a range of reasons, including the current
preference to use tram when users are faced with a choice and that road priority treatments
assumed in the model are focussed on tram and as such are not subject to their low speed
environments, as well as the increased congestion on the road network. This connotation is
supported by recent information obtained from PTV in relation to the patronage response to
corridors within Melbourne that have been implemented with improved on road priority amongst
other initiatives which is reproduced in Figure 4.7.
16M1576000 // 02/02/2016
Traffic and Transport Evidence // Issue: Final
21 Punt Road Public Acquisition OverlayFigure 4.7: Percent Increase in patronage by Bus Route (Source: PTV)
These real examples demonstrate that increases of up to 70 per cent were achieved within two
years after the introduction of bus lanes and resultant reliability. These figures suggest that higher
increases in public transport patronage would be likely with the introduction of dedicated bus lanes
and reliability on Punt Road.
4.4.3 Headway / Frequency
Headway is defined as the time from one vehicle to next, is often considered as the frequency of the
service, and in this instance it is expressed in minutes. A "shorter" headway signifies a more frequent
service. Modelled headways were also provided from PTV and Arup which are the headways input
into the state operated version of VITM. The 2011 headways are representative of current conditions
whilst the 2031 headways are those used in the Do Nothing and Option runs. These are reproduced
in Table 4.4.
16M1576000 // 02/02/2016
Traffic and Transport Evidence // Issue: Final
22 Punt Road Public Acquisition OverlayTable 4.4: Arup VITM two Hour Headways by Tram Route
8 (55 in future) 72 6 78 246 (Bus)
Year Period
Inbound Outbound Inbound Outbound Inbound Outbound Inbound Outbound Inbound Outbound
AM 7 8 12 11 10 10 12 11 10 9.2
Inter
11 11 12 12 12 11 12 12 10.2 10
Peak
2011
PM 9 8 11 10 10 10 12 12 10 10.6
Off
11 11 12 12 12 11 30 30 19.1 19.1
Peak
AM 5 5 5 5 6 6 10 10 5 5
Inter
10 10 10 10 10 10 10 10 10 10
Peak
2031
PM 5 5 5 5 6 6 10 10 5 5
Off
10 10 10 10 10 10 10 10 10 10
Peak
*Inbound Denotes Towards City from Punt Road
All of the tram services within the model used for the analysis are expected to operate at lower
frequencies in 2031. Headways on Route 246 are expected to halve to five minute frequencies,
however PTV have advised that it is possible that lower frequencies could be provided should an
increase in capacity be warranted (in addition to larger vehicle sizes).
Commentary on Public Transport
Regardless of the outcome of the preferred and constructed option of Punt Road, the information
suggest that public transport patronage will increase substantially by 2031. This outcome is not
uncommon with forecasts for the remainder of Melbourne as population is forecast to exceed 6
million by 2031 and 8 million by 2050. Punt Road itself will experience an increase in patronage and
its importance in providing connections to places of work and connections to other transport modes
will be critical.
As it stands, travel times are variable and long delays occur, as buses are required to share road
space with other vehicles. Travel times on Punt Road will continue to decrease without
improvements adding further delays to the bus travel times.
Studies have shown that improvements to delays by as little as 3.5 minutes6 provide an improved
attractiveness and response to patronage. Options 2, 5 and 6 provide increased throughput and
better reliability for travel times, whilst dedicated bus lanes in Option 7 provide superior outcome for
public transport and its patrons.
Similarly to reduced delay, increasing travel speed and reliability lead to increase patronage.
Recent studies have identified that a 10% travel time savings typically increases patronage by 4-6%.
This suggests that typical bus lanes that reduce total door-to-door travel times will by themselves
increase peak patronage. Larger gains are possible if bus lanes are implemented in conjunction
with other policies. Currie and Sarvi (2012) also used Melbourne data to model the patronage
increases and car travel reductions provided by public transport travel time savings. The study found
significant vehicle on road travel reductions as a result of modest time savings to public transport.
The benefits to east west movement and public transport cannot be understated. With patronage
demands anticipated to increase by up to 80%, an improved level of service must be provided than
the current situation. Each of the options show improvements for east and westbound travel across
Punt Road, providing not only a better level of service but increases in reliability.
6 Currie G and Sarvi M (2012) ‘A New Model for the Secondary Benefits of Transit Priority’ TRANSPORTATION RESEARCH RECORD No. 2276,
Journal of the Transportation Research Board pp 63–71
16M1576000 // 02/02/2016
Traffic and Transport Evidence // Issue: Final
23 Punt Road Public Acquisition OverlayYou can also read