Study on the integration of inland waterway transport in the European transport logistics chain from a regulatory, funding and transport economics ...
←
→
Page content transcription
If your browser does not render page correctly, please read the page content below
Study on the integration of inland
waterway transport in the European
  transport logistics chain from a
 regulatory, funding and transport
      economics perspective
Executive Summary
The study that follows was undertaken in the framework of the cooperation between the European
Commission and the CCNR. It provides an analysis of the integration of inland waterway transport in
the European transport logistics chain from a regulatory, funding and transport economics
perspective is undertaken.
After reminding the objectives set out in the 2011 White Paper on Transport in terms of reduction of
greenhouse gases and pollutant emissions as well as modal shift from road freight to other modes
such as waterborne and rail transport, this study focuses on some initiatives that have been
undertaken so far to reach such objectives. For this purpose, the regulatory environment aiming at
boosting the integration of IWT in the EU transport system and strengthening multimodality at EU
and national levels is looked at. Recent initiatives, such as the revision of the combined transport
directive (still under negotiations), can represent an opportunity for inland waterway transport to
unleash its modal shift potential. State aid can also play an important role as a driver to improve
multimodality, as illustrated by recent cases and the revision of the General Block Exemption
Regulation which provides clarity on the type of support measures encouraging modal shift falling
outside the scope of EU state aid control. The role played by the Connecting Europe Facility (CEF)
programme for this purpose is also highlighted. While multimodal transport has benefited the least
from the CEF programme in terms of co-funding, quite a good number of multimodal projects
(approximately 11% of the total number of projects co-funded) has benefitted from the support of
CEF.
In order to better understand where inland waterway transport lies within the multimodal transport
chain, an in-depth analysis of modal split evolution per good segments is carried out, which allows
drawing first conclusions in terms of detailed modal shift evolutions in Europe. It is observed that the
modal split tendency for chemicals, petroleum products and containers is rather positive, meaning
that inland shipping is rather successful in conquering new market shares within the liquid cargo and
the container segments. Chemicals can be regarded as the market segment with the most positive
modal split trend for inland shipping in EU countries, at least since 2008.
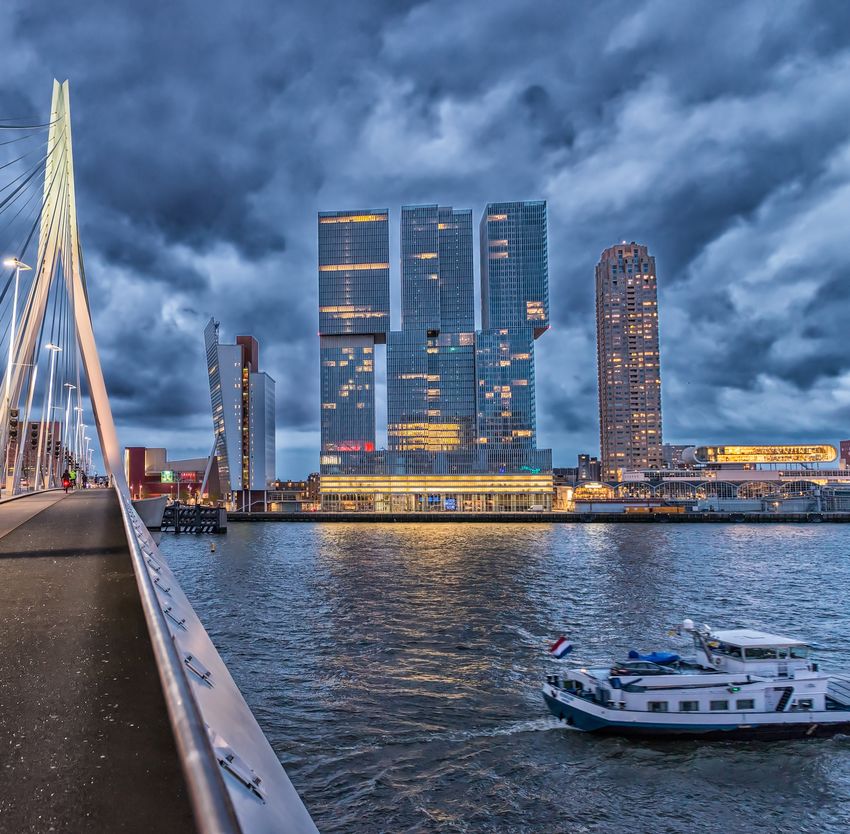
An investigation into seaport hinterland traffic by region and market shares of IWT is also provided,
aiming at understanding further where inland shipping stands in the current multimodal
environment. The results of this hinterland traffic (by rail and/or by inland shipping) analysis shows
that the western seaports (Antwerp, Rotterdam, Amsterdam) have a high market share in hinterland
transport from and to the western and south-western federal states in Germany, as well as from and
to Switzerland. At the same time, inland shipping has a high share within this hinterland transport
between these regions and the seaports of Antwerp, Rotterdam and Amsterdam. For the Northern,
Eastern and South-Eastern German federal states, as well as for Austria and the Czech Republic, the
picture looks different. Hinterland transport between these regions/countries and the seaports are
much more focussed on rail transport, and hereby, the seaport of Hamburg acts as the major port of
destination and origin for the cargo transport.
Eventually, several case studies are being looked at.
2
The specific case of Rastatt has been chosen to illustrate that multimodality can be seen as a risk
reduction option for passengers, manufacturers and industry in case of disruption. Indeed, during the
closure of the small stretch of the railway line in Rastatt for several months (from 12 August to 2
October 2017), a large part of the added value in the rail-based supply chain was lost and less than
40% of the capacity of the rail diversion routes could be used. The role played by alternative modes,
especially inland waterways, was therefore key to prevent total blockage of traffic and mitigate the
negative impact of the disruption. Moreover, figures relating to the impact of Rastatt on inland
waterway traffic and on inland ports highlight the capacity of inland waterways on the Rhine to
absorb new and unexpected traffic. Overall, the Rastatt incident had rather positive effects,
sometimes long-lasting, on inland waterway transport and the traffic at inland ports, such as for the
Swiss Rhine ports of Basel, where waterside container traffic was boosted in the 1st half year 2018 by
a plus of around 10 %.

Successful multimodal projects/strategies which could serve as best practices for a better integration
of inland waterway transport in the logistics chain are also identified.

The first example relates to the successful strategy set up by the Port of Liège to enhance its
multimodal dimension, which has allowed putting inland waterway transport in top position before
road and rail since 1939. Data also show a positive modal split evolution for IWT between 2015 (74%)
and 2017 (76%). In terms of tonnes of goods handled at the Port of Liège, IWT has been following a
positive trend since 2013. This is also true for container transport.

The second case study is about the new entity formed by the cross-border merger between Zeeland
Seaports in the Netherlands and Ghent Port Company in Belgium in December 2017, North Sea Port.
While it is too early to draw final conclusions as to the impact of the merger, for both maritime traffic
and inland navigation, pre-merger ports together showed a positive growth in 2017 and North Sea
Port started the year 2018 with record figures for both maritime traffic and inland navigation. In a
few years’ time, it will be interesting to analyse whether the strong economic developments which
the North Sea Port is expected to create for the region have materialised.

                                                   3
Introduction
The 2011 White Paper on Transport 1 showed that the transport sector faces significant challenges, in
particular in terms of the need to cut greenhouse gases and pollutant emissions. The objective set
was ambitious: to achieve a “60% CO2 reduction target by 2050” relative to 1990. For this purpose,
the paper sets the objective of shifting “30% of road freight over 300 km […] to other modes such as
rail or waterborne transport by 2030, and more than 50% by 2050”. Another objective is that “[…] all
core seaports are sufficiently connected to the rail freight and, where possible, inland waterway
system” by 2050.
However, in terms of modal shift for freight transport in the European Union (EU), the road still
reigns supreme before rail and inland waterways. Indeed, the modal share of rail decreased between
2011 and 2016, while the modal share of inland waterways has been fluctuating between 6% and 7%
since 2007. The share of rail and inland waterways in 2016 was lower than in most preceding years.
Modal split of freight transport (in %) 2007-2017*
100
90
80
70
60 75,5 75,5 77 75,7 75,1 74,7 74,9 74,9 75,3 76,4 78,6
Roads
50
Inland Waterways
40 Railways
30
20 6,3 6,4 6,2 6,9 6,3 6,8 6,9 6,7 6,5 6,2 6,1
10 18,2 18,1 16,9 17,4 18,7 18,5 18,2 18,4 18,3 17,4 15,3
0
2007 2008 2009 2010 2011 2012 2013 2014 2015 2016 2017
Source: Eurostat [iww_go_atygo], [road_go_ta_tg], [rail_go_grpgood] *For 2017, partly estimated
due to some missing data at national level.
Between 2011 and 2016, the share of rail and inland waterways in total freight transport declined in
the EU. Such a decrease is particularly striking in some Member States such as Estonia and Lithuania.
In 2016, the combined share of rail and inland waterways in total freight transport exceeded 50% in
four Member States, including one Rhine state only, the Netherlands.
1
WHITE PAPER Roadmap to a Single European Transport Area – Towards a competitive and resource efficient transport
system /* COM/2011/0144 final */ : https://eur-lex.europa.eu/legal-content/EN/ALL/?uri=CELEX:52011DC0144
4Share of rail and inland waterways activity in total freight transport by country 2011 and 2016 (in
%)*
90
80
70
60
50
40
30
20
10
0
EU (28)
Greece
Poland
Norway
Croatia
Germany
France
United Kingdom
Italy
Ireland
Lithuania
Slovakia
Slovenia
Czech Republic
Portugal
Latvia
Estonia
Romania
Netherlands
Bulgaria
Sweden
Finland
Belgium
Luxembourg
Denmark
Spain
Hungary
Austria
Switzerland
2011 2016
Source: Eurostat, CCNR Analysis [sdg_09_60] * Malta and Cyprus excluded
Multimodality strategies can however be a driver for reaching the objectives set in this 2011 White
paper on transport. This has been reaffirmed in the European Commission’s strategy for low-
emissions mobility 2: “measures to support multimodal integration have an important role in
achieving low emissions mobility by incentivising a shift towards lower emission transport modes such
as inland waterways, short-sea shipping and rail.” In order to underline the added value of
multimodal strategies and place multimodality in the spotlight, it was decided that 2018 would be
the year of multimodality, a year synonymous of initiatives taken to strengthen multimodality and
integration of all transport modes within the EU transport system. This report comes under this
initiative.
The report will first provide some elements about the current regulatory environment, which
appears to be favourable to a greater integration of inland waterway transport (IWT) in the EU
transport system. Secondly, a statistical view of modal split figures per country, goods segment,
seaport hinterland traffic by region and market shares of IWT will be provided. Thirdly, the report will
analyse how multimodality can play an important role in case of disruption of one mode of transport,
as well as the impact of the Rastatt incident on IWT and inland ports. Finally, the report will present
two case studies regarding the successful implementation of multimodal strategies: the port of Liège
and the North Sea Port.
2
Communication from the European Commission “A European Strategy for Low-Emission Mobility”: https://eur-
lex.europa.eu/legal-content/EN/TXT/?uri=CELEX%3A52016DC0501
51 | Inland navigation context
A positive regulatory
1. environment to boost the
integration of IWT in the
EU transport system
Port de Strasbourg
© Upper Rhine Ports 2I. Initiatives in favour of strengthening multimodality at EU and national levels
i. Added value of the Combined Transport Directive
Decarbonisation of the EU transport system has been on the agenda of the European Commission
and has gained momentum for several years. Inland waterways’ potential is also acknowledged in the
2011 White Paper on transport “Inland waterways, where unused potential exists, have to play an
increasing role in particular in moving goods to the hinterland and in linking the European seas.” 3
Moreover, the European Parliament has also been calling on the European Commission to take
actions to increase multimodal transport and has underlined the added value of inland waterways,
particularly in its recent report “Logistics in the EU and multimodal transport in the new TEN-T
corridors” adopted on 19 January 2017 4. In this report, the European Parliament stresses “the need
to concentrate major efforts on […] the strengthening of inland waterways as a priority for the EU’s
sustainable transport strategy”. Similar to the above-mentioned White Paper, it also highlights the
potential of IWT in terms of modal shift and notes “that inland waterways must play an increasing
role in serving seaports as well as logistics centres”.
The “Europe on the Move” initiative composed of three packages presented in May 2017, November
2017 and May 2018, includes several actions to modernise the EU transport system. As part of this
initiative, a key proposal to promote multimodal transport, relevant to IWT, was published on 10
November 2017 and consists of a proposal to review the “Directive 92/106/EC on the establishment
of common rules for certain types of combined transport of goods between Member States” (“the
Combined Transport Directive”). This Directive is known as the only legal instrument at EU level
which directly incentivises the shift of long-distance transport away from road to lower emission
transport modes (rail, inland waterways, maritime transport).
This proposal therefore represents a key opportunity for inland waterways in particular, as it aims
inter alia at strengthening support measures in favour of combined transport.
First, the European Commission proposes to modify the definition of a combined transport extending
eligibility to a wider range of intermodal operations. For inland waterways in particular, the current
minimum distance of 100km of the non-road leg excludes a number of operations around ports and
in and around agglomerations. The European Commission is proposing to delete this minimum
distance limitation. This proposal finds its rationale in the potential of such operations to contribute
to decongesting the road networks in sea ports and in the immediate hinterland and to reducing
environmental burdens in agglomerations.
Secondly, the European Commission seeks to improve the economic support measures. On one
hand, it is proposed to make it mandatory for Member States to encourage investment in combined
transport infrastructure, mainly investments into transhipment terminals along the transport
European core and comprehensive transport networks. On the other hand, it encourages Member
States to implement additional economic support measures to reduce the costs of combined
transport operations and make them more competitive compared with road-only operations. This
approach is supported by the results of two stakeholder consultations, revealing that 94% of
3
Paragraph 27 White Paper on Transport 2011
4
European Parliament report “Logistics in the EU and multimodal transport in the new TEN-T corridors”, Rapporteur Inès
Ayala Sander, 19 January 2017: http://www.europarl.europa.eu/sides/getDoc.do?type=TA&reference=P8-TA-2017-
0009&language=EN
7respondents wish the EU to continue supporting combined transport operations 5. Two categories of
incentives that could help the support of such operations were identified: investment incentives
and/or operational incentives. These two categories are mirrored in the European Commission’s
proposal to revise the existing combined transport directive.
The European Parliament’s Committee on Transport and Tourism 6 drafted the initial position of the
European Parliament. The report was adopted by the EP Plenary on September 12, 2018. The report
goes in the same direction as the European Commission and sometimes even further. For instance, it
is in favour of making it mandatory for Member States to take measures, by 31 December 2021,
whether they be economic or legislative, for improving the competitiveness of combined transport
operations and by providing at least one of the following: exempting hauliers from external-cost
charges and/or congestion charges; reimbursing charges for the use of certain infrastructure to
undertakings performing operations as part of a combined transport ; and exempting hauliers from
the limitations imposed under national traffic bans. A special emphasis is also put on the necessity to
strengthen the competitiveness of waterborne transport, including inland waterways.
Debates within the Council of the EU show that Member States are generally in favour of the
objectives of the Directive. However, as seen from the progress report adopted by ministers in June
2018, Member States’s proposed amendments would reduce the extension of eligibility proposed by
the Commission as well making encouragement of investments optional thereby depriving the
amendment from its most useful effect 7.
The draft proposal for a revision of the directive is still under negotiation between the EU legislators,
and the final result of such negotiations is therefore not yet known. Nevertheless, it is clear that the
revision of the Combined Transport Directive can be an opportunity for IWT and could support
unleashing its modal shift.
ii. The important role of State aid as a driver to improve multimodality
In addition to EU legislative initiatives, State aid decisions can play an important role in enhancing
multimodality and modal shift from road to inland navigation. A number of European Commission
decisions relating to national State aid schemes that aim at increasing modal shift to inland
navigation and rail, as well as supporting inland ports and combined transport infrastructure, have
been taken in the past few years.
Because the cost of combined transport is higher than single-mode transport (pure road transport in
particular), it lacks the ability to compete without public support. Indeed, the price of combined
transport operations is affected by, among others, the cost of transhipment, storage of containers
and terminal costs. To give an example, the share of terminal costs represents up to 20% of total
costs of intermodal transport, making combined transport comparatively expensive. 8 Public support
is therefore a key tool to allow combined transport competing with other modes. The European
5
Public consultation on Combined Transport Report on the contributions received:
https://ec.europa.eu/transport/sites/transport/files/media/consultations/doc/2014-combined-transport/summary.pdf
6
http://www.europarl.europa.eu/committees/en/TRAN/home.html
7
Council Progress report on the revision of the combined transport directive:
http://data.consilium.europa.eu/doc/document/ST-7864-2018-INIT/en/pdf
8
European Federation of Inland Ports Position on State Aid in the Inland Ports Sector:
https://havens.binnenvaart.nl/component/docman/doc_view/152-state-aid-position-efip?Itemid=
8Commission case practice shows that such aids are usually considered as compatible with EU State
aid law on the basis of article 93 of the Treaty on the Functioning of the European Union (TFEU) 9.
Recent State aid decisions can be used as examples to illustrate the European Union case practice in
the instance of aid schemes supporting modal shift to inland waterways.
The Czech aid for intermodal transport units 10 that provide for the purchase of transport
units dedicated for continental combined transport (combined transport operation that does
not connect to maritime transport (i.e. rail-road or inland waterway-road only)). The aim of
the measure is to shift consignments from direct road transport to continental combined
transport and to improve the competitiveness of intermodal transport services in the Czech
Republic.
The prolongation of the French aid scheme Plan d'Aide au Report Modal (PARM) aiming at
encouraging modal shift to inland waterways by reducing the costs of logistics chains,
including inland waterway transport. The aid will be granted in the form of subsidies to
inland waterway transport operators 11.
The German aid scheme on funding for transhipment facilities for combined transport of
non-federal companies 12. The objective of the scheme is to develop combined transport in
order to achieve a traffic shift of freight from road transport to other modes of transport,
including inland waterway transport. It subsidises the construction or extension of private
intermodal terminals.
Several examples also exist in the rail sector where such State aid measures can for instance consist
in direct grants to companies using rail services which commissioned multimodal transport and/or
transhipment services 13, including for the transport of intermodal container and single wagonload 14,
aid for the compensation of infrastructure charges and aid for the reduction of external costs 15.
The simplification of the rules and extension of the General Block Exemption Regulation to ports and
airports is also expected to have a positive impact on investments in inland ports, and therefore
possibly on hinterland traffic 16. Indeed, this regulation introduces a new exemption allowing Member
States to invest up to €50 million in inland ports without prior control under EU State aid rules by the
9
Article 93 TFEU “Aids shall be compatible with the Treaties if they meet the needs of coordination of transport or if they
represent reimbursement for the discharge of certain obligations inherent in the concept of a public service.”
10
State aid SA.49153 (2017/N) – Czech Republic – Aid for intermodal transport units, 15/05/2018:
http://ec.europa.eu/competition/state_aid/cases/271167/271167_1989527_132_3.pdf
11
SA.48332 PLAN D’AIDE AU REPORT MODAL (PARM), 29/05/2018:
http://ec.europa.eu/competition/elojade/isef/case_details.cfm?proc_code=3_SA_48332
12
SA.46341 Scheme on funding for transhipment facilities for combined transport of non-federal companies, 04/01/2017:
http://ec.europa.eu/competition/elojade/isef/case_details.cfm?proc_code=3_SA_46341
13
SA.44627 – Italy – ‘Ferrobonus’ - incentive for rail transport, 08/02/2017 :
http://ec.europa.eu/competition/state_aid/cases/264873/264873_1872028_67_2.pdf
14
SA.47109 (2017/N) – Belgique Régime de promotion du transport combiné ferroviaire (unités de transport intermodal) et
du trafic ferroviaire diffus, 06/06/2017 :
http://ec.europa.eu/competition/state_aid/cases/269032/269032_1926292_130_2.pdf
15
State aid SA.48390 – Austria Prolongation of aid scheme for transport of goods by rail in certain combined transport
services for 2018-2022, 25/10/2017:
http://ec.europa.eu/competition/state_aid/cases/269839/269839_1971628_105_5.pdf
SA.45482 (2016/N) – Italy – Rail freight transport support scheme, 08/02/2017:
http://ec.europa.eu/competition/state_aid/cases/265803/265803_1871682_140_2.pdf
16
Commission Regulation (EU) 2017/1084 of 14 June 2017 amending Regulation (EU) No 651/2014 [declaring certain
categories of aid are compatible with the internal market] as regards aid for port and airport infrastructure […]:
https://eur-lex.europa.eu/legal-content/EN/TXT/?qid=1497952641554&uri=CELEX:32017R1084
9European Commission, thereby leaving more room for manoeuvre to Member States and enhancing
legal certainty.
In addition to the revision of the General Block Exemption Regulation, the Notion of Aid Notice 17,
adopted in May 2016, provides clarity on the type of support measures falling outside the scope of
EU state aid control. Such measures are exempted from prior notification to the European
Commission before being implemented. For example, it confirms that “public investment for the
construction or upgrade of infrastructure is free of State aid if it does not directly compete with other
infrastructure of the same kind”. While this is typically the case for inland waterways networks, ports
infrastructure, on the contrary, are usually in competition with similar infrastructures. In the case of
port infrastructure, projects supported by public money may benefit from a selective advantage
compared to projects operating without public support. Such financing is therefore subject to prior
European Commission scrutiny under EU State aid rules. 18
iii. National strategies to support IWT and its integration in the multimodal logistic chains:
the case of Germany
In the case of Germany, despite its strong will to support alternatives to road transport and support
programmes at EU level, the German federal government was unable to reach the goal set in its 2002
sustainability strategy of significantly increasing the shares of rail and inland waterways in freight
transport expenditure by 2015 (rail: 25%, inland waterway: 14%), as shown in the table below. While
railways, after a positive development until 2007, have settled at around 17% for years, the share of
inland navigation fell continuously to just under 9% in 2016. In light of pressure put on public
expenditure, both objectives were no longer included in the latest update of the sustainability
strategy (Federal Government 2016 19).
17
Commission Notice on the notion of State aid as referred to in Article 107(1) of the Treaty on the Functioning of the
European Union, 19/07/2016: https://eur-lex.europa.eu/legal-
content/EN/TXT/?uri=uriserv:OJ.C_.2016.262.01.0001.01.ENG&toc=OJ:C:2016:262:TOC
18
European Commission press release, State aid: Commission clarifies scope of EU State aid rules to facilitate public
investment http://europa.eu/rapid/press-release_IP-16-1782_en.htm
19
German sustainable development strategy 2016 (in English)
https://www.bundesregierung.de/Content/EN/StatischeSeiten/Schwerpunkte/Nachhaltigkeit/Anlagen/2017-06-20-
langfassung-n-en.pdf?__blob=publicationFile&v=5
10Share of rail and inland waterway transport in freight transport expenditure in Germany (in %)
35
30
13,5 13,8 13,3 13,1
25 11,3 11,7 11,6 10,7 10,4 10,2 10 10,4 9 9,7 9,8 9,7 8,9 8,7
20
15
10 18,9 18,7 18,6 18,4 18,9 18,6
16,5 17,2 16,6 16,6 16,5 16,9 17,2 17,9 18,4 18,5 17,2 17,8
5
0
1999 2000 2001 2002 2003 2004 2005 2006 2007 2008 2009 2010 2011 2012 2013 2014 2015 2016
Rail freight transport Inland waterways transport
Sources: Umweltbundesamt, BMVI, Verkehr in Zahlen 2016/2017
The German government is however committed to supporting IWT and its integration in the
multimodal chain. Indeed, it is now working on a Master Plan for Inland Navigation, which was
agreed in the coalition agreement between CDU/CSU 20 and SPD 21, with first results expected for the
end of 2018 (“Masterplan Binnenschifffahrt”). Five working groups were created, including one on
the integration of IWT in the multimodal transport chain.
Previously, the updated Freight Transport and Logistics Action plan, dating back to 2016 22, was also
putting some emphasis on modal shift to inland waterways, through several measures such as the
implementation of a national Strategy for Sea and Inland Ports, the development of a strategy for
improving the interconnectivity and integration of the modes of transport and ensuring the
worthiness of road bridges, railway overpasses and locks etc.
Last but not least, the 2030 Federal Transport Infrastructure Plan" (FTIP 2030) adopted on 3 August
2016, contains all investment projects for the roads, railways and, for the first time, inland
waterways, which will need to be implemented, and additional investment needed to enhance the
transport network by 2030. 24 inland waterway projects with an overall financial volume of €6.5
billion were included in the requirement plan for the first time as "new projects of first priority". This
infrastructure plan will most certainly be used as guidelines for future investment and IWT strategy.
20
CDU/CSU is the centre-right Christian democratic political alliance of two political parties in Germany, the Christian
Democratic Union of Germany (CDU) and Christian Social Union in Bavaria (CSU).
21
The Social Democratic Party of Germany
22
https://www.bmvi.de/SharedDocs/EN/publications/freight-transport-logistics-action-plan.pdf?__blob=publicationFile
11II. Funding per transport modes : the important role played by the Connecting Europe Facility (CEF) programme
From 2014 onwards, the Connecting Europe Facility (CEF) programme has supported multimodal transport. Until October 2018, 72 multimodal projects
were co-financed under the framework of CEF, including 26 under the priority “multimodal logistics platform” (General and Cohesion envelopes) 23. Overall
€0.36 billion were invested in multimodal projects under CEF, amounting to approximately 1% of total CEF investment. The average co-funding under CEF
per multimodal projects is €4.6 million and €31.2 million per IWT project. So far, in terms of co-funding, multimodal transport has benefited the least from
CEF funding, however, quite a good number of multimodal projects (72 projects) have been supported by CEF (approximately 11% of the total number of
projects co-funded, before air and IWT).
CEF funding by transport mode in € Average funding for projects by Number of co-financed CEF projects
billion transport mode in € million
18,00 16,4 70,00
16,00 72
60,00 (11%)
14,00
50,00 91 253
12,00 Rail
(13,5%) (37,5%)
10,00 40,00 IWT
8,00 64,7 55 Road
30,00
(8%)
6,00 Air
20,00
4,00 31,2 55 Maritime
1,7 1,8 1,4 10,00 24,6 150
2,00 1,1 4,6 (8%)
0,4 12,1 11,7 (22%) Multimodal
0,00 0,00
Sources: CEF support to inland waterways (June 2018), proposal for the selection of CEF projects 2014-2017, overview of submitted proposals 2014-2017 and
CEF mid-term results
23
CEF mid-term results https://ec.europa.eu/inea/sites/inea/files/cef_implementation_brochure_web_final.pdf and CEF support to inland waterways, June 2018:
https://ec.europa.eu/transport/sites/transport/files/studies/2018-06-cef-support-to-inland-waterways.pdf
12In looking at the “multimodal logistics platform” priority in detail 24, it can be observed that this
priority was particularly attractive and successful in the first years of the CEF. This can be largely
explained by the budget available for this priority, which varied significantly between 2014 and 2017,
and the overall CEF budget. Indeed, total envelopes for the 2014 and 2015 calls (respectively €11.93
billion and €7.6 billion) were much higher compared to the envelopes of the 2016 and 2017 calls
(respectively €1.9 billion and €1.35 billion). The ratio in terms of project selected compared to
project proposed for this priority varies from 1/3 to 1/2.
Overview of projects under priority “multimodal logistics platform” (cohesion and general
envelopes)*
35
30 30
30
25
20
15
15
10
10
5 3 3 2
1 1 0
0
2014 2015 2016 2017 (1st) 2017 (2nd)
Number of multimodal projects co-financed Number of multimodal projects proposed
Sources: Proposal for the selection of CEF projects 2014-2017 and overview of submitted proposals
2014-2017
In terms of multimodal connections, co-funding under CEF has allowed:
the creation of four new connections between maritime ports and the rail network and one
new rail/road terminal;
to improve the connection of five maritime ports, five inland ports and six rail-road terminals
to the rail network.
Such investments represent €361.6 million in total, including €107 million granted through CEF. The
inland ports of Strasbourg, Lyon, Bremerhaven, Regensburg and Seville benefited from up to nearly
50% of this amount.
24
The number of projects falling under the priority “multimodal logistics platform” does not amount to the
total number of projects falling under the category “multimodal projects” described above.
13Number of new or improved multimodal connections to the rail network
10
9
8
7 4
1
6
5 New
4 Improved
3 6
5 5
2
1
0
Maritime ports to railway IWT to railway Rail/Road Terminal
Sources: Proposal for the selection of CEF projects 2014-2017 and overview of submitted proposals
2014-2017 and CEF mid-term results
Investment in improving inland port connections to the rail network (€ million)
180
Total eligible costs CEF co-funding
160 152,81
140
120
100,1
100
80
60 48,7
35,13
40
20,88 16,23
20 10,12 7,77 5,48 1,1
2,02 2,68
0
Total Strasbourg Lyon (works) Bremerhaven Regensburg Sevilla
investment (works) (mixed) (works) (works)
Sources: Proposal for the selection of CEF projects 2014-2017, overview of submitted proposals 2014-
2017 and CEF mid-term results
14The interconnection of transport modes is a serious obstacle to the development of multimodal
transport, which CEF seeks to address. This problem is highlighted in the TEN-T Coordinator, Paweł
Wojciechowski’s report on CEF support to the Rhine-Alpine Corridor 25, revealing that one of the
greatest challenges for existing multimodal terminals on this corridor lies in their access link with the
rail network. In light of the important role played by CEF to promote a better integrated transport
system, the European Parliament called on the European Commission, in its report on “Logistics in
the EU and multimodal transport in the new TEN-T corridors”, to give priority to the promotion of rail
connections with industrial plants and improved interconnectivity of rail with seaports, inland ports
and hinterland hubs in the 2017 review of CEF.
Despite the very limited envelope left under CEF, multimodality is not left out of the 2018 CEF
transport call, and projects aiming at connecting and developing multimodal logistic platforms are
eligible under this call. However, among inland ports, only core ones are eligible, and in line with the
last two calls, the funding envelope for this priority is rather low. It can be expected that only a
limited number of projects will be funded under this priority.
Multimodal transport and projects aiming at better integrating inland waterways and inland ports in
the EU transport system are expected to be supported under the next CEF programme (CEF II),
especially in light of the target set by the European Commission of 60% of the CEF II envelope
dedicated to climate objectives. The proposal for a regulation establishing a CEF II 26, presented by
the European Commission on 6 June 2018, is currently being negotiated by the EU legislators.
25
CEF support to Rhine-Alpine Corridor :
https://ec.europa.eu/inea/sites/inea/files/201803_corridor_report_rhinealpine_withcover.pdf
26
https://ec.europa.eu/commission/sites/beta-political/files/budget-may2018-cef-regulation_en.pdf
152 | Freight traffic evolution
Inland navigation and
2.
other modes of transport:
modal split evolution in
Europe and analysis of seaport
hinterland traffic
3I. Modal split per country and goods segment
The impact of initiatives to foster modal shift from road to less polluting modes such as railway or
inland waterway transport can be observed when analysing the modal split share evolution of IWT in
a given country or region. An in-depth analysis of modal split evolution per good segments allows the
drawing of first conclusions in terms of detailed modal shift evolutions in Europe (according to
regions and market segments). Such an analysis is carried out in the paragraphs below. N.B. The
modal split share evolution depicted in the graphs below refers to the share of inland waterway
transport performance in total (IWT + Road + Rail) transport performance.
Modal split share evolution in Rhine countries (%, based on transport performance)
45
40
35
30 Netherlands
25 Belgium
20 Germany
15 France
10 Luxemburg
5
0
2008 2009 2010 2011 2012 2013 2014 2015 2016 2017
Source: Eurostat [iww_go_atygo], [road_go_ta_tg], [rail_go_grpgood]
Modal split share evolution in Danube countries (%, based on transport performance)*
30
25
20 Romania
Bulgaria
15
Croatia
10 Austria
Hungary
5
0
2008 2009 2010 2011 2012 2013 2014 2015 2016 2017
Source: Eurostat [iww_go_atygo], [road_go_ta_tg], [rail_go_grpgood] *Data for Hungary, Croatia
and Bulgaria not yet available for 2017
17Overall modal split figures are in a certain fashion statistical averages. The underlying reasons for
modal share evolutions can only be revealed by going deeper into the intermodal data. The following
figures present the results of modal split calculations for eight European countries, which together
have a share of about 99% of the total transport performance on European inland waterways. For
some countries, data for the year 2017 were not yet available.
Modal split share evolution for agricultural products (%, based on transport performance)*
80
70
60
2008
50
40 2010
30 2012
20 2014
10
2016
0
2017
Source: Eurostat [iww_go_atygo], [road_go_ta_tg], [rail_go_grpgood], CCNR analysis *Data for
France, Hungary, Belgium and Bulgaria not yet available for 2017
The intermodal data for Romania reveals that IWT increased its transport performance for
agricultural products over the years but has nevertheless lost market shares against road and rail.
Most of the other countries show a relatively constant modal split share of inland navigation for this
product segment.
Modal split share evolution for food products (%, based on transport performance)*
18
16
14
12 2008
10 2010
8
6 2012
4 2014
2
0 2016
2017
Source: Eurostat [iww_go_atygo], [road_go_ta_tg], [rail_go_grpgood], CCNR analysis *Data for
Hungary, Croatia, Belgium and Bulgaria not yet available for 2017
18Food products are a segment with, on average, quite low IWT modal shares. This is due to the fact
that food products are often perishable goods, thus, long transport times cause major issues in terms
of quality and service. But not all parts of this segment are perishable. For non-perishable products,
such as rapeseed oil, inland shipping could gain further market shares in the future, as such products
have a mass cargo character and show a large potential as an energy resource. Besides, more urban
transport chains involving inland vessels could also be a potential for increasing the food products
that are transported on rivers.
For chemical products, the multimodal data show that IWT gained market shares. Detailed analysis
reveals that such an increase can be explained for different reasons.
Modal split share evolution for chemical products (%, based on transport performance)*
45
40
35
30 2008
25 2010
20
2012
15
2014
10
2016
5
0 2017
Source: Eurostat [iww_go_atygo], [road_go_ta_tg], [rail_go_grpgood], CCNR analysis *Data for
France, Hungary, Croatia, Bulgaria and Belgium not yet available for 2017
In Rhine countries, road transport for chemicals has been decreasing over several years with quite a
robust trend. For example, in Germany, transport of chemicals by road fell by 31% between 2008 and
2017, and rail transport by 15%. However, transport of chemicals on inland waterways increased by
3% over the same period. In Rhine countries, falling figures for road transport and partly for rail
transport can be explained by safety issues. Indeed, higher safety standards apply today to tanker
shipping, which is an advantage compared to other transport modes in this segment.
The Danube countries show different patterns. Here, road transport of chemicals follows a more or
less increasing trend. The national transport sectors of these countries are overall more orientated
towards road transport. Nevertheless, IWT has gained market shares for chemicals in Danube
countries because the performance of IWT has increased, while the market shares of rail transport
for chemicals mostly fell.
The next segment includes ores, sands, gravel and stones, and can be regarded as a “hybrid” product
segment, as it is related to quite different industrial activities: steel production on the one hand
(related to ores) and the construction activity (related to sands, stones, gravel) on the other hand.
19Overall, the results of the modal split calculations are, in this hybrid segment, quite difficult to
interpret. There are many different trends present, in two quite separated markets, which may be
overlapping or overlaying each other.
Modal split share evolution for ores, sands, stones, gravel (%, based on transport performance)*
80
70
60
2008
50
40 2010
30 2012
20 2014
10 2016
0
2017
Source: Eurostat [iww_go_atygo], [road_go_ta_tg], [rail_go_grpgood], CCNR analysis *Data for
France, Hungary, Croatia and Bulgaria not yet available for 2017
Metals and metal products are parts of a segment where road transport still has the highest modal
shares, although it has decreased since 2008, due to a reduction of absolute transport performance.
Rail and inland waterway transport of metals have both shown a rather stable evolution since 2008.
Due to the reduction of road transport, IWT could gain market shares in some countries.
Modal split share evolution for metals and metal products (%, based on transport performance)*
45
40
35
30 2008
25 2010
20
2012
15
2014
10
2016
5
2017
0
Source: Eurostat [iww_go_atygo], [road_go_ta_tg], [rail_go_grpgood], CCNR analysis *Data for
France, Hungary, Bulgaria and Belgium not yet available for 2017
20For the liquid cargo segment of petroleum products, very high market shares for IWT can be
observed in the Netherlands. Inland vessels carry around 90% of all petroleum products. This is even
more important, as this country is one of the largest producer countries for petroleum products in
Europe.
Europe’s largest refineries can be found in the Netherlands, in particular in the areas of large
seaports such as Rotterdam. According to Eurostat data, IWT’s modal share has increased even
further since 2010 in the Netherlands. In Belgium and Germany, which are also countries with a high
level of refinery production, the modal share of IWT is very high and slightly above 30%.
Modal split share evolution for petroleum products (%, based on transport performance)*
100
90
80
70
2008
60
50 2010
40 2012
30 2014
20
2016
10
0 2017
Source: Eurostat [iww_go_atygo], [road_go_ta_tg], [rail_go_grpgood], CCNR analysis *Data for
France, Hungary and Bulgaria not yet available for 2017
Around 99% of total container transport on European inland waterways takes place in Rhine
countries. Indeed, only four Member States have significant inland waterway container transport:
the Netherlands, Germany, Belgium and France 27. Therefore, the following analysis will focus on
these four countries. While the modal share of IWT in France and Germany is rather low and quite
constant, an upward trend can be observed – on a high level – in Belgium and the Netherlands.
The reasons are manifold: a dense and ever-growing network of intermodal container terminals, a
dense network of rivers and canals, densely populated urban areas with a high market potential for
container transport, and short distances to major seaports, are certainly the main reasons for the
success of inland waterway container transport in the Netherlands and in Belgium.
27
CCNR annual market observation report 2018: https://ccr-zkr.org/files/documents/om/om18_II_en.pdf
21IWT modal split share evolution for container transport (%, based on transport performance)
45
40
35 2008
30 2010
25
2012
20
2014
15
2016
10
5 2017
0
France Germany Belgium Netherlands
Source: Eurostat [iww_go_actygo], [road_go_ta_tcrg], [rail_go_contwgt], CCNR analysis
Data shows that the unitisation rates vary greatly across modes. Short sea shipping and rail transport
rates are indeed largely above the rates for freight transport by road and by inland waterways.
However, the unitisation rate of goods transported by inland waterways increased overall between
2007 and 2016. This is in line with the increasing trend observed in recent years for container traffic.
Share of containers in total goods transport by mode of transport 2007-2016 (% of total tkm)
20,00
18,00
16,00
14,00
12,00 Road freight
10,00 Rail freight
8,00 Inland waterways
6,00 Short sea shipping
4,00
2,00
0,00
2007 2008 2009 2010 2011 2012 2013 2014 2015 2016
Source: Eurostat [tran_im_umod]
For the container segment, it was decided to show not only the modal split evolution of IWT, but also
the evolution for the other two inland transport modes.
N.B. The evolution of modal share depicted in the graphs below refers to the percentage share of IWT
transport performance (tkm) for containers compared to total transport performance for containers
(IWT+rail+road).
22In the Netherlands, inland vessel container traffic has recently conquered market shares against road
transport. The modal share of IWT in the container segment is, with 40%, almost exactly as high as
for the overall IWT transport market in this country.
The Netherlands – evolution of modal share for road, IWT and rail within container transport (%)
70
60
50
40 Road
%
IWT
30
Rail
20
10
0
2008 2009 2010 2011 2012 2013 2014 2015 2016 2017
Source: Calculation CCNR based on Eurostat [iww_go_actygo], [road_go_ta_tcrg], [rail_go_contwgt]
Also for Belgium, the data show that inland vessels could gain market shares against road transport.
Belgium – evolution of modal share for road, rail and IWT within container transport (%)
60
50
40
Road
30
%
Rail
20 IWT
10
0
2008 2009 2010 2011 2012 2013 2014 2015 2016 2017
Source: Calculation CCNR based on Eurostat [iww_go_actygo], [road_go_ta_tcrg], [rail_go_contwgt]
In Germany, inland waterway transport of containers had a share of 8.5% in 2017, which is slightly
below the overall average modal share of IWT in this country. But the share has been following a
slight upward trend since 2008.
23Germany – evolution of modal share for road, rail and IWT within container transport (%)
60
50
40
Road
30
%
Rail
20 IWT
10
0
2008 2009 2010 2011 2012 2013 2014 2015 2016 2017
Source: Calculation CCNR based on Eurostat [iww_go_actygo], [road_go_ta_tcrg], [rail_go_contwgt]
In France, IWT’s share was 5.2% in 2017, and therefore slightly above the overall average modal
share of IWT in this country. Since 2008, the share has been quite stable.
France – evolution of modal share for road, rail and IWT within container transport (%)
60
50
40
Rail
30
Road
20 IWT
10
0
2008 2009 2010 2011 2012 2013 2014 2015 2016 2017
Source: Calculation CCNR based on Eurostat [iww_go_actygo], [road_go_ta_tcrg], [rail_go_contwgt]
Even if the Danube countries do not have significant container transport on inland waterways, it was
decided to depict the modal split evolution for Romania, the largest Danube country, in order to have
a general idea of the dominant mode in relation to container transport in this country. The results
show that rail transport was able to gain a substantial amount of market shares in the last 10 years,
to the detriment of road transport.
24Romania – evolution of modal share for road, rail and IWT within container transport (%)
100
90
80
70
60 Road
50
%
Rail
40
IWT
30
20
10
0
2008 2009 2010 2011 2012 2013 2014 2015 2016 2017
Source: Calculation CCNR based on Eurostat [iww_go_actygo], [road_go_ta_tcrg], [rail_go_contwgt]
If the modal split evolutions for the eight countries under study are summarised, the following matrix
table can be depicted. The modal split tendencies for inland shipping are expressed, in this table, by
simple arrows.
Modal Split Tendencies for inland navigation per country and per goods segment in Europe*
ORES &
AGRI FOOD CHEM PETRO METALS CONT TOTAL
SANDS
NL ↗ ↘ ↗ ↗ ↗ ↗ ↗ ↗
BEL ↗ ↗ → → → ↗ ↗ ↗
GER ↘ ↘ ↗ ↘ → → ↗ →
FRA → → ↗ ↗ → ↗ → →
HUN → → ↗ → ↘ ↘ → →
CRO → ↗ ↗ ↘ ↗ → → →
ROM ↘ ↗ ↗ ↗ ↗ → → ↘
BUL ↗ → ↗ ↘ ↗ → → ↘
Symbols: ↗ = rising modal split tendency; ↘ = falling modal split tendency; → = modal split is rather
stable
Source: Analysis CCNR based on Eurostat [iww_go_actygo], [road_go_ta_tcrg], [rail_go_contwgt],
[iww_go_actygo], [road_go_ta_tcrg], [rail_go_contwgt]
25A further summary of this table can be made by counting the number of countries for which a
positive, or a negative or a constant modal split trend is observed over time. This is done for each
product segment.
Modal Split Tendencies per goods segment in Europe*
↗ → ↘ Overall score
AGRI 3 3 2 1
FOOD 3 3 2 1
CHEM 7 1 0 7
ORES & SANDS 3 2 3 0
PETRO 4 3 1 3
METAL 3 4 1 2
CONT 3 5 0 3
* The numbers in the table indicate how often (in how many countries) there was a positive (↗), a
negative (↘), or a stable (→) modal split trend. The overall score is calculated by subtracting the
frequency for (↘) from the frequency for (↗), while (→) has a “weight” of zero.
It is observed that chemicals and petroleum products, but also containers, have a somewhat high
overall modal split score. This means that inland shipping is rather successful in conquering new
market shares within the liquid cargo and the container segments. Chemicals are, hereby, on top of
the list, and can be regarded as the market segment with the most positive modal split trend for
inland shipping, at least since 2008.
II. Investigation into seaport hinterland traffic by region and market shares of IWT
Seaport hinterland traffic is a very important part of international transport chains. It exists mainly as
long-distance transport by rail or inland waterway transport (export or import traffic).
The following figure shows the amount of seaport hinterland traffic per rail and per inland waterways
for Germany, Switzerland and Austria. A further distinction is made between ARA ports (Amsterdam,
Rotterdam and Antwerp) 28 and German seaports (Hamburg, Bremen, etc.)
28
Other Dutch or Belgian seaports do not play a significant role.
26Seaport hinterland traffic by rail and inland waterways for Germany, Switzerland and Austria
ARA ports German seaports
120
100
80
Mio. t
60
40
20
0
Imports from Exports to Seaports Imports from Exports to Seaports
Seaports by IWT by IWT Seaports by Rail by Rail
Source: CCNR analysis based on Destatis data
Import volumes passing to the hinterland are in general quite high, and the share of inland waterway
transport is relatively high. Imported goods are often commodities, such as iron ores, or coal, which
are imported in very large volumes, preferably by inland vessels. Export traffic is more concentrated
on finished products, with relatively less volume transported (higher value-volume relation).
Furthermore, the majority of inland waterway traffic in the hinterland is in fact related to ARA
seaports (Amsterdam, Rotterdam and Antwerp) and only a small part goes to or comes from German
seaports. This is due to the Rhine axis, which represents a very important hinterland axis for inland
waterway transport.
The following map presents the hinterland volumes in absolute numbers for each of the 16 federal
states in Germany, as well as for Austria and Switzerland. As it can be seen, the western states of
Germany are more orientated towards inland shipping, and also have higher overall figures in
hinterland transport, due to their higher population and industrial activity. North-Rhine-Westphalia,
the state with the highest population in Germany, has by far the highest amount of hinterland
transport of all German regions, with a value of 88 million tonnes altogether (rail + IWT).
27Seaport hinterland traffic by rail and inland waterways (IW) for German federal states, Austria,
Switzerland and the Czech Republic (in Mio. t)
Hinterland
1 traffic by rail
Hinterland
3
traffic by IW
2
1
1 2
2
2
10
14 3
10
5
13 9
74 4
6
4 1 0,2
4
DE
10 6
CZ
2
7
11
10 1
4
3 AT
CH
5
Source: CCNR Analysis based on Destatis
For each German state, for Austria, Switzerland and the Czech Republic, the percentage shares of
IWT and rail are depicted in the following map.
28Percentage share of inland waterway transport (blue) and railway transport (green) within total
seaport hinterland traffic per region in Germany (federal states), Austria, Switzerland and the
Czech Republic (in %) *
79
100
65
60
73
45
63
84 98
100
51 100
73 DE 96
CZ
87
73 60
77
AT
66
CH
Source: CCNR analysis based on Destatis data *Federal states/countries in blue are states where,
within seaport hinterland traffic, inland waterway transport has a higher volume than rail transport.
Federal states/countries in green are states where railway transport has a higher volume within
seaport hinterland traffic than IWT.
In parallel with the modal shares, certain maritime ports have a high market share within hinterland
traffic of certain regions. As the western or ARA seaports have a higher orientation towards inland
shipping, it is only logical that the hinterland transport of the western regions of Germany, which are
geographically near to the ARA ports and perfectly related to them via the Rhine, is predominantly
transport from and to the ARA ports. Indeed, the port of Rotterdam has the largest market shares for
North-Rhine Westphalia (68%), Rhineland-Palatinate (36%), Hesse (44%), Saarland (36%),
29Bade-Wurttemberg (36%) and Switzerland (53%). Behind Rotterdam, the port of Antwerp also plays a
major role for these regions.
The port of Hamburg, however, dominates the hinterland traffic in the northern and eastern states of
Germany, as well as in Bavaria, Austria and the Czech Republic. Other German seaports such as
Bremen and Rostock reach the highest market shares in the federal states of Bremen and
Mecklenburg-Western Pomerania respectively.
Market share of the dominant* seaport in total hinterland transport (IWT + rail) per region in
Germany (federal states), Austria, Switzerland and the Czech Republic (in %)
89
89
Red = seaport of Hamburg
60
34 Blue = seaport of Rotterdam
Green = seaport of Bremen
83 Yellow = seaport of Rostock
68
78 71
68
58
76
36
44
DE 68 CZ
40
35
35
39
AT
53 CH
Source: CCNR analysis based on Destatis data *Depicted is the market share for the most important
seaport for each region, in terms of volume of hinterland transport per IWT and rail taken together.
In those western federal states in Germany, where Rotterdam has the lead position, Antwerp is in
second place in every case. In the middle and upper Rhine state of Rhineland-Palatinate, the market
30share of Antwerp is, with 41%, even almost as high as the share of Rotterdam (44%). Again, in
Switzerland, the share of Antwerp is quite high, with 30%.
Share of seaports in hinterland traffic by region / country (in %) *
11% Red = seaport of Hamburg
Blue = seaport of Rotterdam
10% 1% Green = seaport of Antwerp
Yellow = seaport of Bremen
89%
Brown = seaport of Amsterdam
34 89% Grey = seaport of Rostock
11%
42 % 3% Violet = other seaports
3% 9%
% 9%
4%
24
% 11% 1% 1% 7%
2% 68%5% 82% 5% 3%
3% 3% 6%
8%
15%
11%
3% 78% 71%
13%
11% 5% 3% 4% 20%
68% 35%
16% 12% 22% 58%
3%
6%
17% 76% 9% 1%
6% 18%
11%
44%
13% DE 11%
CZ
9% 68%
41%
14% 3%
5%
73%
11% 7% 40%
35%
16% 14% 4%
17% 5%
25%
18%
39%
22%
3%
14% AT
30%
CH
53%
30%
Source: CCNR analysis based on Destatis data *Hinterland traffic by rail and IWT taken together
313 | Port transshipment
3. Lessons to be learnt from
disruptions of transport modes
4I. Vulnerability of one mode acting alone
The benefits of coordination and cooperation between modes should not be underestimated, as
these are crucial to ensure efficient and reliable logistics chains. This is even more visible in the case
of unexpected disruptions, the most recent example being the incident of Rastatt in August 2017.
Indeed, the collapse of a tunnel near the German town of Rastatt made rail traffic along the Rhine
axis impossible for several weeks.
Inland waterways are also subject to serious and unexpected disruptions such as low water levels
phenomena and strikes. For instance, in 2013, German passenger numbers suffered a fall for the
second consecutive year. This can be partly explained by the week-long strike by lock workers
resulting in a temporary immobilisation of the fleet and in considerable revenue losses by the
shipping companies. The Waldhof incident 29 in January 2011 also led to the Rhine being partially or
fully closed to vessel traffic for a 32-day period. BASF was among the first companies to acknowledge
logistical problems due to the disruption on the Rhine and quickly had to face shortages of certain
raw materials. However, since the Rhine-Alpine corridor allows for several high-capacity and
performant modes to run in parallel, BASF was able to move more goods by rail and road as an
alternative to IWT, hence mitigating the cost of this incident.
All such disruptions show that one mode acting alone is often vulnerable. Where the transport
system allows for several modes to run in parallel and which can enable alternative routing options in
case of disruption, significant damages can be avoided for passengers, manufacturers and industry.
This report will now focus on the specific case of Rastatt and its impacts on IWT traffic.
II. The specific case of Rastatt and positive impact for IWT traffic
The closure of the small stretch of railway line in Rastatt for several months (from 12 August to 2
October 2017) led to wide-reaching economic damage for the rail-based supply chain and industrial
companies. Indeed, less than 40% of the capacity of the rail diversion routes could be used. Thus,
during the interruption, a large part of the added value in the rail-based, often multimodal, supply
chain was lost. Losses resulting from the Rastatt incident rose to €771 million for manufacturing
industries.
29
Sinking of the 100-meter chemical tanker known as the “Waldhof”, between Koblenz and Mainz, carrying
2,400 tons of sulfuric acid in its tanks. To prevent that this highly corrosive liquid spills into the Rhine, river
authorities decided to close the waterway to traffic.
33You can also read