MICROWEAR AND ISOTOPIC ANALYSES ON CAVE BEAR REMAINS FROM TOLL CAVE REVEAL BOTH SHORT-TERM AND LONG- TERM DIETARY HABITS - MPG.PURE
←
→
Page content transcription
If your browser does not render page correctly, please read the page content below
www.nature.com/scientificreports

                        OPEN       Microwear and isotopic analyses on
                                   cave bear remains from Toll Cave
                                   reveal both short-term and long-
Received: 11 December 2018
Accepted: 26 March 2019            term dietary habits
Published: xx xx xxxx
                                   Iván Ramírez-Pedraza 1,2, Carlos Tornero1,2, Spyridoula Pappa3,4, Sahra Talamo5,
                                   Domingo C. Salazar-García5,6,7, Ruth Blasco 8, Jordi Rosell1,2 & Florent Rivals 1,2,9
                                   Dietary habits of the extinct Ursus spelaeus have always been a controversial topic in paleontological
                                   studies. In this work, we investigate carbon and nitrogen values in the bone collagen and dental
                                   microwear of U. spelaeus specimens recovered in Level 4 from Toll Cave (Moià, Catalonia, NE Iberian
                                   Peninsula). These remains have been dated to > 49,000 14C BP. The ability of both proxies to provide
                                   data on the diet of U. spelaeus at different times in the life-history (isotopes: average diet of life;
                                   microwear: last days/weeks before death), allows us to generate high-resolution and complementary
                                   data. Our results show lower values (δ13C & δ15N) in cave bears than in strict herbivores (i.e. Cervus
                                   elaphus) recovered from the same level of Toll Cave. On the other hand, 12 lower molars (m1) were
                                   analysed through low-magnification microwear technique. The cave bears from Toll Cave show a
                                   microwear pattern like that of extant bears with omnivorous and carnivorous diets. These data are
                                   discussed in the framework of all available data in Europe and add new information about the plasticity
                                   of the dietary habits of this species at the southern latitudes of Europe during Late Pleistocene periods.

                                   The rapid climatic fluctuations that took place during the late Pleistocene led to repeated changes in both the envi-
                                   ronment and the vegetal landscape. These variations generated modifications in the biogeographical distribution
                                   of mammals in Europe1–4. The large carnivores are of importance when it comes to understanding the magnitude
                                   of these climatic alternations, because they occupy a large space and are less linked to particular biotopes as the
                                   herbivores5,6.
                                       A paradigmatic example of this adaptive capacity is found in the cave bear (U. spelaeus), one of the most
                                   studied European members of the order Carnivora of the late Pleistocene. This species is a characteristic element
                                   of the last “Ice Age” and its remains have been found by the thousands in many European caves, such as the
                                   celebrated Drachenhöhle near Mixnitz in Styria (Austria)7. The geographical distribution of the cave bear group
                                   extends eastwards from northwest Spain across central Europe to the Urals, and from Belgium and the Harz
                                   region of Germany in the north to Italy and Greece in the south and to the Crimea in the southeast8. Among
                                   the key aspects related to the palaeoecology of this extinct animal are its feeding habits. Knowing the dietary
                                   habits of this species is essential for a better understanding of its durability and its biogeographical distribution
                                   across Europe. Such knowledge will allow us to go deeper into the factors that led to its extinction at the end of
                                   the late Pleistocene. Indeed, the topics of megafauna extinction during the late Pleistocene have been subject
                                   to intensive debates for decades and many of them are still valid today8–11. Some scientists have offered various

                                   1
                                    Institut Català de Paleoecologia Humana i Evolució Social (IPHES), Campus Sescelades URV (Edifici W3), 43007,
                                   Tarragona, Spain. 2Universitat Rovira i Virgili (URV), Àrea de Prehistoria, Avinguda de Catalunya 35, 43002,
                                   Tarragona, Spain. 3Department of Earth Sciences, Natural History Museum, Cromwell Road, London, SW7 5BD,
                                   United Kingdom. 4Department of Geography, Royal Holloway University of London, Egham, Surrey, TW20 0EX,
                                   United Kingdom. 5Department of Human Evolution, Max Planck Institute for Evolutionary Anthropology, Deutscher
                                   Platz 6, Leipzig, 04103, Germany. 6Department of Geological Sciences, University of Cape Town, Cape Town, South
                                   Africa. 7Grupo de Investigación en Prehistoria IT-622-13 (UPV-EHU)/IKERBASQUE-Basque Foundation for Science,
                                   Vitoria, Spain. 8Centro Nacional de Investigación sobre la Evolución Humana (CENIEH), Paseo Sierra de Atapuerca
                                   3, 09002, Burgos, Spain. 9ICREA, Pg. Lluís Companys 23, 08010, Barcelona, Spain. Correspondence and requests for
                                   materials should be addressed to I.R.-P. (email: ivan680@msn.com)

        Scientific Reports |   (2019) 9:5716 | https://doi.org/10.1038/s41598-019-42152-7                                                             1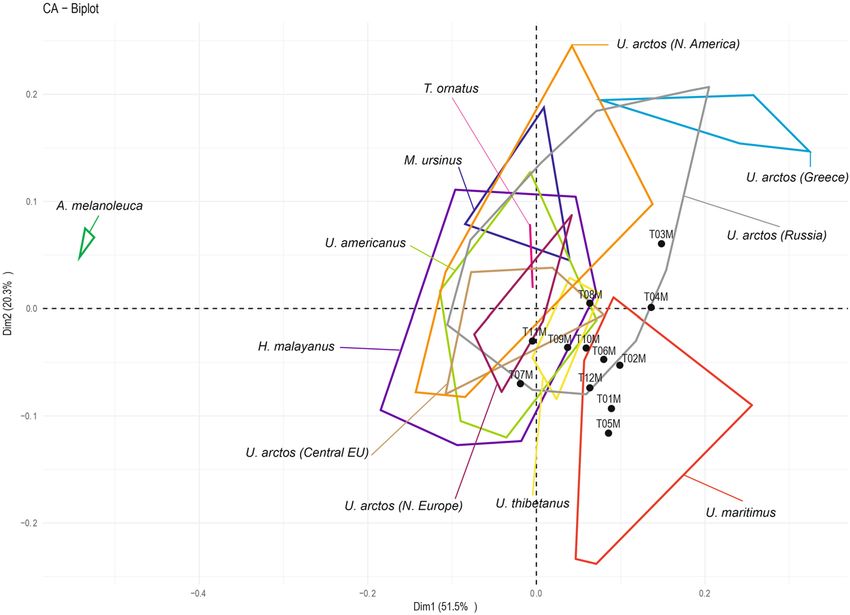
www.nature.com/scientificreports/                                                               www.nature.com/scientificreports

                           hypotheses as to why there are important accumulations of this species in caves, one of which points to human
                           activity: most notably, the cave bear was intensively hunted and may have been included in different rituals and
                           cults12. However, other authors did not find clear evidence of these activities once the taphonomic origins of nat-
                           ural mass accumulations of this animal in caves were analysed13–15. In addition, investigations in several Alpine
                           cave sites reported that cave bears and humans used particular caves at different times14,15. At present, there is
                           still an important debate about the causes that could lead to the extinction of this species and about the possible
                           role that human pressure or climatic changes could have played in this process16–18. Many authors suggested that
                           the accumulations of U. spelaeus skeletal remains in caves are due to natural death of individuals, because they
                           did not overcome the hibernation process, although the rate and timing of these accumulations remains poorly
                           understood19–23. Something that also needs to be considered is that the disappearance of the cave bear from
                           central Europe coincides fairly closely with the cooling climate and vegetation changes around the Last Glacial
                           Maximum (LGM)8. Furthermore, as with all large animals, they existed in smaller populations than did small
                           mammals and had a much slower reproduction rate, factors that counted against them24. Although interpreting
                           the feeding ecology of Ursidae can be complex and difficult, nowadays it is possible to make inferences about cave
                           bear feeding habits with the availability of innovative methods such as dental microwear and isotopic analyses.
                               The microwear studies allow us to explore the paleodiet of species and to reveal information about palaeoen-
                           vironmental changes25–29. In the Ursidae, this proxy began to be used relatively recently, using different meth-
                           ods30–39. Pinto-Lona31,33 compared the occlusal microwear and macrowear between U. spelaeus and U. arctos.
                           They indicated that cave bears had a greater degree of bone consumption than did brown bears. Münzel et al.35
                           concluded that the predominance of pits over scratches is a typical pattern in herbivorous bears. On the other
                           hand, Peigné et al.32 proposed a mixed diet for U. spelaeus and Jones and DeSantis36 suggested that U. spelaeus
                           consumed a diet with a diversity of textural properties similar to most other bears and only distinguishable from
                           the hyper-carnivorous polar bear (Ursus maritimus). Medin et al.37 suggested that the early Pleistocene Ursus
                           etruscus bears from southern Spain were omnivorous with some consuming a significant amount of fish. Peigné
                           and Merceron38 applied Dental Microwear Texture Analysis (DMTA) on cave bears from Belgium and their main
                           conclusion was that, during the pre-dormancy period, these bears showed dietary flexibility and, most probably,
                           excluded hard and brittle foods from their diet. Finally, more recently Pappa et al.39 developed a new comprehen-
                           sive database of dental microwear features for extant Ursidae. The authors also proved that is possible to observe
                           a differentiation of ecospaces within modern bear populations from different geographical regions. They then
                           used this database to interpret the paleodiet in U. arctos from the late Middle Pleistocene site Grays Thurrock,
                           U.K. This site demonstrated that these bears consumed mainly fibrous, soft food and invertebrates and a small
                           vertebrate components.
                               Another useful technique is the analysis of stable isotopes. The publications made in this field concerning
                           the feeding habits of the U. spelaeus show homogeneity in values, with results similar or inferior to those of
                           contemporary herbivores of the same archaeological level. The low values of δ15N are purportedly linked to a
                           predominantly vegetarian diet40–55. Conversely, Richards et al.56 and Robu et al.57,58 in Peştera cu Oase (Romania)
                           show values of δ15N of the U. spelaeus that place it at the same level as contemporary carnivores, suggesting an
                           omnivorous diet for this species. It is worth mentioning that decreasing δ15N values can result not only from
                           reduced consumption of animal protein in the diet but also from variations in soil δ15N values due to climatic
                           conditions linked with vegetation cover50,59 or by a higher amount of nitrogen-fixing plants in the animal’s diet.
                           According to Fernández-Mosquera et al.53, δ15N values in nitrogen-fixing plants are lower than in plants that do
                           not fix nitrogen. In addition, an analysis of bear blood revealed that the δ13C values during hibernation decrease,
                           while the δ15N increases60. Hence, bear species have an interesting and complex metabolism (aspects of which
                           remain poorly understood but which need to be considered when interpreting isotopic data).
                               The objective of this work is to approximate bear feeding habits in Mediterranean latitudes, providing two
                           different and complementary temporal resolutions: the proxies of dental microwear and the stable isotopes. While
                           the stable isotope analysis of δ13C and δ15N in the bulk-collagen of bone tissue samples provides an average infor-
                           mation of the diet that the animal consumed during the last years prior to death61, microwear offers information
                           of the diet that the animal ate during its last days/weeks before dying62,63.
                               A study of the feeding habits of U. spelaeus that combined stable isotopes extracted from bone collagen
                           and dental microwear compared to a wide variety of extant species of ursids has never been published before.
                           This work was performed on the fossil remains of cave bear from the Toll Cave (NE Spain) which is located at
                           Mediterranean climate latitudes. Moreover, the cave bear remains and other bones from this site have been radi-
                           ocarbon dated. It should also be noted that information on Mediterranean latitudes is practically non-existent,
                           and these can be interesting when contributing data of the diet of this animal in more temperate environments.

                           Site and Materials
                           Toll Cave is located near the village of Moià, 50 km to the north of Barcelona (Fig. 1). It is one of the caves
                           belonging to a karstic system forming a course of galleries of more than 2 km long. The cave is at about 760 m
                           a.s.l., and its coordinates are 2°09′02″ E and 41°48′25″ N. To date, four archaeological levels have been excavated.
                           The Holocene sediments (level 1) show evidence of being mixed, level 2 is probably Holocene (13 ka BP)64. Level 4 has been recently excavated and new radiocarbon dates are
                           presented in this paper. In this work, all the faunal remains analysed come from Level 4. At this level, different
                           species have been identified, mainly cave bear, but also carnivores such as spotted hyenas (Crocuta crocuta), lions
                           (Panthera leo spelaea), and wolves (Canis lupus), as well as small carnivores such as lynxes (Lynx pardina), wild-
                           cats (Felis silvestris), foxes (Vulpes vulpes) and badgers (Meles meles). There are also ungulates, such as rhinoceros
                           (Stephanorhinus sp.), horses (Equus ferus), European asses (Equus hydruntinus), red deer (Cervus elaphus), roe
                           deer (Capreolus capreolus), wild boar (Sus scrofa) and rabbits (Oryctolagus cuniculus). The assemblage has been
                           identified as belonging to the Upper Pleistocene and interpreted as the result of a hibernation lair, especially

Scientific Reports |   (2019) 9:5716 | https://doi.org/10.1038/s41598-019-42152-7                                                              2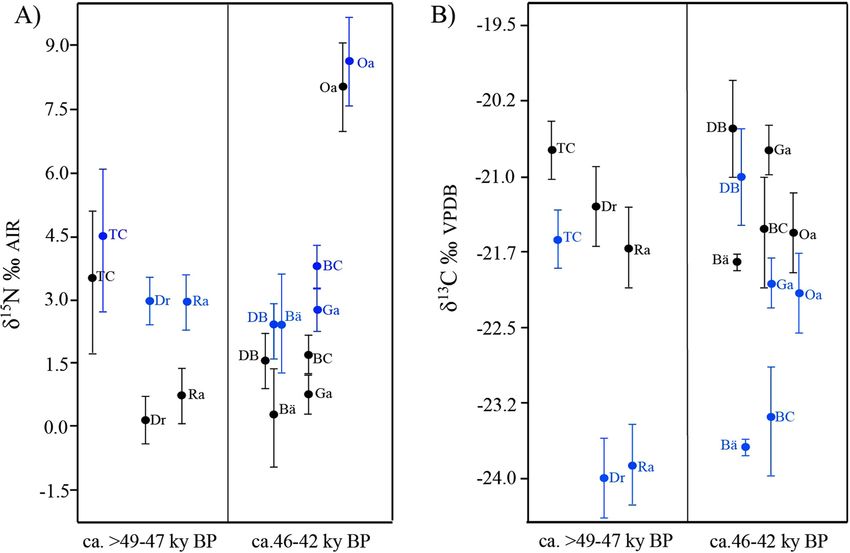
www.nature.com/scientificreports/                                                                 www.nature.com/scientificreports

                           Figure 1. Map of the location of the site (Toll Cave, Spain).

                            Species                   N    NFS     NCS     NTS      SWS    LP       SP      NTP
                            A. melanoleuca            4    19.25   0.00    19.25    0.00   8.50     46.25   54.75
                            H. malayanus              17   17.29   2.24    19.53    0.94   5.12     18.53   23.65
                            M. ursinus                4    12.75   3.25    16.00    1.00   9.75     20.25   30.00
                            T. ornatus                2    13.00   3.00    16.00    1.00   7.00     18.50   25.50
                            U. americanus             9    13.56   2.56    16.11    1.00   5.44     19.00   24.44
                            U. maritimus              14   11.00   3.21    14.21    2.79   4.50     16.21   20.71
                            U. thibetanus             6    14.33   3.33    17.67    1.00   4.50     15.33   19.83
                            U. arctos, Greece         4    13.00   7.00    20.00    1.00   9.25      8.50   17.75
                            U. arctos, central EU     10   17.50   3.40    20.90    1.00   5.40     22.50   27.90
                            U. arctos, N. America     8    18.25   3.00    21.25    1.00   6.75     18.38   25.13
                            U. arctos, Russia         23   16.22   3.83    20.04    1.09   6.96     19.78   26.74
                            U. arctos, N. Europe      9    15.78   3.78    19.56    1.00   6.44     23.33   29.78
                            U. spelaeus (Toll Cave)   12   20.04   6.58    26.63    1.00   4.83     20.67   25.50
                            U. spelaeus (Toll Cave) SD —    4.59   2.25     4.32    —      2.49      2.31    3.75

                           Table 1. Comparison of the average DMA results between the molars of U. spelaeus of Toll Cave and samples
                           of extant bears published by Pappa et al.39 and Pappa88. N = number of specimens; NFS = number of fine
                           scratches; NCS = number of coarse scratches; NTS = total number of scratches; SWS = scratches width score;
                           NSP = number of small pits; NLP = number of large pits; NTP = total number of pits; SD = standard deviation.

                           intense in Level 4. This is supported by the abundance of remains of U. spelaeus and the taphonomic characteris-
                           tics of the assemblage, where the activity of carnivores, such as hyenas and wolves, is significant65–67.
                               All the material available from the recent excavations has been considered for this work. The material is cur-
                           rently stored in the collections of the Catalan Institute of Human Paleoecology and Social Evolution (IPHES,
                           Tarragona, Spain). At present, Toll Cave is one of the sites with one of the most important collections of this ursid
                           fossil in the Iberian Peninsula65–67.

                           Results
                           Dental microwear analysis.           Dental microwear analysis (DMA) performed on the samples of extant wild
                           bears shows, in general, a total average of pits that is higher than the total average of scratches in all species
                           (Table 1). The general pattern shows a higher number of fine scratches than coarse scratches for all species.
                           A. melanoleuca has the highest number of fine scratches and U. arctos (Greece) has the highest number of coarse
                           scratches. If we consider the scratch width (SWS), A. melanoleuca do not show any coarse and hypercoarse
                           scratch, the rest of the species show a mixture of fine and coarse scratches and U. maritimus shows a predomi-
                           nance of hypercoarse scratches. Among the extant bear species, the average number of small pits is higher than

Scientific Reports |   (2019) 9:5716 | https://doi.org/10.1038/s41598-019-42152-7                                                             3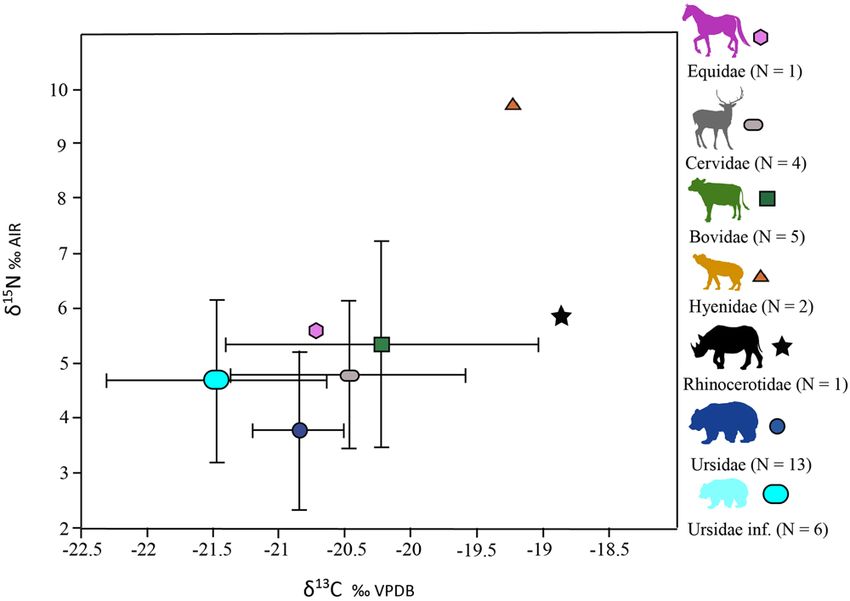
www.nature.com/scientificreports/ www.nature.com/scientificreports
Dim.1 Dim.2 Dim.3 Dim.4
Eigenvalues 0.018 0.007 0.005 0.005
% of var. 51.487 20.290 15.205 13.018
Cumulative % of var. 51.487 71.777 86.982 100.000
Table 2. Eigenvalues, variance percentages of each dimension (Dim.).
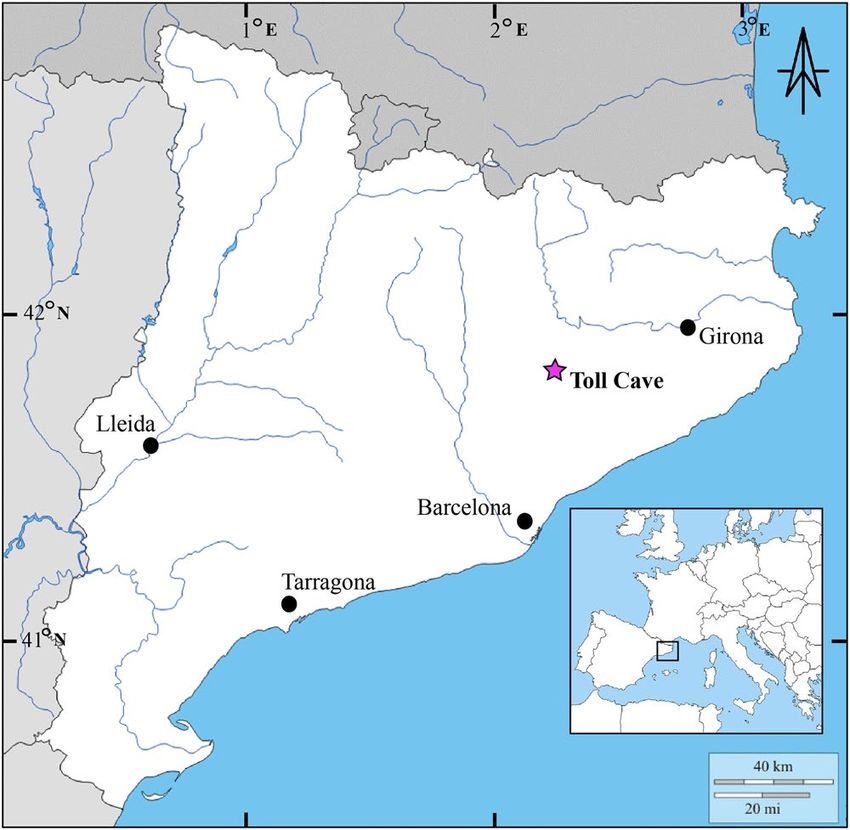
Figure 2. Correspondence Analysis (CA) based on five microwear variables (NFS = number of fine scratches;
NCS = number of coarse scratches; SWS = scratches width score; NSP = number of small pits; NLP = number of
large pits) for the extant ursid species and the cave bear from the Toll Cave.
the average number of large pits except for U. arctos from Greece. A. melanoleuca is the species with the highest
average number of small pits. U. arctos (N. America) has the highest average number of scratches (NTS) and
U. maritimus has the lowest average number of scratches (NTS), but the pattern is very similar among species. In
the case of the total average number of pits (NTP), the most remarkable data is the higher number observed in
A. melanoleuca, especially in small pits that double in number those of the other species.
In comparison to the extant bear species, the U. spelaeus from Toll Cave has the highest number of scratches,
both fine and coarse. However, the number of pits fits in the range of the extant species (Table 1; Supplementary
Table S1).
A Correspondence Analysis (CA) was performed to compare all the microwear variables in the extant spe-
cies and in the U. spelaeus from the Toll Cave. The results for axis 1 and 2 were plotted because its percentage of
variance is higher than for the other axes (Table 2). The CA indicates that the polar bear (U. maritimus) is distant
from the other species due to the presence of hypercoarse scratches (Fig. 2). The panda (A. melanoleuca) plots
across axis 2 (respect to the other species) because it does not have any coarse and hypercoarse scratches and it
is characterized by a high number of small pits. The U. arctos from Greece is in the upper right because it is the
only species with a higher average of large pits than of small pits and because it has the highest percentage of
coarse scratches. The specimens of U. spelaeus from Toll Cave are plotting far from the herbivorous species A.
melanoleuca and the insectivorous species M. ursinus, as well as from U. arctos (Greece). The U. spelaeus appear
near the omnivorous species U. arctos (Central Europe, Russia), H. malayanus, U. thibetanus, U. americanus and
the carnivorous species U. maritimus (Fig. 2).
Stable isotope analysis. Collagen preservation. The results of the stable isotopes and collagen quality indi-
cators are reported in Table 3. Collagen was successfully extracted from 32 of 39 (82%) samples. It was not possi-
ble to extract collagen in five samples (Toll 9, 16, 23, 24, 38) because collagen yields were lower than 10 mg. g−1.
Some samples (Toll 7, 10, 12, 13, 15, 22, 29–34, 36) present C and N contents (C% and N% values) lower than
the recommended accepted limits in Van Klinken68 but higher than those suggested by Ambrose69,70. In these
samples, the carbon and nitrogen % values were not correlated with the isotopic signatures (δ13C: Spearman’s
rho, r = 0.294, p = 0.328; δ15N Spearman’s rho, r = −0.008, p = 0.978); rather in the C:N values, respectively (C%:
Spearman’s rho, r = 0.666, p = 0.664; N% Spearman’s rho, r = 0.001, p = 0.996). In these samples, the absence of
correlation within species was also verified. Two samples (Toll 27, 39) present C and N contents (C% and N%
values) lower than recommended accepted limits in both Ambrose69,70 and Van Klinken68 proposals and were
discarded for final interpretation. Using these criteria, and after seeing no correlation between atomic amount
Scientific Reports | (2019) 9:5716 | https://doi.org/10.1038/s41598-019-42152-7 4www.nature.com/scientificreports/ www.nature.com/scientificreports
Age Yield δ13CV- δ15NAIR
Sample Taxa Element Side category Code (mg/g) PDB ‰ ‰ C% N% C:N
Toll Bovidae 13 Bos sp. humerus — adult P10/07 25 −22.0 3.1 17.1 6.2 3.2
Toll Bovidae 17 Bos sp. radius — adult P10/07 27 −19.6 6.6 32.8 11.7 3.3
Toll Bovidae 24 Bos sp. astragalus l adult P11/03 — — — — — —
Toll Bovidae 25 Bos sp. tibia — adult Q07/3 34 −18.8 7.8 40.4 14.1 3.3
Toll Bovidae 6* Bos sp. radius — adult P14/29 24 −20.7 4.1 39.7 14.1 3.3
Toll Bovidae 8 Bos sp. tibia l adult P11/01 33 −20.1 5.0 32.8 11.6 3.3
Toll Cervidae 12 Cervus elaphus metatarsus r adult Q17/32 32 −21.5 5.9 18.1 6.9 3.1
Toll Cervidae 2* Cervus elaphus femur — adult Q10/08 33 −20.9 3.3 39.9 13.9 3.3
Toll Cervidae 3* Cervus elaphus tibia — adult P13/52 49 −20.2 4.0 37.2 13.3 3.3
Toll Cervidae 39 Cervus elaphus metapod — adult Q10/50 27 −22.2 3.3 23.4 6.6 4.1
Toll Cervidae 4 Cervus elaphus metapod — adult Q17/38 30 −19.4 6.0 40.8 14.5 3.3
Toll Cervidae 9 Cervus elaphus vertebrae — adult R14/04 — — — — — —
Toll Equidae 40 Equus sp. metapod — adult R12/45 35 −20.7 5.6 31.2 11.5 3.2
Toll Hyenidae 10 Crocuta crocuta mandible l adult P13/03 26 −19.7 9.5 26.9 9.8 3.2
Toll Hyenidae19* Crocuta crocuta metapod — adult Q08/17 36 −18.7 10.0 31.4 11.6 3.2
Toll Rhinocerotidae 7 Stephanorhinus sp. mandible — adult P10/20 25 −18.9 5.9 24.8 8.6 3.4
Toll Ursidae 1* U. spelaeus femur — adult Q10/13 28 −20.8 2.4 38.5 13.4 3.3
Toll Ursidae 14* U. spelaeus femur r immature Q18/03 31 −22.9 8.2 38.6 12.7 3.5
Toll Ursidae 15 U. spelaeus femur l adult Q11/28 34 −21.0 2.8 30.3 10.8 3.3
Toll Ursidae 16 U. spelaeus femur r adult Q09/44 — — — — — —
Toll Ursidae 18* U. spelaeus humerus r adult P14/24 27 −20.4 2.3 36.0 13.5 3.1
Toll Ursidae 20* U. spelaeus femur — adult P15/53 32 −20.2 6.7 33.6 12.7 3.1
Toll Ursidae 21* U. spelaeus femur l adult Q10/48 31 −21.2 2.4 30.1 11.1 3.2
Toll Ursidae 22* U. spelaeus femur — sub—adult Q11/44 35 −20.8 3.4 24.4 8.3 3.4
Toll Ursidae 23 U. spelaeus femur l adult Q09/59 — — — — — —
Toll Ursidae 26 U. spelaeus femur r adult P10/25 26 −20.9 2.6 34.3 12.4 3.2
Toll Ursidae 27 U. spelaeus mandible r adult P12/23 40 −20.9 3.4 6.6 2.4 3.3
Toll Ursidae 28 U. spelaeus mandible r adult Q17/20 24 −21.2 2.7 37.8 13.5 3.3
Toll Ursidae 29 U. spelaeus mandible r immature P12/21 32 −20.4 2.9 29.0 10.8 3.1
Toll Ursidae 30 U. spelaeus maxilla r adult Q13/30 29 −20.4 5.3 31.3 10.9 3.3
Toll Ursidae 31 U. spelaeus mandible l immature P09/19 27 −22.0 5.0 27.7 9.9 3.3
Toll Ursidae 32 U. spelaeus mandible r immature Q10/45 26 −21.6 4.5 28.1 10.2 3.2
Toll Ursidae 33 U. spelaeus humerus l sub-adult Q08/11 33 −21.1 3.2 14.2 5.2 3.2
Toll Ursidae 34 U. spelaeus humerus r adult P17/1 25 −20.9 6.7 27.4 10.4 3.1
Toll Ursidae 35 U. spelaeus humerus l immature Q10/2 29 −21.1 3.8 35.3 13.0 3.2
Toll Ursidae 36 U. spelaeus humerus l immature Q10/9 27 −21.8 5.0 24.6 9.2 3.1
Toll Ursidae 37 U. spelaeus humerus r adult Q11/4 35 −20.9 2.6 30.1 11.1 3.2
Toll Ursidae 38 U. spelaeus humerus — adult Q12/41 — — — — — —
Toll Ursidae 5* U. spelaeus femur r adult Q09/37 32 −20.5 3.5 33.5 11.7 3.3
Table 3. Results of δ13C and δ15N values and collagen preservation (C%, N% and C:N) of Toll Cave samples.
*Replicated samples in Cape Town laboratory.
and isotope values in the remaining samples, we decided to include for interpretation all samples with a successful
recovery of C% and N% in collagen range from 14 to 40% and from 5 to 14%, respectively, as well as with atomic
C:N ratio ranging from 3.1 to 3.5 (mean value 3.3 ± 0.10).
δ13C and δ15N values. The δ13C values of all samples measured in the Toll Cave range from −22.9 to −18.7‰
(n = 32): in ursids, δ13C values range from −22.9 to −20.2‰ (n = 19); for the cervids, δ13C values range from
−21.5 to −19.4‰ (n = 4); in bovids, δ13C values range from −22 to −18.8‰ (n = 5) and in the hyaenids, δ13C
values range from −19.7 to −8.7‰ (n = 2). δ13C values in the unique sample of equids and rhinocerotids are
−20.7‰ and −18.9‰, respectively.
The δ15N values of all samples measured in the Toll Cave range from 2.4 to 10‰ (n = 32): in ursids, δ15N val-
ues range from 2.4 to 8.2‰ (n = 19); in cervids, δ15N values range from 3.3 to 6‰ (n = 4); in bovids, δ15N values
range from 3.1 to 7.8‰ (n = 5) and in the hyaenids, δ15N values range from 9.5 to 10‰ (n = 2). δ15N values in the
unique sample of equids and rhinocerotids are 5.6‰ and 5.9‰, respectively.
Figure 3 shows the place occupied by each species in the trophic chain. In this case, the lowest nitrogen values
correspond to the adult ursids and the highest correspond to the hyenas; all other herbivores and immature ursids
Scientific Reports | (2019) 9:5716 | https://doi.org/10.1038/s41598-019-42152-7 5www.nature.com/scientificreports/ www.nature.com/scientificreports
Figure 3. Average values of δ13C and δ15N of the different species analysed. The error bars correspond to the
standard deviation.
Figure 4. Comparison of the average values of δ13C and δ15N of the contemporaneous sites of Toll Cave, blue
line with the altitudinal adjustment and black line without altitudinal adjustment. The error bars correspond
to the standard deviation. (Selected sites are: TC = Toll Cave (Spain) 760 m; Oa = Peştera cu Oase (Romania)
600 m; Dr = Drachenloch (Switzerland) 2475 m; Bä = Bärenloch (Switzerland) 1645 m; Ra = Ramesch (Austria)
1960 m; BC = Balme à Collomb (France) 1700 m; DB = Divje Babe (Slovenia) 450 m; Ga = Gamssulzen
(Austria) 1300 m).
are located between these two species. Carbon analysis place the rhino and hyena in the area that indicates more
positive carbon values and the herbivores and ursids in the area with more negative values, given that the imma-
ture ursids have the most negative values.
Significant differences among all species and U. spelaeus were found only between Hyaenidae and adult and
sub-adult cave bear groups of individuals (ANOVA and Tukey’s pairwise comparison: Q = 4.188 and p = 0.0357
for δ13C values; Q = 7.238 and p = 0.00028 for δ15N values). Statistical differences within cave bear samples
were found between adult and sub-adult samples against immature specimens, but only in δ13C values (t-test;
t = 3.1954; p = 0.0053).
Comparison with other populations from the late pleistocene. In Fig. 4, we compare the isotopic
results from the Toll Cave (TC) to all available isotopic data from contemporaneous (i.e., 14C dated) and cave
bear specimens in Europe. Following the same approach as Krajcarz et al.47, we used the altitudinal adjust-
ment published by Männel et al.71: δ15N-adj-alt = δ15N + (0.0011 · altitude), and δ13C-adj-alt = δ13C − (0.0011 ·
Scientific Reports | (2019) 9:5716 | https://doi.org/10.1038/s41598-019-42152-7 6www.nature.com/scientificreports/ www.nature.com/scientificreports
MPI code Field
number number Level Taxa/ Bone %Coll δ13C δ15N %C %N C:N AMS Nr. C Age Err 1σ Cal BP 68.2%
14
Cal BP 95.4%
S-EVA 27843 T09/P17/21 3 Cervidae/Tibia 1.95 −18.74 6.98 40.73 14.79 3.21 MAMS-18677 43130 340 46,660–45,900 47,140–45,580
S-EVA 27845 T11/Q12/60 4 Ursidae Mandible 4.07 −20.45 2.67 39.23 14.38 3.18 MAMS-18679 >49000
out of 14C out of 14C
S-EVA 27850* T11/P16/71 4 Large size/flat bone 0.81 −20.81 3.76 36.18 13.27 3.18 MAMS-18684 47310 540
range-49,860 range-49,980
S-EVA 27851 T11/Q11/44 4 Ursidae/Femur 5.05 −19.89 3.98 40.22 14.76 3.18 MAMS-18685 >49000
Table 4. Radiocarbon dating, isotopic values, % of collagen and C:N ratios of dated samples from the Toll Cave.
altitude), where altitude is given in meters. The correction removes the altitude bias and allows the equalizing of
all data to the same level (i.e., 0 m a.s.l.) making the samples comparable. The statistical test with carbon adjust-
ment shows significant differences between the Toll Cave and the sites of Drachenloch (Dr), Bärenloch (Bä),
Ramesch (Ra) and Balme à Collomb (BC) (ANOVA and Tukey’s pairwise comparison: p-value for δ13C values,
TC/Dr = 0.00014; TC/Bä = 0.00014; TC/Ra = 0.00014; TC/BC = 0.00018; TC/Ga = 0.6514; TC/DB = 0.5607).
However, the statistical test with nitrogen adjustment does not show significant differences between the Toll
Cave and the European selected sites (ANOVA and Tukey’s pairwise comparison: p-value for δ15N values, TC/
Dr = 0.6074; TC/Bä = 0.0930; TC/Ra = 0.6074; TC/BC = 0.8452; TC/Ga = 0.1612; TC/DB = 0.0743). We excluded
the Romanian site from the statistical test because its values were very different from the rest of European cave
bear isotopic results.
Radiocarbon. All four samples passed the quality criteria for radiocarbon dating proposed by Van Klinken68
(Table 4). Hence the extracted collagen were sent to the Mannheim AMS laboratory (Lab Code MAMS) for AMS
dating72. All the 14C results were calibrated using the IntCal 1373 in IOxCal 4.3 program74. The results show that
level 3 ranges between 46,660–45,900 cal BP at 68.2% probability, on the other hand, level 4 is quite old. The two
Ursidae are dated outside the 14C range (>49,000 14C BP). The only finite result is the bone of a large-sized mam-
mal (MAMS - 18677; 47,310 14C BP). When calibrated, this date is out of the range of radiocarbon arriving at max
49,860 cal BP at 68.2% probability. This is the only result that shows a slightly less amount of collagen (0.81%),
when compared to all the other samples. However, this sample (S - EVA 27850) displays a normal C:N ratio. For
this reason, we consider this date valid in its context.
Discussion
The average δ13C value in U. spelaeus (only adults) corresponds to animals with a dominant consumption of C3
plants. Carbon isotopes have a great potential for reconstructing past habitats and the δ13C values, which are more
negative than in the rest of the herbivores and carnivores analysed, may be due to a more closed forest habitat for
this species. This can be linked to the recycling of organic matter (canopy effect) impoverished in 13C that occurs
in these dense forests48,52,75. Indeed, the δ13C values obtained in other species, related to open landscapes, show
more positive carbon values. The more negative δ13C values of U. spelaeus compared to contemporary species are
supported by the palaeoenvironmental analyses of the pollen record and the small mammals (including rodents)
that were carried out in Toll Cave. Palynological results seem to show a closed forest environment with a pre-
dominance of Pinus sp. with the presence of some other taxa76. The analysis of the small mammal remains also
supports the idea of a woodland habitat64. Alternatively, it has been suggested that lowest δ13C values in cave bear,
in contrast with those of contemporary species, could be related to the storage of lipids during hibernation and
their subsequent recycling in the synthesis process of some amino acids41,48. But if the carbon values of the Toll
Cave ursids decreased during the hibernation process, nitrogen values should increase by the same process, as has
been observed in modern ursids studies60. The latter is not documented in our results.
As for the δ13C values, the δ15N values obtained in the adult samples of U. spelaeus from Toll Cave are lower
than those obtained in both contemporaneous carnivorous and herbivorous specimens sampled from the same
archaeological level. This data suggests a lower position in the trophic chain and would indicate a mainly herbivo-
rous diet for our bear specimens. However, these low values could also be explained by the fact that biological fix-
ation of nitrogen causes a 15N decrease in the tissue of nitrogen-fixing plants in relation to those that do not fix it53.
In this fixation process, atmospheric nitrogen is enzymatically converted to organic nitrogen, including amino
acids, nucleotides and other molecules77. The fixation can be caused by several factors, such as the symbiosis of
nodules in the roots of several plants (e.g. the Fabaceae family) with some bacteria, the non-symbiotic fixation
carried out by an aerobic bacterium, or the rain78. Therefore, these low values of δ15N could be due to a preferen-
tial feeding of the U. spelaeus on nitrogen fixing plants, which include not only the Fabaceae family but a large
taxonomic variety of plants from 8 families and 23 genera79. Moreover, a cave bear diet based on the Fabaceae
family plants could be undetectable by δ13C values in our study (i.e. bulk collagen samples). The results of the pol-
len analysis at Toll Cave do not support this hypothesis because the pollen spectrum does not show the presence
of nitrogen-fixing taxa. However, it must be taken into account that some taxa may appear underrepresented in
the pollen record, due to their mode of dispersion and differential conservation, among other factors80,81.
The δ13C and δ15N values of the immature bears at Toll Cave are different from those of the adult bears.
Although statistical differences are only attested in carbon values between immature and adults, nitrogen values
show a trend toward higher values in immature specimens. Isotopic values of young mammals may have been
influenced by the metabolic changes of the mother during pregnancy, such as the breastfeeding and the hiberna-
tion process. The offspring usually have higher values of δ15N due to lactation and the proteins in milk82. During
hibernation, the tissues of the immature bear are formed from the metabolic process derived from the fat storage
Scientific Reports | (2019) 9:5716 | https://doi.org/10.1038/s41598-019-42152-7 7www.nature.com/scientificreports/ www.nature.com/scientificreports
of the mother. The recycling of the mother’s nitrogen during the gestation of the foetus could result in elevated
δ15N values in its tissues23. The depleted δ13C values observed in immature bears could be explained as the result of
12
C from the mother’s fat being incorporated into the collagen of immature bears preferentially. Triglycerides are
the main constituents of body fat and these are composed of glycerol and three fatty acids. Glycerol from triglyc-
erides metabolism enters the glycolytic pathway and the carboxyl carbons of amino acids arising from glycolytic
intermediates would be especially depleted in 13C61.
As tooth microwear reflects the diet of the last days/weeks before death, this analysis offers the opportunity
to characterize the diet to which the U. spelaeus had access at a specific time in its life. Our results show that the
diet of the cave bear may not always have been that of a strictly vegetarian animal because they have a microwear
pattern like that of extant omnivorous and carnivorous species. Since the isotopic analyses do not record the
short-term diet, it is not possible to know the seasonal dynamics of U. spelaeus from this proxy. However,
microwear results suggest a varied and less specialized diet before the death of these individuals, indicating a die-
tary plasticity that implies that the cave bear had the capacity to adapt to the availability of resources due to factors
such as seasonal changes. Considering the amount of energy and body mass that a bear of such size must acquire
in order to successfully overcome the period of hibernation, it would make sense not to adopt a strictly herbivo-
rous diet before hibernating83. This situation does not occur in winter or spring, where cases of extant bears, such
as grizzlies, adopting a strictly vegetarian diet have been documented84,85. One interesting hypothesis, defended
by some authors19–23, considers that many of the remains of U. spelaeus found in caves belong to individuals who
died during the hibernation process, an important seasonal event in the life of these animals. Considering this
hypothesis, microwear analysis makes it possible to establish the bear feeding habits before their hibernation.
The isotopic signatures from the cave bear specimens of the Toll Cave, which are older than 49,000 years BP,
were compared to data available in other published studies. The results are similar to the values registered for U.
spelaeus in most of the European sites on which isotope analysis has been carried out, with the exception of the
works published by Richards et al.56 and Robu et al.57,58 in Peştera cu Oase (Romania), which show values of δ15N
of the U. spelaeus that place it at the same level of contemporary carnivores. The values registered everywhere else
indicate so far an herbivorous diet for U. spelaeus35,41,47,48,50,51,53,86–88.
Nevertheless, the comparison between isotopic data from different cave bears around Europe must be carried
out by taking into account the effect of some external factors on both the isotopic carbon and nitrogen signatures.
For instance, in Krajcarz et al.47, the authors demonstrate that altitudinal location affects significantly the fixation
of δ13C and δ15N signatures, while latitude does not show any apparent effects. No differences at the latitudinal
level may be because the altitudinal range of the sites analysed in Europe is very narrow. However, the differences
at the altitudinal level are remarkable. In our comparison, the lowest altitude site is Divje Babe (Slovenia) 450 m
a.s.l. and the highest altitude is Drachenloch (Switzerland) 2475 m a.s.l.
The differences in carbon values is more related to the altitudinal position than to the resources. Our results
show differences in carbon between Toll Cave (TC) and the sites located at elevations above 1500 m a.s.l. as
Drachenloch (Dr), Bärenloch (Bä), Ramesch (Ra) and Balme à Collomb (BC). This means that ursid populations
fed on plants with a different carbon signal. Photosynthetic groups of plants that could show a different δ13C sig-
nature or also that these animals inhabited landscapes with a varied plant cover (canopy effects)47.
On the contrary, the lack of difference in the isotopic nitrogen signatures between populations that are likely
to be contemporaneous in Europe but located at different altitudes suggests that probably the differences between
soils were not very significant and the contribution of protein in cave bear diet was minimal in all sampled
population (except in Peştera cu Oase, not considered for comparison). In the Toll Cave, the low position of
the cave bear in the trophic chain, similar or lower than in likely contemporaneous strict herbivores, indicates a
low protein intake in its diet. The same pattern is observed in other European sites23,88, including Drachenloch,
Bärenloch, Ramesch and Balme à Collomb sites44.
Conclusion
The integrated analysis of stable isotopes and microwear allowed us to confirm the significance of these two prox-
ies for studies focused on paleodiet. The ability of both proxies to provide data on the diet of U. spelaeus at differ-
ent timeframes (average diet of life vs. last days/weeks before death) allows for the generation of more complete
and complementary results that provide better consistency in this type of palaeodietary studies. According to the
isotopic values, the diet of the U. spelaeus located in the Mediterranean area at the Toll Cave is like that of other
European sites of the Late Pleistocene. We did detect some differences in the δ13C values that are probably related
to the vegetal landscape of different sites located at different altitudes. It shows a mostly herbivorous lifetime diet.
Considering the homogeneity in δ15N values (except for the Romanian sites), other significant factors beyond
the diet such as human pressure can be contemplated as the cause of the extinction of this ursid. However, tooth
microwear patterns of the cave bear are like those of extant omnivorous and carnivorous ursid species, suggesting
dietary flexibility and abilities to shift towards a more omnivorous diet. Our results show the usefulness of the
integration of these two proxies for providing information on the cave bear’s diet at different times of its life.
In future works, it will be interesting to study the isotopic signal of the same extant ursid specimens that were
used to create the microwear database. At the same time, this type of multi-proxy study will be performed in other
sites with different chronologies. Special attention will be given to chronologies close to the extinction of the cave
bear in order to observe if a common microwear pattern exists in the same way that is observed for isotopic values.
Methods
Dental microwear analysis (DMA). Dental microwear analysis was performed using the light stereomi-
croscopy technique established by Solounias and Semprebon27. This technique was selected because a large ref-
erence database that includes all bear species has been recent published39. A total of 12 first lower molars of U.
spelaeus (m1, carnassial) were selected for the (DMA). All teeth showed an occlusal surface wear indicative of
Scientific Reports | (2019) 9:5716 | https://doi.org/10.1038/s41598-019-42152-7 8www.nature.com/scientificreports/ www.nature.com/scientificreports
prime adults at the time of death (categories IV, V, VI and VII of Stiner20). The minimum number of individuals
(MNI) is equal to 12, considering the laterality and the size of the teeth as well as the degree of wear. Enamel
microwear features were observed via standard light stereomicroscopy at x35 magnification on high-resolution
epoxy casts of teeth, following the cleaning, moulding, casting and examination protocol developed by Solounias
and Semprebon27 and Semprebon et al.89. The occlusal surface of each specimen was cleaned using acetone and
then 96% ethanol. Once dry, the moulding substance, a high-resolution dental silicone (i.e. vinylpolysiloxane)
suitable for microwear analysis, was applied with a gun directly on to the tooth and casts were created using trans-
parent epoxy resin. Before the final selection of 12 molars, the teeth with bad preservation or other taphonom-
ical marks were excluded from the subsequent analysis90. These casts were examined using a Zeiss Stemi 2000C
stereomicroscope at low magnification. A standard 0.4 × 0.4 = 0.16 mm2 ocular reticle was employed to quantify
the number of small and large pits (round scars), scratches (elongated scars with parallel sides), scratch width
score (a score of zero (0) is given when only fine scratches are present, one (1) when there is a mixture of fine and
coarse scratches on the surface, two (2) when predominantly coarse scratches are present and three (3) when
the surface has also hypercoarse scratches). In carnivores, the facets of the slicing and grinding areas are usually
examined. However, for our study we focus on non-faceted enamel surfaces because they are more decisive in
the comparison between different species of ursids. Primates and bears have multicusped premolars and molars
and tooth morphology, and belong to the omnivorous group91. In this sense, and considering our focus on bears,
it is adequate to use unworn surfaces without facets rather than worn surfaces of the tooth39,92. The results have
been compared with the new reference databased on extant bears established by Pappa et al.39, which includes
the following species and even brown bear specimens from different geographical latitudes: Ursus arctos (Brown
bear) from Greece, central and north of Europe, N. America and Russia, Ursus maritimus (Polar bear), Ursus
americanus (Black bear), Ailuropoda melanoleuca (Giant panda), Ursus thibetanus (Asian black bear), Helarctos
malayanus (Sun bear), Melursus ursinus (Sloth bear) and Tremarctos ornatus (Spectacled bear).
Collagen extraction and isotope analyses. A total of 23 remains of cave bear were selected and sampled
for stable carbon and nitrogen isotope analysis. These correspond to a total of 11 different individuals (8 adults,
1 sub-adult and 2 immature) considering taxonomical identification by osteological criteria, estimated age and
bilateral symmetry. To define the local baseline of the trophic food chain for the ursid palaeodietary reconstruc-
tion, we also selected a range of contemporaneous carnivores and ungulates (Hyenidae n = 2, Bovidae n = 6,
Cervus elaphus n = 6, Equidae n = 1 and Rhinocerotidae n = 1), all recovered in Level 4.
Collagen extraction was performed at the Biomolecular Laboratory of IPHES in Tarragona (Spain). For each
specimen, a small bone fragment was carefully sawed with a Dremmel rotating tool equipped with a circular
diamond-coated blade, ultrasonicated in acetone and water, rinsed with distilled water, dried and crushed to
a powder of < 0.7 mm grain size. The collagen was purified according to Login’s acid-base-acid protocol pub-
lished in 197193, subsequently modified in Bocherens et al.94. Bone shards (ca. 300 to 350 mg) were soaked in 1 M
HCl for demineralization, in NaOH (0.125 M) to remove contaminants, rinsed with distilled water, and gelati-
nized with 0.01 M HCl at 100 °C for 17 h. Once filtered and frozen, samples were freeze dried at the Institute of
Chemical Research in Catalonia (ICIQ). Gelatine-collagen samples weighing about 300 μg were analysed using
a Thermo Flash 1112 elemental analyser (EA) coupled to a Thermo Delta V Advantage isotope ratio mass spec-
trometer (IRMS) with a Conflo III interface, at the Institute of Environmental Science and Technology (ICTA),
Autonomous University of Barcelona (Barcelona, Spain). The international standard laboratory IAEA 600 (caf-
feine) was used as control. The average analytical error waswww.nature.com/scientificreports/ www.nature.com/scientificreports
Data Availability
All data generated during this study are included here and in the Supplementary Information file.
References
1. Hofreiter, M. & Stewart, J. Ecological Change, Range Fluctuations and Population Dynamics during the Pleistocene. Curr. Biol. 19,
R584–R594 (2009).
2. Kjellström, E. et al. Simulated climate conditions in Europe during the Marine Isotope Stage 3 stadial. Boreas 39, 436–456 (2010).
3. Fletcher, W. J. et al. Millennial-scale variability during the last glacial in vegetation records from Europe. Quat. Sci. Rev. 29,
2839–2864 (2010).
4. Stuart, A. J. & Lister, A. M. Extinction chronology of the woolly rhinoceros Coelodonta antiquitatis in the context of late Quaternary
megafaunal extinctions in northern Eurasia. Quat. Sci. Rev. 51, 1–17 (2012).
5. Ewer, R. F. The Carnivores. The World Naturalist. (Cornell University Press, 1973).
6. Turner, A. & Antón, M. The Big Cats and their Fossil Relatives. (Columbia University Press, 1997).
7. Kahlke, D. The History of the Origin, Evolution and Dispersal of the Late Pleistocene Mammuthus-Coelodonta Faunal Complex in
Eurasia (Large Mammals). (Fenske Companies, 1999).
8. Pacher, M. & Stuart, A. J. Extinction chronology and palaeobiology of the cave bear (Ursus spelaeus). Boreas 38, 189–206 (2009).
9. Martin, R. Les mammifères fossiles du gisement quaternaire de Villereversure. Etude des Carnivores, des Cervidés et des Equidés.
(PhD Thesis, Université de Lyon, 1968).
10. Koch, P. L. & Barnosky, A. D. Late Quaternary Extinctions: State of the Debate. Annu. Rev. Ecol. Evol. Syst. 37, 215–250 (2006).
11. Baca, M. et al. Retreat and extinction of the Late Pleistocene cave bear (Ursus spelaeus sensu lato). Sci. Nat. 103, (2016).
12. Bächler, E. Das Drachenloch ob Veattis im Taminatale, 2445 m ü. M. und seine Bedeutung als paleaontologische Fundstatte und
preahistorische Niederlassung aus der Altsteinzeit (Paleaolithikum) im Schweizerlande. Separatabdruck, Jahrb. St. Gall.
Naturwissenschaftlichen Gesellschaft 57, 1–144 (1921).
13. Soergel, W. Das Massenvorkommen des Höhlenbären (1940).
14. Pacher, M. Höhlenbäre und Mensch: Tatsachen und Vermutungen. in Der Höhlenbär (eds Rabeder, G., Nagel, D. & Pacher, M.) 4,
82–104 (Species, Jan Thorbecke Verlag 2000).
15. Pacher, M. Taphonomic analyses of cave bear remains from Potoèka zijalka (Slovenia): Further analyses and conclusion. In Potoèka
zijalka - Paleontological and archaeological result of the campaigns 1997–2000 (eds Pacher, M., Pohar, V. & Rabeder, G.) 13, 97–114
(Mitteilungen der Kommission für Quartärforschung der Österreichischen Akademie der Wissenschaften, 2004).
16. Sandom, C., Faurby, S., Sandel, B. & Svenning, J. C. Global late Quaternary megafauna extinctions linked to humans, not climate
change. Proc. R. Soc. B Biol. Sci. 281 (2014).
17. Stuart, A. J. Late Quaternary megafaunal extinctions on the continents: A short review. Geol. J. 50, 338–363 (2015).
18. Terlato, G. et al. Chronological and Isotopic data support a revision for the timing of cave bear extinction in Mediterranean Europe.
Hist. Biol. 31, 474–484 (2019).
19. Andrews, P. & Turner, A. Life and death of the Westbury bears. Ann. Zool. Fennici 28, 139–149 (1992).
20. Stiner, M. C. Mortality analysis of Pleistocene bears and its paleoanthropological relevance. J. Hum. Evol. 34, 303–326 (1998).
21. Pinto-Llona, A. C., Andrews, P. J. & Etxebarria, F. Taphonomy and Palaeoecology of Bears from the Quaternary of Cantabrian Spain.
(Fundación oso de Asturias, 2005).
22. Wojtal, P. Zooarchaeological Studies of the Late Pleistocene Sites in Poland. (Polish academy of sciences. Institute of systematics and
evolution of animals, 2007).
23. Grandal-d’Anglade, A., Pérez-Rama, M., García-Vázquez, A. & González-Fortes, G. M. The cave bear’s hibernation: reconstructing
the physiology and behaviour of an extinct animal. Hist. Biol. 31, 429–441 (2019).
24. Lister, A. M. & Bahn, P. Mammoths. Giants of the Ice Age. (University of California Press, 2007).
25. Walker, A., Hoeck, H. N. & Perez, L. Microwear of mammalian teeth as an indicator of diet. Science. 201, 908–910 (1978).
26. Teaford, M. F. & Walker, A. Quantitative differences in dental microwear between primate species with different diets and a
comment on the presumed diet of Sivapithecus. Am. J. Phys. Anthropol. 64, 191–200 (1984).
27. Solounias, N. & Semprebon, G. M. Advances in the Reconstruction of Ungulate Ecomorphology with Application to Early Fossil
Equids. Am. Museum Novit. 3366, 1–49 (2002).
28. Rivals, F. & Semprebon, G. M. Dietary plasticity in ungulates: Insight from tooth microwear analysis. Quat. Int. 245, 279–284
(2011).
29. Rivals, F. & Lister, A. M. Dietary flexibility and niche partitioning of large herbivores through the Pleistocene of Britain. Quat. Sci.
Rev. 146, 116–133 (2016).
30. Pinto Llona, A. C. & Andrews, P. J. Dental wear and grit ingestion in extant and extinct bears from Northern Spain. Cuad. do Lab.
Xeol. Laxe 26, 423–429 (2001).
31. Pinto Llona, A. C. Comparative dental microwear analysis of Cave Bears Ursus spelaeus Rosenmüller, 1794 and Brown Bears Ursus
arctos Linnaeus, 1758. Sci. Ann. Sch. Geol. Aristotle Univ. Thessaloniki 98, 103–108 (2006).
32. Peigne, S. et al. Predormancy omnivory in European cave bears evidenced by a dental microwear analysis of Ursus spelaeus from
Goyet, Belgium. Proc. Natl. Acad. Sci. 106, 15390–15393 (2009).
33. Pinto-Llona, A. C. Macrowear and occlusal microwear on teeth of cave bears Ursus spelaeus and brown bears Ursus arctos:
Inferences concerning diet. Palaeogeogr. Palaeoclimatol. Palaeoecol. 370, 41–50 (2013).
34. Donohue, S. L., DeSantis, L. R. G., Schubert, B. W. & Ungar, P. S. Was the giant short-faced bear a hyper-scavenger? A new
approach to the dietary study of ursids using dental microwear textures. PLoS One 8 (2013).
35. Münzel, S. C. et al. Behavioural ecology of Late Pleistocene bears (Ursus spelaeus, Ursus ingressus): Insight from stable isotopes (C,
N, O) and tooth microwear. Quat. Int. 339–340, 148–163 (2014).
36. Jones, D. B. & DeSantis, L. Dietary ecology of the extinct cave bear (Ursus spelaeus): evidence of omnivory as inferred from dental
microwear textures. Acta Palaeontol. Pol. 61, (2016).
37. Medin, T., Martínez-Navarro, B., Rivals, F., Libsekal, Y. & Rook, L. The late Early Pleistocene suid remains from the
paleoanthropological site of Buia (Eritrea): Systematics, biochronology and eco-geographical context. Palaeogeogr. Palaeoclimatol.
Palaeoecol. 431, 26–42 (2015).
38. Peigné, S. & Merceron, G. Palaeoecology of cave bears as evidenced by dental wear analysis: a review of methods and recent
findings. Hist. Biol. 31, 448–460 (2019).
39. Pappa, S., Schreve, D. C. & Rivals, F. The bear necessities: A new dental microwear database for the interpretation of palaeodiet in
fossil Ursidae. Palaeogeogr. Palaeoclimatol. Palaeoecol. 514, 168–188 (2019).
40. Martin, J. E., Tacail, T. & Balter, V. Non-traditional isotope perspectives in vertebrate palaeobiology. Palaeontology 60, 1–18 (2017).
41. Bocherens, H., Fizet, M. & Mariotti, A. Diet, physiology and ecology of fossil mammals as inferred from stable carbon and nitrogen
isotope biogeochemistry: implications for Pleistocene bears. Palaeogeogr. Palaeoclimatol. Palaeoecol. 107, 213–225 (1994).
42. Grandal-d’Anglade, A., Pérez-Rama, M. & Fernández-Mosquera, D. Diet, physiology and environment of the cave bear: a
biogeochemical study. In Fragments of Ice Age Environments. Proceedings in Honour of Ivan Turk’s Jubilee (ed. Toskan, B.) 111–125,
https://doi.org/10.13140/RG.2.1.3732.9445 (Inštitut za arheologijo ZRC SAZU, Založba ZRC, 2011).
Scientific Reports | (2019) 9:5716 | https://doi.org/10.1038/s41598-019-42152-7 10www.nature.com/scientificreports/ www.nature.com/scientificreports
43. Münzel, S. C. et al. Pleistocene bears in the Swabian Jura (Germany): Genetic replacement, ecological displacement, extinctions
and survival. Quat. Int. 245, 225–237 (2011).
44. Pacher, M., Bocherens, H., Döppes, D., Frischauf, C. & Rabeder, G. First results of stable isotopes from Drachenloch and
Wildenmannlisloch, Swiss Alps. in Proceedings of the 17th International Cave Bear Symposium, 15th-18th September 2011 (eds
Döppes, D., Joger, U. & Rosendahl, W.) 11, 101–110 (Braunschweiger Naturkundliche Schriften, 2012).
45. Bocherens, H., Grandal-d’Anglade, A. & Hobson, K. A. Pitfalls in comparing modern hair and fossil bone collagen C and N
isotopic data to reconstruct ancient diets: A case study with cave bears (Ursus spelaeus). Isotopes Environ. Health Stud. 50, 291–299
(2014).
46. Naito, Y. I. et al. Evidence for herbivorous cave bears (Ursus spelaeus) in Goyet Cave, Belgium: implications for palaeodietary
reconstruction of fossil bears using amino acid δ15N approaches. J. Quat. Sci. 31, 598–606 (2016).
47. Krajcarz, M. et al. Isotopic variability of cave bears (δ15N, δ13C) across Europe during MIS 3. Quat. Sci. Rev. 131, 51–72 (2016).
48. Bocherens, H. et al. Paleobiological Implications of the Isotopic Signatures (13C, 15N) of Fossil Mammal Collagen in Scladina Cave
(Sclayn, Belgium). Quat. Res. 48, 370–380 (1997).
49. Bocherens, H. Cave bear palaeoecology and stable isotopes: checking the rules of the game. in Proceedings of the 9th International
Cave Bear Conference (eds Philippe, M., Argant, A. & Argant, J.) 183–188 (Cahiers scientifiques du Centre de Conservation et
d’Etude des Collections. Museum d’Histoire naturelle de Lyon, 2004).
50. Bocherens, H., Drucker, D. G., Billiou, D., Geneste, J. M. & van der Plicht, J. Bears and humans in Chauvet Cave (Vallon-Pont-
d’Arc, Ardèche, France): Insights from stable isotopes and radiocarbon dating of bone collagen. J. Hum. Evol. 50, 370–376 (2006).
51. Bocherens, H. Isotopic tracking of large carnivore palaeoecology in the mammoth steppe. Quat. Sci. Rev. 117, 42–71 (2015).
52. Fernandez Mosquera, D. Biogeoquimica isotopica (δ13C, δ15N) del Ursus spelaeus del yacimiento de Cova Eiros, Lugo. Cad. do Lab.
Xeol. Laxe 23, 237–249 (1998).
53. Fernández-Mosquera, D., Vila-Taboada, M. & Grandal-d’Anglade, A. Stable isotopes data (δ13C, δ15N) from the cave bear (Ursus
spelaeus): A new approach to its palaeoenvironment and dormancy. Proc. R. Soc. B Biol. Sci. 268, 1159–1164 (2001).
54. Bocherens, H. Isotopic biogeochemistry and the paleoecology of the mammoth steppe fauna. In ADVANCES IN MAMMOTH
RESEARCH (Proceedings of the Second International Mammoth Conference) (eds Reumer, J. W. F., De Vos, J. & Mol, D.) 1000, 57–76
(2003).
55. Bocherens, H. et al. Diet reconstruction of ancient brown bears (Ursus arctos) from Mont Ventoux (France) using bone collagen
stable isotope biogeochemistry (13C, 15N). Can. J. Zool. 82, 576–586 (2004).
56. Richards, M. P. et al. Isotopic evidence for omnivory among European cave bears: Late Pleistocene Ursus spelaeus from the Peştera
cu Oase, Romania. Proc. Natl. Acad. Sci. USA 105, 600–4 (2008).
57. Robu, M. et al. Isotopic evidence for dietary flexibility among European Late Pleistocene cave bears (Ursus spelaeus). Can. J. Zool.
91, 227–234 (2013).
58. Robu, M. et al. The diverse dietary profiles of MIS 3 cave bears from the Romanian Carpathians: insights from stable isotope (δ13C
and δ15N) analysis. Palaeontology 61, 209–219 (2017).
59. Rosendahl, W. & Grupe, G. Mittelwürmzeitliche Höhlenbären und ihre Nahrungspräferenz - Forschungen aus der Neuen
Laubenstein-Bärenhöhle/Chiemgau. Mitt.Bayer.Staatss.Paläont.hist.Geol. 41, 85–94 (2001).
60. Lohuis, T. D., Harlow, H. J. & Beck, T. D. I. Hibernating black bears (Ursus americanus) experience skeletal muscle protein balance
during winter anorexia. Comp. Biochem. Physiol. - B Biochem. Mol. Biol. 147, 20–28 (2007).
61. Keeling, C. I. & Nelson, D. E. Changes in the intramolecular stable carbon isotope ratios with age of the European cave bear (Ursus
spelaeus). Oecologia 127, 495–500 (2001).
62. Grine, F. E. Dental evidence for dietary differences in Australopithecus and Paranthropus: a quantitative analysis of permanent
molar microwear. J. Hum. Evol. 15, 783–822 (1986).
63. Teaford, M. F. & Oyen, O. J. Differences in the Rate of Molar Wear between Monkeys Raised on Different Diets. J. Dent. Res. 68,
1513–1518 (1989).
64. Fernández-García, M. & López-García, J. M. Palaeoecology and biochronology based on the rodents analysis from the Late
Pleistocene/Holocene of Toll Cave (Moià, Barcelona). Spanish J. Palaeontol. 28, 227–238 (2013).
65. Rosell, J. et al. Els óssos hibernen, els neandertals passen: Noves dades sobre els desplaçaments per la Catalunya Central dels grups
humans del Paleolític mig a partir dels resultats de les coves del Toll i de les Teixoneres (Moià, Bages). In Actes III Jornades
d’Arqueologia de la Catalunya Central 2014 (ed. Blasco, M. A.) 95–99 (Generalitat de Catalunya, Departament de Cultura, 2015).
66. Rosell, J. et al. Compartint l’espai: la interacció entre homínids i carnívors al nord-est peninsular (Cova del Toll i Cova de les
Teixoneres, Moià, Bages). In Actes I Jornades d’Arqueologia de La Catalunya Central 2010 (eds Argemí, M. et al.) 47–51 (Generalitat
de Catalunya, Departament de Cultura, 2012).
67. Rosell, J. et al. Cova del Toll y Cova de les Teixoneres, Moià, Barcelona. in Los cazadores recolectores del Pleistoceno y del Holoceno
en Iberia y el Estrecho de Gibraltar: Estado actual del conocimiento del registro arqueológico (ed. Sala Ramos, R.) 302–307
(Universidad de Burgos, 2014).
68. Van Klinken, G. J. Bone collagen quality indicators for palaeodietary and radiocarbon measurements. J. Archaeol. Sci. 26, 687–695
(1999).
69. Ambrose, S. H. Preparation and characterization of bone and tooth collagen for isotopic analysis. J. Archaeol. Sci. 17, 431–451
(1990).
70. Ambrose, S. H. & Norr, L. Experimental evidence for the relationship of the carbon isotope ratios of whole diet and dietary protein
to those of bone collagen and carbonate. in Prehistoric Human Bone: Archaeology at the Molecular Level (eds Lambert, J. B. &
Grupe, G.) 1–37, https://doi.org/10.1007/978-3-662-02894-0 (Springer-Verlag, 1993).
71. Männel, T. T., Auerswald, K. & Schnyder, H. Altitudinal gradients of grassland carbon and nitrogen isotope composition are
recorded in the hair of grazers. Glob. Ecol. Biogeogr. 16, 583–592 (2007).
72. Kromer, B., Lindauer, S., Synal, H. A. & Wacker, L. MAMS - A new AMS facility at the Curt-Engelhorn-Centre for Achaeometry,
Mannheim, Germany. Nucl. Instruments Methods Phys. Res. Sect. B Beam Interact. with Mater. Atoms 294, 11–13 (2013).
73. Reimer, P. et al. IntCal13 and Marine13 Radiocarbon Age Calibration Curves 0–50,000 Years cal BP. Radiocarbon 55, 1869–1887
(2013).
74. Ramsey, C. B. Bayesian Analysis of Radiocarbon dates. Radiocarbon 51, 337–360 (2009).
75. Ambrose, S. H. & DeNiro, M. J. Climate and habitat reconstruction using stable carbon and nitrogen isotope ratios of collagen in
prehistoric herbivore teeth from Kenya. Quat. Res. 31, 407–422 (1989).
76. Allué, E. et al. Cova del Toll (Moià, Bages): Perspectiva paleoambiental i arqueobotànica del Plistocè i Holocè. Quad. Prehistòria
Catalana 21–38 (2013).
77. Koch, P. L., Fogel, M. L. & Tuross, N. Tracing the diets of fossil animals using stable isotopes. In Stable isotopes in ecology and
environmental Science (eds Lajtha, K. & Michener, R.) 63–92 (Blackwell Scientific Publications, 1994).
78. Strasburger, E. et al. Tratado de botánica. (OMEGA, 1994).
79. Salisbury, F. B. & Ross, C. W. Plant Physiology, Hormones and Plant Regulators: Auxins and Gibberellins. (Wadsworth Publishing,
1992).
80. Faegri, K. & Iversen, J. Textbook of Pollen Analysis. (John Wiley and Sons, 1989).
81. Moore, P. D., Webb, J. A. & Collinson, M. E. Pollen analysis. (Wiley-Blackwell, 1991).
Scientific Reports | (2019) 9:5716 | https://doi.org/10.1038/s41598-019-42152-7 11You can also read