Heavy reliance on plants for Romanian cave bears evidenced by amino acid nitrogen isotope analysis
←
→
Page content transcription
If your browser does not render page correctly, please read the page content below
www.nature.com/scientificreports

            OPEN           Heavy reliance on plants for
                           Romanian cave bears evidenced
                           by amino acid nitrogen isotope
                           analysis
                           Yuichi I. Naito 1,2*, Ioana N. Meleg3*, Marius Robu 3, Marius Vlaicu3, Dorothée G. Drucker                        4
                                                                                                                                                 ,
                           Christoph Wißing1, Michael Hofreiter5, Axel Barlow 5,6 & Hervé Bocherens 1,4
                           Heavy reliance on plants is rare in Carnivora and mostly limited to relatively small species in subtropical
                           settings. The feeding behaviors of extinct cave bears living during Pleistocene cold periods at middle
                           latitudes have been intensely studied using various approaches including isotopic analyses of fossil
                           collagen. In contrast to cave bears from all other regions in Europe, some individuals from Romania
                           show exceptionally high δ15N values that might be indicative of meat consumption. Herbivory on
                           plants with high δ15N values cannot be ruled out based on this method, however. Here we apply an
                           approach using the δ15N values of individual amino acids from collagen that offsets the baseline δ15N
                           variation among environments. The analysis yielded strong signals of reliance on plants for Romanian
                           cave bears based on the δ15N values of glutamate and phenylalanine. These results could suggest that
                           the high variability in bulk collagen δ15N values observed among cave bears in Romania reflects niche
                           partitioning but in a general trophic context of herbivory.

                           Bears represent the largest terrestrial members within the Carnivora alive today and the vast majority of
                           them have carnivorous or omnivorous feeding habits. Until around 25,000 years ago, the coldest period in the
                           Pleistocene, additional, now extinct bear species were living1–4, among which the so-called cave bears, a very large
                           type of bear that formed the sister lineage of extant brown bears and polar bears (e.g., ref. 5). The paradox of the
                           cave bear is that their diet has been said to be herbivorous despite their large body sizes while extant herbivorous
                           Carnivora species are smaller6,7. After their divergence from the brown bear lineage 1.2–1.6 million years ago,
                           cave bear populations showed substantial morphological and genetic variability and multiple forms have been
                           recognized8, although their taxonomic status and the relationships among them continue to be debated9. The
                           possible causes of the extinction of these bears are also intensively debated, involving climate change, human
                           impacts, and (lack of) flexibility in feeding behavior10–15. Understanding cave bear feeding behavior is therefore
                           important as it might give insights into the extinction of this species, and also it could be relevant for the conser-
                           vation of extant, herbivorous carnivoran species that are under threat of extinction (e.g., binturong, red panda,
                           giant panda16,17).
                               More recent studies have shown mixed results based on different lines of evidence including anatomical prop-
                           erties like craniodental morphologies, tooth wear analyses, mortality patterns (e.g., sex ratio), etc. wherein the
                           conclusions were highly context dependent and differed by sample-sets18–23. This is also the case for stable carbon
                           and nitrogen isotope analyses (δ13C and δ15N) on collagen extracted from bone/teeth24–31. Relatively low δ15N
                           values of most of these bears so far indicate their highly-plant-dependent feeding habits with possible exceptions
                           for some groups in today’s Romania that exhibited relatively high δ15N values30,32,33. The δ15N value of bulk bone/

                           1
                             Department of Geosciences, Biogeology, University of Tübingen, Hölderlinstraße 12, 72074, Tübingen, Germany.
                           2
                            Nagoya University Museum, Nagoya University, Furo-cho, Chikusa-ku, Nagoya, 464-8601, Japan. 3“Emil Racoviță”
                           Institute of Speleology, Romanian Academy, Calea 13 Septembrie, nr. 13, 050711, Sector 5, Bucharest, Romania.
                           4
                            Senckenberg Centre for Human Evolution and Palaeoenvironment (S-HEP), University of Tübingen, Hölderlinstraße
                           12, 72074, Tübingen, Germany. 5Institute for Biochemistry and Biology, Faculty for Mathematics and Natural
                           Sciences, University of Potsdam, Karl-Liebknecht-Str. 24-25, 14476, Potsdam, OT Golm, Germany. 6School of
                           Science and Technology, Nottingham Trent University, Clifton Lane, Nottingham, NG11 8NS, UK. *email: ynaito@
                           num.nagoya-u.ac.jp; ioana.meleg@gmail.com

Scientific Reports |   (2020) 10:6612 | https://doi.org/10.1038/s41598-020-62990-0                                                               1
www.nature.com/scientificreports/ www.nature.com/scientificreports
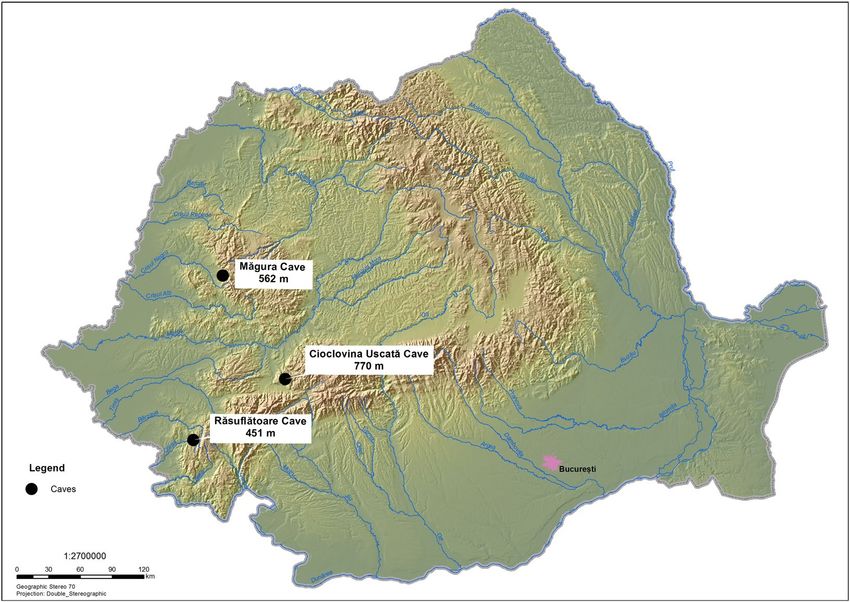
Figure 1. Map showing locations of the cave sites in Romania mentioned in the text.
teeth collagen is known to increase from prey to its consumer in a food web, thus being an important indicator to
evaluate the trophic position of organisms34,35. Other factors also influence δ15N values of collagen, such as varia-
bility in the consumed plants and environmental factors including climate36–38, leading to possible spatiotemporal
shifts of the isotopic baseline due to heterogeneities among local environments39–42. Hence, some herbivores may
exhibit similar δ15N values as predatory species in the same context30,43–45.
To solve this uncertainty, a new isotopic approach has been developed. Indeed, it has been demonstrated that
δ15N values of individual amino acids (AA) can be classified into several categories, “trophic” and “source” AAs
that exhibit more 15N enrichment and less/little 15N enrichment, respectively, in each trophic step of food webs46–53.
It is worth mentioning that the comparison of the “source” AAs like phenylalanine (Phe) with the “trophic” AAs
like glutamate (Glx) enables the evaluation of animal trophic position regardless of baseline δ15N fluctuations in
ecosystems54. We aim at testing the two hypotheses that high collagen δ15N values observed for cave bears in the
Romanian region were attributed to (i) omnivorous/carnivorous feeding behavior associated with a trophic level
effect as a corollary or (ii) consumption of plants with high bulk δ15N values. To this end, δ15N values of individual
AAs in collagen were measured for adult cave bears from several sites in this region (Fig. 1). One cave lion and
one horse have been analyzed together with the adult cave bear collagen to represent end-members for trophic
positions for a terrestrial carnivore and a terrestrial herbivore in the Late Pleistocene.
Results
Judging from the C content (26.0–46.1%), N content (9.1–16.2%) and C/N atomic ratio (3.3–3.5), all the cave
bear as well as the cave lion and horse bone collagen are well preserved (Table 1)55,56. Large variations in δ13C and
δ15N values of bulk collagen for the cave bears were observed: −19.9 to −22.3‰ for δ13C and 5.2 to 9.8‰ for δ15N
values, respectively (Fig. 2). The bears sampled from each cave corresponded to different time horizons. Out of
six cave bear samples, two have been molecular dated (USR10 from Măgura cave and USR67 from Răsuflătoarei
cave), and the other four have been radiocarbon dated (Table 1). Based on calibrated 14C age and the mean of the
posterior samples for molecular dated samples, ages of the samples from Măgura fell within the interval 28–31
ka BP, while the oldest bears were from Cioclovina Uscată with 14C ages of c. 43 and 48 cal ka BP. The samples
from Răsuflătoarei cover a wider time-span (20–49 ka BP), due to the wide confidence interval depicted based
on molecular tip dating, given that USR67 is the only representative within its clade. In each cave and related
timespan, both high (above 8‰) and lower δ15N values of bulk collagen have been recorded (see more details in
Table 1).
Strong correlations between the δ15N values of several AAs and those of bulk collagen were observed for the
investigated cave bears, among which phenylalanine showed the strongest one (R2 = 0.926, P < 0.01). Other AA
such as hydroxyproline (R2 = 0.704, P < 0.05) also showed strong correlations with bulk collagen δ15N values. The
scatterplot presenting δ15NPhe vs. δ15NGlx values shows that some cave bear individuals from the Romanian caves
exhibited isotope values similar to those analyzed in previous studies for cave bears from Late Pleistocene Belgian
sites, though three individuals with bulk collagen δ15N values above +8‰ analyzed in our study exhibited higher
Scientific Reports | (2020) 10:6612 | https://doi.org/10.1038/s41598-020-62990-0 2www.nature.com/scientificreports/ www.nature.com/scientificreports
Uncalibrated 14C Calibrated dates (95.4%) (cal
Common name/ date/Molecular tip BC)/95% credibility interval Lab. C/N
Lab. ID Species name Site *
date (yrs BP) for molecular estimates* number d13C (‰) d15N (‰) %C %N atom
USR10 Cave bear/− Măgura 30,866* 28,885-32,518* — −22.0 6.3 26.0 9.1 3.3
USR11 Cave bear/− Măgura 24,615 ± 101 28,392-28,891 ETH-87394 −22.1 8.1 36.8 12.3 3.5
USR22 Cave bear/− Cioclovina Uscată 40,567 ± 594 43,125-45,230 ETH-87395 −22.0 5.2 33.9 11.8 3.3
USR25 Cave bear/− Cioclovina Uscată 43,119 ± 807 44,990-48,401 ETH-87396 −22.3 8.9 36.7 12.9 3.3
USR65 Cave bear/− Răsuflătoarei 31,005 ± 183 34,541-35,333 ETH-95736 −21.8 9.8 38.3 13.5 3.3
USR67 Cave bear/− Răsuflătoarei 38,313* 19,932-49,692* — −19.9 5.4 46.1 16.2 3.3
Reference fauna
Horse /Equus
LOM 16 Lommersum −20.9 4.2 38.8 13.7 3.3
ferus
Cave lion
Leo 01 /Panthera North Sea 37110 ± 1070 −19.5 8.3 36.8 13.1 3.3
spelaea
Table 1. Collagen samples for cave bears from the three Romanian caves and reference fauna analyzed in this
study.
a b
20
10
Mammoth (Belgium)
15
δ15NCollagen (‰)
Mammoth (Crimea)
δ15NGlx (‰)
8 Cave lion (This study)
10 Horse (This study)
Goyet cave
6 Scladina cave
5
This study
4 0
-23 -22 -21 -20 -19 0 5 10 15 20
δ CCollagen (‰)
13 δ NPhe (‰)
15
c d
10 10
δ15NCollagen (‰)
δ15NCollagen (‰)
8 8
R2 = 0.926 R2 = 0.642
6 6
4 4
8 10 12 14 16 8 10 12 14 16
δ15NPhe (‰) δ15NGlx (‰)
Figure 2. Isotope results for the cave bears investigated from the three cave sites in Romania. Scatterplots of: (a)
δ13C and δ15N values of bulk collagen; (b) δ15N values of glutamate and phenylalanine. The solid lines indicate
the theoretical lines for TP = 2 and TP = 3, respectively, in terrestrial C3-vascular-plant ecosystems. The spacing
between these lines indicate the inter trophic enrichment (see Methods). Values for mammoth and cave bears
from Belgium were taken from the literature57,58,60; (c) δ15N values of bulk bone collagen and phenylalanine; (d)
δ15N values of bulk collagen and glutamate.
δ15NPhe values than the others without any overlaps. Most relevant for this study are the canonical trophic position
(TP; 1 = primary producers, 2 = primary consumers, 3 = secondary consumers, etc…) estimates based on eqn. 1
(see Methods section) indicating that all cave bears, including those with high δ15N values for their bulk collagen,
had a TP around 2 (TP = 1.8–2.2), similar to published TP-values for cave bears from other sites (Supplementary
Table 1).
Scientific Reports | (2020) 10:6612 | https://doi.org/10.1038/s41598-020-62990-0 3www.nature.com/scientificreports/ www.nature.com/scientificreports
Figure 3. Carbon and nitrogen isotopic composition of bulk collagen for cave bears from the Romanian region.
Ellipses indicate 90% and 50% confidence intervals for isotopic compositions of the cave bears analyzed in this
study; except for a few individuals like the one with values plotted at the right-upper corner, many cave bears
with δ15N value of collagen around 7–8‰ that might be interpreted as an omnivorous/carnivorous signal can be
categorized to highly-plant-dependent feeders.
Discussion
Feeding behavior of the cave bears based on AA δ15N values. The bulk collagen δ13C and δ15N val-
ues are within the range of published data for cave bears from Romanian caves in general (Fig. 3)24,26. Thus, the
isotopic results that were obtained on single AAs in the present study are likely to apply also to most other cave
bears from Romania, including the ones claimed to have been omnivores, carnivores or piscivores, based on the
high δ15N values of their bulk collagen. Our results rule out at least the following possibilities; (i) significant con-
tribution of aquatic resources such as fish to their diets; (ii) carnivory as the main feeding behaviour54. The TP
estimates for all individuals based on δ15N of glutamate and phenylalanine were around 2, which rather indicates
a highly plant-dependent feeding behavior for all the analyzed cave bears, including those with a high δ15N value
of their bulk collagen.
The strongest correlation was observed between the δ15N value of bulk bone collagen and the δ15N value of
phenylalanine that represents δ15N of the nitrogen source in a food web. This indicates that the bulk collagen δ15N
values of the Romanian cave bears reported here can be explained by the following two possibilities, that are not
mutually exclusive: (i) a δ15N shift of the baseline in this local ecosystem, and/or (ii) the consumption of some
specific plants with high δ15N values by these cave bear individuals. This means that the reported high δ15N values
in the Romanian cave bears’ bulk collagen can be explained by the exclusive consumption of plants rather than
by the trophic level effect caused by consumption of animal meat. As shown in Fig. 2, δ15NGlx and δ15NPhe values
for some individuals, especially the ones with high bulk δ15N values, overlap with those of strictly herbivorous
species, such as late Pleistocene mammoths from other regions, suggesting that a purely herbivorous species
could exhibit such carbon and nitrogen isotopic values of bulk collagen in this palaeoenvironmental context57,58.
It was shown that there is currently a potential error of ~0.3 units for the TP estimation calculated by the prop-
agation of errors for each parameter in eqn.159. Considering this error together with a general offset of 0.1–0.2
(accuracy) between calculated TP based on eqn.1 and known TP that were estimated based on well-controlled
field observations or laboratory feeding experiments for extant animals, our estimates for all individuals are well
within the range of acceptable values for herbivorous mammals. In addition to predatory carnivores, fossils that
so far yielded TP-values above 2.3 originate from brown bears, wild boars, foxes and badgers54,60, in contrast to
the cave bears with TPs less than 2.2 analyzed in the present study.
The question remains which kind of plants could have been consumed by the cave bears with bulk collagen
high δ15N values. Mammoth and some Pleistocene fallow deer have been found to exhibit higher δ15N value and
lower δ13C values relative to the other coeval herbivorous species43,44. Some horses from the Late Pleistocene of
western Germany also exhibited similar high δ15N and low δ13C values and are interpreted as having the same
ecological niche as mammoths61,62. It is conceivable that the cave bears with high bone collagen δ15N values fed on
plants, since the high values were also found in species with indisputable herbivorous dietary behavior. Possible
candidates of such plants with high bulk δ15N value consumed by cave bears were those consumed by some fallow
deer in the Pleistocene44, while those consumed by mammoth such as dry, mature grasses and sedges were less
likely based on the lower resistance of cave bear teeth against abrasion. Mushrooms, another plant food with high
δ15N values, can be also excluded as an explanation for the high δ15N values of some cave bears for the two follow-
ing reasons: (1) mushrooms typically have high δ15N and high δ13C values (not low δ13C values), (2) mushrooms
are consumers, like animals, and they display a trophic position value higher than 252, therefore their consump-
tion would lead to a TP significantly higher than 2.
Scientific Reports | (2020) 10:6612 | https://doi.org/10.1038/s41598-020-62990-0 4www.nature.com/scientificreports/ www.nature.com/scientificreports
One additional factor specific to bears that has to be considered is hibernation, since unlike the other mam-
malian taxa discussed above, including Homo sapiens, bears hibernate. Indeed, it has been demonstrated that a
longer hibernation period caused by climate cooling could result in higher δ15N of cave bear bulk collagen63,64.
Although we did not see any statistically significant chronological trend in δ15N values of AAs, only a limited
number of individuals have been analyzed so far with this approach. Further investigations on the possible influ-
ence of this factor on the δ15N values of individual AAs of Ursids should be performed on more extinct cave bears
as well as extant bears in order to clarify how nitrogen metabolism such as urea recycling during hibernation pos-
sibly affects the δ15N of AAs in bone collagen65,66. Yet, our data currently does not support a major physiological
control of the high bulk collagen δ15N value in bone that remodels intensively during the warm season30.
Evolution of feeding behavior and niche partitioning among cave bear populations. Despite
a predominantly herbivorous diet, Romanian cave bears exhibit a very large variation of their isotopic values
that probably reflects ecological differences. Such isotopic differences in bone collagen reflect long-term dietary
differences, since the turnover of collagen is slow in bone, averaging diet isotopic composition over many years67.
It is possible that, in contrast to other regions of Europe, the absence of mammoths played a role in allowing cave
bears to have access to a more diverse feeding niche and that competition was stronger among cave bears in Late
Pleistocene Romania than in other regions, although an exact contemporaneity between the populations with
diverse bulk collagen δ15N values must be examined. If the observed variability in δ15N values of bulk collagen
among the Romanian cave bears was the result of high competition among cave bears in a context of a feeding
niche restricted to herbivory, it is possible that some individuals specialized on other plants rather than turned to
omnivory including animal food resources. Such a dietary strategy is a very unusual case among bears. Assuming
that the herbivory for individual cave bears observed in our study was a general trait across all Late Pleistocene
cave bear taxa, the most parsimonious interpretation would be the loss of omnivorous feeding behavior after the
divergence of cave bears from the brown/polar bear lineage and before the basal divergence of cave bear lineages
(e.g., U. ingressus and U. spelaeus; see also low bulk δ15N values for U. kudarensis68). However, it still remains an
open question why this extinct animal that could live over a wide geographical range reaching Transbaikalia
in Eastern Siberia with diverse ecological conditions within the mammoth steppe ecosystem finally became
extinct69,70. It is possible that a dietary adaptation similar to that seen in extant giant panda that consumes large
quantities of bamboos but has a macronutrient profile, namely the percent of energy derived from protein, similar
to that of carnivores, might have facilitated the full shift for the cave bear lineage towards highly plant-dependent
feeding behavior while keeping some ecological plasticity in the mammoth steppe71.
Our findings have interesting implications regarding the evolution of herbivory among carnivorans. The for-
aging strategy of an animal is largely determined by body mass via energetic needs72. Cave bear populations were
likely adapted to their local habitats, with different altitudes being associated with different features, such as body
size, tooth morphology, and tooth wear patterns (e.g., ref. 21,33,73). Although the tooth microwear and the isotopic
composition of bone collagen reflect the diet of the analyzed individuals at different pre-mortem time periods
(e.g., several weeks vs several years or more before the death74), the observed variation in the bulk collagen δ15N
values for cave bears in the Romanian region possibly reflected a difference in foraging strategy on plants asso-
ciated with different body sizes24. Extant Carnivora species with herbivorous feeding behavior (giant panda, red
panda and binturong) have smaller body size and live only in temperate and tropical/subtropical Asia, high-
lighting the paradox of cave bears that had much larger body sizes and lived in a colder and drier environment.
Besides, these three extant species are all on very long evolutionary branches, namely they diverged more than 10
million years ago from their closest relatives. Cave bears, in contrast, share a much more recent ancestor within
an omnivorous/carnivorous clade, which is another ecological paradox of this extinct taxon. It is possible that the
modern herbivorous carnivorans are relicts of a dietary trend that was much more widespread in the past, and
that their rarity is rather due to the recent extinction of the large mammalian species rather than to the impossi-
bility for Carnivora to have a diet restricted to plant food. Our results emphasize the need to investigate more in
detail the diversity in food sources, especially plants, consumed by cave bears, as a unique case among Carnivora
to further understand the benefits, costs and limitations of herbivory.
Conclusions
A highly plant-dependent feeding behavior for cave bears was demonstrated by the TP estimates based on δ15NGlx
and δ15NPhe values. The high δ15N of bulk bone collagen of some cave bears can be explained by a higher δ15N
baseline of the exploited food chain that is reflected in the δ15NPhe values, namely plants with high δ15N values.
Therefore, the high δ15N value of bulk collagen of some cave bears in the Romanian region, a unique feature
compared to cave bears from the other regions of Europe analyzed so far, can be explained by the consumption
of plants. Further research is needed to clarify which plant species were eaten by those cave bears by using other
approaches such as δ13C analysis of individual AAs to identify protein sources75,76. It is also of importance to see if
this trend towards herbivory was common for other cave bear populations from broader regions including Asia.
Methods
Samples. The Romanian cave sites of Măgura, Cioclovina and Răsuflătoarei, among others, yielded skel-
etal remains of cave bears77. Well-preserved bone specimens of cave bears from these three sites allowed us to
examine the feeding behavior of the individuals from the Romanian region. Măgura (46.53169, 22.595969) is a
1,500m-long cave located in the eastern part of the Sighiștel valley part of the Apuseni Natural Park; Cioclovina
Uscată (45.576628, 23.134228) is a 2,002m-long cave formed in the Early Cretaceous reef limestones of the
Luncani karst platform and situated on the foot of the Southern Carpathians, in the Grădiștea-Muncelului
Cioclovina Natural Park; Răsuflătoare cave (45.187800, 21.928000) is located in Caraş-Severin County, Banat
Mountains and is a part of the Semenic-Cheile Carașului National Park.
Scientific Reports | (2020) 10:6612 | https://doi.org/10.1038/s41598-020-62990-0 5www.nature.com/scientificreports/ www.nature.com/scientificreports
Bone collagen from 6 adult cave bears from the three caves was subjected to δ13C and δ15N analysis as well as
AA-specific δ15N analysis. One cave lion collagen sample from the North Sea, an area that was terrestrial during
the Late Pleistocene and one horse sample from the site of Lommersum (Germany) from the late Pleistocene,
have been analyzed together with the cave bear collagen using the same analytical protocol.
Collagen extraction and bulk isotopic analysis. The samples were washed in an ultrasonic bath in
acetone, rinsed several times with demineralized water, dried at 35 °C for 72 h and crushed to powder of 0.7 mm
grain size. Collagen extraction was performed after ref. 78 with a minor modification as described in ref. 79. In
summary, this acid-base-acid method includes a first step of demineralization with 1 M HCl, a second step in
0.125 M NaOH to remove humic acids and lipids, and a final step of gelatinization at pH 2 during 17 h at 100 °C.
Isotopic measurements were done using an NC2500 elemental analyzer connected to a Thermo Quest Delta þ XL
mass spectrometer. Using the ‘δ’ (delta) value, the isotopic compositions are expressed as follows: δ (‰) ≡ 103
[Rsample/Rstandard − 1], where the R denotes the 13C/12C ratio for carbon and the 15N/14N ratio for nitrogen, with the
international reference (standards) being V-PDB for δ13C values and atmospheric nitrogen (AIR) for δ15N values.
Isotopic measurements were normalized to δ13C values of USGS24 (δ13C = −16.00‰) and to δ15N values of IAEA
305 A (δ15N = +39.80‰). The reproducibility was ±0.1‰ for δ13C measurements and ±0.2‰ for δ15N measure-
ments, based on one standard-deviation of the mean of multiple analyses of purified collagen from modern bones
and international standards.
Analytical conditions for δ15N values of AAs. Bone collagen extracted from the bone samples was
hydrolysed with 12 N HCl at 110 °C for 12 h, and derivatized with thionyl chloride/2-propanol (1:4, v/v) at 110 °C
for 2 h and subsequently pivaloyl chloride/dichloromethane (1:4, v/v) at 110 °C for 2 h. The δ15N values of the
individual AA derivatives were measured at University of Tübingen using the following systems; A gas chro-
matography/IRMS (GC/IRMS) using an Agilent Technology 7890B GC coupled to an Elementar Isoprime100
IRMS (Elementar, Germany) via combustion and reduction furnaces. AA derivatives were injected into the GC
column (Ultra-2, 50 m × 0.32 mm-i.d. 0.52-µm film thickness; Agilent Technology) in splitless mode at 275 °C.
The GC oven temperature was programmed as follows: isothermal hold at 40 °C for 3 min; temperature ramp to
110 °C at 15 °C min−1; ramp to 150 °C at 3 °C min−1; ramp to 240 °C at 2.5 °C min−1; ramp to 270 °C at 6 °C min−1;
and subsequent holding isothermally at 270 °C for 4 min. Carrier gas (He) flow rate through the GC column was
1.4 ml min−1. The CO2 generated in the combustion furnace was eliminated by a liquid nitrogen trap. Standard
mixtures of ten AAs with known δ15N values were injected into the GC/IRMS every two to five runs to confirm
reproducibility of the isotope measurements. The precision of the reference mixtures was 0.65–0.90‰. Nitrogen
isotopic composition of maximally the following eight AAs was determined as their N2 gas peaks from deriva-
tives showed fine resolution on the GC/IRMS chromatogram: valine (Val), leucine (Leu), isoleucine (Ile), proline
(Pro), serine (Ser), glutamate (Glx), phenylalanine (Phe) and hydroxyproline (Hyp). All reported δ15N values for
glutamate included the contributions from the α-amino group of glutamic acid and glutamine, as glutamine is
converted to glutamic acid during acid hydrolysis. Data for alanine and glycine were not obtained for all samples
due to relatively large peak sizes in this study.
Using the equation below based on δ15N of glutamate and phenylalanine, we estimated the trophic position
of cave bears in terrestrial C3-plant-based ecosystem: TP = [(δ15NGlx − δ15NPhe − β)/TDF] + 1 (eqn. 1), where
δ15NGlx, δ15NPhe, β and TDF indicate δ15N of glutamate, δ15N of phenylalanine and the isotopic offset between
glutamate and phenylalanine (δ15NGlx − δ15NPhe value) in primary producers, the trophic discrimination fac-
tor, respectively60. The values in the equation are based on the fact that some “source” AAs show little isotopic
change through each trophic step (e.g. 0.4 ± 0.4‰ for phenylalanine) whereas other “trophic” AAs fractionate
with trophic steps (e.g. 8.0 ± 1.1‰ for glutamate)47–49. We adopted 8.4‰ for the β value for terrestrial C3 vascular
plants49,80, and 7.2‰ for the TDF value81, in this study.
Radiocarbon dating. Cave bear collagen was dated directly using AMS radiocarbon dating. Radiocarbon
dating was performed by the Labor für Ionenstrahlphysik at Eidgenössische Technische Hochschule—ETH in
Zurich (Switzerland). The obtained radiocarbon ages were calibrated using the OxCal v4.2.4 software using the
IntCal13 atmospheric curve82,83. All dates were calibrated to BP dates with 2σ (95.4%) probability.
Inferring molecular ages
Ancient DNA extraction and library building. For two samples lacking radiocarbon dates (USR10 and
USR67), molecular tip-dating was performed. DNA was extracted from 50 mg of cave bear petrous bones follow-
ing the protocol of ref. 84, with reduced centrifugation speeds as described in ref. 85. Prior to library building, each
DNA extract has been quantified with the Qubit 2.0 fluorometer with high sensitivity reagents (Thermo Fisher
Scientific) by using one microlitre out of 25 μL extract. To support the validity of the measurements, positive and
negative controls were also measured. Illumina single-stranded libraries were then prepared following the proto-
col of ref. 86, after the removal of uracil residues and abasic sites. The optimal number of library amplification PCR
cycles has been assessed with qPCR as described in ref. 85. A volume of 80 μL including 20 μL template library,
Accuprime Pfx DNA polymerase and eight base-pair tailed-primers was used for Indexing PCR to generate
dual-indexed library molecules. Amplified libraries were purified using commercial silica spin-columns (Qiagen
MinElute). Prior to single-end sequencing on Illumina platforms, library concentration and length distribution
were quantified using Qubit 2.0 and 2200 TapeStation (Agilent Technologies), respectively.
Sequencing and bioinformatic analyses. Shotgun sequencing was performed on an Illumina NextSeq
500 sequencing platform. We obtained 75 bp single-end reads using the NextSeq 500/550 High Output Kit v2 (75
cycles) sequencing kit, following the procedures described in ref. 87. Raw reads were trimmed with minimum
overlap of one nucleotide and reads shorter than 30 bp were discarded using cutadapt v1.1288. The processed reads
Scientific Reports | (2020) 10:6612 | https://doi.org/10.1038/s41598-020-62990-0 6www.nature.com/scientificreports/ www.nature.com/scientificreports
were mapped to the reference mitogenome sequence of Ursus spelaeus (Genbank Acc. No. EU327344, ref. 89) with
default parameters using the bwa v0.7.15 “aln” algorithm90. The alignment was then filtered for mapping quality
(Q > 30), sorted by read position and potential PCR duplicates were removed using SAMtools v0.1.1990.
Mitochondrial genome reconstruction and alignment. ANGSDv0.920 was used to generate consen-
sus sequences for both individuals91. Using the option -doFasta 3 that takes into account bases with highest
effective depth92, the mitochondrial consensus has been constructed only considering read mapping and Phred
base quality scores >30. The two mitogenomes were aligned to a published alignment of cave bear mitochon-
drial sequences15. The repetitive section of the d-loop was removed from the alignment because it could not be
aligned unambiguously. The final alignment comprised 19 sequences of 16,468 nucleotides, publicly available
(Dryad database and GenBank). The GenBank accession numbers of the mitogenomes generated in this study
are: MN311249 for USR10 and MN311250 for USR67.
Molecular tip-dating. Ages of the two samples were estimated using Bayesian phylogenetic tip dating93,
a method shown to provide accurate age estimates for Late Pleistocene European cave bears15. PartitionFinder
v.2.1.1 has been used for data partitioning and substitution model selection94. All substitution models availa-
ble in BEAST v.1.8.2 were considered and the best partitioning scheme has been computed under the Bayesian
Information Criterion using linked branch lengths and the greedy search algorithm (Supplementary Table 2)95.
Tip-dating was performed separately for each sample by analyzing its mitochondrial sequence in BEAST
v1.8.2, using median 14C dates as calibration from the dataset in ref. 15 (Supplementary Tables 3). For each tip
date its posterior distribution has been sampled using a uniform, uninformative prior of zero to one million yBP.
To accommodate changes in effective population size during the time-span of the tree, a piecewise-constant coa-
lescent Bayesian Skyline population model was selected. Unlinked strict molecular clocks were set for each data
partition with the posterior distribution of the substitution rate of each sample with a uniform, uninformative
prior of zero to 20% mutations per million years. The software Tracer v1.6 was used to assess if the MCMC chain
had run for a sufficient length to achieve burn-in and adequate sampling of all parameters (ESS > 200)96. The
Maximum Clade Credibility Tree was selected from the posterior sample using TreeAnnotator and visualised in
FigTree (Supplementary Fig. 1).
Received: 24 September 2019; Accepted: 19 March 2020;
Published: xx xx xxxx
References
1. Bocherens, H. et al. The last of its kind? Radiocarbon, ancient DNA and stable isotope evidence from a late cave bear (Ursus spelaeus
ROSENMÜLLER, 1794) from Rochedane (France). Quat. Int. 339–340, 179–188 (2014).
2. Baca, M. et al. Retreat and extinction of the Late Pleistocene cave bear (Ursus spelaeus sensu lato). Sci. Nat. 103 (2016).
3. Pacher, M. & Stuart, A. J. Extinction chronology and palaeobiology of the cave bear (Ursus spelaeus). Boreas 38, 189–206 (2009).
4. Terlato, G. et al. Chronological and Isotopic data support a revision for the timing of cave bear extinction in Mediterranean. Europe.
Hist. Biol. 2963, 1–11 (2018).
5. Krause, J. et al. Mitochondrial genomes reveal an explosive radiation of extinct and extant bears near the Miocene-Pliocene
boundary. BMC Evol. Biol. 8, 1–12 (2008).
6. Christiansen, P. What size were Arctodus simus and Ursus spelaeus (Carnivora: Ursidae)? Annales Zoologici Fennici 36, 93–102
(1999).
7. Kurtén, B. The Cave Bears Story: Life and Death of a Vanished Animal. (Columbia University Press, 1976).
8. Stiller, M. et al. Mitochondrial DNA diversity and evolution of the Pleistocene cave bear complex. Quat. Int. 339–340, 224–231
(2014).
9. Barlow, A. et al. Partial genomic survival of cave bears in living brown bears. Nat. Ecol. Evol. 2, 1563–1570 (2018).
10. Mondanaro, A. et al. Additive effects of climate change and human hunting explain population decline and extinction in cave bears.
Boreas 48, 605–615 (2019).
11. Cooper, A. et al. Abrupt warming events drove Late Pleistocene Holarctic megafaunal turnover. Science 349, 602–606 (2015).
12. Barnosky, A. D., Koch, P. L., Feranec, R. S., Wing, S. L. & Shabel, A. B. Assessing the causes of late Pleistocene extinctions on the
continents. Science 306, 70–75 (2004).
13. Beilman, D. W. et al. Pattern of extinction of the woolly mammoth in Beringia. Nat. Commun. 3, 893 (2012).
14. Kosintsev, P. et al. Evolution and extinction of the giant rhinoceros Elasmotherium sibiricum sheds light on late Quaternary
megafaunal extinctions. Nat. Ecol. Evol. 3, 31–38 (2019).
15. Fortes, G. G. et al. Ancient DNA reveals differences in behaviour and sociality between brown bears and extinct cave bears. Molec.
Ecol. 25, 4907–4918 (2016).
16. Wei, F. et al. Progress in the ecology and conservation of giant pandas. Conserv. Biol. 29, 1497–1507 (2015).
17. Dietl, G. P. & Flessa, K. W. Conservation paleobiology: putting the dead to work. Trends Ecol. Evol. 26, 30–37 (2011).
18. Figueirido, B., Palmqvist, P. & Pérez-Claros, J. A. Ecomorphological correlates of craniodental variation in bears and paleobiological
implications for extinct taxa: an approach based on geometric morphometrics. J. Zool. 277, 70–80 (2009).
19. Grandal-d’Anglade, A. Bite force of the extinct Pleistocene Cave bear Ursus spelaeus Rosenmüller from Europe. Force de la morsure
de l’ours des cavernes Ursus spelaeus Rosenmüller du Pléistocène d’Europe. Comptes Rendus Palevol 9, 31–37 (2010).
20. Peigné, S. et al. Predormancy omnivory in European cave bears evidenced by a dental microwear analysis of Ursus spelaeus from
Goyet, Belgium. Proc. Natl. Acad. Sci. USA 106, 15390–15393 (2009).
21. Peigné, S. & Merceron, G. Palaeoecology of cave bears as evidenced by dental wear analysis: a review of methods and recent findings.
Hist. Biol. 31, 448–460 (2019).
22. Münzel, S. C. et al. Behavioural ecology of Late Pleistocene bears (Ursus spelaeus, Ursus ingressus): Insight from stable isotopes (C,
N, O) and tooth microwear. Quat. Int. 339–340, 148–163 (2014).
23. Stiner, M. C. Mortality analysis of Pleistocene bears and its paleoanthropological relevance. J. Hum. Evol. 34, 303–326 (1998).
24. Robu, M. et al. Isotopic evidence for dietary flexibility among European Late Pleistocene cave bears (Ursus spelaeus). Can. J. Zool. 91,
227–234 (2013).
25. Robu, M. et al. The diverse dietary profiles of MIS 3 cave bears from the Romanian Carpathians: insights from stable isotope (δ13C
and δ15N) analysis. Palaeontology 61, 209–219 (2018).
Scientific Reports | (2020) 10:6612 | https://doi.org/10.1038/s41598-020-62990-0 7www.nature.com/scientificreports/ www.nature.com/scientificreports
26. Richards, M. P. et al. Isotopic evidence for omnivory among European cave bears: Late Pleistocene Ursus spelaeus from the Peştera
cu Oase, Romania. Proc. Natl. Acad. Sci. USA 105, 600–604 (2008).
27. Münzel, S. C., Stiller, M., Hofreiter, M., Mittnik, A. & Conard, N. J. Pleistocene bears in the Swabian Jura (Germany): Genetic
replacement, ecological displacement, extinctions and survival. Quat. Int. 245, 225–237 (2011).
28. Bocherens, H. et al. Niche partitioning between two sympatric genetically distinct cave bears (Ursus spelaeus and Ursus ingressus)
and brown bear (Ursus arctos) from Austria: Isotopic evidence from fossil bones. Quat. Int. 245, 238–248 (2011).
29. Bocherens, H., Fizet, M. & Mariotti, A. Diet, physiology and ecology of fossil mammals as inferred from stable carbon and nitrogen
isotope biogeochemistry: implications for Pleistocene bears. Palaeogeogr. Palaeoclimatol. Palaeoecol. 107, 213–225 (1994).
30. Bocherens, H. Isotopic tracking of large carnivore palaeoecology in the mammoth steppe. Quat. Sci. Rev. 117, 42–71 (2015).
31. Bocherens, H., Grandal-d’Anglade, A. & Hobson, K. A. Pitfalls in comparing modern hair and fossil bone collagen C and N isotopic
data to reconstruct ancient diets: a case study with cave bears (Ursus spelaeus). Isotopes Environ. Health Stud. 50, 291–299 (2014).
32. Bocherens, H. Isotopic insights on cave bear palaeodiet. Hist. Biol. 31, 410–421 (2019).
33. Krajcarz, M. et al. Isotopic variability of cave bears (δ15N, δ13C) across Europe during MIS 3. Quat. Sci. Rev. 131, 51–72 (2016).
34. Bocherens, H. & Drucker, D. Trophic level isotopic enrichment of carbon and nitrogen in bone collagen: case studies from recent
and ancient terrestrial ecosystems. Int. J. Osteoarchaeol. 13, 46–53 (2003).
35. Minagawa, M. & Wada, E. Stepwise enrichment of 15N along food chains: Further evidence and the relation between δ15N and
animal age. Geochim. Cosmochim. Acta 48, 1135–1140 (1984).
36. Amundson, R. et al. Global patterns of the isotopic composition of soil and plant nitrogen. Global Biogeochem. Cycles 17, 31/1–31/10
(2003).
37. Bowen, G. J. Isoscapes: spatial pattern in isotopic biogeochemistry. Annu. Rev. Earth Planet. Sci. 38, 161–187 (2010).
38. Stevens, R. E. & Hedges, R. E. Carbon and nitrogen stable isotope analysis of northwest European horse bone and tooth collagen,
40,000BP–present: Palaeoclimatic interpretations. Quat. Sci. Rev. 23, 977–991 (2004).
39. Bocherens, H., Drucker, D. G. & Madelaine, S. Evidence for a 15N positive excursion in terrestrial foodwebs at the Middle to Upper
Palaeolithic transition in south-western France: Implications for early modern human palaeodiet and palaeoenvironment. J. Hum.
Evol. 69, 31–43 (2014).
40. Drucker, D. G., Bocherens, H. & Billiou, D. Evidence for shifting environmental conditions in Southwestern France from 33000 to
15000 years ago derived from carbon-13 and nitrogen-15 natural abundances in collagen of large herbivores. Earth Planet. Sci. Lett.
216, 163–173 (2003).
41. Drucker, D. & Bocherens, H. Carbon and nitrogen stable isotopes as tracers of change in diet breadth during Middle and Upper
Palaeolithic in. Europe. Int. J. Osteoarchaeol. 14, 162–177 (2004).
42. Wißing, C., Matzerath, S., Turner, E. & Bocherens, H. Paleoecological and climatic implications of stable isotope results from late
Pleistocene bone collagen, Ziegeleigrube Coenen, Germany. Quat. Res. 84, 96–105 (2015).
43. Bocherens, H. et al. Palaeoenvironmental and palaeodietary implications of isotopic biogeochemistry of last interglacial Neanderthal
and mammal bones in Scladina Cave (Belgium). J. Archaeol. Sci. 26, 599–607 (1999).
44. Bocherens, H. Isotopic biogeochemistry and the palaeoecology of the mammoth steppe fauna. Deinsea 9, 57–76 (2003).
45. Kuitems, M. et al. Carbon and nitrogen stable isotopes of well-preserved Middle Pleistocene bone collagen from Schöningen
(Germany) and their paleoecological implications. J. Hum. Evol. 89, 105–113 (2015).
46. Mccarthy, M. D., Benner, R., Lee, C. & Fogel, M. L. Amino acid nitrogen isotopic fractionation patterns as indicators of heterotrophy
in plankton, particulate, and dissolved organic matter. Geochim. Cosmochim. Acta 71, 4727–4744 (2007).
47. McClelland, J. W. & Montoya, J. P. Trophic relationships and the nitrogen isotopic composition of amino acids in plankton. Ecology
83, 2173–2180 (2002).
48. O’Connell, T. C. ‘Trophic’ and ‘source’ amino acids in trophic estimation: a likely metabolic explanation. Oecologia 184, 317–326
(2017).
49. Chikaraishi, Y., Ogawa, N. O., Doi, H. & Ohkouchi, N. 15N/14N ratios of amino acids as a tool for studying terrestrial food webs: a
case study of terrestrial insects (bees, wasps, and hornets). Ecol. Res. 26, 835–844 (2011).
50. Chikaraishi, Y. et al. Determination of aquatic food-web structure based on compound-specific nitrogen isotopic composition of
amino acids. Limnol. Oceanogr. Methods 7, 740–750 (2009).
51. Naito, Y. I., Honch, N. V., Chikaraishi, Y., Ohkouchi, N. & Yoneda, M. Quantitative evaluation of marine protein contribution in
ancient diets based on nitrogen isotope ratios of individual amino acids in bone collagen: an investigation at the Kitakogane Jomon
site. Am. J. Phys. Anthropol. 143, 31–40 (2010).
52. Steffan, S. A. et al. Microbes are trophic analogs of animals. Proc. Natl. Acad. Sci. USA 112, 15119–15124 (2015).
53. Ohkouchi, N. et al. Advances in the application of amino acid nitrogen isotopic analysis in ecological and biogeochemical studies.
Org. Geochem. 113, 150–174 (2017).
54. Naito, Y. I. et al. An overview of methods used for the detection of aquatic resource consumption by humans: compound-specific
delta N-15 analysis of amino acids in archaeological materials. J. Archaeol. Sci. Reports 6, 720–732 (2016).
55. Ambrose, S. H. Preparation and characterization of bone and tooth collagen for isotopic analysis. J. Archaeol. Sci. 17, 431–451
(1990).
56. DeNiro, M. J. Postmortem preservation and alteration of in vivo bone collagen isotope ratios in relation to palaeodietary
reconstruction. Nature 317, 806–809 (1985).
57. Drucker, D. G. et al. Isotopic analyses suggest mammoth and plant in the diet of the oldest anatomically modern humans from far
southeast Europe. Sci. Rep. 7, 6833 (2017).
58. Naito, Y. I. et al. Ecological niche of Neanderthals from Spy Cave revealed by nitrogen isotopes of individual amino acids in collagen.
J. Hum. Evol. 93, 82–90 (2016).
59. Naito, Y. I. et al. Reply to “Comment on ‘Ecological niche of Neanderthals from Spy Cave revealed by nitrogen isotopes of individual
amino acids in collagen.’ [J. Hum. Evol. 93 (2016) 82–90]” [J. Hum. Evol. 117 (2018) 53–55]. J. Hum. Evol. 117, 56–60 (2018).
60. Naito, Y. I. et al. Evidence for herbivorous cave bears (Ursus spelaeus) in Goyet Cave, Belgium: implications for palaeodietary
reconstruction of fossil bears using amino acid δ15N approaches. J. Quat. Sci. 31, 598–606 (2016).
61. Drucker, D. G. et al. Tracking possible decline of woolly mammoth during the Gravettian in Dordogne (France) and the Ach Valley
(Germany) using multi-isotope tracking (13C, 14C, 15N, 34S, 18O). Quat. Int. 359–360, 304–317 (2015).
62. Wißing, C. et al. Stable isotopes reveal patterns of diet and mobility in the last Neandertals and first modern humans in Europe. Sci.
Rep. 9, 4433 (2019).
63. Grandal d’Anglade, A. & Mosquera, D. F. Hibernation can also cause high δ15N values in cave bears: a response to Richards et al.
Proc. Natl. Acad. Sci. USA 105, E14; author reply E15 (2008).
64. Grandal-d’Anglade, A., Pérez-Rama, M., García-Vázquez, A. & González-Fortes, G. M. The cave bear’s hibernation: reconstructing
the physiology and behaviour of an extinct animal. Hist. Biol. 31, 429–441 (2019).
65. Guppy, M. The hibernating bear: why is it so hot, and why does it cycle urea through the gut? Trends Biochem. Sci. 11, 274–276
(1986).
66. Nakashita, R. et al. Ecological application of compound-specific stable nitrogen isotope analysis of amino acids - A case study of
captive and wild bears. Reseaches Org. Geochemistry 27, 73–79 (2011).
67. Matsubayashi, J. & Tayasu, I. Collagen turnover and isotopic records in cortical bone. J. Archaeol. Sci. 106, 37–44 (2019).
Scientific Reports | (2020) 10:6612 | https://doi.org/10.1038/s41598-020-62990-0 8www.nature.com/scientificreports/ www.nature.com/scientificreports
68. Bocherens, H., Baryshnikov, G. & Van Neer, W. Were bears or lions involved in salmon accumulation in the Middle Palaeolithic of
the Caucasus? An isotopic investigation in Kudaro 3 cave. Quat. Int. 339–340, 112–118 (2014).
69. Knapp, M. et al. First DNA sequences from Asian cave bear fossils reveal deep divergences and complex phylogeographic patterns.
Mol. Ecol. 18, 1225–1238 (2009).
70. Szpak, P. et al. Regional differences in bone collagen δ13C and δ15N of Pleistocene mammoths: Implications for paleoecology of the
mammoth steppe. Palaeogeogr. Palaeoclimatol. Palaeoecol. 286, 88–96 (2010).
71. Nie, Y. et al. Giant pandas are macronutritional carnivores. Curr. Biol. 29, 1677–1682.e1-e2 (2019).
72. Nagy, K. A. Field metabolic rate and food requirement scaling in mammals and birds. Ecol. Monogr. 57, 111–128 (1987).
73. Rabeder, G., Debeljak, I., Hofreiter, M. & Withalm, G. Morphological responses of cave bears (Ursus spelaeus group) to high-alpine
habitats. Die Höhle 59, 59–72 (2008).
74. Lidén, K. & Angerbjörn, A. Dietary change and stable isotopes: a model of growth and dormancy in cave bears. Proc. R. Soc. B 266,
1779–1783 (1999).
75. Smith, C. I., Fuller, B. T., Choy, K. & Richards, M. P. A three-phase liquid chromatographic method for δ13C analysis of amino acids
from biological protein hydrolysates using liquid chromatography-isotope ratio mass spectrometry. Anal. Biochem. 390, 165–172
(2009).
76. Larsen, T. et al. Tracing carbon sources through aquatic and terrestrial food webs using amino acid stable isotope fingerprinting.
PLoS One 8, e73441 (2013).
77. Ponta, G. M. L. & Onac, B. P. Cave and Karst Systems of Romania. (Springer, 2019).
78. Bocherens, H., Billiou, D., Bonjean, D., Otte, M. & Mariotti, A. Paleobiological implications of the isotopic signatures (13C, 15N) of
fossil mammal collagen in Scladina Cave (Sclayn, Belgium). Quat. Res. 48, 370–380 (1997).
79. Longin, R. New method of collagen extraction for radiocarbon dating. Nature 230, 241–242 (1971).
80. Chikaraishi, Y., Ogawa, N. O. & Ohkouchi, N. Further evaluation of the trophic level estimation based on nitrogen isotopic
composition of amino acids. In Earth, Life, and Isotopes (eds. Ohkouchi, N., Tayasu, I. & Koba, K.) 37–51 (Kyoto University Press,
2010).
81. Blanke, C. M. et al. Comparing compound-specific and bulk stable nitrogen isotope trophic discrimination factors across multiple
freshwater fish species and diets. Can. J. Fish. Aquat. Sci. 74, 1291–1297 (2017).
82. Bronk Ramsey, C., Scott, E. M. & van der Plicht, J. Calibration for archaeological and environmental terrestrial samples in the time
range 26–50 ka cal BP. Radiocarbon 55, 2021–2027 (2013).
83. Reimer, P. J. et al. IntCal13 and Marine13 radiocarbon age calibration curves 0–50,000 years cal BP. Radiocarbon 55, 1869–1887
(2013).
84. Dabney, J. et al. Complete mitochondrial genome sequence of a Middle Pleistocene cave bear reconstructed from ultrashort DNA
fragments. Proc. Natl. Acad. Sci. USA 110, 15758–15763 (2013).
85. Basler, N. et al. Reduction of the contaminant fraction of DNA obtained from an ancient giant panda bone. BMC Res. Notes 10, 754
(2017).
86. Gansauge, M.-T. & Matthias, M. Single-stranded DNA library preparation for the se-quencing of ancient or damaged DNA. Nat.
Protoc 8, 737–748 (2013).
87. Paijmans, J. L. A. et al. Sequencing single-stranded libraries on the Illumina NextSeq 500 platform. arXiv [q-bio.OT] arXiv. http://
arxiv.org/abs/1711.11004 (2017).
88. Martin, M. Cutadapt removes adapter sequences from high-throughput sequencing reads. EMBnet.journal 17, 10–12 (2011).
89. C. Bon, N. et al. Deciphering the complete mitochondrial genome and phylogeny of the extinct cave bear in the Paleolithic painted
cave of Chauvet. Proc. Natl. Acad. Sci. USA 105, 17447–17452 (2008).
90. Li, H. & Durbin, R. Fast and accurate short read alignment with Burrows-Wheeler trans-form. Bioinformatics 25, 1754–1760 (2009).
91. Korneliussen, T. S., Albrechtsen, A. & Nielsen, R. ANGSD: Analysis of next generation sequencing data. BMC Bioinformatics 15, 356
(2014).
92. Wang, Y., Lu, J., Yu, J., Gibbs, R. A. & Yu, F. An integrative variant analysis pipeline for accurate genotype/haplotype inference in
population NGS data. Genome Res. 23, 833–842 (2013).
93. Shapiro, B. et al. A Bayesian phylogenetic method to estimate unknown sequence ages. Mol. Biol. Evol. 28, 879–887 (2011).
94. Lanfear, R., Calcott, B., Ho, S. Y. & Guindon, S. Partitionfinder: combined selection of partitioning schemes and substitution models
for phylogenetic analyses. Mol. Biol. Evol. 29, 1695–1701 (2012).
95. Drummond, A. J., Suchard, M. A., Xie, D. & Rambaut, A. Bayesian phylogenetics with BEAUti and the BEAST 1.7. Mol. Biol. Evol.
29, 1969–1973 (2012).
96. Rambaut, A., Suchard, M. A., Xie, D. & Drummond, A. J. Tracer v1.6. (2014).
Acknowledgements
The authors thank Peter Tung and Thomas Wendel of University of Tübingen for their contributions during
experiments. We would also like to thank Viorel Traian Lascu, Bogdan Bădescu and Iosif Morac for help during
fieldwork. Lastly, we would like to thank the administrations of the Apuseni and Grădiștea Muncelului Cioclovina
Natural Parks, and Semenic-Cheile Carașului National Park for access to the caves studied. This study was
financially supported by the Alexander von Humboldt Foundation and the Romanian Academy (INM), by the
Grant-in-Aid for Scientific Research on Innovative Areas (Grant No. 1802 for FY2016–2020) from MEXT, and
the JSPS (Japan Society for the Promotion of Science) Grant-in-Aid for Young Scientists (A) (17H05018) to
YIN. Lastly, we acknowledge support by Open Access Publishing Fund of University of Tübingen.
Author contributions
Y.I.N., C.W., D.G.D., M.R., M.V. and I.N.M. performed the experiments; Y.I.N., H.B., I.N.M., M.H. and A.B.
analyzed the data; the manuscript was written by Y.I.N. and I.N.M., with input from all authors.
Competing interests
The authors declare no competing interests.
Additional information
Supplementary information is available for this paper at https://doi.org/10.1038/s41598-020-62990-0.
Correspondence and requests for materials should be addressed to Y.I.N. or I.N.M.
Reprints and permissions information is available at www.nature.com/reprints.
Scientific Reports | (2020) 10:6612 | https://doi.org/10.1038/s41598-020-62990-0 9www.nature.com/scientificreports/ www.nature.com/scientificreports
Publisher’s note Springer Nature remains neutral with regard to jurisdictional claims in published maps and
institutional affiliations.
Open Access This article is licensed under a Creative Commons Attribution 4.0 International
License, which permits use, sharing, adaptation, distribution and reproduction in any medium or
format, as long as you give appropriate credit to the original author(s) and the source, provide a link to the Cre-
ative Commons license, and indicate if changes were made. The images or other third party material in this
article are included in the article’s Creative Commons license, unless indicated otherwise in a credit line to the
material. If material is not included in the article’s Creative Commons license and your intended use is not per-
mitted by statutory regulation or exceeds the permitted use, you will need to obtain permission directly from the
copyright holder. To view a copy of this license, visit http://creativecommons.org/licenses/by/4.0/.
© The Author(s) 2020
Scientific Reports | (2020) 10:6612 | https://doi.org/10.1038/s41598-020-62990-0 10You can also read