The developmental trajectories of executive function from adolescence to old age - Nature
←
→
Page content transcription
If your browser does not render page correctly, please read the page content below
www.nature.com/scientificreports
OPEN The developmental trajectories
of executive function
from adolescence to old age
Heather J. Ferguson1,3*, Victoria E. A. Brunsdon1 & Elisabeth E. F. Bradford2
Executive functions demonstrate variable developmental and aging profiles, with protracted
development into early adulthood and declines in older age. However, relatively few studies have
specifically included middle-aged adults in investigations of age-related differences in executive
functions. This study explored the age-related differences in executive function from late childhood
through to old age, allowing a more informed understanding of executive functions across the
lifespan. Three hundred and fifty participants aged 10 to 86 years-old completed a battery of tasks
assessing the specific roles of inhibitory control, working memory, cognitive flexibility, and planning.
Results highlighted continued improvement in working memory capacity across adolescence and into
young adulthood, followed by declines in both working memory and inhibitory control, beginning
from as early as 30–40 years old and continuing into older age. Analyses of planning abilities showed
continued improvement across adolescence and into young adulthood, followed by a decline in
abilities across adulthood, with a small (positive) change in older age. Interestingly, a dissociation
was found for cognitive flexibility; switch costs decreased, yet mixing costs increased across the
lifespan. The results provide a description of the developmental differences in inhibitory control,
working memory, cognitive flexibility and planning, above any effects of IQ or SES, and highlight the
importance of including middle-aged adults in studies seeking to establish a more comprehensive
picture of age-related differences in executive function.
Executive functions (EF) are high-level cognitive processes that include planning, initiation, shifting, monitor-
ing, and inhibition of b ehaviours1. EFs play an important role in our everyday life, allowing us to focus attention
on specific tasks, to engage in successful problem solving, and to plan for the future. EFs demonstrate variable
developmental and aging profiles (e.g.,2,3), with protracted development into early adulthood and a decline into
older age that is associated with structural and functional changes in the prefrontal c ortex4–10. The majority of
these studies have compared dichotomous young/old adult age groups, and few studies include middle-aged
adults or adolescents in investigations of age-related changes in EF (c.f.11–13 who included middle-aged adults).
Therefore, many open questions remain about how development changes across the lifespan, and whether these
effects are consistent across multiple components of EF. We address this by exploring how different components
of EF develop and change across the lifespan, from late childhood through to old age. Specifically, we tested
whether four key components of EF (inhibition, working memory, cognitive flexibility and planning) show
parallel or distinct developmental trajectories, and aimed to describe any age-related changes in multiple EFs.
EFs begin to emerge early in infancy, with basic skills needed for EFs emerging before three years of age, and
more specific skills developing into early childhood14. It has been suggested that each component of EF devel-
ops at its own rate across childhood and adolescence, reaching maturity at different ages ( see1). For instance,
cognitive flexibility has been shown to emerge between the ages of 3 and 4 years old, becoming more complex
between the ages of 7 and 9 years old, and reaching adult-like levels by age ~ 1215–17; in contrast, Zelazo et al.18
found that cognitive flexibility abilities continue to improve between the ages of 20 and 29 years old, suggest-
ing prolonged development of these abilities into young adulthood, and highlighting the importance of using
different approaches and tasks to assess EF abilities, providing further insight into when these abilities reach
maturity. Working memory, inhibition, and planning have been shown to continue to develop throughout child-
hood and adolescence, and in some circumstances (e.g., task dependent), have also been shown to continue to
develop into young adulthood (e.g.,19–23). The protracted development of EFs across childhood and adolescence
is associated with neurological changes, particularly the development of the prefrontal cortex (e.g.,4,24,25). Given
1
School of Psychology, University of Kent, Canterbury, UK. 2School of Psychology, University of Dundee, Dundee,
UK. 3Present address: School of Psychology, University of Kent, Canterbury CT2 7NP, UK. *email: h.ferguson@
kent.ac.uk
Scientific Reports | (2021) 11:1382 | https://doi.org/10.1038/s41598-020-80866-1 1
Vol.:(0123456789)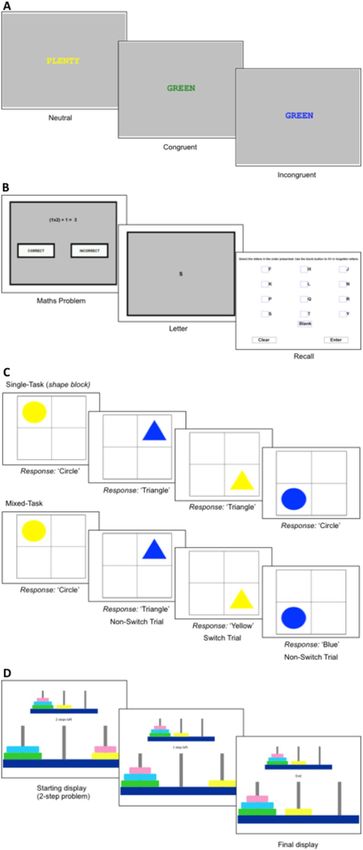
www.nature.com/scientificreports/
this, adolescence is a critical period to study, allowing further examination of the continued development of EFs
beyond childhood and into early adulthood to establish when these components of EF reach maturity.
Cognitive performance peaks in young adulthood (e.g.,26), with declines emerging as early as 20 or 30 years
old, including declines across adulthood in speed of p rocessing27–30, reasoning29,30, face processing31, fluid
26,27 26,27
intelligence , crystallized intelligence , working m emory26,28,32,33, verbal and visuospatial m emory34, and
long-term memory27,28. There is a vast amount of heterogeneity in regards to when cognitive abilities peak and
decline. For example, aspects of short-term memory decline from 18 years of age, working memory declines in
the 30 s, and vocabulary peaks in the 40 s or even later26. In contrast, other aspects of cognition, such as auto-
biographical memory and semantic knowledge, remain relatively stable across a dulthood35,36.
These findings raise the question of whether different components of EFs, specifically inhibition, working
memory, cognitive flexibility, and planning, are stable across adulthood and decline in older age, or whether
age-related declines in EFs begin soon after maturity in early adulthood. Studies have largely established that
working memory reaches a peak at 30 years old and declines thereafter26,32,33,37. In addition, inhibitory control
is poorest in younger children, improves in adulthood, and declines in older age38; however middle-aged adults
were omitted from this study, so it is not clear when these declines started to emerge. Overall, there is a paucity
of research specifically focussing on multiple components of EF across the lifespan, with studies into aging often
limited in their focus due to comparing dichotomous ‘young’ versus ‘old’ adult groups (i.e. few studies include
adolescents or middle-age adults in their lifespan sample). This approach means that important evidence is scarce
to draw conclusions on the extended developmental trajectory of EF or earlier signs of decline. A notable excep-
tion to this is the Cognitive Battery of assessments developed as part of the National Institutes Health Toolbox
in the U.S.A (NIHTB-CB;18,39,40). The NIHTB-CB sought to establish a series of tasks that could be used to assess
cognitive function abilities across different populations of individuals, suitable for use in individuals aged from
three to 85 years old, and includes measures of inhibitory control, cognitive flexibility, and working memory.
Results from the NIHTB-CB support suggestions of an inverted-U-shaped curve in development of a number
of EF abilities, including inhibition, cognitive flexibility, and working memory, with abilities first rising across
childhood, and falling in later adulthood18,41,42. Ferriera et al.43 also investigated EF abilities in a specific cohort of
healthy middle-aged adults, with results highlighting very early declines in EF before the age of 50; other studies
that have included middle-aged adults in a broader adult sample have reported a linear decline across adulthood
which is steeper among participants aged 65 + (e.g.,13).
Further to these behavioural studies, neuroimaging has revealed changes in both the structure and function
of brain regions that underlie EFs in middle-age and older adulthood44,45, which is highly likely to impact EF
performance in these age ranges. The studies cited above have provided important insights into the developmental
trajectories of EF capacities across the lifespan, including highlighting the limited studies that have included
middle-aged adults in investigations of EFs and, importantly, included analysing age as a continuous measure to
track development throughout adulthood (c.f.11–13,46). More often, even when studies have included middle-age
adults, they have analysed effects of age between groups rather than as a continuous predictor (e.g.,47,48), or rely
on correlation or regression analyses to model only linear trends (e.g.,46). As illustrated, studies with middle-aged
adults are essential to gain a comprehensive picture of the development of EFs throughout adulthood, to allow
pinpointing of when declines in EFs first emerge, and whether the patterns of decline in early adulthood, as shown
in other cognitive abilities, are also evident across the different components of EF across different paradigms, or
whether they are limited to specific components. Conducting studies with a continuous age sample also provides
vital insights to inform theories of healthy and abnormal aging, as, for example, the first pathophysiological
changes can commence up to 20 years before a diagnosis of d ementia49.
Older age is associated with significant declines in EF, including working memory (e.g.,50), inhibition (e.g.,51),
planning (e.g.,52), and cognitive flexibility (e.g.,53). Additionally, different aspects of cognitive flexibility show
distinct age-related effects. Mixing costs are greater in older adults (e.g.,54–58); however, there are mixed results
in regard to switch costs, with some studies reporting an age-related increase (e.g.,59), a U-shaped t rajectory53,
or no age-related differences (e.g.,58, 59), most likely due to differences in paradigms. Age-related effects in EFs
are thought to be relatively robust, and have been associated with changes in the frontal lobes, specifically age-
related volume reduction in the prefrontal c ortex60. There are some conflicting findings in the literature regarding
age-related declines in EF, perhaps because many studies do not account for general slowing in response laten-
cies (see61, for a discussion). When accounting for this general slowing, V erhaeghen61 failed to find evidence for
specific age-related declines in inhibition and local task-shifting costs (termed switch costs herein), but found
evidence for age-related declines in global task-shifting costs (termed mixing costs herein). Verhaeghen suggested
that mixing costs reflect a dual-task cost, with dual-tasks affecting older adults more62. Thus, it is important for
studies examining effects of cognitive decline in older age to account for age-related changes in response speed,
to be sure that effects reflect true changes in executive capacities rather than more general slowing in response
latencies.
In addition to age, several factors have been linked to cognitive decline, including genetics, health status,
physical activity, socio-economic status (SES), IQ, and physical fitness (e.g.,63–68). Childhood SES has been con-
sistently associated with EF56,69–71, with lower SES predicting poorer performance on tasks of EF in childhood72.
Less is known about the link between adult SES and E F73. IQ is another factor that has been associated with EF,
particularly with working m emory . IQ and EFs are dissociable yet related in c hildhood75, with evidence that
74
inhibitory control and cognitive flexibility are related to IQ during c hildhood76. In adolescence, working memory
is highly correlated with IQ, but inhibition and cognitive flexibility are n ot54. In older adults, IQ has been shown
to be related to working memory, verbal fluency, inhibition, and cognitive flexibility77. Given that IQ and SES
are related to EF abilities, the current study controlled for these factors in analysis, allowing us to assess the role
of age in predicting differences in EFs, beyond effects of IQ and SES.
Scientific Reports | (2021) 11:1382 | https://doi.org/10.1038/s41598-020-80866-1 2
Vol:.(1234567890)www.nature.com/scientificreports/
EFs play a critical role in everyday life, allowing individuals to plan ahead, focus their attention, and switch
between different tasks. They play a key role in allowing individuals to maintain effective levels of independent
functioning, and better EF abilities have been associated with improved self-reported quality of life in older
age1,78. Further, deficits in EF abilities have been associated with issues with o besity79, social p
roblems80,81, and
82
lower levels of p roductivity . It is therefore important to further our understanding of how these EF abilities
continue to change and differ across the lifespan—contributing to our understanding of age-related cognitive
changes—which ultimately may be able to provide insight into the optimum age at which cognitive training
interventions could be utilized to help maintain real-world functioning across individuals.
The current study investigated how multiple components of EF differ across the lifespan, in a large, commu-
nity-based sample of 350 10- to 86-year-olds, allowing differences across adolescence, early adulthood, middle
adulthood, and older adulthood to be examined within one study. The study focussed on four components of EF:
planning, inhibition (also termed inhibitory control and response inhibition), working memory, and cognitive
flexibility (also called set shifting or mental flexibility). It is largely accepted that inhibitory control, working
memory, and cognitive flexibility form the core components of EF abilities, reflecting largely (but not entirely)
separable processes83. In the current study we also included a more complex aspect of EF, planning abilities. The
ability to plan is a complex executive s kill94,102 that plays an important role in daily living, such as the ability to
identify a goal and subsequently planning and executing the steps needed to attain that goal72,83. It is noted that
planning abilities themselves, whilst considered an aspect of EF, may require activation of other EFs, including
inhibitory control and working memory in order to produce successful o utcomes72,83. Given this, the inclusion
of a measure of planning abilities in the current study allowed further insight into how planning capacities may
change across the lifespan, and whether we are able to establish a relationship between ‘core’ EF abilities and
planning capacities within this lifespan sample.
The aim of this study was to explore the developmental trajectories of these four components of EF, to identify
when age-related differences emerge. A cross-sectional design was utilized, to provide insight into differences
that can be established across different age cohorts in task performance; importantly, to address our research
question, we selected tasks that were appropriate for all participants from 10 to 86 years of age, allowing direct
comparisons in task performance to be made across different ages. We used curvilinear regression modelling to
establish the shape and trajectory of change across ages for each EF. Due to research suggesting that some com-
ponents of EF may be related to IQ and SES, we also controlled for the effects of IQ and socio-economic status.
We predicted, firstly, that these components of EF would continue to develop throughout adolescence, indi-
cated by an improvement in performance across tasks up to ~ 30 years of age. Second, we predicted that there
would be age-related declines in EF from ~ 50 years of age o nwards43. Third, we explored whether this decline in
EFs would start earlier in adulthood (i.e. between 30 and 50 years of age). We did not stipulate specific predic-
tions in this middle age range due to the dearth of research in adulthood. Instead, we modelled and tested the fit
of linear, quadratic and cubic age relationships for each component of EF. Note that each statistical model can
represent multiple patterns/directions of effects, however we define our predictions for the linear, quadratic and
cubic fit models used here based on existing research on cognitive development and decline with age. We posited
that a predicted linear age relationship would indicate either an improvement or decline in EF from adolescence
to older age. We predicted that a quadratic age relationship would indicate a developmental improvement in EF
in adolescence through to young adulthood, and a decline in EF throughout adulthood. A predicted cubic age
relationship would indicate a developmental improvement in EF in adolescence through to young adulthood,
a decline in EF across adulthood, and a further steeper decline in EF in older age. Finally, in line with previous
research (e.g.,84) we predicted that the different aspects of cognitive flexibility would should show distinct effects:
we predicted that switching costs (i.e., changing task sets) would not show any age-related changes, but mixing
costs (i.e., maintaining multiple task sets) would show an increase across adulthood (e.g.,84, 85).
Materials and method
Participants. The sample consisted of 354 participants who were recruited from the community, via news-
paper/radio adverts, social media, and an institutional research participation database, as part of the CogSo-
CoAGE project. Two participants were excluded due to low IQ (< 70), one participant was excluded due to
being a non-native English speaker, and one participant’s data was lost due to computer failure. The final sample
consisted of 350 participants (10–86 years-old; 232 females, 118 males). Table 1 provides a summary of the
sample and Table 2 details the demographic characteristics of the CogSoCoAGE sample, each divided into five
age groups for illustrative purposes. All participants were native English-speakers, had normal or corrected-to-
normal vision, had no known neurological disorders, and had no mental health or autism spectrum disorder
diagnoses. The Ethical Committee of the School of Psychology, University of Kent, approved the study, and all
methods were carried out in accordance with EU guidelines and regulations. Informed consent was obtained
from all participants; for participants under 18 years of age, consent was additionally sought from a parent or
legal guardian.
Measures. Socio‑economic status. Participants (if aged over 18) and parents of participants (if aged under
18) reported on their level of education, the household income, and their occupation (job title and industry). Oc-
cupational class was coded using the derivation tables provided by the Office for National S tatistics116 using the
simplified National Statistics Socio-Economic Classification (NS-SEC) based on Standard Occupational Clas-
sification 2010 (SOC2010). To calculate an SES index, education level was coded on a scale 1–6, and household
income and occupational class were coded on a scale 1–7. These three scores were summed to derive an SES
index between 3 and 2086, with lower scores indicating lower SES. In our sample, scores ranged from 5 to 20.
Scientific Reports | (2021) 11:1382 | https://doi.org/10.1038/s41598-020-80866-1 3
Vol.:(0123456789)www.nature.com/scientificreports/
Adolescents (10– Young adults Middle-aged adults Older adults
All (10–86 years old) 17 years old) (18–29 years old) Adults (30–49 years old) (50–64 years old) (65–86 years old)
N 350 62 60 76 74 78
Age (years)
Mean (SD) 43.22 (22.14) 13.34 (2.39) 22.63 (3.59) 40.00 (5.62) 57.19 (4.28) 72.71 (5.64)
Gender
F:M ratio 232:118 29:33 39:21 62:14 53:21 49:29
IQ
Verbal IQ 109.65 (12.38) 105.74 (10.07) 108.13 (11.06) 103.05 (9.82) 109.86 (11.50) 120.14 (11.52)
Performance IQ 108.48 (12.92) 107.27 (13.47) 104.70 (12.18) 105.45 (11.57) 110.18 (13.12) 120.66 (11.30)
Full scale IQ 110.35 (12.19) 107.35 (11.07) 107.45 (10.75) 104.70 (9.81) 110.18 (11.83) 120.65 (10.43)
SES index
Mean (SD) 13.74 (3.70) 14.79 (3.41) 11.18 (3.82) 14.56 (3.78) 13.91 (3.35) 13.91 (3.22)
Table 1. Summary of the CogSoCoAGE sample.
Characteristic (N (%)) All Adolescents Young adults Adults Middle-aged adults Older adults
Ethnicity
White 316 (90.3) 52 (83.9) 46 (76.6) 71 (93.4) 70 (94.6) 77 (98.7)
Mixed/multiple ethnic groups 13 (3.7) 7 (11.3) 3 (5.0) 1 (1.3) 2 (2.7) 0
Asian/British Asian 8 (2.3) 0 5 (8.3) 3 (4.0) 0 0
Black/African/Caribbean/Black British 3 (0.9) 0 2 (3.3) 1 (1.3) 0 0
Other ethnic group 3 (0.9) 0 1 (1.7) 0 1 (1.4) 1 (1.3)
Not stated 7 (2.0) 3 (4.8) 3 (5.0) 0 1 (1.4) 0
Education
GCSEs 35 (10.0) 7 (11.3) 1 (1.7) 9 (11.8) 10 (13.5) 8 (10.3)
A-Levels 60 (17.1) 10 (16.1) 32 (53.3) 6 (7.9) 8 (10.8) 4 (5.1)
Undergraduate degree 91 (26.0) 14 (22.6) 19 (31.7) 18 (23.7) 18 (24.3) 22 (28.2)
Postgraduate degree 90 (25.7) 16 (25.8) 5 (8.3) 25 (32.9) 21 (28.4) 23 (29.5)
Other 64 (18.3) 12 (19.4) 1 (1.7) 17 (22.4) 15 (20.3) 19 (24.4)
No qualifications 2 (0.6) 0 0 1 (1.3) 0 1 (1.3)
Not stated 8 (2.3) 3 (4.8) 2 (3.3) 0 0 1 (1.3)
Household income
< £9999 28 (8.0) 3 (4.84) 10 (16.67) 3 (3.95) 5 (6.76) 7 (8.97)
£10,000–£19,999 44 (12.3) 2 (3.23) 7 (11.67) 9 (11.84) 8 (10.81) 17 (21.79)
£20,000–£29,000 49 (14.0) 6 (9.68) 7 (11.67) 6 (7.89) 15 (20.27) 15 (19.23)
£30,000–£39,000 52 (14.8) 2 (3.23) 7 (11.67) 12 (15.79) 15 (20.27) 16 (20.51)
£40,000–£49,000 56 (16.0) 15 (24.19) 7 (11.67) 11 (14.47) 10 (13.51) 13 (16.67)
£50,000–£69,999 56 (16.0) 16 (25.81) 7 (11.67) 18 (23.68) 11 (14.86) 4 (5.13)
£70,000+ 49 (14.0) 13 (20.97) 9 (15.00) 16 (21.05) 7 (9.46) 4 (5.13)
Not stated 17 (4.9) 5 (8.06) 6 (10.00) 1 (1.32) 3 (4.05) 2 (2.56)
Occupational class
Higher managerial, administrative and
55 (15.7) 9 (14.52) 1 (1.67) 11 (14.47) 13 (17.57) 21 (26.92)
professional
Lower managerial, administrative and
124 (35.4) 21 (33.87) 8 (13.33) 31 (40.79) 30 (40.54) 34 (43.59)
professional
Intermediate occupations 76 (21.7) 21 (33.87) 5 (8.33) 19 (25.00) 16 (21.62) 15 (19.23)
Small employers and own account
9 (2.6) 0 2 (3.33) 2 (2.63) 2 (2.70) 3 (3.85)
workers
Lower supervisory and technical
4 (1.2) 1 (1.61) 1 (1.67) 1 (1.32) 1 (1.35) 0
occupations
Semi-routine occupations 38 (10.9) 7 (11.29) 7 (11.67) 10 (13.16) 9 (12.16) 5 (6.41)
Routine occupations 12 (3.4) 0 11 (18.33) 1 (1.32) 0 0
Never worked and long-term unem-
0 0 0 0 0 0
ployed
Full-time student 21 (6.0) 0 19 (31.67) 1 (1.32) 1 (1.35) 0
Not stated 11 (3.1) 3 (4.84) 6 (10.00) 0 2 (2.70) 0
Table 2. Demographic characteristics of the CogSoCoAGE sample.
Scientific Reports | (2021) 11:1382 | https://doi.org/10.1038/s41598-020-80866-1 4
Vol:.(1234567890)www.nature.com/scientificreports/
IQ. Intellectual ability was assessed using the Wechsler Abbreviated Scale of Intelligence-Second Edition
(WASI;87). The WASI-II comprises of four subtests as a measure of intelligence for individuals aged 6–90 years
old. The Vocabulary and Similarities subtests estimated a verbal IQ score. The Block Design and Matrix Reason-
ing subtests estimated a performance IQ score. Full-scale IQ comprised of both verbal and performance IQ.
Stroop colour‑word task. A modified version of a standard Stroop Colour-Word t ask88 was used as a measure
of inhibition. The words were printed in red, green, blue, or yellow for all trials and were printed on a grey
background. The words used in both congruent and incongruent trials were “RED”, “GREEN”, “BLUE”, and
“YELLOW”. For congruent trials, the colour word matched the printed colour (i.e., “RED” printed in red). For
incongruent trials, the colour word did not match the printed colour (i.e., “RED” printed in green). For filler
trials, the non-colour words were matched for length and frequency to the colour words. The filler words used
were “TAX”, “CHIEF”, “MEET”, and “PLENTY”. The word stimuli were presented in the middle of the screen in
font type Courier New and font size 28. See Fig. 1 for example stimuli.
Participants first completed 20 practice trials, which consisted of ten filler and ten congruent trials in a
pseudo-randomised order. Participants were told that they would see a word and they were instructed to iden-
tify the colour of the word as fast as possible using a button-box (i.e., RED printed in green; participants press
‘green’ button). The experimental trials consisted of 50 congruent trials, 50 incongruent trials, and 50 filler trials
presented in a pseudo-randomised order, in which the same colour word, the same printed colour, or the same
colour word/printed colour could not appear on two consecutive trials to avoid priming effects. A blank screen
appeared for 1000 ms at the start of the experimental trials. After the participant made a response, the next trial
was started immediately.
Response times for filler, congruent and incongruent trials were calculated for accurate responses that were
made 200 ms after stimuli onset and were within 2.5 SDs of each participant’s overall trial mean. The dependent
variable was the Stroop congruency effect (incongruent trial mean RT minus congruent trial mean RT). In addi-
tion, we accounted for age-related slowing and declines in information processing speed, which led to positive
skew and high kurtosis in reaction times, by log-transforming reaction times for each trial before calculating the
Stroop congruency effect. The log-transformation of the Stroop congruency effect reduced skew and kurtosis
(untransformed skew = 1.84, kurtosis = 8.84; log-transformed skew = 0.69, kurtosis = 3.44). The log-transformed
Stroop congruency effects were reverse scored so that a higher score indicated better performance to aid inter-
pretation of results alongside other measures. Internal consistency was excellent (Cronbach’s alpha = 0.99) and
the average inter-item correlation was ideal (r = 0.53).
Operation span. This task was adapted from Unsworth et al.’s89 automated operation span task (OSpan) as a
measure of working memory, which was based on the original OSpan task by Turner and Engle90. Participants
were required to solve maths equations while remembering a sequence of letters. The letters used were F, H, J, K,
L, N, P, Q, R, S, T, and Y. See Fig. 1 for example stimuli.
There were three practice blocks. The first practice block was a simple letter span. A single letter appeared in
the middle of the screen for 800 ms. A two-letter span was used for two trials, and a three-letter span was used
for a further two trials. At recall, participants were required to recall the letter sequence in the correct order by
clicking a box next to the appropriate letter presented in a 4 × 3 matrix. After clicking a box, a number appeared
that represented the position of the letter in the sequence. A ‘blank’ box was also presented and participants were
told to click this box if they could not remember the letter in the sequence. Participants could also click a ‘clear’
box to clear responses. The letters clicked also appeared at the bottom of the screen. To finish the letter recall
stage, participants clicked a box labelled ‘enter’. This recall phase was untimed. After the recall phase, participants
were given feedback about how many letters they recalled correctly.
The second practice block introduced the maths equations. A maths equation was presented on screen (e.g.,
(2 × 1) + 1 = 3) along with a ‘correct’ box and an ‘incorrect’ box. Participants were required to identify whether
the maths equation was correct or incorrect by clicking the appropriate box. Accuracy feedback was given. There
were three trials in this second practice block.
In the last practice block, participants completed both the maths section and letter recall section together.
The maths equation was presented first, and once participants had responded to the problem, a letter to be
recalled appeared in the middle of the screen for 800 ms. This equation-letter sequence was repeated twice to
create a two-letter span in this final practice block. The letter recall screen with the 4 × 3 letter matrix was then
presented. Participants completed three full practice trials, and were given feedback on how many letters they
recalled correctly and how many errors they made on the maths problems.
The experimental trials consisted of three trials for each of 2 to 7 letter spans (randomised). This made a total
of 18 trials with 81 maths problems and 81 letters. Participants were encouraged to keep their maths accuracy
at or above 85% at all times. During recall, a percentage in red was presented in the upper right-hand corner of
the screen, indicating the percentage accuracy for the maths problems.
An absolute OSpan score was calculated as the sum of all perfectly recalled sets. A partial OSpan score was
also calculated as the total number of letters recalled in the correct position. The absolute and partial OSpan
scores were highly correlated (r = 0.92, p < 0.001) and due to the recommendations of Unsworth et al.89, the partial
OSpan score was used as the dependent variable. Internal consistency was good (Cronbach’s alpha = 0.85) and
the average inter-item correlation was ideal (r = 0.25).
Task switching. The task was adapted91,92 as a measure of cognitive flexibility. Participants were presented with a
2 × 2 matrix on a computer screen. Stimuli were presented one-by-one in the four quadrants of the screen, begin-
ning in the upper-left quadrant and rotating in a clockwise manner. The stimuli were coloured-shapes (circle/
Scientific Reports | (2021) 11:1382 | https://doi.org/10.1038/s41598-020-80866-1 5
Vol.:(0123456789)www.nature.com/scientificreports/
Figure 1. Illustrations of the stimuli and procedure employed in each of the four EF tasks: (A) Stroop colour-
word task; (B) operation span; (C) task switching; (D) Tower of Hanoi.
triangle, in blue/yellow) that appeared in the quadrant. See Fig. 1 for example stimuli. The same shape/colour
combination did not appear on consecutive trials (i.e., a blue triangle could not appear in consecutive trials).
Participants’ task was to decide whether the shape was a circle or a triangle, and whether the colour was blue
Scientific Reports | (2021) 11:1382 | https://doi.org/10.1038/s41598-020-80866-1 6
Vol:.(1234567890)www.nature.com/scientificreports/
or yellow, dependent on trial-type (see descriptions below). Participants used a button box to respond, pressing
the left-hand button for circle/blue and the right-hand button for triangle/yellow. Participants were instructed
to respond as fast and as accurately as possible. The next stimulus was presented 150 ms after a key press or after
a timeout of 5000 ms. Participants received feedback about their accuracy after practice trials and repeated the
practice block if their accuracy was less than 80%.
In the single-task, there were 16 practice trials and 32 experimental trials per block. Participants had to
identify whether the shape was a circle or a triangle in one block, and whether the colour was blue or yellow in
a second block (single-task trials).
In the mixed-task, there were 16 practice trials, and four blocks of 32 experimental trials. Participants had to
indicate whether the shape was a circle or a triangle when the coloured-shape appeared in the top two quadrants,
and whether the colour was blue or yellow if the coloured-shape appeared in the bottom two quadrants. Catego-
rising the coloured-shape in the upper left to upper right quadrant, or in the lower right to lower left quadrant
did not require switching to a new category (i.e., non-switch trials). However, categorising the coloured-shape
in the upper right to lower right quadrant, or in the lower left to upper left quadrant required switching to a
new category (from shape to colours, and vice versa, i.e., switch trials). Switch and non-switch trials alternated
predictably within these blocks.
Response times were calculated for accurate responses that were made 200 ms after stimuli onset, and were
within 2.5 SDs of each participant’s overall trial mean. A switch cost of task-set switching was calculated by
subtracting the mean response time for non-switch trials from the mean response time for switch trials in the
mixed-task. A mixing cost (indicating maintenance of two task-sets) was calculated by subtracting the mean
single-task trial response time from the mean non-switch response time in the mixed-task. To account for age-
related slowing and declines in information processing speed, trial level response times were log-transformed
before calculating a switch cost and mixing cost. The log-transformation reduced skew and kurtosis for switch
cost (untransformed skew = 0.47, kurtosis = 3.25; log-transformed skew = 0.17, kurtosis = 2.54) and mixing cost
(untransformed skew = 0.91, kurtosis = 3.39; log-transformed skew = 0.41, kurtosis = 2.83). The log-transformed
switch and mixing costs were reverse scored so that a higher score indicated better performance. Internal con-
sistency was excellent for both the single and mixed-task (both Cronbach’s alpha = 0.98). The average inter-item
correlation for the single-task (r = 0.49) and for the mixed-task (r = 0.34) was ideal.
Tower of Hanoi. The Tower of Hanoi was used as a measure of planning (based on script obtained from: https
://step.talkbank.org/scripts-plus/TOHx.zip). The Tower of Hanoi required the mouse-controlled movement of
different-sized disks across three pegs from an initial state to a target state in a pre-defined number of steps.
Participants were presented with three pegs (left, centre, right) and four disks; pink, yellow, blue and green, in
increasing size. The target state was shown on the top-centre of the screen and was smaller than the initial state
configuration. The initial state was presented on the bottom-centre of the screen. The number of steps remaining
was shown in the centre of the screen. Participants were told that they needed to move the disks from their cur-
rent positions on the bottom of the screen to match the target state in the given number of steps without placing
larger disks on top of smaller disks. See Fig. 1 for example stimuli.
Participants first completed three practice trials: one one-step and two two-step problems. Participants con-
tinued to 16 experimental trials, which took three- to ten-steps to complete, with two trials at each step. Before
the start of each trial, participants were told how many steps were required to complete each trial. During the
trials, participants clicked on the disk that they wanted to move and this disk then turned red. The participant
then clicked on the rod that they wanted to move the disk to. If the incorrect rod was selected, then an error
message was shown and the participant restarted that trial. If the participant made five incorrect movements in
a row then the task automatically ended. If the correct disk and rod were selected, then the selected disk moved
to the selected rod and the participant moved on to the next step.
The dependent variable was an overall Tower of Hanoi score that used the traditional absolute scoring method,
and was the sum of all perfectly completed trials (i.e., score of 5 for a trial with 5 steps completed perfectly with
no errors). Internal consistency was acceptable (Cronbach’s alpha = 0.80) and the average inter-item correlation
was ideal (r = 0.20).
Procedure. Participants attended one or two visits to the university to complete the 5 h testing session,
which included questionnaires on behaviour and demographic information, computer-based testing to assess
cognitive and social skills, and an IQ assessment. The order of tasks was counterbalanced over 12 different lists
to ensure that order effects were minimised. All tasks reported here were programmed using E-Prime software.
Results
Analyses were conducted in R version 3.6.0. The datasets and code are available on the Open Science Frame-
work (https://osf.io/qzrwu). Descriptive data on the EF measures are summarised in Table 3, alongside the total
number of participants retained per task. For the Stroop task, two participants did not complete the task due to
equipment failure and one participant was colour-blind. For the Operation Span, one participant did not com-
plete the task due to equipment failure, 3 participants did not return for their second testing session to complete
the task, and 12 participants declined to complete the task or withdrew. For Task Switching, two participants did
not complete the task due to equipment failure, 3 participants did not return for their second testing session to
complete the task, 10 participants declined to complete the task or withdrew, and two participants’ data was lost
due to computer error. For the Tower of Hanoi, two participants did not return for their second testing session
to complete the task.
Scientific Reports | (2021) 11:1382 | https://doi.org/10.1038/s41598-020-80866-1 7
Vol.:(0123456789)www.nature.com/scientificreports/
Executive function
measure N All Adolescents Young adults Adults Middle-aged adults Older adults
Stroop task (inhibitory control)a
Filler words RT (log ms) 347 6.89 (.21) 6.88 (.18) 6.72 (.13) 6.81 (.17) 6.93 (.15) 7.07 (.21)
Congruent words RT
347 6.86 (.22) 6.84 (.18) 6.67 (.15) 6.79 (.18) 6.92 (.16) 7.05 (.21)
(log ms)
Incongruent words RT
347 7.01 (.25) 6.98 (.21) 6.81 (.17) 6.91 (.21) 7.06 (.17) 7.24 (.23)
(log ms)
Congruency effect (log ms) 347 − .14 (.09) − .14 (.09) − .14 (.08) − .13 (.07) − .14 (.08) − .19 (.11)
Operation span (working memory)
Absolute score 334 44.60 (18.82) 47.39 (18.11) 52.67 (17.67) 46.85 (16.84) 42.77 (18.43) 35.68 (18.97)
Partial score 334 61.77 (13.82) 64.52 (11.02) 67.51 (9.89) 64.38 (11.37) 59.84 (14.04) 54.47 (16.48)
Task switching (cognitive flexibility)a
Single-task trials (log ms) 333 6.42 (.21) 6.38 (.20) 6.27 (.18) 6.36 (.18) 6.49 (.17) 6.59 (.18)
Non-switch trials (log ms) 333 6.88 (.30) 6.77 (.25) 6.64 (.22) 6.84 (.30) 6.99 (.27) 7.10 (.23)
Switch trials (log ms) 333 7.21 (.25) 7.16 (.22) 7.02 (.20) 7.18 (.25) 7.26 (.24) 7.40 (.18)
Switch cost (log ms) 333 − .35 (.16) − .38 (.16) − .38 (.18) − .34 (.15) − .27 (.16) − .30 (.17)
Mixing cost (log ms) 333 − .41 (.22) − .39 (.20) − .37 (.21) − .48 (.24) − .50 (.26) − .51 (.22)
Tower of Hanoi (planning)
Absolute score 348 49.97 (25.82) 40.16 (20.06) 56.74 (26.53) 55.16 (25.76) 47.90 (25.56) 49.29 (27.37)
Table 3. Descriptive statistics for the executive function measures, showing means and standard deviations in
parentheses, divided into five age groups for illustrative purposes. a Log transformed response times.
Age‑related effects on executive function. A series of regression models were conducted to investigate
the relationship between the measures of EF and age, over and above any potential effects of IQ and SES. The
models specified the outcome variable as the dependent measure for the specific EF measure, the first predictor
variable was age using linear, quadratic or cubic orthogonal polynomial coefficients, and IQ and SES index were
included as the second and third predictor variables. Note that quadratic models included both linear and quad-
ratic age coefficients, and cubic models included linear, quadratic and cubic age coefficients.
The best fitting model for each EF measure was deduced by comparing several goodness-of-fit indices shown
in Table 4. Established goodness-of-fit measures were used to evaluate model fit. The ANOVA test and likelihood
test contrasted the simpler model against the more complex model (e.g., the model with linear vs. quadratic age
coefficients). If the p value was greater than 0.05, then the simpler model was selected as the best fitting model.
If the p value was less than 0.05, then the more complex model was selected as the best fitting model. Model
comparison also used Akaike’s Information Criterion (AIC) and Bayesian Information Criteria (BIC), with
increasingly negative values corresponding to increasingly better fitting models. Model selection evaluated these
goodness-of-fit indices and the model (linear, quadratic, or cubic model) with the greatest number of goodness-
of-fit indices was selected as the overall best fitting model (see Table 4). The model predictions for the overall best
fitting models for each EF are plotted in Fig. 2 with the observed data. Analyses for the untransformed variables
are reported in Supplementary Materials (S1, S2).
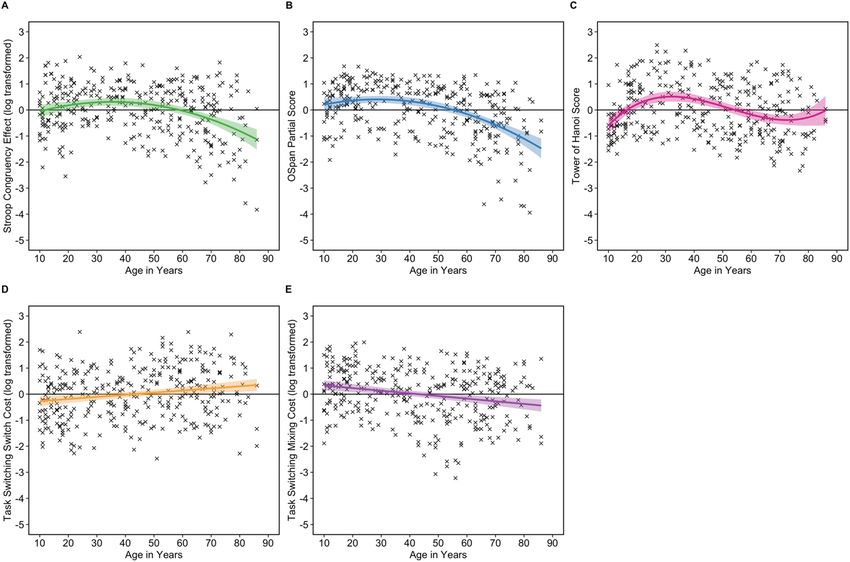
The best fitting model for the log-transformed congruency effect in the Stroop task included linear and
quadratic age coefficients. The results of the model indicated that there was a significant association between
the Stroop congruency effect and age, IQ, and SES ( R2 = 0.14, F(4, 335) = 13.46, p < 0.001). Age was significantly
associated with the Stroop congruency effect (linear β = − 0.27, p < 0.001; quadratic β = − 0.28, p < 0.001). To
interpret the curvilinear relationship between the Stroop congruency effect and age, we consider the model
predictions displayed in Fig. 2A. Figure 2A indicates that there is some increase in the Stroop congruency effect
between 10 and 35 years of age (i.e., an improvement in inhibitory control) and a decrease in the Stroop congru-
ency effect from 36 to 86 years of age (i.e., a decline in inhibitory control). IQ was also significantly associated
with the Stroop congruency effect (β = 0.20, p < 0.001), but SES was not (β = 0.09, p = 0.106). The model remained
significant when IQ and SES covariates were removed (quadratic R 2 = 0.09, F(2, 344) = 17.27, p < 0.001), showing
that age was significantly associated with the Stroop congruency effect in our sample (linear β = − 0.19, p < 0.001;
quadratic β = − 0.27, p < 0.001).
The best fitting model for the OSpan partial score included linear and quadratic age coefficients. The results
of the model indicated that there was a significant association between the OSpan partial score and age, IQ, and
SES (R2 = 0.28, F(4, 322) = 32.59, p < 0.001). Age was significantly associated with the OSpan partial score (linear
β = − 0.48, p < 0.001; quadratic β = − 0.30, p < 0.001). To interpret the curvilinear relationship between the OSpan
partial score and age, we consider the model predictions displayed in Fig. 2B. Figure 2B indicates that there is
some increase in the OSpan scores from 10 to 30 years of age (i.e., an improvement in working memory capacity),
and a decrease from 30 onwards (i.e., a decline in working memory capacity). IQ was also significantly associated
with the OSpan partial score (β = 0.44, p < 0.001), but SES was not (β = 0.004, p = 0.930). The model remained
significant when IQ and SES covariates were removed (quadratic R 2 = 0.11, F(2, 331) = 20.78, p < 0.001), show-
ing that age was significantly associated with the OSpan partial score in our sample (linear β = − 0.27, p < 0.001;
quadratic β = − 0.22, p < 0.001).
Scientific Reports | (2021) 11:1382 | https://doi.org/10.1038/s41598-020-80866-1 8
Vol:.(1234567890)www.nature.com/scientificreports/
Model fit indices
ANOVA Likelihood test
Model RSS FΔ p − 2LL χ2 p AIC BIC
Stroop task (congruency effect)
Linear 318.98 – – − 471.59 – – 953.18 972.32
Quadratica 294.93 27.31 < 0.001 − 458.26 26.65 < 0.001 928.53 951.50
Cubic 294.93 0.00 0.990 − 458.26 0.00 0.990 930.53 957.33
Operation span (partial score)
Linear 251.50 – – − 421.07 – – 852.14 871.09
Quadratica 225.71 36.79 < 0.001 − 403.38 35.38 < 0.001 818.76 841.50
Cubic 224.20 2.15 0.143 − 402.29 2.19 0.139 818.57 845.10
Task switching (switch cost)
Lineara 304.29 – – − 452.22 – – 914.45 933.40
Quadratic 302.82 1.56 0.213 − 451.43 1.58 0.209 914.87 937.61
Cubic 299.85 3.19 0.075 − 449.82 3.23 0.0722 913.64 940.17
Task switching (mixing cost)
Lineara 295.83 – – − 447.62 – – 905.23 924.18
Quadratic 294.43 1.53 0.216 − 446.84 1.55 0.213 905.68 928.42
Cubic 293.45 1.07 0.301 − 446.30 1.09 0.296 906.59 933.12
Tower of Hanoi (score)
Linear 308.21 – − 467.49 – – 944.97 964.15
Quadratic 289.21 22.14 < 0.001 − 456.61 21.76 < 0.001 925.21 948.22
Cubica 273.74 18.99 < 0.001 − 447.20 18.80 < 0.001 908.41 935.25
Table 4. Goodness-of-fit indices for the executive function models with age as the predictor variable (with
linear, quadratic, or cubic age coefficients) for each outcome variable. Bold values indicate best fitting model
according to goodness-of-fit index; RSS = residual sum of squares; FΔ denotes the comparison of models (i.e.,
linear vs. quadratic); − 2LL = log-likelihood. a Overall best-fitting model taking all goodness-of-fit indices into
consideration.
The best fitting model for the Task Switching switch cost included the linear age coefficient. The results of
the model indicated that there was a significant association between the Task Switching switch cost and age, IQ,
and SES (R2 = 0.05, F(3, 323) = 5.19, p = 0.002). Age was significantly associated with the log-transformed switch
cost (linear β = 0.20, p < 0.001), indicating a decrease in switch cost from 10 to 86 years old (i.e., an improve-
ment in cognitive flexibility in terms of ‘switch cost’; Fig. 2D). IQ and SES were not significantly associated with
switch cost (both ps > 0.134). The model remained significant when IQ and SES covariates were removed (linear
R2 = 0.04, F(1, 331) = 14.81, p < 0.001), showing that age was significantly associated with the Task Switching
switch cost in our sample (linear β = 0.21, p < 0.001).
The best fitting model for the Task Switching mixing cost included the linear age coefficient. The results of the
model indicated that there was a significant association between the Task Switching mixing cost and age, IQ, and
SES (R2 = 0.07, F(3, 323) = 8.24, p < 0.001). Age was significantly associated with the log-transformed switch cost
(linear β = − 0.26, p < 0.001), indicating an increase in mixing cost from 10 to 86 years old (i.e., a decline in cogni-
tive flexibility in terms of ‘mixing cost’; Fig. 2E). IQ and SES were not significantly associated with switch cost
(both ps > 0.103). The model remained significant when IQ and SES covariates were removed (linear R2 = 0.07,
F(1, 331) = 23.86, p < 0.001), showing that age was significantly associated with the Task Switching mixing cost
in our sample (linear (β = − 0.26, p < 0.001).
The best fitting model for the Tower of Hanoi absolute score included linear, quadratic, and cubic age coef-
ficients. The results of the model indicated that there was a significant association between the Tower of Hanoi
absolute score and age, IQ, and SES (R2 = 0.20, F(5, 336) = 17.00, p < 0.001). Age was significantly associated with
Tower of Hanoi absolute score (linear β = − 0.15, p = 0.004; quadratic β = − 0.25, p < 0.001; cubic β = 0.21, p < 0.001).
To interpret the curvilinear relationship between the Tower of Hanoi absolute score and age, we consider the
model predictions displayed in Fig. 2C. Figure 2C indicates that there is an initial increase in Tower of Hanoi
absolute scores from 10 to 30 years of age (i.e., an increase in planning ability), a decrease from 30 to 70 years
of age (i.e., a decrease in planning ability), and a small, but variable, increase from 70 years of age onwards. IQ
was also significantly associated with the Tower of Hanoi absolute score (β = 0.43, p < 0.001), but SES was not
(β = 0.005, p = 0.921). The model remained significant when IQ and SES covariates were removed (cubic R 2 = 0.05,
F(3, 344) = 6.65, p < 0.001), showing that age was significantly associated with the Tower of Hanoi absolute score
in our sample (linear β = − 0.41, p = 0.002; quadratic β = − 0.25, p < 0.001; cubic β = 0.26, p < 0.001).
Relationships between measures of executive functions. A series of Pearson’s correlations were
conducted between the four EF tasks to investigate the relationship between the measures of EF (Table 5). Partial
correlations were also conducted to control for the effects of age. These effects of age for each EF measure were
Scientific Reports | (2021) 11:1382 | https://doi.org/10.1038/s41598-020-80866-1 9
Vol.:(0123456789)www.nature.com/scientificreports/
Figure 2. Relationship between age and executive function measures, adjusted for IQ and SES index. (A) log-
transformed Stroop congruency effect, (B) OSpan partial score, (C) Tower of Hanoi score, (D) log-transformed
Task Switching switch cost; and (E) log-transformed Task Switching mixing cost. The bold line indicates the
best-fitting regression line and the dashed line indicates the 95% confidence intervals (CIs). Stroop congruency
effect and Task Switching switch and mixing costs are reversed scored so that a higher value indicates better
performance and all variables are z-scored for ease of comparison. Note: All measures were adjusted for IQ and
SES to be comparable to the described regression models. To adjust for IQ and SES, the residuals were obtained
from the regression line fit when fitting each executive function measure as a dependent variable in a linear
model and IQ and SES index as predictor variables.
Measure 1 2 3 4 5
1. Stroop congruency effecta (inhibitory control) –
2. Operation span partial score (working memory) 0.18** (0.09) –
3. Task switching switch costa (cognitive flexibility) 0.06 (0.08) − 0.06 (− 0.02) –
4. Task switching mixing costa (cognitive flexibility) 0.02 (− 0.01) 0.12 (0.07) − 0.46*** (− 0.43***) –
5. Tower of Hanoi Score (planning) 0.09 (0.07) 0.30*** (0.29***) 0.02 (0.03) 0.00 (0.01) –
Table 5. Correlation matrix of the executive function measures of interest (partial correlation coefficients
controlling for the effects of age are presented in parentheses). *p < .05, **p < .01, ***p < .001. a Response time
measures log-transformed and reverse scored.
determined from the previously described regression models, i.e., the EF measures were adjusted for the linear,
quadratic or cubic age effects. To adjust for age, the residuals were obtained from the regression line fit when
fitting each EF measure as a dependent variable in a linear model and age coefficients (linear, quadratic, or cubic
age coefficients) as predictor variables.
The OSpan partial score showed a positive correlation with both the Stroop congruency effect and the Tower
of Hanoi score, with only a relationship with the Tower of Hanoi score remaining once accounting for the effects
of age. These findings suggest that individuals with a higher working memory capacity also possess better plan-
ning ability, and these relationships are present irrespective of any age effects. Finally, Task Switching switch
and mixing costs showed a negative correlation, reflecting that individuals with a greater switch cost also had a
smaller mixing cost, and vice versa, and this pattern remained when accounting for the effect of age.
Scientific Reports | (2021) 11:1382 | https://doi.org/10.1038/s41598-020-80866-1 10
Vol:.(1234567890)www.nature.com/scientificreports/
Comparing developmental trajectories of executive function. To examine whether each compo-
nent of EF followed comparable or distinct developmental trajectories, we conducted across model comparisons
for the age-related effects in the different EFs. This statistical method allows us to compare EF regression models
with the same number of predictor variables, allowing direct comparisons between trajectories across these
tasks. In our data, Task Switching switch and mixing cost models have three predictors (i.e., linear age coefficient,
plus IQ and SES), Stroop congruency effect and OSpan partial score models have four predictors (i.e., linear and
quadratic age coefficients, plus IQ and SES), and the Tower of Hanoi absolute score model has five predictors
(i.e., linear, quadratic, and cubic age coefficients, plus IQ and SES). Therefore, Task Switching switch cost and
mixing cost and Tower of Hanoi absolute score revealed different age-related effects (i.e., linear-only age effects
vs. cubic age effect) and so were not directly compared with any other component of EF; analysis focused on the
Stroop congruency effect versus OSpan partial scores.
Stroop congruency effect and OSpan partial score revealed similar curvature in the previous regression
models (i.e., a quadratic effect of age), and so were directly compared. Two regression models were conducted
and compared to statistically assess whether the age-related effects in the Stroop task and OSpan were signifi-
cantly different. In the first step, a model was conducted that specified the outcome variable as the z-scores for
the Stroop congruency effect and the OSpan partial score, with the predictor variable as the linear and quadratic
age coefficients. In the second step, the same model was specified with the addition of an interaction term that
included a grouping variable (i.e., a dummy variable) for the Stroop congruency effect (coded as 1) and the
OSpan partial score (coded as 2). In the final step, these two models were compared using an ANOVA. If the p
value was less than 0.05, then the regression slopes for the relationship between Stroop congruency effect and
age versus OSpan partial score and age could be considered significantly different. If the p value was more than
0.05, then the regression slopes could be considered not statistically different.
The results indicated that the regression slopes for the Stroop congruency effect and OSpan partial score
were not significantly different (RSSΔ = 2.96, FΔ = 1.11, p = 0.344), suggesting that inhibitory control and work-
ing memory show similar developmental trajectories. As illustrated in Fig. 2, the regression slopes for the other
components of EF follow different patterns over age, indicating that only inhibitory control and working memory
have similar developmental trajectories and all other components of EF show distinct developmental trajectories.
Discussion
The current study explored age-related differences in EF from late childhood through to old age in a large, com-
munity-based sample. Three-hundred and fifty individuals aged 10 to 86-years-old completed tasks to measure
inhibitory control, working memory, cognitive flexibility, and planning, to identify when age-related changes in
these EFs first become apparent. After controlling for any potential effects of IQ and SES, analyses revealed that
inhibitory control and working memory capacity was higher in young adulthood compared to adolescence, with
inhibitory control showing a decline in participants from ~ 35-years-old, and working memory capacity showing
a decline in participants from ~ 30-years-old. Planning ability was also higher in young adulthood compared
to adolescence, but then declined across adulthood, with a small positive change in older age. In line with our
hypothesis, a dissociation was found for the measures of cognitive flexibility: interestingly, however, this reflected
that switch costs decreased across the lifespan, yet mixing costs increased across the lifespan.
These findings provide insight into the developmental trajectories of inhibitory control, working memory,
cognitive flexibility, and planning ability across the lifespan, providing a more comprehensive picture of the
age-related changes in EF than has previously been established. Many of the existing studies that have examined
aging and EFs have compared a dichotomous sample of younger versus older adults (e.g.,51,93–95), have combined
individuals into smaller age groups during analysis (e.g.,53,55), or have focused on single aspects of EF, such as
inhibitory control (e.g.,19,23). Instead, in the current study, we used a continuous age sample to model curvilinear
age relationships to show the development of EFs from adolescence through to older adulthood, and to highlight
changes in EFs that emerge throughout adulthood and not specifically at the onset of old age (typically considered
65 years old plus). Studies have largely overlooked adulthood as a period of change, with many studies omitting
middle-aged adults in their samples examining lifespan changes. Moreover, cognitive performance among ado-
lescents has rarely been compared to middle- or older-aged adults. The current study therefore makes a unique
contribution to the literature by demonstrating developmental changes in different EFs, using the same set of
tasks for all participants, with evidence that declines emerge in inhibitory control, working memory, and plan-
ning as early as the third decade of life. In addition, inhibitory control and working memory follow comparable
developmental trajectories, with distinct developmental trajectories apparent for the other measures of EF.
In line with our predictions, and supporting previous s tudies61, the current study highlighted that different
aspects of cognitive flexibility showed distinct age effects. As expected, there was an increase in mixing costs
across adulthood, but switch costs decreased across adulthood. Mixing costs have generally been found to be
greater in older adults (e.g.,54–58) there are mixed results in regard to switch costs, with some studies reporting an
age-related increase (e.g.,59), a U-shaped t rajectory53 or no age-related differences (e.g.,58,59), most likely due to
differences in the task switching paradigms. We note that the current study used an alternating-runs paradigm
without a preparatory cue-stimulus interval, which is analogous to Huff et al.’s84 task-switching paradigm with
comparable aging results. In addition, switch and mixing costs showed a negative correlation, reflecting that indi-
viduals with a greater switch cost also had a reduced mixing cost, and vice versa, and this pattern also remained
when accounting for the effect of age. This finding replicates that seen in Huff et al.84 in which a dissociation was
found between switch and mixing costs across age groups. Huff et al.84 suggested that this dissociation is due to
differences in the attentional systems in younger versus older adults. They suggest that younger and middle-aged
adults experience a larger switch cost as their attentional systems become tuned to the task set in the single-task,
and this inertia to executing the same rule in the single-task slows the reconfiguration to respond to the switch
Scientific Reports | (2021) 11:1382 | https://doi.org/10.1038/s41598-020-80866-1 11
Vol.:(0123456789)You can also read