2018 District of Thunder Bay Point-In-Time Count of People Experiencing Homelessness
←
→
Page content transcription
If your browser does not render page correctly, please read the page content below
District of Thunder Bay Point-In-Time Count
2018          of People Experiencing Homelessness

                                       November 2018
Acknowledgements
The 2018 Point-in-Time (PiT) Count and Registry Week was made possible
by the collaboration of multiple community agencies, organizations, and
individuals. We would like to thank the following organizations for their support:

•     Lakehead Social Planning Council
•     Thunder Bay Indigenous Friendship Centre
•     The District of Thunder Bay Social Services Administration Board
•     Thunder Bay Drug Strategy
•     Thunder Bay Public Library
•     Ontario Native Women’s Association
•     People Advocating for Change through Empowerment Inc.
•     Shelter House Thunder Bay
•     Salvation Army
•     Grace Place
•     John Howard Society of Thunder Bay and District
•     Kinna-aweya Legal Clinic
•     Habitat for Humanity
•     Blucher, Picton, Windsor Community Action Group
•     The Gathering Place
•     Urban Abbey
•     Dilico Anishinabek Family Care
•     211 Ontario North
•     Elizabeth Fry Society of Northwestern Ontario

We would also like to thank all the volunteers for their invaluable time and
input in this project. Most of all, we would like to thank all the participants who
took the time to complete a survey and share their stories to help us better
understand their experiences of homelessness in the District of Thunder Bay.
Thank you.

Funding was provided by the District of Thunder Bay Social Services
Administration Board, the Government of Canada’s Homelessness Partnering
Strategy (HPS) and The Thunder Bay Drug Strategy.

                                                                                      2
Contents
Po i nt-i n -Ti me Co u nt Su m m ary               4
Ba c k g ro u nd 6
Un de rs t a nd ing t he Lo c a l Co ntex t         8
Meth o d o l og y12
Re s ul t s18
Re com m e nd at io ns28
Con c lu si o n30
Refe re n ce s                                     31
Appe n d ix 1 - Su r vey Sites							               34
Appe n d i x 2 - Su r vey                           35
Appe n d ix 3 - Eme rge nc y Reso urce Sheet 				   41

                                                         3
Point-in-Time Count Summary

                             0H7NDER BAY
                                                                                                          July 2018

              ���N0��N�0��E ��7N0 ����

  ���
 Where are they staying?
                                people experiencing homelessness were surveyed
                                during a 24 hour period on April 21st & 22nd

  �����              �����                �����                 ����                  ����           ����
    Couch            Emergency          Transitional          Unsheltered           Respondent     Public System
   Surfing            Shelter           Shelter and            (e.g. tent)          Doesn't Know   (e.g. hospital)
                                        Motel/Hotel

 Who are they?
 63.5% are male and 35.2% are female                   (0.9% did not respond*)

 6.5% identify as LGBTQ            (2.3% did not respond*)
                                                                                                   66%
                                                                                                   identify as
                                                                                                   Indigenous

 7.0% are veterans         (0.8% did not respond*)

 *Non-responses include don't know, decline to answer and unclear/blank responses
                                                                                                   61%
                                                                                              of respondents first
 How old are they?                                                                                experienced
                                                                                              homelessness before
                                                                                                   turning 25
 16-24           25-34                35-44           45-54                55+

                     ���                 ���
                                                             ���                                   37%
     ���                                                                    ���
                                                                                                 spent time in
                                                                                              foster care and/or
                                                                                                 a group home
                                                                                                                      4
Why are they homeless?
The most common factors identified as
��% ��% ��%
contributing to recent housing loss
include:
Addiction or substance use
Conflict with spouse/partner
Unable to pay rent or mortgage
How long and how many times are they
experiencing homelessness?
59% ��%
of respondents were of respondents were
chronically homeless - episodically homeless -
homeless for 6 months or homeless 3 or more times
more in the past year in the past year
What are their sources of income?*
7�% �7% have no source
of income
receive social assistance: Ontario
Works (OW) or Ontario Disability 7% receive income
from employment
Support Program (ODSP) (formal and self)
(*1% did not respond)
Where are they from?
Of the people who have moved
here, 62% are from other
26% of respondents
communities in Ontario and 19%
have always lived in
are from outside Ontario. 19%
Thunder Bay
have lived in Thunder Bay for
less than 1 year.
5Background
Housing is a basic human necessity and right, yet for many people, adequate and affordable
housing is out of their reach. Having a home has significant meaning – belonging, comfort, security,
and stability - and is the foundation for a decent standard of living. The loss of this foundation is
caused by a complex interaction between structural factors (economic and societal issues), system
failures (inadequate policy and services), and individual circumstances (e.g. mental health and
addiction challenges). As a result, homelessness can lead to poor health, barriers to education and
employment, and social isolation.1
The Canadian Observatory on Homelessness (COH) defines homelessness as “the situation
of an individual, family or community without stable, safe, permanent, appropriate housing,
or the immediate prospect, means and ability of acquiring it”.2 This definition categorizes
homelessness in a typology that includes:
1. Unsheltered, or absolute homelessness: living on the streets or in places not
intended for human habitation;
2. Emergency sheltered: staying in overnight shelters for people who are homeless, as
well as shelters for those impacted by family violence;
3. Provisionally accommodated: accommodation is temporary and lacks security of
tenure; and,
4. At risk of homelessness: people who are not homeless, but whose current economic
and/or housing situation is precarious or does not meet public health and safety
standards.3
The overrepresentation of Indigenous people in the homeless population is well documented,4
therefore it is important to consider the colonization and cultural genocide of Indigenous people that
has allowed for this disparity. Moving forward, this knowledge and understanding needs to be at the
forefront of efforts to end homelessness. As such, the definition of Indigenous homelessness is:
A human condition that describes First Nations, Metis and Inuit individuals, families or
communities lacking stable, permanent, appropriate housing, or the immediate prospect,
means or ability to acquire such housing. Unlike the common colonialist definition of
homelessness, Indigenous homelessness is not defined as lacking a structure of habitation;
rather, it is more fully described and understood through a composite lens of Indigenous
worldviews. These include: individuals, families and communities isolated from their
relationships to land, water, place, family, kin, each other, animals, cultures, languages and
identities. Importantly, Indigenous people experiencing these kinds of homelessness cannot
culturally, spiritually, emotionally or physically reconnect with their Indigeneity or lost
relationships. 5
6With the rising rates of homelessness, communities, governments, and organizations have formed
partnerships in an effort to end it. One such partnership is that between the District of Thunder Bay
Social Services Administration Board, Lakehead Social Planning Council, Thunder Bay Indigenous
Friendship Centre and The Thunder Bay Drug Strategy. With the help of the Province of Ontario’s
Community Homelessness Prevention Initiative (CHPI), the Government of Canada’s Homeless
Partnering Strategy (HPS), and 20,000 Homes Campaign, the partnership has undertaken a Point
in Time (PiT) Count and Registry Week for 2018 in the District of Thunder Bay. These campaigns
use surveys as tools to estimate the number of people experiencing homelessness in a community
at a specific point in time. A Point in Time count gathers information about people experiencing
homelessness, while Registry Week is a week-long event to identify people experiencing
homelessness and develop a plan to house them. Registry Week surveys gather person-specific data
through the Vulnerability Index – Service Prioritization Decision Assistance Tool (VI-SPDAT), helping
to triage those who are willing to receive supports and housing interventions.6 The City of Thunder
Bay’s first PiT Count and Registry Week was conducted in 2016 with a partnership between
Lakehead Social Planning Council, Thunder Bay Indigenous Friendship Centre and The Thunder
Bay Drug Strategy. During that week, a total of 289 individuals were surveyed when self-reporting
experiencing homelessness.7
Beginning on April 21, 2018, 474 people experiencing homelessness were surveyed, with 265
people choosing to participate in the longer VI-SPDAT, providing information to allow for follow up
to help find housing. While the number of surveys collected in 2018 show a large increase from the
289 surveyed in the 2016 PiT count, it should not be interpreted as an indication of an increased
homeless population in the city of Thunder Bay; outreach for 2018 PiT survey participants included
extra advertising and different methods to reach more people experiencing hidden homelessness,
drawing on lessons learned from the previous PiT count. It is also important to note that the PiT
count in 2016 was conducted on January 16, when temperatures in the city of Thunder Bay ranged
between -17.1˚C and -11.7˚C.8 In contrast, on April 21, 2018, temperatures ranged between -0.7˚C
and 7.9˚C;9 much more favorable conditions for participation in outdoor survey events. Those
who reported experiencing homelessness in the 2018 PiT count account for 0.44% of the total
population of the city of Thunder Bay (107,909 people as of the 2016 census).10
As a new addition to this year’s PiT Count and Registry Week, the Government of Ontario
introduced a provincial requirement for Service Managers to conduct an enumeration of people
experiencing homelessness as part of its goal to end chronic homelessness by 2025.11 In response
to this, surveys were also conducted in communities outside of the city of Thunder Bay; Oliver
Paipoonge, Marathon, Terrace Bay, and Geraldton were chosen for this. However, as only 19 people
were counted in these communities combined throughout the entire week, the sample is too small
to guarantee anonymity of the participants; therefore, this data has been suppressed.
The data collected from the PiT Count and Registry Week will be used to understand the
characteristics of individuals that make up the homeless population, improve services and programs
for those individuals, and increase public awareness of homelessness.12 The information will also be
used to evaluate progress toward ending homelessness, study demographic changes, prioritizing
service needs, and to continue the dialogue about homelessness with organizations, government,
and community members.13
7Understanding the Local Context
The information obtained from the PiT Count and Registry Week will provide details about individual
factors that influenced homelessness. However, it is important to have a holistic view and recognize
the societal issues that have allowed homelessness to become what the United Nations International
Covenant on Economic, Social and Cultural Rights referred to as a “national crisis.” 14 These societal
factors include an unaffordable rental market, low income, and insufficient government assistance.
Rental Housing Market and High Shelter Costs
The average rental market vacancy rate for the city of Thunder Bay decreased to 3.2% in 2017 (Table
1), due to the gap narrowing between demand and supply of rental housing, especially with an influx
of international students and seniors relocating to urban areas to access health services. Declining
vacancies contributed to a 3.8% increase in the average rent in 2017, to a cost of $886 per month
(average rental cost for all sizes of accomodations in the city of Thunder Bay). This increase exceeded
the rate of inflation and was more than double the Ontario Rent Review Guideline of 1.5%.15
Table 1 – Vacancy Rates in the City of Thunder Bay, 2016-2017
Bachelor 1 Bedroom 2 Bedroom 3 Bedroom + Total
2016 2017 2016 2017 2016 2017 2016 2017 2016 2017
Vacancy Rate 10.20% 5.90% 3.60% 4.30% 5.30% 2.40% 5.70% 0.00% 5.00% 3.20%
Source: Canada Mortgage and Housing Corporation
Housing is considered affordable when it is less than 30% of total household income. When people
spend more than 30% of their income on housing, they experience financial strain, with insufficient
funds for other expenses such as food, transportation, education, or other needs. In the city of
Thunder Bay, 19.3% of the population spent more than 30% or more of their income on shelter costs
in 2016.16 This percentage is higher for tenant households; 42.6% of renters find themselves living in
unaffordable housing.17
8Low Income and Social Assistance
The Low-Income Measure, After Tax (LIM-AT), 50% of the median income adjusted after tax,
is a relative measure of poverty calculated by Statistics Canada that can be adjusted to fit any
household size.18 In 2016, the LIM-AT for an individual was calculated at $22,133 by Statistics
Canada.19 13.8% of the population of the city of Thunder Bay earned less than the LIM-AT
threshold in 2016.20
Ontario’s social assistance program, Ontario Works (OW)
An individual receiving OW and not living in social housing or receiving a rent supplement will
be unable to afford the average rent of a one-bedroom apartment. A single parent with one child
earning OW would have to spend 87% of their income on rent, with only $141 remaining for the
rest of the month. This amount would have to cover all other expenses – food, transportation,
clothing, child care, phone and household expenses. Although the rates for Ontario Disability
Support Program (ODSP) are slightly higher, housing is still not affordable as these households
spend more than 50% on market rent rates. While there was a 1.5% increase to OW and ODSP
rates as of October 1st, 2018, this sub-inflationary increase does not keep pace with the cost of
living. Some policy experts have suggested that the province set a Minimum Income Standard –
based initially on the LIM-AT – in order to achieve income adequacy.21
Table 2 – Average Market Rents and Social Assistance Rates
1 Bedroom 2 Bedroom 3 Bedroom
Average Rent $778 $959 $1,194
Average Single Parent Average Couple Average
Maximum Shelter and
Single Rent as % +1 child Rent as % +2 children Rent as %
Basic Needs Benefits
of Income 0-17 years of Income 0-17 years of Income
OW $733 106% $1,002 96% $1,250 96%
ODSP $1,169 67% $1,596 60% $1,887 63%
Source: Canada Mortgage and Housing Corporation; Ontario Works and ODSP Rate Sheets
9Social and Affordable Housing Social and Affordable Housing options are important aspects for individuals moving from homelessness to being successfully housed. However, there is currently an imbalance in Social and Affordable Housing stock relative to the demands of those requiring housing assistance. Currently there are 1,069 individuals on the Social Housing Waitlist and of this total 53% are single individuals and 78% require a one bedroom unit. Of the approximately 4,030 Social Housing units in the District of Thunder Bay, one bedroom units make up a disproportionately small amount of the overall stock. Despite this, the average wait time from application to an offer of a unit is only 9.5 months for the District of Thunder Bay. This is amongst the lowest wait times in Ontario. Further, the High Needs Homeless initiative that prioritizes housing for qualified individuals has successfully housed 73 individuals since its creation in 2016. However, there are still a number of individuals that are homeless and more needs to be done. New Social Housing initiatives such as the Portable Housing Benefit and continued investment in new one bedroom Social and Affordable Housing stock through programs such as the Investment in Affordable Housing Initiative (IAH) are key to addressing the current imbalance and ensuring that housing availability is not an obstacle to addressing homelessness.
Mental Health and Addiction
The links between homelessness and mental health and addiction issues are well-established in the
research literature.22 Though the incidence of mental health or addiction issues are significant risk
factors, they do not automatically result in homelessness. Similarly, homelessness and associated
complications can also exacerbate existing mental health issues or contribute to substance use as a
coping mechanism.

Data compiled across a wide-range of categories shows higher rates of problematic substance abuse
in the District of Thunder Bay when compared to provincial averages.23 Perhaps most alarming are the
high rates of opioid-related morbidity and mortality, as demonstrated in Table 3.

Table 3 – 2016 Comparative opioid-related morbidity and mortality in Ontario and the District
of Thunder Bay, rate per 100,000 people

                                                                District of
                                                Ontario
                                                               Thunder Bay
                    Emergency Department
                    Visits for Opioid             31.7               53
                    Poisonings
                    Hospitalization Rates
                                                  13.7               20
                    for Opioid Poisonings

                    Deaths from Opioid
                                                   6.2              9.1
                    Poisonings

Source: Public Health Ontario, Interactive Opioid Tool

Moreover, the mental illness hospitalization rate per 100,000 both in the city of Thunder Bay (972) and
the broader North West LHIN service area (933) is more than double the provincial rate (392).24

Additional resources are required for the continuum of mental health and sustance use treatment,
including targeted services for existing social housing tenants, in order to prevent and reduce
homelessness.

                                                                                                        11
Methodology
The District of Thunder Bay PiT Count was a snapshot of people experiencing homelessness on
April 21st, 2018. Registry Week was held from April 23rd to April 27th. The week-long method
collected personal information using the VI-SPDAT. With this information, it aims to learn every
person experiencing homelessness by name and starting a By-Name List, a “real-time list of all people
experiencing homelessness” in the community.25 It helps to provide a better understanding of the
movement into and out of homelessness and is a necessary tool to measure progress to ending
homelessness. Table 4 provides an overview of the two events.
Table 4 – Overview of the 2018 PiT Count and Registry Week
Point-in-Time Count Registry Week
To count the number of individuals
To know every individual experiencing
experiencing homelessness at a
Purpose homelessness by name and assign an
specific point in time as a benchmark
acuity score to help house them.
for progress.
Date 21-Apr-18 April 23-27, 2018
Number of Individuals
474 254
Surveyed
Number of Survey
9 14
Sites
HPS Core Questions, Optional COH
Survey Used Questions, and Local Questions + VI- VI-SPDAT
SPDAT
Data Collection
During the 24-hour period of April 21st, approximately 100 trained volunteers administered surveys at
9 survey locations throughout the city of Thunder Bay beginning at 6pm. There was also a mobile team
of volunteers from the Thunder Bay Indigenous Friendship Centre that targeted high priority locations
to survey people experiencing homelessness found outdoors. During the week of April 23rd to April
27th, trained volunteers administered the VI-SPDAT survey at 14 locations, including emergency
shelters, social services organizations and public libraries. Volunteers were also set up at locations in
Oliver Paipoonge, Marathon, Terrace Bay, and Geraldton (see Appendix 1 for all locations).
Volunteers were trained to treat everyone with respect, informing those surveyed that they could
refuse to answer questions or stop the survey at any time. Participants’ safety and comfort were a
priority. Consideration was taken to minimize any risks of harm from the survey questions – the survey
was voluntary, and an emergency resource information sheet was available (see Appendix 3). Following
cultural practices, food was offered to survey participants during the 24 hour PiT Count at the Thunder
Bay Indigenous Friendship Centre and at other magnet events held in the city. At the end of the survey,
all individuals were given a $20 honorarium for their participation.
12Surveys
Before conducting the survey, several screening questions were asked to determine whether
participants were eligible to continue. These questions were:
1. Have you already completed this survey with another volunteer?
2. Are you willing to participate in the survey?
3. Where are you staying tonight?
4. Do you have your own house or apartment you can safely return to?
These questions were used to control duplication and to ensure that participation was completely
voluntary. Participants were also told that there were two different surveys (one anonymous and one
that requires personal information) and that they were free to choose to do one or both.
The PiT Count focuses on enumeration of those who are experiencing absolute homelessness on
the day of the count: people experiencing unsheltered and emergency sheltered homelessness. The
hidden homeless population was included in the District of Thunder Bay’s PiT Count due to the
high proportion of people couch surfing in the 2016 PiT Count. Table 5 shows the different types of
homelessness that this year’s PiT Count was able to capture through two data collection methods
(enumeration and surveys).
Table 5 – Types of Homelessness Captured by the PiT Count
Typology Living Situation Enumeration Survey
People living in public or private
NO YES
spaces without consent or contract
Unsheltered
People living in places not intended
NO YES
for permanent human habitation
Emergency overnight shelters for
NO YES
people who are homeless
Emergency sheltered
Shelters for individuals/families
YES YES
impacted by family violence
Interim housing for people who are
NO YES
homeless
People living temporarily with
others, but without guarantee of
continued residency or immediate NO YES
prospects for accessing permanent
Provisionally housing
accommodated
People accessing short term,
temporary rental accommodations NO YES
without security of tenure
People in institutional care who lack
YES YES
permanent housing arrangements
Source: Canadian Observatory on Homelessness
13The District of Thunder Bay PiT Count survey consisted of 21 questions: 14 HPS mandated core
questions, 4 optional COH questions, and 3 local questions developed by the Thunder Bay Drug
Strategy and Elizabeth Fry Society of Northwestern Ontario (see Appendix 2 for the full survey).
The information collected provides a better understanding of the demographics of the homeless
population in The District of Thunder Bay at that point in time, as well as local information associated
with homelessness, including the child welfare system, substance use and incarceration.
Completion of the VI-SPDAT survey tool required participants to sign a consent form to address
privacy and confidentiality concerns regarding identifiable information. The consent form presented
the following information:
• How the information will be used
• Who will have access to the information
• Who to contact if participants want to withdraw consent
Enumeration
In addition to the survey, several locations were asked to complete enumeration forms detailing the
number of people who stayed overnight on April 21st with no permanent address to return to. The
following locations responded: Thunder Bay Regional Health Sciences Centre (Adult Mental Health),
Balmoral Centre (withdrawal management service), Faye Peterson Transition House (women’s shelter),
and St. Joseph’s Care Group (rehabilitation hospital/palliative care). The result from the enumeration
forms was included in the total enumeration to reflect a more accurate number of people experiencing
homelessness in The city of Thunder Bay, but as these counts do not include demographic information,
the report will focus on the surveyed individuals.
Volunteers
The joint PiT Count and Registry Week would not have been possible without volunteers who
contributed their time to the event. Approximately 100 people registered to volunteer, coming
from a variety of backgrounds. All volunteers were required to attend a training session before the
enumeration event. Training topics included safety, background information about the PiT Count and
Registry Week, cultural awareness, roles and responsibilities of volunteers, and the survey tools. At
the end of training, all volunteers signed an Oath of Confidentiality in order to ensure that personal
information of participants would not be shared. Other volunteer roles included helping to prepare
meals and serve them, greeting participants, and team captains.
14Data Entry and Analysis
Survey data from the PiT Count and Registry Week were entered into the Government of Canada’s
Homeless Individuals and Families Information System (HIFIS) and submitted to HPS. Before being
entered, surveys were examined for duplicates, void surveys (e.g. incomplete surveys), and signed
consent forms. A data quality check was done to ensure that the survey responses were entered
correctly into HIFIS.
The survey responses were exported to Excel for data analysis. The final results went through a data
quality check to ensure that calculations were free of errors. For both PiT Count and Registry Week
results, percentages were rounded, so the total may not add up to 100%.
The analysis scrutinized all of the survey participants as a whole and chose a few key subcategories
to compare. The categories included some demographic categories and some based on where the
respondent was planning to sleep that night:
• People who reported couch surfing;
• people who reported shelter use;
• people experiencing absolute homelessness (unsheltered/living on the street);
• people experiencing chronic homelessness (180+ days of homelessness in 12 months);
• youth (people under 25 years old);
• survivors of domestic violence;
• people who reported Indigenous identity; and
• women.
Most of these subcategories are not mutually exclusive; someone may fall into all five demographic
categories and one based on their sleeping arrangements. The only categories that would be
mutually exclusive from one another are those who reported couch surfing, shelter use or absolute
homelessness as these categories are based of the answer to a single question.
This report will outline the main responses for the survey participants, as well as any significant
deviations seen within the subcategories outlined above.
15Limitations
Although the PiT Count/Registry Week is a useful tool to count the number of people
experiencing homelessness, it is not without limitations:
Statistical Significance - Due to the difficulties in reaching people experiencing homelessness, a
number of methodological issues arise in obtaining a statistically significant sample. The survey results
are not random, only represent a single point in time, and are not large enough to be considered
statistically significant to extrapolate to a larger population. Any comments herein about the
population of people experiencing homelessness are only applicable to the group we have surveyed at
this specific point in time.
Minimum Count – The PiT Count is only a snapshot of homelessness, so it is impossible to enumerate
everyone experiencing homelessness in a community. It does not give a complete picture of people at
risk of housing loss, people who are couch surfing, and people who cycle in and out of homelessness.
Thus, the PiT Count should be considered to be a minimum estimate of individuals experiencing
homelessness.
Self-Reporting – Because the survey responses are self-reported, the results are dependent on the
honesty of the participants. This issue is greater for sensitive topics such as sexual orientation and
substance use, which participants may not be comfortable sharing with volunteers.
Duplications – The screening questions included whether participants already completed a survey,
but with a $20 honorarium and multiple survey locations, there is a reasonable likelihood of having
duplicate surveys. The anonymous PiT survey did not allow for duplicate surveys to be identified.
Inaccurate Survey Recording – Survey responses were not recorded appropriately (for example,
several surveys had multiple responses checked, were illegible, or were incorrectly entered). Data
entry was difficult as many responses were unclear and limited our information. There were several
VI-SPDAT surveys missing signed consent forms, so they had to be removed. Additionally, when
responses were incorrectly recorded for the VI-SPDAT, it could have impacted the acuity score.
16Recommendations for Future Point-in-Time Counts
and Registry Weeks
The second PiT Count and Registry Week in The District of Thunder Bay was a valuable learning
experience. Several recommendations to improve future enumeration events are:
• Better organization of surveys – number the surveys before the event and code them
according to the survey location for a more efficient data entry process.
• Consent forms – ensure that each survey has a consent form and that they are signed if the
VI-SPDAT survey is completed.
• Add demographic questions to the Registry Week only surveys for better data collection
• Modify the honorarium – $20 was given to participants whether they completed one survey
or both, which created a low incentive to complete the second part of the survey, the VI-
SPDAT. Assigning each part of the survey an honorarium (i.e. $10 for the first part and
$10 for the second part of the survey) could have improved the number of VI-SPDATs being
completed.
• Improved training for volunteers – additional training on administering the survey and
recording the responses will improve data collection.
• Improved volunteer appreciation - hosting an event with food to thank all community
volunteers soon after the PiT Count would have provided a sense of “job well done.” Sending
volunteers a copy of the infographic by e-mail would also honour their involvement.
• Community participation – while many community members volunteered for the PiT Count
and Registry Week, more community participation in the planning, organization, and
evaluation of the event is encouraged. Inviting people with lived experience to the Point-in-
Time Committee is highly recommended, as well as releasing the survey results at an event
for survey participants.
• Underrepresented populations – the PiT Count and Registry Week did not count many
youth or families. Future PiT Counts and Registry Weeks are encouraged to focus on
attracting underrepresented populations.
• Survey locations strategically placed throughout the city may reduce duplicate surveys.
Overlapping shifts for volunteers may help as well.
• Data entry and data sharing agreements articulated before funding application is submitted
to Service Canada to clarify roles and responsibilities of partnering organizations.
17Results
At least 516 people were counted experiencing homelessness during the 2018 PiT Count. Table 6
shows the totals according to the method of counting and typology of homelessness. 474 people were
surveyed and 42 people were identified through enumeration data provided by hospitals, a women’s
shelter, and a withdrawal management centre.
Table 6 – Total Count of People Experiencing Homelessness
Survey Enumeration Total
Unsheltered and
57 - 57
Unknown
Emergency sheltered 126 9 135
Provisionally
291 33 324
accommodated
Total 474 42 516
Demographics
Participants were asked if they identify as having Indigenous ancestry, as First Nations with or without
status, or as Métis. 66.5% of respondents reported having an Indigenous identity; this is a much
larger proportion than in the city of Thunder Bay where 12.5% of the population reports Indigenous
identity.26 Of those participants who were considered youth, 80% identified as Indigenous.
The average age of participants was 39. The average age for youth was 21, with the youngest
participant 16. The average age for survivors of domestic violence was 35.
When asked when they had first experienced homelessness, 61.4% of all respondents reported it was
before the age of 25. The average age of the first homeless episode was 24 years old.
When asked if they identified as veterans, 6.0% of participants served in the Canadian military and
1.1% served in the RCMP. Of those who identified as veterans, 75% identified as Indigenous and
90.9% identified as male.
The 2016 census states that 8.8% of the population in The city of Thunder Bay were immigrants.27 The
survey results showed that only 0.4% of individuals experiencing homelessness were immigrants. All of
the respondents who identified as immigrants, also identified they had been in Canada for more than
15 years.
When asked about their sexual orientation, 6.5% of respondents identified as LGBQ2S+. In the 2014
Canadian Community Health Survey, 1.7% of the population reported to be homosexual, and 1.3%
reported to be bisexual.28 Statistics on the LGBQ2S+ population are often estimates and thought to be
underreported, or focus specifically on youth for a number of reasons, “including the large percentage
of ‘out’ youth compared to the adult population”.29
18Place to Stay at Night
When asked where they were planning to stay that night, 50.63% of respondents planned to couch
surf (stay at someone else’s place), while 26.6% of survey participants were planning to stay in a
shelter. 7% of people who stayed in a shelter on April 21 had not stayed in a shelter before. 76.2% of
shelter users were male, while 60.5% of females planned to couch surf that night.
20% of youth either planned to stay somewhere unsheltered or didn’t know where they would stay;
70% of youth had used an emergency shelter before.
60.9% of survivors of domestic violence planned to couch surf. 50.4% of couch surfers had never
stayed in a shelter before.
Locations Participants Planned to Sleep on April 21, 2018
Public System
1% Don't know
Motel/Hotel 5%
2%
Transitional
8%
Unsheltered
7%
Couch surfing
51%
Emergency Shelter
26%
19Chronic and Episodic Homelessness Chronic homelessness is defined as experiencing homelessness for 180 days or more in a 12-month time period. 58.9% of survey participants reported being homeless for more than 6 months and are classified as chronically homeless. Episodic homelessness is defined as experiencing 3 or more homelessness events in a 12-month period. These periods of homelessness have a time gap between them. 21.3% of survey respondents are classified as episodically homeless. 13.6% of chronically homeless individuals were also classified as episodically homeless. 60.9% of participants classified as chronically homeless had been homeless for more than 1 year. 75.4% of those experiencing absolute homelessness are also chronically homeless and only 12.3% are episodically homeless. 14% of youth are episodically homeless, but 62% are chronically homeless.
Experience with Foster Care

Respondents were asked if they were ever in foster care; 37.6% of participants responded yes. That
number jumped to 52% when looking only at youth under 25; a statistically significant difference from
the total surveyed group. The Ontario Association of Children’s Aid Societies estimates that an average
of 12,794 children are in foster care in Ontario,30 which is around 0.5% of Ontario children under 18.31
Indigenous survey participants also had a higher rate of experience in the foster care system than the
rest of the respondents at 43.2%. When focusing on Indigenous youth, 55% had experience with foster
care.

Of the 61.4% of participants who first experienced homelessness before the age of 25, 77.4% also had
experience in the foster care system; this infers a correlation between history in foster care and the
early experience of homelessness for this group of survey participants.

                      Age at Time of First Homelessness Experience for
                      Participants Who Also Had History in Foster Care

                                           55+           Don't Know
                                           1%               1%
                                                                      45-54
                                                                       3%
                                                                                35-44
                                                                                 6%

                                                                                        25-34
                                                                                         11%

           Under 25
             78%

                                                                                                       21
Mental Health and Addiction
As addiction was the most reported reason for homelessness, the analysis included closer inspection
of the questions surrounding health and addiction. 45.1% of all survey participants reported a chronic
or acute medical condition, and 31% reported having a physical disability, and 45.4% reported having a
mental health condition. 70.9% of participants reported having an addiction with 48.9% of participants
reporting an increase in substance use since becoming homeless.
Of the respondents who reported having an addiction, 48.8% also reported having a chronic or acute
medical condition, 31% report a physical disability, and 50.9% report having a mental health condition.
10.3% of all respondents report having all 4 conditions.
Looking at the subcategories, 79.6% of couch surfers reported having an addiction and 57.1% reported
an increase in their substance use.
69.6% of survivors of domestic violence reported higher substance use since homelessness.
Percent of Participants who Self-Reported Health Conditions
100%
90%
80%
70.9%
70%
60%
48.9%
50%
45.1% 45.4%
40%
31.0%
30%
20%
14.60%
10%
0%
Chronic or Acute Physical Disability Addiction Mental Health All 4 Health Substance Use
Medical Condition Conditions Increased since
Homelessness
22Reasons for Homelessness
Participants were asked what they believe are the reasons for their homelessness. If the participant
could not freely give reasons, the volunteer provided a list of examples and the participant chose as
many of those options as they felt applicable. The top three self-reported reasons for homelessness
were addiction (32.7%), conflict with their partner (12.5%), and inability to pay their rent or mortgage
(11%). Across every subcategory except for survivors of domestic violence, the main self-reported
reason for homelessness was addiction (32.7% of survey participants). For survivors of domestic
violence, addiction is the second reason behind conflict with their partner.
Self-Reported Reasons for Homelessness
Addiction 32.7%
Conflict with Spouse/Partner 12.4%
Unable to Pay Rent/Mortgage/Utilities 11.2%
Unsafe Housing 9.9%
Incarceration 9.5%
Job Loss 9.1%
Illness/Medical Condition 7.4%
Conflict with Parent/Guardian 6.1%
Abuse - Spouse/Partner 4.2%
Death in Family 3.4%
Evicted - Other (non-financial) 2.5%
Hospitalization/Treatment 1.7%
Conflict with Landlord 1.7%
Abuse - Parent/Guardian 1.5%
Moved 1.3%
Conflict with Family 1.3%
Divorce/Separation 1.9%
Personal Conflict/Violence 1.5%
Other 2.7%
*Total exceeds 100% because multiple responses were possible.
23Sources of Income
As of the 2016 census, the city of Thunder Bay had 15,495 people with earnings below the Low
Income Measure – After Tax (LIM-AT), Participants were not asked whether they filed taxes, so it is
unclear how many would have been counted in this number. The participants would account for 3.1%
of those with earnings below the LIM-AT and 0.4% of the entire population of the city of Thunder Bay.
Social assistance/disability benefits were the main sources of income for 71.9% of people who
participated in the survey. The third most reported source of income was “No income.” These were
the three most reported sources of income across all subcategories studied. A single person receiving
Ontario Works qualifies for up to $384 per month for shelter costs, while the average rent for a
bachelor apartment in the City of Thunder Bay is $622 per month.32
Reported income Sources
Social Assistance 38.4%
Disability Benefit 33.5%
No Income 16.9%
Employment 7.0%
Other Social Benefits 3.0%
Family/Friends 2.7%
Employment Insurance or WSIB 1.7%
Senior's Benefit or Pension 1.7%
Other 1.1%
Decline to Answer 0.6%
*Total exceeds 100% because multiple responses were possible.
2471.9% of survey participants experiencing homelessness reported receiving
social assistance as their main source of income.Length of Time in Thunder Bay
Survey participants were asked if they have always been in this community; 25.7% of respondents
were from the city of Thunder Bay, 55.5% had been here for more than a year, and 13.5% had been
here for less than a year.
All subcategories reported around 69% not originally being from the city of Thunder Bay. Of those
not originally from this community, 61.8% reported being from Ontario, and 30.6% reported that they
came from a First Nations community.
The following map depicts the home communities of the survey participants who reported that they
migrated within Ontario to the city of Thunder Bay:
Home Cities of PiT Count Participants who Migrated to Thunder Bay: Ontario
# Respondants
1
2.5
5
7.5
10
Sources: Esri, USGS, NGA, NASA, CGIAR, N Robinson, NCEAS, NLS, OS, NMA, Geodatastyrelsen, Rijkswaterstaat, GSA, Geoland, FEMA, Intermap and the GIS user community
Data Source: Thunder Bay PiT Count - April 21-22, 2018
2677.4% of survey participants who were not originally from the city of Thunder Bay reported being in
this community for over a year.
The following map depicts the home communities of all of the survey participants who reported they
migrated to Thunder Bay:
Home Cities of PiT Count Participants who Migrated to Thunder Bay: Canada
# Respondants
1
2.5
5
7.5
10
Sources: Esri, USGS, NGA, NASA, CGIAR, N Robinson, NCEAS, NLS, OS, NMA, Geodatastyrelsen, Rijkswaterstaat, GSA, Geoland, FEMA, Intermap and the GIS user community
Data Source: Thunder Bay PiT Count - April 21-22, 2018
27Recommendations
Advocacy: Address the Service Gaps in Child Welfare Systems and Individuals Aging
out of Foster Care
Over one third of PiT count participants (37.6%) responded that they had been in foster care. That
number was significantly higher with participants under the age of 25 (52%). Alarmingly, 77.4% of
respondents who had first experienced homelessness before the age of 25 had experience in the foster
care system. Given this correlation between homelessness and a history of foster care – a correlation
well-supported by other research into homelessness – additional resources must be devoted to
address service gaps in child welfare systems, particularly to those aging out of foster care.
For Indigenous participants, experience in the foster care system was higher both in overall responses
(43.2%) and for those under 25 (55%), Culturally appropriate services that reconnect Indigenous
people to cultural teaching and parenting skills help to prevent entry into the foster care system and
prevent homelessness.
Expansion of Culturally Competent Supports and Housing for Indigenous People
In the 2018 PiT Count, 66% of survey respondents in the city of Thunder Bay identified as Indigenous.
To end Indigenous homelessness (as defined on p. 6 of this report), housing and housing supports need
to be culturally competent and holistic, addressing the need for Indigenous people to reconnect with
their Indigeneity and lost relationships to culture, place, family, community, identity.
In the Truth and Reconciliation “Calls to Action”, Indigenous peoples have the right to be actively
involved in developing and determining housing programmes affecting them, and to administer such
programmes through their own institutions as a part of the broader housing spectrum.
To this end, it is recommended that expansion of culturally competent supports and housing for
Indigenous people be developed and administered by and in partnership with Indigenous organizations,
while maintaining good relations and partnering with other housing service providers in Thunder Bay.
Expansion of the High Needs Homeless and Home for Good Systems
Individuals experiencing chronic homelessness utilize a disproportionate amount of bed nights at
emergency shelters and often require wrap-around supports to ensure successful tenancies when
housed. Rapidly housing individuals experiencing chronic homelessness, with supports, is an essential
step to relieving pressure on overburdened emergency shelter services. As such, there is a need to
explore opportunities to expand the High Needs Homeless and Home for Good systems, as well
as intensive case management supports provided by other community agencies, to assist a greater
number of individuals and families experiencing homelessness.
Through the High Needs Homeless system at TBDSSAB, emergency shelter resident needs are
assessed using the Service Prioritization and Decision Assistance Tool (SPDAT). Individuals are placed
in the High Needs Homeless social housing waitlist prioritization category if their SPDAT score is in
excess of a predetermined level. Through this, individuals who are placed in the High Needs Homeless
category are housed much quicker than if they remained on the chronological waitlist. The Home For
Good program provides intensive case management support for individuals that are placed in the High
Needs Homeless waitlist category.
28Research on Migratory and Transient Homelessness
Data collected in the PiT Count demonstrates that a considerable number of individuals experiencing
homelessness migrate to the city of Thunder Bay from remote northern communities as well as from
the city of Winnipeg. Very little is known about the reasons for migratory and transient homelessness
in the city of Thunder Bay beyond anecdotal accounts. As such, partnerships should be formed to
research the correlation between migration of individuals from smaller communities in northern
Ontario and the city of Winnipeg and the numbers of people experiencing homelessness, to inform
solutions to homelessness in District of Thunder Bay. Possible areas of concentration may include
substandard housing in remote communities; travel to the city of Thunder Bay to access services; and
the impacts of insufficient transportation infrastructure linking urban and rural communities.
Advocacy: Support for Addiction Treatment
The PiT Count revealed that addiction were the most self-reported cause for homelessness (32.7%)
among participants. Overall, 70.9% of participants reported having an addiction. This correlation
between addiction and homelessness is serious cause for concern. It is known, for example, that
opioid-related morbidity and mortality rates occur at a rate much higher in the District of Thunder Bay
than the provincial average. In order to address homelessness, additional resources must be devoted to
addiction treatment, prevention, and direct supports.
Coordinated Access System
In order to make the best use of existing resources, and to ensure that housing needs are being met
across the social housing continuum, the development and operation of a Coordinated Access System
to assist persons experiencing homelessness to access housing and supports should be explored. The
Canadian Alliance to End Homelessness defines Coordinated Access System as a “community-wide
system that streamlines the process for people experiencing homelessness to access housing and
supports and is an essential step to smarter, faster, more coordinated housing system.” Furthermore,
the utilization of Homeless Individuals and Families Information System (HIFIS) for the Coordinated
Access System should be considered for such an undertaking. There are currently a number of
organizations that provide support to homeless and vulnerable individuals in the District of Thunder
Bay. These organizations have overlapping mandates and receive funding from a variety of sources
resulting in some individuals receiving support from multiple channels while others cannot access
the system. The Coordinated Access system will address the current issues in coordinating the
support services system. As part of this move to coordinate support services, the TBDSSAB should
also work collectively with governments, both of Service Canada’s local funded Community Entities,
the Thunder Bay Housing and Homelessness Coalition Advisory Board, the People with Lived
Experience Advisory Committee, and community members at large. Collective impact and community
engagement, along with an alignment of the financial resources provided for homelessness services
including the Community Homelessness Partnering Strategy (CHPI), the Ontario commitment for
increased resources dedicated to mental health and addiction support services, as well as the Federal
Homelessness Partnering Strategy (HPS) and its successor programs under the National Housing
Strategy are imperative. This alignment of resources will result in a more coordinated, efficient
homelessness prevention system.
29Conclusion
The District of Thunder Bay’s second PiT Count and Registry Week in April 2018 was an opportunity
for a diverse group of community members and organizations to work together to create a snapshot
of homelessness. On the night of April 21st, 516 people were experiencing homelessness in the city of
Thunder Bay, with 474 of these individuals completing a survey.
The data collected from the PiT Count will be used as a benchmark of progress to end homelessness,
tailoring programs to serve the homeless population, changing policies regarding housing and social
assistance, and garner support from the community to join in the efforts to reduce homelessness in the
District of Thunder Bay.
30References
1. Gaetz S., Donaldson, J., Richter T., and Gulliver, T. “The State of Homelessness in Canada 2013,”
Canadian Homelessness Research Network Press 2013. http://homelesshub.ca/sites/default/
files/SOHC2103.pdf (accessed September 20, 2018).
2. Gaetz, S., Barr, C., Friesen, A., Harris, B., Hill, C., Kovacs-Burns, K., Pauly, B., Pearce, B., Turner,
A., Marsolais, A. “Canadian Definition of Homelessness,” Canadian Observatory on
Homelessness Press 2012. http://www.homelesshub.ca/sites/default/files/
COHhomelessdefinition.pdf (accessed September 20, 2018).
3. Ibid.
4. Canadian Observatory on Homelessness. “Indigenous Peoples.” Homeless Hub. 2017. http://
homelesshub.ca/about-homelessness/population-specific/indigenous-peoples (accessed
September 21, 2018)
5. Thistle, J. “Indigenous Defnition of Homelessness in Canada,” Canadian
Observatory on Homelessness 2017. http://homelesshub.ca/sites/default/files/
COHIndigenousHomelessnessDefinition.pdf (accessed September 20, 2018).
6. Donaldson, J. “Point-in-Time Count Toolkit,” Canadian Observatory on Homelessness Press
2017. http://homelesshub.ca/sites/default/files/Point-in-Time_Count_Toolkit.pdf (accessed
September 20, 2018).
7. Lakehead Social Planning Council. “Thunder Bay Point in Time Count Data 2016.” LSPC. April
2016. https://www.lspc.ca/2016-point-in-time-count/ (accessed October 25, 2018).
8. The Weather Network. “Historical Weather.” https://www.theweathernetwork.com/ca/weather/
historical-weather/caon0688 (accessed September 12, 2018).
9. Ibid.
10. Statistics Canada. 2017. Thunder Bay, CY [Census subdivision], Ontario and Thunder Bay, DIS
[Census division], Ontario (table). Census Profile. 2016 Census. Statistics Canada Catalogue no.
98-316-X2016001. Ottawa. Released November 29, 2017.
https://www12.statcan.gc.ca/census-recensement/2016/dp-pd/prof/index.cfm?Lang=E
(accessed September 14, 2018).
11. Government of Ontario. “Guidelines for Service Manager Homelessness Enumeration,” Ministry
of Housing February 2018. http://www.mah.gov.on.ca/AssetFactory.aspx?did=15968 (accessed
September 20, 2018).
12. 20,000 Homes Campaign. “20,000 Homes Campaign Toolkit,” Canadian Alliance to End
Homelessness June 10, 2015. http://www.20khomes.ca/resources/registry-week-toolkit/
(accessed September 20, 2018).
13. Homelessness Partnering Strategy. “2016 Coordinated Point-in-Time Count of Homelessness
in Canadian Communities,” Employment and Social Development Canada 2016. https://
www.canada.ca/content/dam/canada/employment-social-development/programs/
communities/homelessness/reports/highlights/PiT-Doc.pdf (accessed September 20, 2018).
14. Ontario Human Rights Commission. “Right at Home: Report on the consultation on human
rights and rental housing in Ontario,” Ontario Human Rights Commission May 28, 2008,
p.7. http://www.ohrc.on.ca/sites/default/files/attachments/Right_at_home%3A_Report_on_the_
consultation_on_human_rights_and_rental_housing_in_Ontario.pdf (accessed September 25,
2018).
15. Canada Mortgage and Housing Corporation. “Rental Market Report – Thunder Bay CMA,”
Canada Mortgage and Housing Corporation 2017. http://skyviewrealty.com/CMHCb/2017/
ThunderBay2017.pdf (accessed September 20, 2018).
3116. Statistics Canada. 2016. “Census Profile, Canada,” Statistics Canada. https://www12.statcan.
gc.ca/census-recensement/2016/dp-pd/prof/details/page.cfm (accessed September 20, 2018).
17. Ibid.
18. Statistics Canada. 2016. “Dictionary, Census of Population, 2016 Low-income measure,
after tax (LIM-AT),” Statistics Canada. Released May 3, 2017. Updated September 13, 2017.
https://www12.statcan.gc.ca/census-recensement/2016/ref/dict/fam021-eng.cfm (accessed
September 20, 2018).
19. Statistics Canada. 2016. “Dictionary, Census of Population, 2016. Table 4.2. Low-income
measures thresholds (LIM-AT and LIM-BT) for private households of Canada 2015,” Statistics
Canada. Modified August 10, 2017. https://www12.statcan.gc.ca/census-recensement/2016/
ref/dict/tab/t4_2-eng.cfm (accessed September 20, 2018).
20. Statistics Canada. 2016. “Income Highlight Tables, 2016 Census. Low-income statistics by
age groups,” Statistics Canada. Modified September 11, 2017. https://www12.statcan.gc.ca/
census-recensement/2016/dp-pd/hlt-fst/inc-rev/Table.cfm?Lang=Eng&T=302&S=88&O=D&R
PP=25 (accessed September 20, 2018).
21. Income Security Reform Working Group. “Income Security: A Roadmap for Change,” Income
Security Working Group October 2017. https://files.ontario.ca/income_security_-_a_roadmap_
for_change-english-accessible_0.pdf (accessed September 24, 2018).
22. See for example, Emma Woolley, “Have there been any studies linking mental health, addictions
and homelessness?,” Homelessness Hub May 29, 2015. http://homelesshub.ca/blog/have-
there-been-any-studies-linking-mental-health-addictions-and-homelessness (accessed
September 24, 2018).
23. Thunder Bay Drug Strategy. “Building a Better Tomorrow: Thunder Bay Drug Strategy
2017-2021,” October 2017. https://www.thunderbay.ca/en/city-hall/resources/Documents/
ThunderBayDrugStrategy/BuildingaBetterTomorrow-Drug-Strategy.pdf (accessed September
24, 2018).
24. Northwest Local Health Integration Network. “Health Profile – City of Thunder Bay
Integrated District Network,” May 2012. http://www.northwestlhin.on.ca/~/media/
sites/nw/uploadedfiles/Home_Page/Integrated_Health_Service_Plan/IDN%20Profile_
CityOfThunderBay_09May2012.pdf (accessed September 24, 2018).
25. 20,000 Homes Campaign. “By-Name Lists,” Canadian Alliance to End Homelessness. http://
www.20khomes.ca/resources/by-name-lists/ (accessed September 20, 2018).
26. Statistics Canada. 2017. Thunder Bay, CY [Census subdivision], Ontario and Thunder Bay,
DIS [Census division], Ontario (table). Census Profile. 2016 Census. Statistics Canada Catalogue
no. 98-316-X2016001. Ottawa. Released November 29, 2017. https://www12.statcan.gc.ca/
census-recensement/2016/dp-pd/prof/index.cfm?Lang=E (accessed September 14, 2018).
27. Ibid.
28. Statistics Canada. 2015. “Same-sex Couples and Sexual Orientation… by the numbers.”
The Daily. Ottawa. Released June 25, 2015. https://www.statcan.gc.ca/eng/dai/smr08/2015/
smr08_203_2015 (accessed September 14, 2018).
29. Canadian Observatory on Homelessness. “Lesbian, Gay, Bisexual, Transgender, Transsexual,
Queer, Questioning and Two-Spirit (LGBTQ2S).” Homeless Hub. 2017. http://homelesshub.
ca/about-homelessness/population-specific/lesbian-gay-bisexual-transgender-transsexual-
queer (accessed September 17, 2017).
3230. Ontario Association of Children’s Aid Societies. “Facts and Figures.” Ontario Association of
Children’s Aid Societies. 2017. http://www.oacas.org/childrens-aid-child-protection/facts-and-
figures/ (accessed September 18, 2018).
31. Ontario Ministry of Finance. “Table 6: Ontario population by age, 2017-2041 – reference
scenario.” Ontario Population Projections Update, 2017-2041. 2017. https://www.fin.gov.
on.ca/en/economy/demographics/projections/table6.html (*accessed September 18, 2018).
32. Canada Mortgage and Housing Corporation. “Primary Rental Market Statistics – Thunder Bay
(CY).” CMHC Housing Market Information Portal. 2018. https://www03.cmhc-schl.gc.ca/hmip-
pimh/en#Profile/3558004/4/Thunder%20Bay%20(CY)%20(Ontario) (accessed September
18, 2018).
Photo Credits
Cover - Woman Sitting - Photo by Christopher Sardegna on Unsplash
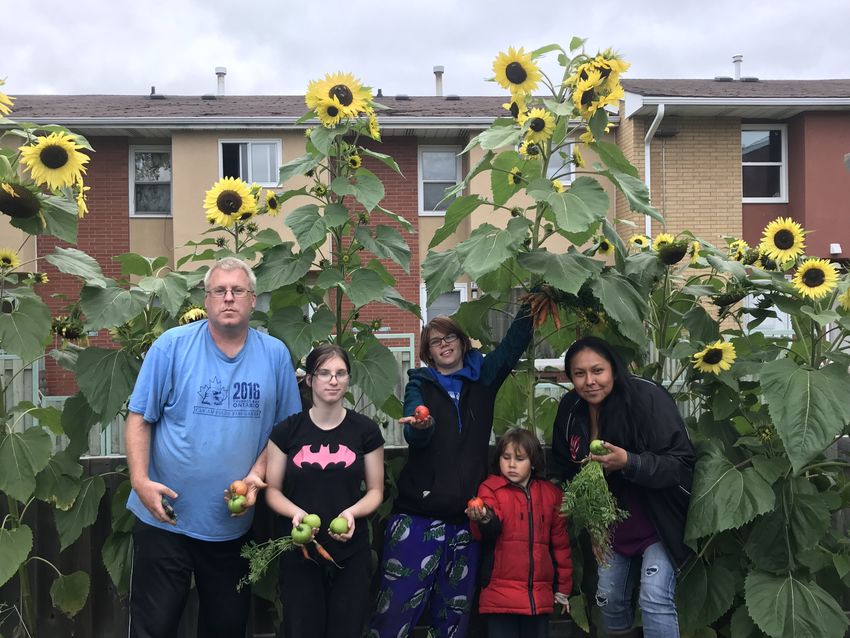
Page 10 - Tenants in the Garden - The District of Thunder Bay Social Services Administration Board
Page 20 - Man Leaning - Photo by Warren Wong on Unsplash
Page 25 - Woman’s Hands - Photo by Cristian Newman on Unsplash
33You can also read