Age groups that sustain resurging COVID-19 epidemics in the United States - Science
←
→
Page content transcription
If your browser does not render page correctly, please read the page content below
RESEARCH ARTICLES

 Cite as: M. Monod et al., Science
 10.1126/science.abe8372 (2021).

Age groups that sustain resurging COVID-19 epidemics in
the United States
Mélodie Monod1*, Alexandra Blenkinsop1*, Xiaoyue Xi1*, Daniel Hebert2*, Sivan Bershan3*, Simon Tietze3*,
Marc Baguelin4, Valerie C. Bradley6, Yu Chen1, Helen Coupland4, Sarah Filippi1, Jonathan Ish-Horowicz1,
Martin McManus1, Thomas Mellan4, Axel Gandy1, Michael Hutchinson6, H. Juliette T Unwin4, Sabine L. van
Elsland4, Michaela A. C. Vollmer4, Sebastian Weber5, Harrison Zhu1, Anne Bezancon3, Neil M. Ferguson4,
Swapnil Mishra4, Seth Flaxman1†, Samir Bhatt4,7†, and Oliver Ratmann1*†, on behalf of the Imperial College
COVID-19 Response Team
1Department of Mathematics, Imperial College London, London, UK. 2Foursquare Inc, New York, NY, USA. 3Emodo, San Francisco, CA, USA. 4MRC Centre for Global

Infectious Disease Analysis; and the Abdul Latif Jameel Institute for Disease and Emergency Analytics (J-IDEA), School of Public Health, Imperial College London, London,
UK. 5Novartis Pharma AG, Basel, Switzerland. 6Department of Statistics, University of Oxford, Oxford, UK. 7Section of Epidemiology, Department of Public Health, University

 Downloaded from http://science.sciencemag.org/ on February 5, 2021
of Copenhagen, Denmark.
*These authors contributed equally to this work.
†Corresponding author:oliver.ratmann@imperial.ac.uk (O.R.); s.bhatt@imperial.ac.uk (S.B.); s.flaxman@imperial.ac.uk (S.F.)

Following initial declines, in mid 2020 a resurgence in transmission of novel coronavirus disease (COVID-
19) occurred in the US and Europe. As COVID19 disease control efforts are re-intensified, understanding the
age demographics driving transmission and how these affect the loosening of interventions is crucial. We
analyze aggregated, age-specific mobility trends from more than 10 million individuals in the US and link
these mechanistically to age-specific COVID-19 mortality data. We estimate that as of October 2020,
individuals aged 20-49 are the only age groups sustaining resurgent SARS-CoV-2 transmission with
reproduction numbers well above one, and that at least 65 of 100 COVID-19 infections originate from
individuals aged 20-49 in the US. Targeting interventions – including transmission-blocking vaccines – to
adults aged 20-49 is an important consideration in halting resurgent epidemics and preventing COVID-19-
attributable deaths.

Following worldwide spread of the novel severe acute respir- through October 29, 2020, and quantify changes in transmis-
atory syndrome coronavirus 2 (SARS-CoV-2), the implemen- sion dynamics since schools reopened.
tation of large-scale non-pharmaceutical interventions has Similar to many other respiratory diseases, the spread of
led to sustained declines in the number of reported SARS- SARS-CoV-2 occurs primarily through close human contact,
CoV-2 infections and deaths from coronavirus disease 2019 which, at a population level, is highly structured (6). Prior to
(COVID-19) (1, 2). However, since mid-June 2020, the daily the implementation of COVID-19 interventions, contacts con-
number of reported COVID-19 cases is resurging in Europe centrated among individuals of similar age, were highest
and North America, and surpassed in the United States alone among school-aged children and teens, and also common be-
40,000 daily reported cases on June 26, and 100,000 on No- tween children/teens and their parents, and middle-aged
vember 4 2020 (3). Demographic analyses have shown that adults and the elderly (6). Since the beginning of the pan-
the share of individuals aged 20-29 among reported cases in- demic, these contact patterns have changed substantially (7–
creased most, suggesting that young adults may be driving 9). In the US, the Berkeley Interpersonal Contact Study indi-
re-surging epidemics (4). However reported COVID-19 case cates that in late March 2020 after stay-at-home orders were
data may not be a reliable indicator of disease spread due to issued, the average number of daily contacts made by a single
the large proportion of asymptomatic COVID-19, increased individual, also known as contact intensity, dropped to four
testing, and changing testing behavior (5). Here, we use de- or fewer contacts per day (9). Data from China show that in-
tailed, longitudinal, and age-specific population mobility and fants and school-aged children and teens had almost no con-
COVID-19 mortality data to estimate how non-pharmaceuti- tact to similarly aged children and teens in the first weeks
cal interventions, changing contact intensities, age, and other after stay-at-home orders, and reduced contact intensities
factors have interplayed and led to resurgent disease spread. with older individuals (7). However, detailed human contact
We test previous claims that resurgent COVID-19 is a result and mobility data have remained scarce, especially longitudi-
of increased spread from young adults, identify the popula- nally, although such data are essential to better understand
tion age groups driving SARS-CoV-2 spread across the US the engines of COVID-19 transmission (10).

First release: 2 February 2021 www.sciencemag.org (Page numbers not final at time of first release) 1
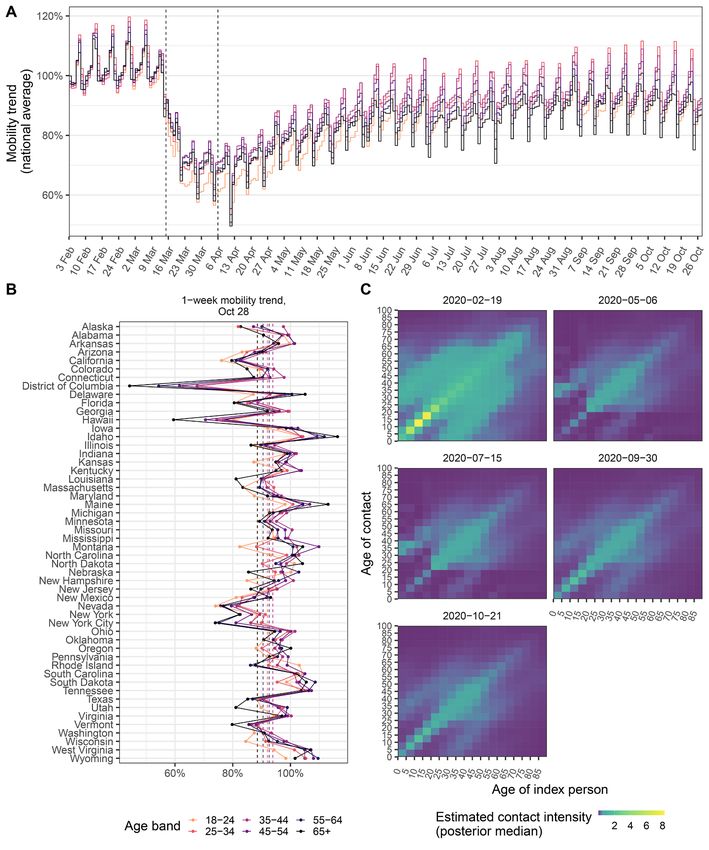
Cell-phone data suggest similar rebounds in mobility and transmission dynamics at state and metropolitan area-
across age groups level across the US. For the time period prior to changes in
We compiled a national-level, aggregate mobility data set us- mobility trends, we used data from pre-COVID-19 contact
ing cell phone data from >10 million individuals with Four- surveys (6), and each locations’s age composition and popu-
square’s location technology, Pilgrim (11), which leverages a lation density to predict contact intensities between individ-
wide variety of mobile device signals to pinpoint the time, uals grouped in 5-year age bands (figs. S4 to S6), similar as in
duration, and location of user visits to locations such as (18). On weekends, contact intensities between school-aged
shops, parks, or universities. Unlike the population-level mo- children and teens are lower than on weekdays, while inter-
bility trends published by Google from cell phone geolocation generational contact intensities are higher. In the model, the
data (12), the data are disaggregated by age. User venue visits observed age-specific mobility trends of Fig. 1 are then used
were aggregated and projected to estimate for each state and to estimate in each location (state or metropolitan area) daily
two metropolitan areas daily percent changes in venue visits changes in age-specific contact intensities for individuals
for individuals aged 18−24, 25−34, 35−44, 45−54, 55−64, and aged 20 and above. For younger individuals, for who mobility
65+ years relative to the the baseline period February 3 - Feb- trends are not recorded, contact intensities during school clo-
ruary 9, 2020 (figs. S1 and S2, and supplementary materials). sure periods were set to estimates from two contact surveys

 Downloaded from http://science.sciencemag.org/ on February 5, 2021
 Across the US as a whole, the mobility trends indicate sub- conducted post COVID-19 emergence (7, 8). After school reo-
stantial initial declines in venue visits followed by a subse- pening in August 2020, relative changes in disease relevant
quent rebound for all age groups (Fig. 1A and fig. S1). During contacts from and to children and teens aged 0-19 were esti-
the initial phase of epidemic spread, trends declined most mated through the model. Contact intensities between chil-
strongly among individuals aged 18-24 years across almost all dren and teens were modeled and estimated separately, to
states and metropolitan areas, and subsequently tended to account for potentially lower or higher disease relevant con-
increase most strongly among individuals aged 18-24 in the tacts between children and teens in the context of existing
majority of states and metropolitan areas (fig. S3), consistent non-pharmaceutical interventions within and outside schools
with re-opening policies for restaurants, night clubs, and (see Materials and methods). As in (19), the model further in-
other venues (10, 13, 14). Yet, considering both the initial de- corporates random effects in space, time, and by age to allow
cline and subsequent rebound until October 28, 2020, our for unobserved, potential age-specific factors that could mod-
data indicate that mobility levels among individuals aged
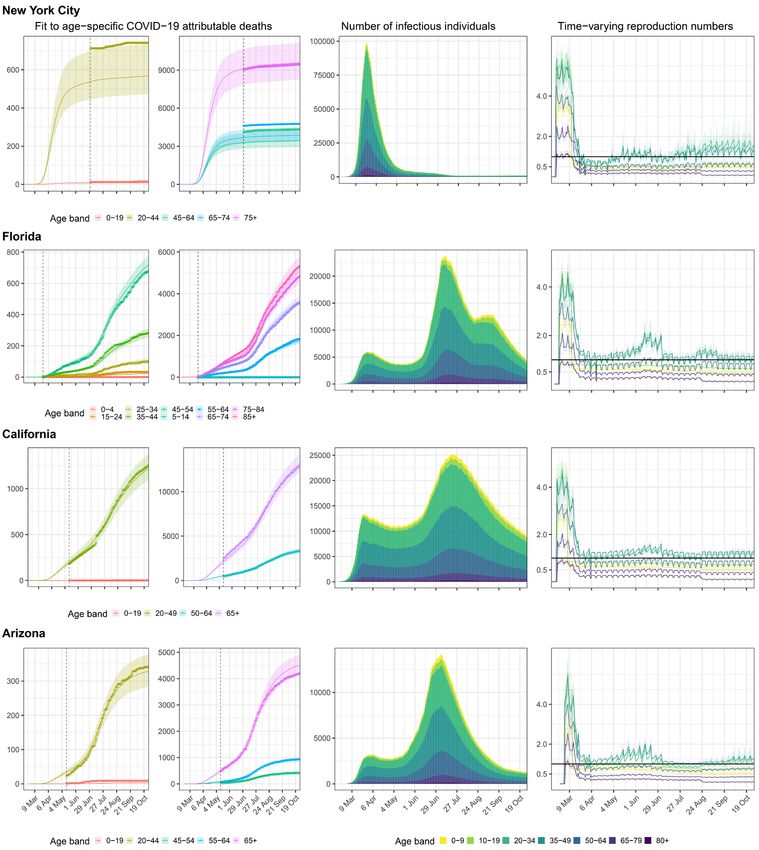
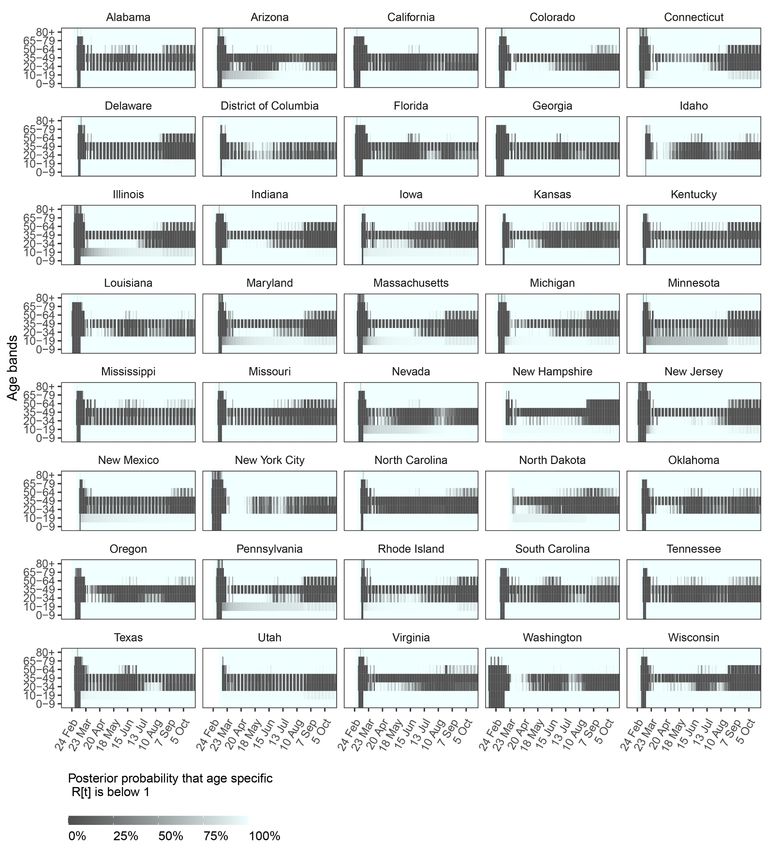
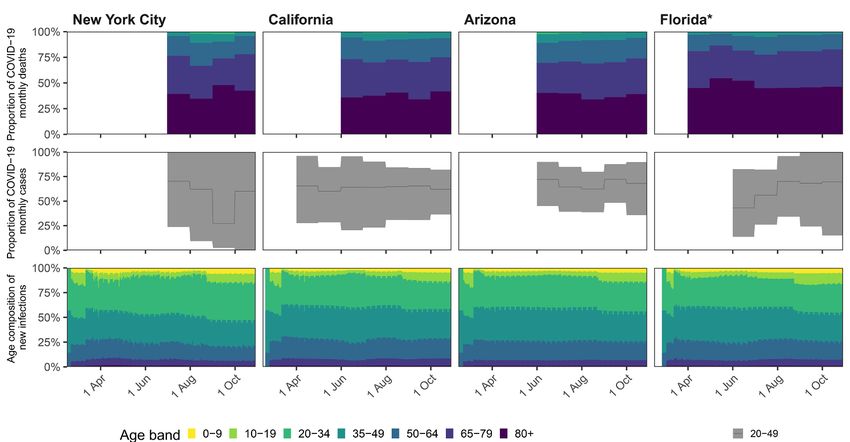
performed in a Bayesian framework and restricted to 38 US reveals together with Fig. 3 considerable heterogeneity in
states, the District of Columbia and New York City with at age-specific transmission dynamics across locations. While
least 300 COVID-19-attributed deaths, giving a total of 8,676 the model consistently estimates effective reproduction num-
observation days. The estimated disease dynamics closely re- bers close to or above one across all locations from adults
produced the age-specific COVID-19 death counts (fig. S8). aged 35-49, disease dynamics are more variable from young
 Figure 2 illustrates the model fits for New York City, Flor- adults aged 20-34, with some states (Arizona, Florida, Texas)
ida, California, and Arizona, showing that the inferred epi- showing sustained transmission from young adults in May
demic dynamics differed markedly across locations. For and June, and other states (e.g., Colorado, Illinois, Wisconsin)
example, in New York City, the epidemic accelerated for at showing sustained transmission from young adults since Au-
least 4 weeks since the 10th cumulative death and until age- gust. This suggests that additional interventions to adults
specific reproduction numbers started to decline, resulting in aged 20-49, including rapid mass vaccination if vaccines
an epidemic of large magnitude as shown through the esti- prove to block transmission, could bring resurgent COVID-19
mated number of infectious individuals (Fig. 2, mid column). epidemics under control.
Subsequently, we find that reproduction numbers for all age
groups were controlled to well below one except for individ- The majority of COVID-19 infections originate from age

 Downloaded from http://science.sciencemag.org/ on February 5, 2021
uals aged 20-49 (Fig. 2, rightmost column), resulting in a groups 20-49
steady decline of infectious individuals. In the model, chil- To quantify how age groups contribute to resurgent COVID-
dren and teens returned to their pre-lockdown contact inten- 19, it is not enough to estimate reproduction numbers, be-
sities on August 24, 2020 or later, depending on when state cause reproduction numbers estimate the number of second-
administrations no longer mandated state-wide school clo- ary infections per infectious individual, and the number of
sures, and relative decreases or increases in their disease rel- infectious individuals varies by age as a result of age-specific
evant contact intensities after school-reopening were susceptibility gradients and age-specific contact exposures.
estimated. Concomitantly, reproduction numbers from chil- We therefore considered the reconstructed transmission
dren aged 0-9 and teens aged 10-19 increased, but as of the flows and calculated from the fitted model the contribution
last observation week in October 2020 we find no strong evi- of each age group to new infections in each US location over
dence that their reproduction numbers have exceeded one at time. Across all locations evaluated, we estimate that until
population level in most states and metropolitan areas con- mid-August 2020, before schools were considered to re-open
sidered. Detailed situation analyses for all locations are pre- in the first locations in the model, the percent contribution
sented in the supplementary materials. to onward spread was 41.1% [40.7%-41.4%] from individuals
 aged 35-49, compared to 2.1% [1.6%-2.8%] from individuals
SARS-CoV-2 transmission is sustained primarily from aged 0-9, 4.0% [3.5%-4.6%] from individuals aged 10-19,
age groups 20-49 34.7% [33.9%-35.5%] from individuals aged 20-34, 15.3%
Figure 3 summarizes the epidemic situation for all states and [14.8%-15.8%] from individuals aged 50-64, 2.5% [2.2%-2.9%]
metropolitan areas evaluated, and the age groups that sustain from individuals aged 65-79 age group, and 0.3% [0.3%-0.3%]
COVID-19 spread. In the last observation week in October from individuals aged 80+ (table S4). Spatially, the contribu-
2020, the estimated reproduction number across all locations tion of adults aged 35-49 were estimated to be remarkably
evaluated was highest from individuals aged 35-49 (1.39 [1.34- homogeneous across states, whereas the estimated contribu-
1.44]) and 20-34 (1.29 [1.24-1.36]), and around one for age tions of young adults aged 20-34 to COVID-19 spread tended
groups 1019 and 50-64 (tables S1 and S2). These trends across to be higher in Southern, South-western, and Western re-
age groups were largely consistent over time. The primary gions of the US (Fig. 4), in line with previous observations (4).
mechanisms underlying the high reproduction numbers from
20–49-year-olds are that at population level, adults aged 20- No substantial shifts in age-specific disease dynamics
49 naturally have most contacts to other adults aged 20 and over time
above, which are more susceptible to COVID-19 than younger Over time, we found that the share of age groups among the
individuals, paired with increasing mobility trends for these observed COVID-19 attributable deaths was remarkably con-
age groups since April 2020 (Fig. 1 and fig. S6). In addition, stant (Fig. 5A and fig. S11), which stands in contrast to the
from the death time series data, the model inferred charac- large fluctuations in the share of age groups among reported
teristic random effect signatures in time and by age across cases (4). To test for shifts in the share of age groups among
locations (fig. S9), which indicate elevated transmission risk COVID-19 infections, we next back-calculated the number of
per venue visit for individuals aged 20-49 relative to other expected, age specific infections per calendar month of aggre-
age groups. Figure S10 visualizes the combined, estimated ef- gated COVID-19 attributable deaths using meta-analysis esti-
fects of mobility and behavior on transmission risk, and mates of the age-specific COVID-19 infection fatality ratio

First release: 2 February 2021 www.sciencemag.org (Page numbers not final at time of first release) 3
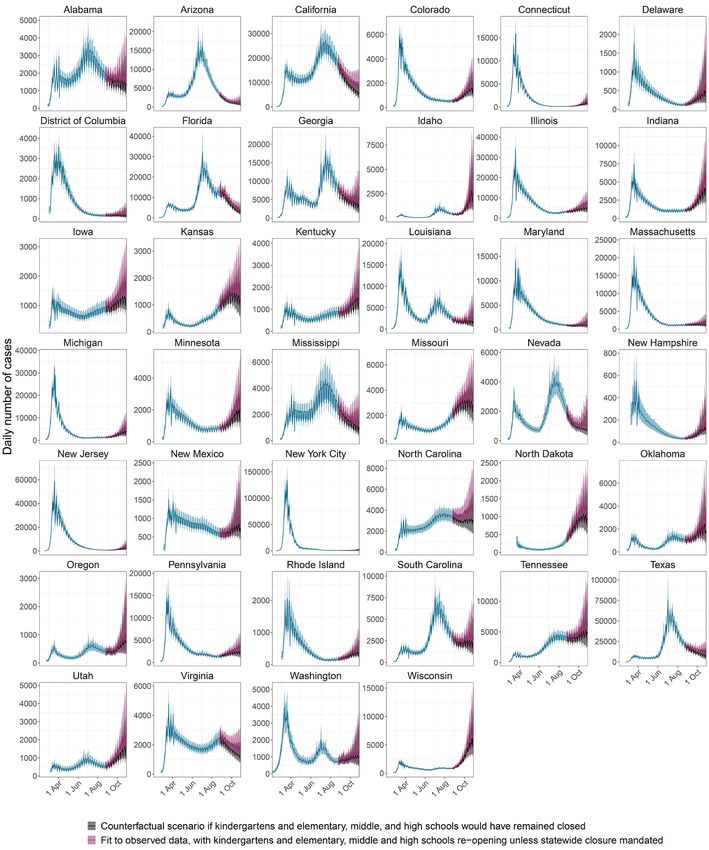
(20). This empirical analysis suggested no statistically signif- substantial. In retrospective counterfactual scenarios we ex-
icant trends in the share of age groups among COVID19 in- plored what COVID-19 case and death trajectories would
fections (Fig. 5B and fig. S12), which is further supported by have been expected if schools had remained closed, and find
model estimates (Fig. 5C and fig. S13). Based on the combined a large overlap between the counterfactual and actual case
mobility and death data, we find the reconstructed fluctua- and death trajectories (Fig. 6, fig. S15). However, since chil-
tions in age-specific reproduction numbers had only a rela- dren and teens seed infections in older age groups that are
tively modest impact on the contribution of age groups to more transmission efficient, as of October 2020, school open-
onward spread over time, and no evidence that young adults ing is associated with an estimated 25.7% [14.5%-40.5%] in-
aged 20-34 were the primary source of resurgent COVID-19 crease of COVID-19 infections and a 5.9% [3.4%-9.3%]
in the US over summer 2020. These results underscore that, increase in COVID-19 attributable deaths (table S7). Larger
when testing rates are heterogeneous and not population rep- proportions of COVID-19 infections and deaths are attributed
resentative, it is challenging to determine the age-specific to school re-openings if the actual number of cases among
pattern of transmission based only on reported case data. school-aged children is more than six times larger than the
 number in school situation reports (table S7). These findings
School reopening has not resulted in substantial in- indicate that adults aged 20-34 and 3549 continue to be the

 Downloaded from http://science.sciencemag.org/ on February 5, 2021
creases in COVID-19 attributable deaths only age groups that contribute disproportionally to COVID-
Between August and October 2020, school closure mandates 19 spread relative to their size in the population (fig. S14), and
have been lifted in 39 out of 40 of the US locations evaluated that the impact of school reopening on resurgent COVID-19
in this study, and provided 2,570 observation days to estimate is mitigated most effectively by strengthening disease control
the impact of school reopening on COVID-19 spread. The fol- to adults aged 20-49.
lowing analyses are therefore based on fewer data points than
those aforementioned, rely on mortality figures accrued until Caveats
end of October 2020, as well as reported school case data The findings of this study need to be considered in the con-
from Florida and Texas, which were used to define lower and text of the following limitations. Rossen and colleagues (22)
upper bounds on cumulative attack rates among children and observed that US excess deaths between the beginning of the
teens aged 5-18 (see Materials and methods). Reflecting stut- pandemic and October 2020 were by 38% higher than the re-
tering transmission chains in school settings, reproduction ported COVID-19 attributable deaths, suggesting that the
numbers from children aged 0-9 and teens aged 10-19 were death data on which this analysis rests are subject to under-
estimated at below one (respectively 0.52 [0.42-0.60] and 0.73 reporting. The scale of the US epidemics may be larger than
[0.57-0.88]) after schools were considered to have reopened we infer, and our age-specific analyses may be biased if un-
in the model (Fig. 3 and table S2). Reproduction numbers derreporting of deaths depends on age. However, due to the
from children were lower than from teens because at popula- high proportion of asymptomatic COVID-19 cases (5), un-
tion-level preschoolers have fewer contacts than school-aged derreporting is a substantially larger caveat for reported case
children (fig. S6). data, and in particular the observed shifts in the share of age
 Since school closure mandates were lifted, the higher re- groups among reported cases (4, 23), which are absent from
production numbers from children and teens resulted in age the share of age groups among reported deaths (fig. S11). This
shifts in the sources of SARS-CoV-2 infections. In October suggests that age-specific death data provide a more reliable
2020 an estimated 2.7% [1.8%-3.7%] of infections originated picture into resurgent COVID-19 epidemics than reported
from children aged 0-9, 7.1% [4.5%-10.3%] from teens aged cases. We further rely on limited data from two contact sur-
10-19, 34.0% [31.9%-36.4%] from 20-34, 38.2% [36.7%-39.4%] veys performed in the United Kingdom and China to charac-
from 35-49, 15.1% [14.1%-16.1%] from 50-64, 2.5% [2.2%-2.9%] terize contact patterns from and to younger individuals
from 65-79, and 0.3% [0.2%-0.3%] from individuals aged 80+ during school closure periods (7, 8), and this could have bi-
across all locations evaluated (table S5 vs table S4). The re- ased our findings that children and teens have contributed
constructed shifts in the age of COVID-19 sources after school negligibly to SARS-CoV-2 spread until school reopening. To
reopening are relatively modest compared to the typical age address this limitation, we explored the impact of higher in-
profile of infection sources of pandemic flu (21), and reflect ter-generational contact intensities involving children during
lower age-specific susceptibility to SARS-CoV-2 transmission school closure periods, and in these analyses the estimated
among children and teens, but also substantially fewer, in- contribution of children aged 0-9 to onward spread until Au-
ferred disease relevant contacts from children and teens than gust 2020 remained below 5% and the contribution of teens
would be expected from their corresponding pre-pandemic aged 10-19 remained below 12.5% (see supplementary mate-
contact intensities. The mechanisms behind these beneficial rials). Epidemiologic models are sensitive to assumptions on
effects remain unclear, but the model suggests they are the infection fatality ratio (IFR) that enables the estimation

First release: 2 February 2021 www.sciencemag.org (Page numbers not final at time of first release) 4
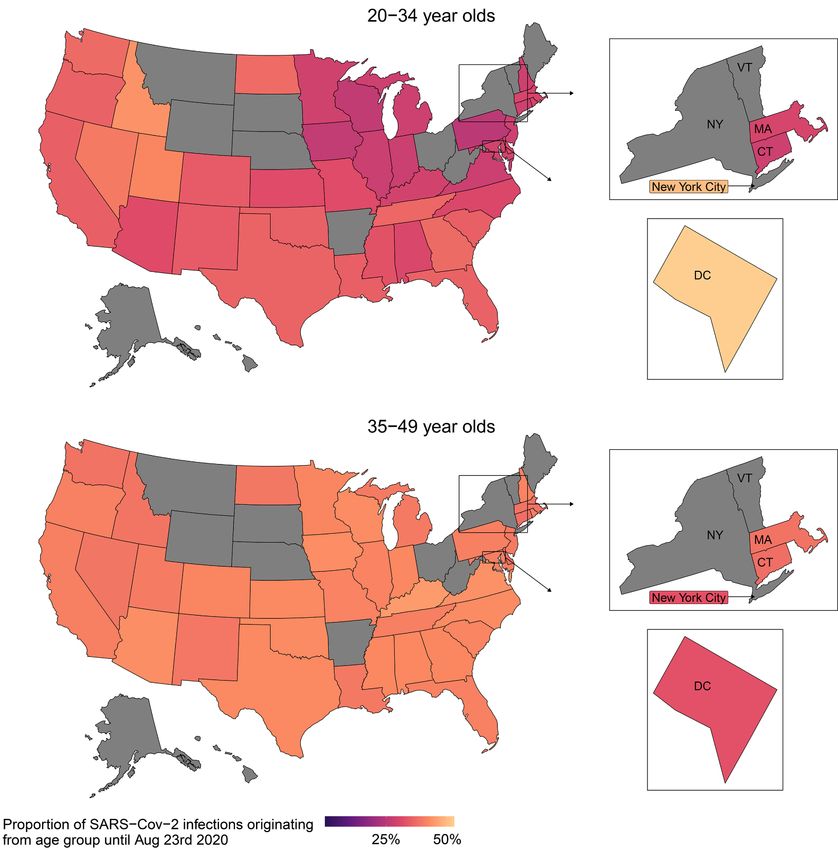
of actual cases from observed deaths by age. Our analyses are Over time, the share of age groups among reported deaths
based on a meta-analysis that consolidates estimates from 27 has been remarkably constant, suggesting that young adults
studies and 34 geographic locations (20). To test the assumed are unlikely to have been the primary source of resurgent ep-
IFR, we compared the scale of the estimated resurgent epi- idemics since summer 2020, and that instead changes in mo-
demics against data from sero-prevalence surveys conducted bility and behavior among the broader group of adults aged
by the Centers for Disease Control and Prevention (CDC) (24), 20-49 underlie resurgent COVID-19 in the US in 2020. This
and found good congruence (table S6 and supplementary ma- study indicates that in locations where novel highly-transmis-
terials). The COVID19 epidemic is more granular than con- sible SARS-CoV-2 lineages have not yet established, addi-
sidered in our spatial modelling approach. Substantial tional interventions among adults aged 20-49, such as mass
heterogeneity in disease transmission exists at county level vaccination with transmission-blocking vaccines, could bring
(25), and our situation analyses by state and metropolitan ar- resurgent COVID-19 epidemics under control and avert
eas need to be interpreted as averages. To no exception, the deaths.
model underlying our analyses also relies on simplifying
mathematical assumptions on population-level disease Materials and Methods
spread, which may be shown unsuitable as further evidence To characterize the role of age groups in driving resurgent

 Downloaded from http://science.sciencemag.org/ on February 5, 2021
on SARS-CoV-2 transmission accumulates (26). For instance, COVID-19, we have taken a systematic approach that in-
the model assumes children and teens are as transmissible as volved data collection, mathematical modelling, likelihood-
adults, which has been challenging to quantify to date (27), based inference, and validation against external data. The fol-
and falls short of accounting for population structure other lowing sections summarize our materials and methods, and
than age, such as household settings, where attack rates have full technical details are in the Data Availability Statement
been estimated to be substantially higher than in non-house- and the supplementary Materials.
hold settings (28). It is possible that the model under-esti-
mates the impact of school reopening on SARS-CoV-2 Data and data processing
transmission. The analyses presented in this study are based on age-specific
 Data from countries that have re-opened schools have COVID-19 attributable mortality counts that were collected
provided little evidence for substantial transmission in daily from US state and city Departments of Health (DoH),
schools, nor significantly increased community-level infec- all-age COVID-19 death counts, all-age COVID-19 case counts,
tion rates after school reopening until the emergence of more COVID-19 case counts in school settings K1-K15, human con-
transmissible SARS-CoV-2 variants (29, 30), but this might tact data before and during the pandemic, and human mobil-
reflect frequent sub-clinical infection among school-aged ity data during the pandemic.
children. More transmissible SARS-CoV-2 variants could in- Briefly, age-specific COVID-19 cumulative death counts
crease reproduction numbers to above one for all age groups, were retrieved for 42 US states, the District of Columbia and
which implies substantial spread from all age groups, and re- New York City from city or state DoH websites, data reposi-
quire generally stricter control measures across all ages to tories, or via data requests to DoH (table S8). Data were
prevent COVID-19 attributable deaths (31). checked for consistency and adjusted when necessary. Age-
 specific COVID-19 death time series were reconstructed from
Conclusions cumulative counts, and the time series were used for model
This study provides evidence that the resurgent COVID-19 ep- fitting (32).
idemics in the US in 2020 have been driven by adults aged All-age daily COVID-19 case and death counts from Feb-
20-49, and in particular adults aged 35-49, before and after ruary 01, 2020 until October 30, 2020 regardless of age were
school reopening. Unlike pandemic flu, these adults ac- obtained from John Hopkins University (JHU) for all U.S.
counted after school reopening in October, 2020 for an esti- states and the District of Columbia (3), except New York
mated 72.2% [68.6%-75.9%] of SARS-CoV-2 infections in the State. For New York State, daily COVID-19 death counts from
US locations considered, whereas less than 5% originated February 01, 2020 until October 30, 2020 were obtained from
from children aged 0-9 and less than 10% from teens aged 10- the New York Times’ (NYT) data (33). For New York City,
19. The population mobility data, and the death data pro- daily COVID-19 deaths counts were obtained from the
vided by state and city Departments of Health reveal hetero- GitHub Repository (34). The all-age death counts were used
geneous disease spread in the US, with higher transmission for model fitting prior to when age-specific death counts were
risk per venue visit attributed to individuals aged 20-49 over reported for each location, and all-age case counts were used
distinct time periods, and younger epidemics with a greater for model fitting for the entire study period.
share of individuals aged 20-34 among cumulated infections COVID-19 case counts in school settings K1-K15 were re-
in the South, South-western, and Western regions of the US. trieved for Florida and Texas and matched with student

First release: 2 February 2021 www.sciencemag.org (Page numbers not final at time of first release) 5
enrolment numbers in each school from the Common Core of trends, which were characterised in terms of three phases de-
Data Americas Public Schools database (35). Cumulative at- fined by the dip date after which the 15-day moving average
tack rates were obtained by dividing cumulative reported fell below 10% compared to the average value in the two prior
cases among students by student numbers, and used for weeks, and the rebound date that corresponded to the date
model fitting. at which the 15-day moving average was lowest. Differences
 Human contact data before the pandemic were obtained in the mobility trends relative to the February baseline pe-
from the Polymod study (6), and used to predict baseline con- riod, before and after rebound dates, and relative to individ-
tact matrices during the early part of the pandemic for each uals aged 35-44 were assessed using Gamma regression
location, similar as in (18). Given the variation in contact pat- models using log link and location by age interaction covari-
terns seen across survey settings, baseline contact matrices ates.
for each study location in the US were predicted based on To characterize the time evolution of deaths across loca-
each location’s population density and age composition with tions and validate model fits, age-specific COVID-19 attribut-
a log linear regression model. Age-specific population counts able deaths among the same age strata across locations were
were obtained from (36). Area measurements were obtained predicted by month with Dirichlet-Multinomial regression
for every US states and for New York City respectively from models. Trends in the share of age groups among monthly

 Downloaded from http://science.sciencemag.org/ on February 5, 2021
(37) and (38). Contact matrices were predicted by 5-year age deaths were assessed by testing for differences in the propor-
bands for weekdays and weekends, and used in the model. tions in the first month relative to subsequent months.
Human contact data during the pandemic were retrieved To test for potential differences in age-specific transmis-
from two surveys (7, 8), and used in the model to specify con- sion dynamics based on the collected death data and without
tact patterns from and to individuals aged 0-19 during peri- epidemic models, meta-analysis estimates of age-specific in-
ods of school closure. fection fatality ratios (20) were used to predict the share of
 Age-specific human mobility trends were derived from the age groups among infections from monthly age-specific
Foursquare Labs Inc. US first-party panel that includes >10 mil- deaths. Trends in the share of age groups among monthly in-
lion of opt-in, always-on active users. From operated and part- fections were assessed by testing for differences in the pro-
ner apps, Foursquare collect a variety of device signals against portions in the first month relative to subsequent months.
opted-in users including intermittent device GPS coordinate
pings, WiFi signals, cell signal strength, device model, and oper- Contact-and-infection model
ating system version. A smaller set of labeled explicit check-ins To quantify age-specific aspects of COVID-19 spread in heter-
are captured from a portion of the user panel. Check-ins are ex- ogeneous populations, we formulated an age-specific, dis-
plicit confirmations that a user was at a given venue at a given crete-time renewal model in which disease transmission
point of time, and serve as training labels for a non-linear model occurs via contact intensities between population groups
that is used to predict visits among users with unlabeled visits stratified by 5-year age bands. The model has four key fea-
in terms of probabilities as to which venue users ultimately vis- tures described below. First, contact intensities vary in time
ited (11). Visit probabilities among panellists were processed and and are inferred from signatures in the age-specific mortality
aggregated by day, age, and study location, and standardised to and mobility data. This feature aims to reflect the substantial
daily per capita visits using latest US Census data. Percent changes in human contact patterns during the pandemic (7–
changes in daily venue visits by age and study location were ob- 9). Second, the challenge and value of the model to produce
tained relative to the baseline period February 3 to February 9, generalizable knowledge is to explain disease spread across
2020, and used for analysis and model fitting. For validation multiple locations with distinct demographics simultane-
purposes, a second mobility data set was obtained from Emodo. ously. To this end, the renewal equations were embedded into
The Emodo data set quantifies the proportion of individuals a hierarchical model in which information on disease spread
with at least one observed ping outside the user’s home location, is borrowed across locations (1, 39). Third, the model de-
out of a panel of individuals whose GPS enabled devices emitted scribes disease spread during the initial and later phase of
at least one ping on the corresponding day. Primary data were the pandemic, as mobility patterns become less correlated
similarly aggregated by day, age, and study location, standard- with transmission risk and schools reopen (40, 41). This fea-
ised to daily per capita visits using latest US Census data, and ture allowed us to test for changes in disease dynamics over
mobility trends were calculated relative to the baseline period time. Fourth, the model is fitted in a Bayesian framework to
February 19 to March 3, 2020. the all-age and age-specific death data, all-age case data, case
 data from schools, and age-specific human mobility trends
Statistical analysis of human mobility data and (42). This feature forced us to focus on a model whose param-
COVID-19 attributable death data eters are inferable from the data across all locations. The
The age-specific human mobility data showed marked time model is described in detail in the supplementary materials.

First release: 2 February 2021 www.sciencemag.org (Page numbers not final at time of first release) 6
Briefly, we consider populations stratified by the 5-year human mobility trends, so that previously observed decreases
age bands A, such that in correlation between mobility trends and transmission risk
a ∈ A = {[0-4], [5-9], …, [75-79], [80-84], [85+]} (1) could be captured (40, 41, 47). As the same number of venue
and denote the number of new infections, c, on day t, in age visits in e.g., Wyoming may translate to different transmis-
band a, and location m as cm ,t , a . In the renewal equation, past sion risk than in e.g., New York City, spatial random effects
infections are weighted by their relative infectiousness on day allowed for scaling of mobility trends during the dip and re-
t, and the sum of these individuals has contacts with individ- bound phase in each location. As venue visits do not capture
uals in other age groups. Contacts are described by the ex- all aspects of transmission risk, the model further incorpo-
pected number of disease relevant human contacts one rates independently for each location autocorrelated bi-
person in age a has with other individuals in age band a’ on weekly random effects to capture information on elevated,
disease relevant contact intensities and transmission risk
day t in location m, cm ,t , a , a′ . Upon contact, a proportion sm ,t , a′
that is present in the death time series data. To test for age-
of individuals of age a’ on day t in location m remains sus- specific signatures of elevated transmission risk, the model
ceptible to SARS-CoV-2 infection, and transmission occurs further included for each location age-specific random effects
with probability ρ ′ . Thus, the age-specific renewal equation for individuals aged 20-49.
Downloaded from http://science.sciencemag.org/ on February 5, 2021
with time-changing contact intensities is For children and teens aged 0-20, mobility data are not
t −1 available, and during periods of school closure the contact
cm ,t , a′ sm ,t , a′ρ a′ ∑Cm ,t , a , a′ ∑cm , s , a g ( t − s ) (2)
a s =1 intensities from and to children and teens were set to the av-
where g quantifies the relative infectiousness of individuals s erage contact intensities reported in (7). This implied that rel-
days after infection. An important feature of SARSCoV-2 ative to pre-pandemic contact patterns, peer-based contacts
transmission is that similarly to other coronaviruses but un- were substantially reduced, whereas contacts from an adult
like pandemic influenza (43), susceptibility to SARS-CoV-2 in- to children and teens increased slightly. In the model, schools
fection increases with age (7, 21, 44). Here, we used contact were set to re-open on or after August 24, 2020 when state
tracing data from Hunan province, China (7) to specify lower administrations no longer mandated state-wide school clo-
susceptibility to SARS-CoV-2 infection among children aged sures by that date (48, 49). Thereafter, Eq. 4 was extended to
0-9, and higher susceptibility among individuals aged 60+, include children and teens, and expected mobility reductions
when compared to the 10-59 age group as part of the trans- were estimated from the case and death data. In the absence
mission probabilities ρ a′ . Previously infected individuals are of further data, a common average effect could be estimated
across locations and children and teen age groups for the last
assumed to be immune to re-infection within the analysis pe-
riod, consistent with mounting evidence for sustained anti- two observation months, ηm ,t , a = ηchildren for a ∈ [0 − 20]. A
body responses to SARS-CoV-2 antigens (45, 46), so that further compound effect γ was added to modulate the num-
ber of disease relevant child/teenchild/teen contacts, which
∑
t −1
c
s =1 m , t , a ′
sm , t , a ′ = 1 − (3) we interpreted as reduced infectiousness from children and
N m, a′ teens and/or a positive impact of non-pharmaceutical inter-
where N m , a′ denotes the population count in age group a’ and ventions among school-aged children and teens.
location m.
Bayesian inference
For adults aged 20+, the time changing contact intensities
Past age-specific disease dynamics across all locations were
were described in terms of the pre-pandemic baseline contact
inferred from age-specific death data available across loca-
intensities in location m, which we denote by C m ,t , a , a′ , and
tions, and age-specific mobility data. To do this, in the model,
expected reductions in disease relevant contacts from con- a proportion π m , a of new infections in location m of age a die,
tacting individuals of age a on day t in location m, which we
and the day of death is determined by the infection-to-death
denote by ηm ,t , a , and contacted individuals of age a’ on day t
distribution, which was assumed to be constant across age
in location m, ηm ,t , a′ , groups. The proportions π m , a were associated with a strongly
C m ,t , a , a ′ = ηm ,t , a C m , a , a ′ ηm ,t , a ′ (4) informative prior derived from the meta-analysis of (20), but
where a, a’ ∈ {[20−24], ..., [85+]}. Expected reductions in were allowed to deviate from the baseline infection fatality
disease relevant contacts were specified as a random effects ratio through location-specific random effects. The expected
model that included the observed, age-specific mobility number of deaths in location m on day t in age band a, d m ,t , a
trends as covariates. In the model, each age-specific mobility , were aggregated to the reporting strata in each location, and
trend was decoupled into three separate covariates that re- fitted to the observed data using a Negative Binomial likeli-
flect the initial pre-pandemic, dip, and rebound phases in hood model. When age-specific death data were not available,
First release: 2 February 2021 www.sciencemag.org (Page numbers not final at time of first release) 7the model was fitted to all-age death data with a Negative t
Binomial likelihood model. All-age case data were smoothed, through Am ,t , d = ∑cm , s , d / ( N m , d ) , where N m , d is the number
s =1
and used to specify a lower bound on the overall number of
of individuals in location m and age band d, and are reported
infections cm ,t = ∑cm ,t , a through a student-t cumulative den-
a
in table S6.
sity likelihood model. Case data from schools were used to
calculate empirical attack rates in school settings during Validation and sensitivity analyses
specified observation windows. In turn, the empirical attack Reconstructed past transmission dynamics were assessed
rates were used to describe a lower bound on the actual at- against external data on the scale of the epidemic from sero-
tack rate among 5-18 year old children and teens in the same prevalence surveys conducted across the US by the CDC (24).
observation periods in the model, using a normal cumulative Validation results are reported in the supplementary materi-
density likelihood model. An upper bound on the actual at- als, suggesting larger discrepancies between model fit and se-
tack rates was also specified by assuming that actual cases in roprevalence data for Connecticut and New York City, with
school settings were under-reported at most 10-fold, using a larger epidemics reconstructed in the model than the data
normal complementary cumulative density likelihood model. suggest. The contact-and-infection model does not account
Downloaded from http://science.sciencemag.org/ on February 5, 2021
The contact-and-infection model was fit with CmdStan re- for sustained spatial importation of SARS-CoV-2 infections
lease 2.23.0 (22 April 2020), using an adaptive Hamiltonian such as from New York City to Connecticut, and may have
Monte Carlo (HMC) sampler (42). 8 HMC chains were run in over-estimated the magnitude of self-sustaining epidemic in
parallel for 1,000 iterations, of which the first 400 iterations locations receiving sustained SARS-Cov-2 importations. How-
were specified as warm-up. There were no divergent transi- ever, we also note that the Connecticut seroprevalence esti-
tions. mates predict an infection to observed case ratio that is
substantially below those of the other CDC seroprevalence
Generated quantities studies. The inferred contact patterns were assessed against
Results were reported in the age bands d ∈ D = external data from the BICS study that quantified human
{[0−9],[10−19],[20−34],[35−49],[50−64],[65−79],[80+]}.The contact patterns during the pandemic (9) Validation results
primary model outputs were aggregated correspondingly, e.g. are reported in the supplementary materials, suggesting sim-
the number of new infections in location m on day t in re- ilarly strong reductions in human contact intensities as in the
survey data. Disaggregated by age, the model reproduces
porting age band d was cm ,t , d = ∑cm ,t , a . The effective number
a∈d
highest contact intensities among 35-44 year old individuals,
of infectious individuals c∗ in location m and age band d on comparatively lower contact intensities from individuals
day t was calculated based on the renewal model (2), aged 45+, and largest reductions in contact intensities from
t −1 individuals aged 25-34. The survey data suggest that contact
=cm* ,t , d ∑c m, s ,d g ( t − s ) , and is shown in Fig. 2. Following (2), intensities from individuals aged 18-24 could be higher than
s =1 reconstructed through the contact-and-infection model, but
the time-varying reproduction number on day t from one in- we also note large confidence intervals around the survey es-
fectious person in a in location m is Rm ,t , a = ∑sm ,t , a′ ρ a′ C m ,t , a , a′ timates.
a′
Sensitivity analyses were conducted to assess central mod-
, and the reproduction numbers were aggregated to the re- elling assumptions on the infection fatality ratio, contact in-
porting strata based on the identity tensities among children and teens during periods of school
Rm ,t , d = ∑ ( cm* ,t , a ) / ∑cm* ,t , k Rm ,t , a , and are shown in Fig. 2 and closure, relative susceptibility of children and teens to SARS-
a∈d k∈d CoV-2 infection, and are reported in the supplementary ma-
tables S1 and S2. The transmission flows from age group a to terials. Our findings on the age groups that drive SARS-CoV-
age group a’ at time t in location m are given by 2 transmission were found to be robust to these assumptions.
t −1 REFERENCES AND NOTES
Fm ,t , a , a′ sm ,t , a′ ρ a′ C m ,t , a , a′ ∑cm , s , a g ( t − s ) , and are aggre- 1. S. Flaxman, S. Mishra, A. Gandy, H. J. T. Unwin, T. A. Mellan, H. Coupland, C.
s =1 Whittaker, H. Zhu, T. Berah, J. W. Eaton, M. Monod, A. C. Ghani, C. A. Donnelly, S.
gated using Fm ,t , d , d ′ = ∑ Fm ,t , a , a′ . In turn, the contributions Riley, M. A. C. Vollmer, N. M. Ferguson, L. C. Okell, S. Bhatt; Imperial College
a∈d , a ′∈d ′ COVID-19 Response Team, Estimating the effects of non-pharmaceutical
interventions on COVID-19 in Europe. Nature 584, 257–261 (2020).
of age groups to COVID-19 spread are doi:10.1038/s41586-020-2405-7 Medline
2. S. Pei, S. Kandula, J. Shaman, Differential effects of intervention timing on COVID-
S m ,t , d = ∑Fm ,t , d , d ′ / ∑∑Fm ,t , d , d ′ , and are reported in tables 19 spread in the United States. Sci. Adv. 6, eabd6370 (2020).
d′ d d′ doi:10.1126/sciadv.abd6370 Medline
S4. Cumulated COVID-19 attack rates were calculated 3. E. Dong, H. Du, L. Gardner, An interactive web-based dashboard to track COVID-19
First release: 2 February 2021 www.sciencemag.org (Page numbers not final at time of first release) 8in real time. Lancet Infect. Dis. 20, 533–534 (2020). doi:10.1016/S1473- Saad, A. Khamis, M. Reinap, S. Duda, K. Solo, S. Yaacoub, H. J. Schünemann; 3099(20)30120-1 Medline COVID-19 Systematic Urgent Review Group Effort (SURGE) study authors, 4. T. K. Boehmer, J. DeVies, E. Caruso, K. L. van Santen, S. Tang, C. L. Black, K. P. Physical distancing, face masks, and eye protection to prevent person-to-person Hartnett, A. Kite-Powell, S. Dietz, M. Lozier, A. V. Gundlapalli, Changing age transmission of SARS-CoV-2 and COVID-19: A systematic review and meta- distribution of the COVID-19 pandemic – United States, May–August 2020. analysis. Lancet 395, 1973–1987 (2020). doi:10.1016/S0140-6736(20)31142-9 Morbidity and Mortality Weekly Report 69, 1404–1409 (2020). Medline doi:10.15585/mmwr.mm6939e1 Medline 17. K. E. C. Ainslie, C. E. Walters, H. Fu, S. Bhatia, H. Wang, X. Xi, M. Baguelin, S. Bhatt, 5. E. Lavezzo, E. Franchin, C. Ciavarella, G. Cuomo-Dannenburg, L. Barzon, C. Del A. Boonyasiri, O. Boyd, L. Cattarino, C. Ciavarella, Z. Cucunuba, G. Cuomo- Vecchio, L. Rossi, R. Manganelli, A. Loregian, N. Navarin, D. Abate, M. Sciro, S. Dannenburg, A. Dighe, I. Dorigatti, S. L. van Elsland, R. FitzJohn, K. Gaythorpe, A. Merigliano, E. De Canale, M. C. Vanuzzo, V. Besutti, F. Saluzzo, F. Onelia, M. C. Ghani, W. Green, A. Hamlet, W. Hinsley, N. Imai, D. Jorgensen, E. Knock, D. Pacenti, S. G. Parisi, G. Carretta, D. Donato, L. Flor, S. Cocchio, G. Masi, A. Laydon, G. Nedjati-Gilani, L. C. Okell, I. Siveroni, H. A. Thompson, H. J. T. Unwin, R. Sperduti, L. Cattarino, R. Salvador, M. Nicoletti, F. Caldart, G. Castelli, E. Nieddu, Verity, M. Vollmer, P. G. T. Walker, Y. Wang, O. J. Watson, C. Whittaker, P. Winskill, B. Labella, L. Fava, M. Drigo, K. A. M. Gaythorpe, A. R. Brazzale, S. Toppo, M. C. A. Donnelly, N. M. Ferguson, S. Riley, Evidence of initial success for China exiting Trevisan, V. Baldo, C. A. Donnelly, N. M. Ferguson, I. Dorigatti, A. Crisanti; Imperial COVID-19 social distancing policy after achieving containment. Wellcome Open College COVID-19 Response Team; Imperial College COVID-19 Response Team, Res. 5, 81 (2020). doi:10.12688/wellcomeopenres.15843.2 Medline Suppression of a SARS-CoV-2 outbreak in the Italian municipality of Vo’. Nature 18. K. Prem et al., Projecting contact matrices in 177 geographical regions: an update 584, 425–429 (2020). doi:10.1038/s41586-020-2488-1 Medline and comparison with empirical data for the COVID-19 era. medrXiv 6. J. Mossong, N. Hens, M. Jit, P. Beutels, K. Auranen, R. Mikolajczyk, M. Massari, S. 2020.07.22.20159772 [Preprint]. 28 July 2020. Downloaded from http://science.sciencemag.org/ on February 5, 2021 Salmaso, G. S. Tomba, J. Wallinga, J. Heijne, M. Sadkowska-Todys, M. Rosinska, https://doi.org/10.1101/2020.07.22.20159772. W. J. Edmunds, Social contacts and mixing patterns relevant to the spread of 19. H. Unwin et al., Report 23 - State-level tracking of COVID-19 in the United States: A infectious diseases. PLOS Med. 5, e74 (2008). subnational analysis with future scenarios. Imperial College London COVID-19 doi:10.1371/journal.pmed.0050074 Medline Reports (2020); https://doi.org/10.25561/79231. 7. J. Zhang, M. Litvinova, Y. Liang, Y. Wang, W. Wang, S. Zhao, Q. Wu, S. Merler, C. 20. A. T. Levin, W. P. Hanage, N. Owusu-Boaitey, K. B. Cochran, S. P. Walsh, G. Viboud, A. Vespignani, M. Ajelli, H. Yu, Changes in contact patterns shape the Meyerowitz-Katz, Assessing the age specificity of infection fatality rates for dynamics of the COVID-19 outbreak in China. Science 368, 1481–1486 (2020). COVID-19: Systematic review, meta-analysis, and public policy implications. Eur. doi:10.1126/science.abb8001 Medline J. Epidemiol. 35, 1123–1138 (2020). doi:10.1007/s10654-020-00698-1 Medline 8. C. I. Jarvis, K. Van Zandvoort, A. Gimma, K. Prem, P. Klepac, G. J. Rubin, W. J. 21. N. G. Davies, P. Klepac, Y. Liu, K. Prem, M. Jit, R. M. Eggo; CMMID COVID-19 working Edmunds; CMMID COVID-19 working group, Quantifying the impact of physical group, Age-dependent effects in the transmission and control of COVID-19 distance measures on the transmission of COVID-19 in the UK. BMC Med. 18, 124 epidemics. Nat. Med. 26, 1205–1211 (2020). doi:10.1038/s41591-020-0962-9 (2020). doi:10.1186/s12916-020-01597-8 Medline Medline 9. Feehan, D. M., Mahmud, A., Quantifying population contact patterns in the United 22. L. M. Rossen, A. M. Branum, F. B. Ahmad, P. Sutton, R. N. Anderson, Excess Deaths States during the COVID-19 pandemic. medrXiv 2020.04.13.20064014 [Preprint]. Associated with COVID-19, by Age and Race and Ethnicity - United States, January 29 August 2020). https://doi.org/10.1101/2020.04.13.20064014. 26-October 3, 2020. Morbidity and Mortality Weekly Report 69, 1522–1527 10. S. Chang, E. Pierson, P. W. Koh, J. Gerardin, B. Redbird, D. Grusky, J. Leskovec, (2020). doi:10.15585/mmwr.mm6942e2 Medline Mobility network models of COVID-19 explain inequities and inform reopening. 23. European Center for Disease Prevention and Control, “Coronavirus disease 2019 Nature 589, 82–87 (2021). doi:10.1038/s41586-020-2923-3 Medline (COVID-19) in the EU/EEA and the UK eleventh update: resurgence of cases”; 11. A. Waksman, “Phones, Lambdas and the Joy of Snap-to-Place Technology” (2018); https://www.ecdc.europa.eu/en/publications-data/rapid-risk-assessment- https://enterprise.foursquare.com/intersections/article/phones-lambdas-and- coronavirus-disease-2019-covid-19-eueea-and-uk-eleventh. the-joy-of-snap-to-place-techn/. 24. F. P. Havers, C. Reed, T. Lim, J. M. Montgomery, J. D. Klena, A. J. Hall, A. M. Fry, D. 12. L. L. C. Google, “COVID-19 Community Mobility Reports” (2020); L. Cannon, C.-F. Chiang, A. Gibbons, I. Krapiunaya, M. Morales-Betoulle, K. https://www.google.com/covid19/mobility. Roguski, M. A. U. Rasheed, B. Freeman, S. Lester, L. Mills, D. S. Carroll, S. M. Owen, 13. YouGov PLC, “Personal measures taken to avoid COVID-19” (2020); J. A. Johnson, V. Semenova, C. Blackmore, D. Blog, S. J. Chai, A. Dunn, J. Hand, S. https://today.yougov.com/topics/international/articles- Jain, S. Lindquist, R. Lynfield, S. Pritchard, T. Sokol, L. Sosa, G. Turabelidze, S. M. reports/2020/03/17/personal-measures-taken-avoid-covid-19. Watkins, J. Wiesman, R. W. Williams, S. Yendell, J. Schiffer, N. J. Thornburg, 14. K. A. Fisher, M. W. Tenforde, L. R. Feldstein, C. J. Lindsell, N. I. Shapiro, D. C. Files, Seroprevalence of Antibodies to SARS-CoV-2 in 10 Sites in the United States, K. W. Gibbs, H. L. Erickson, M. E. Prekker, J. S. Steingrub, M. C. Exline, D. J. March 23-May 12, 2020. JAMA Intern. Med. 180, 1576–1586 (2020). Henning, J. G. Wilson, S. M. Brown, I. D. Peltan, T. W. Rice, D. N. Hager, A. A. Ginde, doi:10.1001/jamainternmed.2020.4130 Medline H. K. Talbot, J. D. Casey, C. G. Grijalva, B. Flannery, M. M. Patel, W. H. Self, K. W. 25. W. Messner, S. E. Payson, Variation in COVID-19 outbreaks at the US state and Hart, R. McClellan, H. Tan, A. Baughman, N. A. Hennesy, B. Grear, M. Wu, K. county levels. Public Health 187, 15–18 (2020). doi:10.1016/j.puhe.2020.07.035 Mlynarczyk, L. Marzano, Z. Plata, A. Caplan, S. M. Olson, C. E. Ogokeh, E. R. Smith, Medline S. S. Kim, E. P. Griggs, B. Richards, S. Robinson, K. Kim, A. M. Kassem, C. N. 26. I. Holmdahl, C. Buckee, Wrong but useful - what COVID-19 epidemiologic models Sciarratta, P. L. Marcet; IVY Network Investigators; CDC COVID-19 Response can and cannot tell us. N. Engl. J. Med. 383, 303–305 (2020). Team, Community and Close Contact Exposures Associated with COVID-19 doi:10.1056/NEJMp2016822 Medline Among Symptomatic Adults ≥18 Years in 11 Outpatient Health Care Facilities - 27. R. M. Viner, O. T. Mytton, C. Bonell, G. J. Melendez-Torres, J. Ward, L. Hudson, C. United States, July 2020. MMWR Morb. Mortal. Wkly. Rep. 69, 1258–1264 (2020). Waddington, J. Thomas, S. Russell, F. van der Klis, A. Koirala, S. Ladhani, J. doi:10.15585/mmwr.mm6936a5 Medline Panovska-Griffiths, N. G. Davies, R. Booy, R. M. Eggo, Susceptibility to SARS-CoV- 15. N. E. Williams, T. A. Thomas, M. Dunbar, N. Eagle, A. Dobra, Measures of Human 2 infection among children and adolescents compared with adults: A systematic Mobility Using Mobile Phone Records Enhanced with GIS Data. PLOS ONE 10, review and meta-analysis. JAMA Pediatr. (2020). e0133630 (2015). doi:10.1371/journal.pone.0133630 Medline doi:10.1001/jamapediatrics.2020.4573 Medline 16. D. K. Chu, E. A. Akl, S. Duda, K. Solo, S. Yaacoub, H. J. Schünemann, D. K. Chu, E. 28. Q.-L. Jing, M. J. Liu, Z. B. Zhang, L. Q. Fang, J. Yuan, A. R. Zhang, N. E. Dean, L. Luo, A. Akl, A. El-harakeh, A. Bognanni, T. Lotfi, M. Loeb, A. Hajizadeh, A. Bak, A. M. M. Ma, I. Longini, E. Kenah, Y. Lu, Y. Ma, N. Jalali, Z. C. Yang, Y. Yang, Household Izcovich, C. A. Cuello-Garcia, C. Chen, D. J. Harris, E. Borowiack, F. Chamseddine, secondary attack rate of COVID-19 and associated determinants in Guangzhou, F. Schünemann, G. P. Morgano, G. E. U. Muti Schünemann, G. Chen, H. Zhao, I. China: A retrospective cohort study. Lancet Infect. Dis. 20, 1141–1150 (2020). Neumann, J. Chan, J. Khabsa, L. Hneiny, L. Harrison, M. Smith, N. Rizk, P. Giorgi doi:10.1016/S1473-3099(20)30471-0 Medline Rossi, P. AbiHanna, R. El-khoury, R. Stalteri, T. Baldeh, T. Piggott, Y. Zhang, Z. 29. European Center of Disease Prevention and Control, “COVID-19 in children and the First release: 2 February 2021 www.sciencemag.org (Page numbers not final at time of first release) 9
role of school settings in COVID-19 transmission - first update” (2020); 51. Foursquare Inc, “Pilgrim SDK” (2020);
 https://www.ecdc.europa.eu/en/publications-data/children-and-school- https://enterprise.foursquare.com/products/pilgrim.
 settings-covid-19-transmission. 52. Alabama Public Health, “Demographics on Deaths” (2020);
30. G. Vogel, “School risk calculations scrambled by fast-spreading virus strains” https://alpublichealth.maps.arcgis.com/home/index.html.
 (2020); https://www.sciencemag.org/news/2021/01/new-coronavirus-variant- 53. Alaska Department of Health and Social Services Coronavirus Response,
 scrambles-school-risk-calculations. “Demographic Distribution of Confirmed Cases” (2020); .https://coronavirus-
31. E. Volz et al., Transmission of SARS-CoV-2 Lineage B.1.1.7 in England: Insights from response-alaska-dhss.hub.arcgis.com/datasets/summary-tables
 linking epidemiological and genetic data. medRxiv 2020.12.30.20249034 54. Arizona Department of Health Services, “COVID-19 Deaths” (2020);
 [Preprint]. 4 January 2021. https://doi.org/10.1101/2020.12.30.20249034 https://www.azdhs.gov/preparedness/ epidemiology-disease-
32. Imperial College London COVID-19 Response Team, “COVID-19 Age specific control/infectious-disease-epidemiology/covid-19/dashboards/index.php.
 Mortality Data Repository” (2020); 55. California Department of Public Health, “Statewide Case Statistics” (2020);
 https://github.com/ImperialCollegeLondon/US-covid19-agespecific-mortality- https://public.tableau.com/views/COVID-
 data. 19CasesDashboard_15931020425010/Cases?:embed=y&:showVizHome=no.
33. M. Smith et al., “Coronavirus (COVID-19) Data in the United States” (2020); 56. Colorado Department of Public Health & Environment, “DPHE COVID19 State-
 https://github.com/nytimes/covid-19-data. Level Open Data Repository” (2020); https://covid19.colorado.gov/data.
34. New York City Department of Health, “Coronavirus data” (2020); 57. Connecticut Open Data, “COVID-19 Cases and Deaths by Age Group” (2020);
 https://github.com/nychealth/coronavirus-data/blob/master/totals/by- https://data.ct.gov/Health-and-Human-Services/COVID-19-Cases-and-Deaths-
 age.csv. by-Age-Group/ypz6-8qyf.

 Downloaded from http://science.sciencemag.org/ on February 5, 2021
35. National Centre for Education Statistics, “Common Core of Data America’s School 58. Delaware Environmental Public Health Tracking Network, “Demographic
 database” (2020); https://nces.ed.gov/ccd/. Breakdown of Deaths” (2020);
36. United States Census Bureau, “Age and Sex American Community Survey by U.S https://myhealthycommunity.dhss.delaware.gov/locations/state.
 States, 2018 Census” (2018); https://www.census.gov/data.html. 59. Government of the District of Columbia, “Coronavirus Data” (2020);
37. United States Census Bureau, “State Area Measurements and Internal Point https://coronavirus.dc.gov/page/coronavirus-data.
 Coordinates” (2010); https://www.census.gov/geographies/reference- 60. Florida Division of Emergency Management, “Coronavirus: characteristics of
 files/2010/geo/state-area.html. Florida resident cases” (2020); https://www.floridadisaster.org/covid19/covid-
38. Wikipedia, “New York City”(2019); 19-data-reports/.
 https://en.wikipedia.org/wiki/New_York_City. 61. Georgia Department of Public Health, “Deaths in Georgia” (2020);
39. A. Gelman et al., Bayesian Data Analysis (CRC Press, 2013). https://dph.georgia.gov/covid-19-daily-status-report.
40. IHME COVID-19 Forecasting Team, Modeling COVID-19 scenarios for the United 62. State of Hawaii Department of Health, “What are the Ages, Gender, and Outcomes
 States. Nat. Med. 27, 94–105 (2021). Medline of COVID-19 Cases?” (2020);
41. P. Nouvellet et al., Report 26 - Reduction in mobility and COVID-19 transmission. https://health.hawaii.gov/coronavirusdisease2019/what-you-should-
 Imperial College London COVID-19 Reports (2020); know/current-situation-in-hawaii/.
 https://doi.org/10.25561/79643. 63. Idaho Division of Public Health, “COVID-19 Demographics” (2020);
42. B. Carpenter, A. Gelman, M. D. Hoffman, D. Lee, B. Goodrich, M. Betancourt, M. https://coronavirus.idaho.gov/.
 Brubaker, J. Guo, P. Li, A. Riddell, Stan: A Probabilistic Programming Language. J. 64. Illinois Department of Public Health, “Age Demographics” (2020);
 Stat. Softw. 76, 1–32 (2017). doi:10.18637/jss.v076.i01 https://www.dph.illinois.gov/covid19/covid19-statistics.
43. R. M. Anderson, C. Fraser, A. C. Ghani, C. A. Donnelly, S. Riley, N. M. Ferguson, G. 65. Indiana State Department of Health, “Statewide Demographics for Deaths”
 M. Leung, T. H. Lam, A. J. Hedley, Epidemiology, transmission dynamics and (2020); https://www.coronavirus.in.gov/.
 control of SARS: The 2002-2003 epidemic. Philos. Trans. R. Soc. Lond. B Biol. Sci. 66. Iowa Department of Public Health, “Deaths by Age Group” (2020);
 359, 1091–1105 (2004). doi:10.1098/rstb.2004.1490 Medline https://coronavirus.iowa.gov/pages/outcome-analysis-deaths.
44. E. Goldstein, M. Lipsitch, M. Cevik, On the effect of age on the transmission of 67. Kansas Department of Health and Environment, “Death summary” (2020);
 SARS-CoV-2 in households, schools and the community. J. Infect. Dis. jiaa691 https://www.coronavirus.kdheks.gov/160/COVID-19-in-Kansas.
 (2020). 10.1093/infdis/jiaa691 Medline 68. Kentucky Department for Public Health, “Deaths by Age Group” (2020);
45. A. S. Iyer et al., Dynamics and significance of the antibody response to SARS-CoV- https://govstatus.egov.com/kycovid19.
 2 infection. medRxiv 10.1101/2020.07.18.20155374 [Preprint]. 20 July 2020. 69. Louisiana Department of Health, “Cases and Deaths by Age” (2020);
 https://doi.org/10.1101/2020.07.18.20155374. https://ldh.la.gov/Coronavirus/ (2020).
46. I. Schulien, J. Kemming, V. Oberhardt, K. Wild, L. M. Seidel, S. Killmer, F. Sagar, M. 70. Maine Center for Disease Control & Prevention, “Maine COVID-19 summary”,
 Daul, A. Salvat Lago, H. Decker, B. Luxenburger, D. Binder, O. Bettinger, S. Avail-able at https://www.maine.gov/dhhs/mecdc/infectious-
 Sogukpinar, M. Rieg, D. Panning, M. Huzly, G. Schwemmle, C. F. Kochs, A. Waller, disease/epi/airborne/coronavirus/data.shtml, (2020).
 D. Nieters, F. Duerschmied, H. E. Emmerich, A. R. Mei, S. Schulz, D. A. Llewellyn- 71. Maryland Department of Health, “Cases and Deaths Data Breakdown by Age Range
 Lacey, T. Price, B. Boettler, R. Bengsch, M. Thimme, C. Hofmann, Neumann- and Gender” (2020); https://coronavirus.maryland.gov/.
 Haefelin, Characterization of pre-existing and induced SARS-CoV-2-specific CD8+ 72. Massachusetts Department of Public Health, “Deaths and Death Rate by Age
 T cells. Nat. Med. 27, 78–85 (2021). doi:10.1038/s41591-020-01143-2 Medline Group” (2020); https://www.mass.gov/info-details/archive-of-covid-19-cases-
47. A. C. Miller et al., Mobility trends provide a leading indicator of changes in SARS- in-massachusetts (2020).
 CoV-2 transmission. medRxiv 10.1101/2020.05.07.20094441 [Preprint]. 11 May 73. Michigan Department of Health and Human Services, “Deaths by Demographic
 2020. https://doi.org/10.1101/2020.05.07.20094441. Char-acteristics” (2020); https://www.michigan.gov/coronavirus/0,9753,7-
48. T. Hale et al., Variation in US states responses to COVID-19. Blavatnik School of 406-98163_9817300.html.
 Government (2020); www.bsg.ox.ac.uk/covidtracker. 74. Michigan Department of Health and Human Services, “Data requested to the
49. Education Week, “Map: Coronavirus and School Closures” (2020); Department of Health and Human Services” (2020);
 https://www.edweek.org/ew/section/multimedia/map-coronavirus-and- https://github.com/ImperialCollegeLondon/US-covid19-agespecific-mortality-
 school-closures.html. data/blob/master/data/req/michigan%20weekly.csv.
50. M. Monod, A. Blenkinsop, X. Xi, H. J. Unwin, M. Swapnil, O. Ratmann, 75. Minnesota Department of Health, “Age group data table” (2020); https: / /www.
 ImperialCollegeLondon/covid19model: Age groups that sustain resurging COVID- health.state.mn.us/diseases/coronavirus/stats/index.html.
 19 epidemics in the United States, Version 11.0, Zenodo (2021); 76. Mississippi State Department of Health, “COVID-19 Cases and Deaths by Age
 https://doi.org/10.5281/ZENODO.4461896. Group” (2020); https://msdh.ms.gov/msdhsite/_static/14,0,420.html.

First release: 2 February 2021 www.sciencemag.org (Page numbers not final at time of first release) 10
You can also read