A Systematic Review on the Application of Machine Learning in Exploiting Mineralogical Data in Mining and Mineral Industry
←
→
Page content transcription
If your browser does not render page correctly, please read the page content below
minerals
Review
A Systematic Review on the Application of Machine
Learning in Exploiting Mineralogical Data in Mining
and Mineral Industry
Mohammad Jooshaki 1, * , Alona Nad 2 and Simon Michaux 1

                                          1   Circular Economy Solutions, Geological Survey of Finland (GTK), 02151 Espoo, Finland;
                                              simon.michaux@gtk.fi
                                          2   Circular Economy Solutions, Geological Survey of Finland (GTK), 83500 Outokumpu, Finland;
                                              alona.nad@gtk.fi
                                          *   Correspondence: mohammad.jooshaki@gtk.fi

                                          Abstract: Machine learning is a subcategory of artificial intelligence, which aims to make computers
                                          capable of solving complex problems without being explicitly programmed. Availability of large
                                          datasets, development of effective algorithms, and access to the powerful computers have resulted
                                          in the unprecedented success of machine learning in recent years. This powerful tool has been
                                          employed in a plethora of science and engineering domains including mining and minerals industry.
                                          Considering the ever-increasing global demand for raw materials, complexities of the geological
                                          structure of ore deposits, and decreasing ore grade, high-quality and extensive mineralogical in-
                                          formation is required. Comprehensive analyses of such invaluable information call for advanced
                                and powerful techniques including machine learning. This paper presents a systematic review of

                                          the efforts that have been dedicated to the development of machine learning-based solutions for
Citation: Jooshaki, M.; Nad, A.;
                                          better utilizing mineralogical data in mining and mineral studies. To that end, we investigate the
Michaux, S. A Systematic Review on
                                          main reasons behind the superiority of machine learning in the relevant literature, machine learning
the Application of Machine Learning
                                          algorithms that have been deployed, input data, concerned outputs, as well as the general trends in
in Exploiting Mineralogical Data in
Mining and Mineral Industry.
                                          the subject area.
Minerals 2021, 11, 816. https://
doi.org/10.3390/min11080816               Keywords: machine learning; artificial intelligence; mineralogy; mining; mineralogical analysis

Academic Editors: Herbert Pöllmann,
Uwe König and Yosoon Choi
                                          1. Introduction
Received: 2 June 2021                          Artificial intelligence (AI) and machine learning (ML) have been used in a wide range
Accepted: 25 July 2021                    of applications in the development of technology. AI is a branch of science and engineering
Published: 28 July 2021
                                          focusing on the development of techniques to make computers capable of solving certain
                                          problems through simulating or extending human intelligence [1,2]. As a subset of AI, ML
Publisher’s Note: MDPI stays neutral
                                          includes computational approaches aiming at extracting expertise out of experience [3,4].
with regard to jurisdictional claims in
                                          In other words, the goal of ML is to use past data or known information to extract (learn)
published maps and institutional affil-
                                          meaningful patters and associations which can be generalized to make relatively accurate
iations.
                                          predictions [3,4].
                                               In the realm of ML, the process of leaning the past information is called training.
                                          Learning through training experiences to acquire new or improve previous capabilities
                                          distinguishes ML methods from traditional explicit programming of computers for per-
Copyright: © 2021 by the authors.         forming a specific task [4–6]. Conventional programming relies on explicit modeling of a
Licensee MDPI, Basel, Switzerland.
                                          problem using the physical rules governing a specific system under study. In ML, however,
This article is an open access article
                                          the aim is to analyze the data to predict the behavior of complex systems that cannot be
distributed under the terms and
                                          explicitly modeled using conventional approaches. The learning process can be either
conditions of the Creative Commons
                                          supervised or unsupervised. While in the former, the training data is labeled and the
Attribution (CC BY) license (https://
                                          correct output is known for every instance of the past information, the latter entails the
creativecommons.org/licenses/by/
                                          recognition of hidden patterns in the data without knowing specific outcomes a priori [5,7].
4.0/).

Minerals 2021, 11, 816. https://doi.org/10.3390/min11080816                                               https://www.mdpi.com/journal/minerals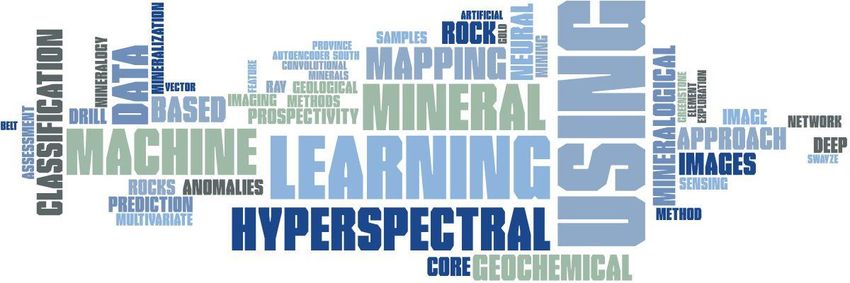
Minerals 2021, 11, 816                                                                                         2 of 20

                         With the capability of learning from the past data or experience and generalizing that to
                         the unseen data, ML techniques are able to solve complex problems, which cannot be
                         effectively and efficiently addressed by the traditional methods. Such problems typically
                         involve intricate associations among several variables influencing the system under study,
                         fluctuating environments, and large amount of data which needs to be processed [8].
                               AI and ML researchers have devised a plethora of effective tools to solve the most
                         difficult problems in computer science and engineering including speech recognition,
                         machine vision, control of autonomous vehicles, robot control, natural language processing,
                         medical diagnosis, climate and power demand forecasting, playing games, filtering spam
                         emails, designing performance-based regulations based on unsupervised ML methods,
                         and optimizing engineering problems using soft computing intelligence, to name but a
                         handful [5,6,9–16]. Such tools have been leveraged in various industries so as to enhance
                         the performance and efficiency. These next generation information tools, that have become
                         more refined over the recent years, have been also applied to the mining industry—a
                         capital-intensive business, thus, conservative and reluctant to radical changes—to improve
                         safety, increase productivity, and reduce costs [17,18].
                               With the continuously increasing demand for raw materials, deeper mining, facing
                         the complexity of the geological structure of ore deposits, and decreasing ore grade, high-
                         quality and extensive mineralogical information is required [19–22]. The mineralogical
                         analysis is providing critical information for calculating the duration of extraction period
                         of a mine. Intimate knowledge of the mineralogical assembly of ores is key to understand-
                         ing and solving problems encountered during exploration and mining, and during the
                         processing of ores, concentrates, and related materials [23].
                               Additionally, mineral process engineering is now evolving. In the past, the practical
                         challenges of managing and optimizing a process plant were very complex and were not
                         effective enough to justify further development of data-based optimization. Most designs
                         were based around empirical characterization tests, and plant operation relied heavily on
                         operator intuition. Given the standard process operating systems, it was a challenge for
                         the plant operators to manage the large amount of process information in a fashion where
                         all of it was used effectively. There also is now technology available that has the capacity
                         to revolutionize how mineral processing plants are designed and how they are operated.
                         Instrumentation used to collect data and information has become much more sophisticated,
                         and capable. This data can be also collected from many more positions throughout the
                         process plant, and it can be collected at a much higher degree of resolution.
                               ML, a revolutionary new method of handling vast amounts of data, has been de-
                         veloped in the past few years to the point where it can be applied to mineral processing
                         applications. The combination of more sophisticated instrumentation in conjunction with
                         ML has the potential to revolutionize mineral processing standard operating practice. In
                         the past, many mineral processing plants struggled with high variability in throughput,
                         power draw and recovery, where most operations are designed to operate at a steady state
                         of throughput, recovery, and metal production. Poor recovery was often observed as it
                         happened, with limited understanding in why it was happening.
                               ML, if coupled with quality and timely measurement of the appropriate parameters,
                         has the potential to diagnose the true metrics of good recovery. Time stamped measure-
                         ments at multiple strategically decisive points in the plant could quantify, for example,
                         how recovery relates to ball mill performance (under grinding or over grinding) or how
                         cyclone performance could interact with final metal reconciliation. The true link between
                         mineral content, mineral texture, and process performance could be quantified.
                               Using ML, the cause of plant variability could be isolated in real time. Depending on
                         circumstance, this could happen soon enough to make an engineering decision, followed
                         by operational optimization. An example of this could be using a Raman spectrometer
                         instrument to estimate mineral content of the semi-autogenous grinding (SAG) mill feed,
                         the results of which could be used to optimize reagent application at the flotation cells.
                         ML could be used to focus on the best outcome. For instance, in a comminution circuit,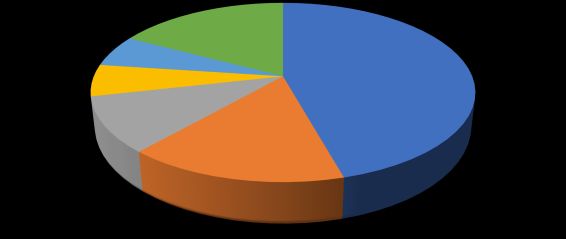
Minerals 2021, 11, 816                                                                                          3 of 20

                         which is the most energy and cost consuming step in mineral processing, it is proposed
                         to use SAG Mill real-time operational variables such as feed tonnage, bearing pressure,
                         and spindle speed in order to predict the upcoming energy consumption via ML and
                         deep learning techniques [24]. It should be highlighted that the authors of [25] achieved
                         impressive accuracy of 97% with the emulation of the industrial grinding circuit by the
                         designed recurrent neural networks for the SAG mill in lead-zinc ore beneficiation process.
                               The potential here is that the true relationship between process units during operation
                         could be quantified with the application of ML. The whole process flow sheet could be
                         optimized in operation. Additionally, any given example of poor performance could be
                         diagnosed, and the original cause could be isolated to individual process units. If this
                         potential is realized, the next generation of mineral process practice could be developed.
                               ML algorithms such as artificial neural network (ANN), support vector machine (SVM),
                         regression tree (RT), and random forest (RF) are powerful data driven methods that are
                         becoming extremely popular in such applications as the mapping of mineral prospectiv-
                         ity [26–28], mapping geochemical anomalies [29–31], geological mapping [32–35], drill-core
                         mapping [36–38], and mineral phase segmentation for X-ray microcomputed tomography
                         data [39–41].
                               Inspired by these remarks, this paper aims to systematically survey the relevant
                         literature for the sake of investigating what has been carried out in the realm of enhanced
                         exploitation of mineralogical analysis data in mining and minerals industry. In a systematic
                         review, the body of knowledge on a specific subject is investigated to answer a set of
                         predetermined questions in such a way that the data and methods used are definite.
                         Given the sufficient details provided in a systematic literature review, the users can more
                         conveniently determine its trustworthiness and the usefulness of the statistics, discussions,
                         and findings it provides [42].
                               To be more specific, areas examined in this paper include mainly the problems in the
                         field of utilizing mineralogical analysis data for mining and minerals industry that have
                         been solved using ML techniques. The reason behind using ML in such studies, ML tools
                         that have been developed and applied, data inputs, required outputs, as well as the main
                         trends in this subject area are also assessed in this paper.
                               The remainder of this paper is organized as follows. In Section 2, the main research
                         questions that we aim to answer in this review as well as the search method, information
                         source, and the selection criteria are explained. Section 3 provides answers to the research
                         questions, and lastly, Section 4 concludes the paper.

                         2. Main Research Questions and Review Methods
                               As pointed out before, in a systematic review, the main objective is to investigate
                         the body of knowledge to address a set of research questions [42,43]. This must be done
                         using concrete methods and procedures for the sake of transparency and ease of evaluating
                         the objectivity and trustworthiness of the figures and outcomes reported for the potential
                         readers [42].
                               Considering the groundbreaking advances and flourishing developments in the area
                         of ML, it has been leveraged in various fields to unprecedentedly solve complex problems
                         that could not be tackled via conventional methods effectively. Given the crucial role of
                         mineralogical monitoring at every stage of minerals industry value-chain, from geoscience
                         research and exploration phases to the final processing, and the complexities associated
                         with exploiting valuable information out of mineralogical data, we aim to investigate the
                         steps taken towards adopting ML in this area. In other words, this review focuses on the
                         applications of ML for enhancing and facilitating the mineralogical monitoring and the
                         utilization of mineralogical data in mining and minerals industry. To that end, the main
                         questions that this review aims to answer comprise:
                         (1)   What problems in the area of mineralogical studies for mining industry have been
                               addressed using ML techniques in the existing literature?
                         (2)   Why the use of ML in such applications is required?
Minerals 2021, 11, 816 4 of 20
Minerals 2021, 11, x 4 of 20
(3)
(3) What
Whatare
arethetheoutputs
outputspredicted
predictedor ormodeled
modeledusingusingMLMLininthose
thoseproblems?
problems?What Whatinput
input
parameters have been
parameters have been used? used?
(4)
(4) What
WhatML MLmethods
methodshave havebeenbeenemployed?
employed?
(5)
(5) What are the general trendsin
What are the general trends inthe
thearea
areaunder
understudy?
study?
Thepurpose
The purposeofofthe thefirst
firsttwo
twoquestions
questionsisistotoinvestigate
investigatethe thesort
sortofofproblems
problemsininthe
the
area
areaunder
understudy
studyfor forwhich
whichthe theuseuseofofML
MLtechniques
techniquesisisadvantageous
advantageousand andtheir
theirspecific
specific
complexities
complexitiesthatthatfavor
favorML MLover
overtraditional
traditionalapproaches.
approaches.Considering
Consideringthat thatML
MLtechniques
techniques
are
aretypically
typicallyused
usedtotofind
finduseful
usefulassociations
associationsininthethedata
datatotopredict
predictspecific
specificoutputs
outputsininthe
the
case
caseofofsupervised
supervisedlearning
learning ororto to
determine
determinesignificant patterns
significant patterns among
amonginput features
input in anin
features
unsupervised
an unsupervised setting, the third
setting, question
the third intends
question to explore
intends the input
to explore and output
the input variables
and output vari-
employed in thein
ables employed existing literature.
the existing ThisThis
literature. cancanbe be
particularly
particularly useful
usefulfor
forunderstanding
understanding
potential
potentialdata
datathatthatneeds
needstotobe becollected
collectedforforestimating
estimatingaaspecific
specificset
setofofdesired
desiredoutput
output
variables.
variables. Complementary to the previous question, the fourth question focuseson
Complementary to the previous question, the fourth question focuses onthe
the
methods
methods used to model the relationships between input and output variables. Lastly,the
used to model the relationships between input and output variables. Lastly, the
final
finalquestion
questionwill
willaddress
addressthe thegeneral
generaltrends
trendsininthe
theapplication
applicationofofML MLininmineralogical
mineralogical
monitoring
monitoringininmining
miningand andminerals
mineralsindustry.
industry.
2.1. Information Source and Search Strategy
2.1. Information Source and Search Strategy
We utilized Scopus [44] as the search engine for finding the relevant publications.
We utilized Scopus [44] as the search engine for finding the relevant publications.
Based on our review objectives, we considered three main tiers of keywords, namely
Based on our review objectives, we considered three main tiers of keywords, namely tar-
target modeling approach, analysis, and industry, each including few relevant keywords as
get modeling approach, analysis, and industry, each including few relevant keywords as
depicted in Figure 1. As illustrated, using the logical operators available in Scopus search
depicted in Figure 1. As illustrated, using the logical operators available in Scopus search
tool, we set a query so as to search through the records and reach the publications that
tool, we set a query so as to search through the records and reach the publications that
include at least one of the keywords in each tier in their title, abstract, or list of keywords.
include at least one of the keywords in each tier in their title, abstract, or list of keywords.
In order to have an estimate of the early works published in the subject area, we did not
In order to have an estimate of the early works published in the subject area, we did not
filter any record based on the publication date in our search query. Nonetheless, as we will
filter any record based on the publication date in our search query. Nonetheless, as we
discuss in the next section, the works published before 2000 were disregarded during the
will discuss
selection in the next
procedure. It issection, the works published
worth mentioning that we setbefore 2000 were
no limitations ondisregarded during
the search source,
the selection procedure. It is worth mentioning that we set no limitations on
thereby the search query was applied to all the records covered by Scopus—the largest the search
source, thereby
database the searchliterature
of peer-reviewed query was applied to all the records covered by Scopus—the
[44].
largest database of peer-reviewed literature [44].
Tier 1: Target Tier 2: Target Analysis Tier 3: Target Industry
Modeling Approach
Mineralogical
Artificial
Intelligence OR Mining
OR AND Mineralogy AND OR
Machine OR Minerals
Learning
XRD
Figure1.1.Search
Figure Searchkeywords
keywordsand
andsearch
searchquery
querylogic.
logic.
2.2.
2.2.Eligibility
EligibilityCriteria
Criteria
Based
Based upon the
upon the search method
method explained
explainedininthe theprevious
previoussection,
section,wewe reached
reached 145
145 candidate
candidate scientific
scientific publications.
publications. As depicted
As depicted in Figure
in Figure 2, in
2, in the thestep,
first firstwe
step, we dis-9
discarded
carded 9 manuscripts
manuscripts including including non-English
non-English papers
papers and and
those those published
published before thebefore
yearthe yearIn
2000.
2000. In the
the next nextthe
stage, stage,
reviewthe articles
review andarticles and conference
conference reviews reviews were disregarded,
were disregarded, a total ofa8
total of 8 records.
records. The remaining
The remaining 128 records
128 records were allwere all sequentially
sequentially evaluated evaluated
by eachby ofeach of the
the authors
authors to select the publications relevant to this review. The evaluation entailed
to select the publications relevant to this review. The evaluation entailed reading the title, reading
the title, abstract,
abstract, and list ofand list of keywords
keywords of theand
of the records records and skimming
skimming through the through
papersthe papers
if required.
ifLastly,
required. Lastly, 55 papers were selected to be included in the review
55 papers were selected to be included in the review and answer the questions. and answer theIt
questions. It is worth mentioning that the publications excluded in the
is worth mentioning that the publications excluded in the last stage comprise different last stage comprise
different
topics nottopics not directly
directly relevantrelevant to the and
to the mining mining and minerals
minerals industry. industry.Minerals
Minerals 11,11,
2021,
2021, x11,816 5 of
5 of 20
Minerals 2021, x 520of 20
Number of records
Number in the
of records in the
search outcome:
search 145 145
outcome:
Number of records
Number in in
of records Records Excluded:
Records Excluded:
English published
English afterafter
published 2000:2000: Non-English: 3 3
Non-English:
136 136 Published before
Published 2000:2000:
before 6 6
Records Excluded:
Records Excluded:
Number
Numberof records included
of records included Review Article: 4 4
as scientific papers: 128 128 Review Article:
as scientific papers: Conference Review:
Conference 4 4
Review:
Number of records
Number included
of records included Records Excluded:
Records Excluded:
based on the
based on review subject:
the review subject: 73 73
55 55
Figure 2. Process
Figure of screening the the
search results.
Figure 2.2.Process
Processofofscreening
screening search
the search results.
results.
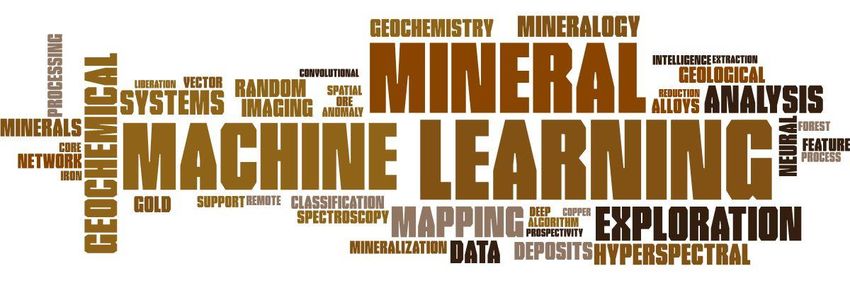
Figure
Figure3 shows
Figure 33shows
shows thethe
share
the of of
share
share the topics
ofthe
the excluded
topics
topics excluded
excluded at at
the
atthelast
the stage
last
last of of
stage
stage the selection
ofthe
the pro-
selection
selection pro-
pro-
cedure.
cedure. AsAs
cedure. perper
As this
per figure,
this
this thethe
figure,
figure, majority
the majority
majority of of
the
ofthepapers
the excluded
papers
papers excluded
excluded arearerelated
are toto
related
related petroleum
topetroleum
petroleum
and
and gas
and industry,
gas
gasindustry,
industry,soil, and
soil, and
soil, space
andspace exploration.
space exploration.
exploration. About
Abouta quarter
About aaquarter
quarter ofof
the
oftherecords
therecords excluded
records excludedis isis
excluded
onon environmental
on environmental
environmental studies,
studies, works
studies,works ininwhich
works inwhich ML
which ML techniques
ML techniques
techniques are not
areare
not employed,
notemployed,
employed, and
and miscel-
miscella-
and miscel-
laneous
neous
laneoustopics
topics such
such
topics as
suchas metallurgy,
metallurgy,
as metallurgy,recycling
recyclingin cement
in cementindustry,
industry, archaeometry,
archaeometry,
archaeometry, geophys-
geophysics,
geophys-
ics,medicine,
medicine, and
ics, medicine, sedimentology.
and sedimentology.
and sedimentology.
OtherOther
Topics
Topics
17% 17%
Not Using ML 6%
Not Using ML 6%
Petroleum and and
Petroleum
Environment 6% 6%
Environment Gas 46%
Gas 46%
SpaceSpace
Exploration
Exploration
10% 10%
Soil 15%
Soil 15%
Figure
Figure 3. Share
3. Share of of
thethe topics
topics excluded
excluded from
from thethe review
review in in
thethe last
last stage
stage of of
thethe selection
selection process.
process.
Figure 3. Share of the topics excluded from the review in the last stage of the selection process.
Title of the journals with more than one record in the list of selected records are
Title of the
Title journals
of the with
journals more
with than
more oneone
than record in the
record listlist
in the of selected records
of selected areare
records pro-
pro-
provided in Table 1.
vided in Table
vided 1. 1.
in Table
Table 1. Title of journals with more than one entry in the final list.
Table 1. Title
Table of journals
1. Title with
of journals more
with than
more oneone
than entry in the
entry final
in the list.list.
final
Journal Title Title
Journal Number of Selected
Number Records
of Selected Records
Journal Title Number of Selected Records
Minerals Engineering
Minerals Engineering
Minerals Engineering 6 6 6
Journal of Geochemical Exploration 6
Journal of Geochemical
Journal and
of GeochemicalExploration 6 6
Computers Geosciences Exploration 4
Computers
Computers
Applied andand
Geosciences
Geochemistry Geosciences 4 4 4
OreApplied Geochemistry
Applied Geochemistry
Geology Reviews 3 4 4
Lecture Notes inGeology
OreOre Computer
Geology Science
Reviews
Reviews 3 3 3
Remote Sensing
Lecture Notes in Computer Science 2 3 3
Lecture Notes in Computer Science
Remote Sensing
Remote Sensing 2 2
3. Results
3. Results
3. Results
In this part, the main research questions stated in Section 2 are addressed based upon
theInassessment
this part,
In this the
part, main
of the
the research
main research
selected questions
works. stated
questions in Section
stated 2 are
in Section addressed
2 are based
addressed upon
based upon
thetheassessment
assessment of the selected
of the works.
selected works.
3.1. Problems in the Selected Studies Addressed Using ML Techniques
3.1.3.1.
Problems
Problems
During in the
the Selected
in the Studies
lastSelected
decade, Addressed
Studies
the Using
Addressed
number MLML
ofUsing Techniques
available Techniques
multi-parameter datasets in the
During
mining the
industrylast decade,
increased the number
rapidly as aof available
result of multi-parameter
applying advanced datasets
During the last decade, the number of available multi-parameter in the
technologies
datasets intomin-
assist
the min-
ingining
theindustry
exploration
industry increased process.
rapidly Toasintegrate
a result and
of handle
applying such large
advanced datasets, special
technologies to
increased rapidly as a result of applying advanced technologies to assist tools
assist inareinMinerals 2021, 11, 816 6 of 20
required. One such tool is the ML, which is well suited and proved to be promising for
tackling the problem of mapping geochemical anomalies [45–47] and mineral prospectivity,
due to its ability to effectively integrate and analyze large geoscience datasets [48–53].
ML and AI are actively used for mining complex, high-level, and nonlinear geospatial
data and for extracting previously unknown patterns related to geological processes [45].
These techniques were applied in the identification of mineralization related geochemical
anomalies in China [45,47,54–56], as well as generating a prospectivity map for targeting
gold mineralization in Canada [49,50] and China [51], for the detection of iron caps in
Morocco [57], for creating a continuous mineral systems model for chromite deposits in
Iran [58], and geological mapping studies using the characteristics of rocks [59,60]. The
authors in [61,62] integrated multi-sensor remote sensing techniques such as drone-borne
photography and hyperspectral imaging for processing with ML algorithms in order to
generate the geological mapping.
Another important field, where the analysis of the hyperspectral imaging has been
applied is drill-core mapping. It is well known that drilling is a decisive step for validating
and modeling ore deposits. The hyperspectral imaging technique provides a rapid and
non-invasive analytical method for the core samples in terms of mineralogical character-
ization [63]. Recently, ML techniques have been suggested for automating the process
of mineral mapping based on drill-core hyperspectral data [63–68]. However, several
obstacles might occur due to the small amount of representative data for training purposes.
To tackle this problem, resampling and co-registration procedures for the high-resolution
mineralogical data obtained by the scanning electron microscope (SEM)-based mineral
liberation analysis (MLA) of the hyperspectral data was implemented in [63,64,67]. The
new co-registered data was used for training purposes through a classification algorithm.
Mainly, the RF classifier is used due to its high performance when small training samples
are available [64,67]. Nevertheless, in [63], three methods, namely RF, SVM, and ANN
were employed for the classification and regression tasks. The authors reported that the RF
is more robust to unbalanced and sparse training sets.
Mineral processing should always be considered in the context of geological, mineral
assemblage, and texture of ores in order to predict grinding and concentration requirements,
feasible concentrate grades, and potential difficulties of separation [69]. A promising
technique was proposed by the authors of [70] in the context of control of mineral processing
plants for the identification of minerals in slurry samples through multispectral image
processing. The study was focused on the base metal sulfides minerals and the main goal
was to develop set-up aims to enable the measurement of specular-like reflections on the
surface of the particles. A supervised classification approach has been used to process
the acquired data. In [71], the mineralogical composition of the final products (copper
concentrates) was analyzed by a near-infrared hyperspectral camera. ML has been used to
provide the mineralogical spatial distribution of the different components in the samples
through the analysis of the reflective images.
The application of X-ray microcomputed tomography (µCT) in the mineral industry
has been growing due to its noninvasive nature of sample analysis. X-ray microtomography
allows achieving high-resolution images with pixel sizes in the micrometer range. However,
the grayscale values of mineral phases in a sample should be different enough to be
segmented. Despite the fact that the manual segmentation of those images made by a
highly experienced specialist is one of the best methods for segmentation, the process is
highly time-consuming. Moreover, the procedure of preparing polished thin-section for
microscope is long and the number of core samples is limited. As a consequence, the main
challenge in using ML is the limited number of ground-truth (or segmented) images that
are available for the training step. For instance, in [72], only 20 images were manually
segmented to be analyzed by a convolutional neural network (CNN), thereby resorting
the authors to employ data augmentation techniques. The authors in [73] have applied
supervised and unsupervised methods to the training data obtained by the matching
method for back-scattered electron (BSE) mineral map to its corresponding µCT slice forMinerals 2021, 11, 816 7 of 20
one drill core sample. Classifying voxels in X-ray microtomographic scans of mineralogical
samples is another problem that has been solved by applying the ML techniques [74].
The observation of optical properties of a mineral in a polarized microscope rota-
tion stage is a commonly used method for mineral type classification. This task can be
automated by the application of digital image processing techniques and AI technolo-
gies [75–78].
Interesting solutions by the implementation of an ML methodology to the prediction
of material properties from the nepheline syenite deposit was discussed in [79]. The
challenges with calculating the amphibole formula from electron microprobe analysis
can be solved by applying ML [76]. Another problem in mineralogy study that can be
addressed directly via deep learning algorithms is differentiation of quartz from resin in
optical microscopy images of iron ores [80].
3.2. The Main Resaons behind Using ML in the Selected Studies
ML techniques are typically employed to solve problems for which the application of
traditional approaches is either impossible or very sophisticated [8]. Such problems might
entail typical tasks that human beings or animals can perform routinely, yet the process
of doing such tasks is relatively unknown, tasks that involve processing an excessive
amount of data with complex unidentified relationships and patterns, or tasks that require
interaction with constantly changing environments such that high levels of adaptivity are
required [4]. Our review of the selected papers revealed that, albeit all these three reasons
can account for the necessity of using ML techniques in the area under study, the second
category of tasks is more common. In other words, in most of the studies investigated, the
researchers attempted to leverage ML techniques to cope with large and complex datasets.
Let us take mineral exploration as an example, new mineral prospect or deposit targets
are deeper, thus, more difficult to find [81]. Therefore, it becomes of utmost importance
to predict, relatively accurately, regions with higher potentials for new deposits based on
the large datasets of various types of measurements. The dataset can contain lithogeo-
chemical [49,82], spatial [49,50], geochemical [45,55,81,83], geophysical [81], geological [81],
concentration of indicator elements [47,51,52,54,56,65,68], hyperspectral [57,60,61], spatial
proxies [58], total magnetic intensity [52], isostatic residual gravity [52] data. It is worth
emphasizing that in most of such studies mineralogical analyses results are either used to
generate the input features for the ML models or ground truth for training such models.
Obviously, analyzing such massive and complex datasets is challenging, adding to that
the nonlinearities and hidden interdependencies and patterns among different features.
This calls for deploying multivariate ML models to effectively explore the data and attain
valuable insights.
In some applications, especially the tasks entailing image processing, ML is proposed
to automate manual operations to enhance productivity via enhancing speed and reducing
human errors. As an example, the authors in [78] proposed a technique for the identifica-
tion and classification of hematite crystals in iron ore using optical microscopic images.
Presence of high noise can also result in the ineffectiveness of the conventional techniques,
thereby giving rise to the application of ML. For instance, extracting quantitative miner-
alogical information about composition, porosity, and particle size through processing
X-ray microtomography scans of ore samples can be quite challenging due to the presence
of noise [74].
Another important driving force for the deployment of ML is the cost reduction.
In [47], ML is leveraged to select a small set of indicator elements to detect chemical
anomalies with the main goal of avoiding the unnecessary cost of element concentration
measurements for mineral exploration. To save time and money through reducing the
number of samples on which X-ray diffraction (XRD) measurements must be obtained,
the authors in [84] proposed an artificial neural network-based model for estimating the
mineralogical compositions based upon the elemental data from X-ray fluorescence (XRF)Minerals 2021, 11, 816 8 of 20
instruments. In a conceptually similar manner, ML is used in [85] to reconstruct synthetic
3D models of porous rocks from 2D images of thin sections.
3.3. The Outputs Predicted/Modeled Using ML in the Selected Literature and the Inputs Utilized
Based on the reviewed literature it can be considered that the most widely used input
data for analyzing by ML in the mining and mineral industry is a set of digital images. As
some examples, the hyperspectral data was used for discrimination of lithologic domains
in geology mapping [61], and a combination of the multispectral, RGB, and hyperspectral
data was analyzed by ML algorithms to create a digital outcrop model for precise geology
mapping [62]. Moreover, the hyperspectral imagery has been used for classifying rock
type and mineralogy [86], for predicting the presence of specific minerals [64] or mineral
abundance [63] in drill-core samples, as well as for drill-core mineral mapping [67,68]
and mapping of mine face geology [53]. In [87], a three-stage method is proposed for the
segmentation of hyperspectral images with the main goal of preparing the data required for
the classification of such images. In order to curb the noise in the spectral domain, Gaussian
processes (GP)—a type of supervised ML model—are used in [88] as a preprocessing step
before extracting the mineralogical information from the images.
The authors in [89] have discriminated a rock texture information through image
processing and machine learning algorithms by studying a geologist-labeled digital photo-
graph database from drill-hole samples. The main contribution of this work is “a novel
texture characterization technique to compare image textures of drill-hole samples and
discriminate between different rock texture classes”.
The study [41] used the association indicator matrix (AIM) and local binary pattern
(LBP) texture analysis methods to get quantitative textural descriptors of drill core samples
with relatively high accuracy of 84% and 88%, respectively, for AIM and 3D LBP. An
automatic method for the classification of hematite textures in Brazilian iron ores according
to their textural types through applying an AI technique for analyzing the images from a
reflected light microscope and a digital camera is described in [78]. New optical properties
have been extracted from the digital images acquired under cross and plane-polarized light
from different rock thin sections. ML was deployed for mineral classification by analyzing
the optical properties of color and texture of a pair of images of the same mineral taken on
different lights [77].
Deep learning and ML have produced accurate results in different applications when
various images are available for the training [72]. The researchers in [72,73] proposed
implementing ML algorithms to enhance automatic segmentation of mineral phases based
on the analysis of the images from the X-ray microcomputed tomography (µCT). However,
it should be noticed that acquiring µCT images is expensive and time-consuming, which
affects the limited available dataset. Therefore, a supervised ML algorithm in which the
user pre-defines the underlying pattern of the data, and the computer system builds a
prediction model based on the pre-defined pattern (training data) [73] could be successfully
applied to tackle this problem even with a small number of images. The supervised
classification method was used for generating a 2D mineral map of chromite sample from
optical microscopic images [90].
Alongside the image analysis, other input features among the mineralogical study for
the mining and minerals industry have been addressed using ML techniques. The dataset
containing geochemical data was used for extracting features related to mineralization
via a deep learning algorithm and these features were then integrated as an anomaly
map [45,47,54,56]. Applying the deep learning algorithms as a subcategory of machine
learning algorithms can lead to improving the accuracy of classification or prediction by
replacing the manual selection [45]. Such techniques have been employed in recognizing
geochemical anomalies related to mineralization via deep autoencoder networks [46],
deep variational autoencoder network [45], convolutional autoencoder networks [91], and
combining deep learning with other anomaly detection methods [54,56].Minerals 2021, 11, x 9 of 20
Minerals 2021, 11, 816 9 of 20
The bulk chemistry data from the mining company open-pit database was used as an
input for the prediction of laboratory concentrate yield and modal mineralogy for the
The bulk
nepheline chemistry
syenite data
deposit in from
Norway the mining company
by adopting open-pit
a neural database
network was used
approach as
[79]. The
an input for the prediction of laboratory concentrate yield and modal
data collected by the electron probe microanalyzer (EPMA) was analyzed with an ML mineralogy for the
nepheline syenite
method aimed to deposit in Norway
be established by adopting
for calculating theaamphibole
neural network
formulaapproach
[76]. [79]. The
data collected
The lithogeochemical data of sandstones from diamond drill cores [82] with
by the electron probe microanalyzer (EPMA) was analyzed an ML
and lithogeo-
method aimed to be established for calculating the amphibole formula [76].
chemical major oxide data from the Swayze greenstone belt [49] have been used for the
The lithogeochemical
identification of sandstones data of sandstones
above from deposits
blind uranium diamondthrough
drill cores
an [82]
ML and lithogeo-
technique in a
chemical major oxide data from the Swayze greenstone belt [49] have been
first case and for modeling of orogenic gold prospectivity mapping by deploying a sup- used for the
identification of sandstones
port vector machine and anabove blind
artificial uranium
neural deposits
network in thethrough
second an ML technique in a
one.
first case and for modeling of orogenic gold prospectivity mapping by deploying a support
vector machine
3.4. The and anLeveraged
ML Methods artificialin
neural network
the Selected in the second one.
Works
ML
3.4. The ML methods
Methodsare typically
Leveraged categorized
in the based on different aspects. From the stand-
Selected Works
point of the learning type, they are generally regarded as supervised and unsupervised
ML methods are typically categorized based on different aspects. From the stand-
approaches [3,4]. Other classes, namely semi-supervised and reinforcement learning, are
point of the learning type, they are generally regarded as supervised and unsupervised
also available
approaches [3],Other
[3,4]. yet we foundnamely
classes, no instances for the applications
semi-supervised of these methods
and reinforcement learning,inare
the
reviewed papers.
also available [3], yet we found no instances for the applications of these methods in the
In supervised
reviewed papers. learning, the data is labeled with the correct outputs such that during
the training process,
In supervised the model
learning, the can
dataunderstand
is labeled withthe underlying
the correct associations
outputs suchbetween input
that during
features and output variables. Moreover, for testing the performance
the training process, the model can understand the underlying associations between input of the algorithm,
predictions
features and of the trained
output model
variables. for test examples
Moreover, for testingcanthe
be benchmarked
performance against the known
of the algorithm,
labels to estimate the accuracy of the resulting model. In stark
predictions of the trained model for test examples can be benchmarked against the known contrast, unsupervised
learning
labels entails unlabeled
to estimate the accuracy data of
from
thewhich the learner
resulting model. must findcontrast,
In stark meaningful patterns [3].
unsupervised
In this setting, it can be challenging to estimate the performance
learning entails unlabeled data from which the learner must find meaningful patterns of the model [3]. [3].
In this setting, it can be challenging to estimate the performance of the model [3].papers fall
As shown in Figure 4a, the majority of the methods used in the reviewed
in the supervised
As shown in Figurelearning
4a, thecategory.
majority ofMore precisely,
the methods usedamong the 17% papers
in the reviewed of the fall
reviewed
in the
works thatlearning
supervised used unsupervised
category. Morelearning
precisely,models,
among onlythe 17%6%ofsolely leveraged
the reviewed unsupervised
works that used
learning [48,55,83],
unsupervised learning butmodels,
in the remaining
only 6% solely11%,leveraged
a combination of the supervised
unsupervised and unsu-
learning [48,55,83],
pervised learning techniques is utilized [54,61,73,79,92,93].
but in the remaining 11%, a combination of the supervised and unsupervised learningIn such works, unsupervised
learning methods
techniques is utilized are[54,61,73,79,92,93].
typically used forInthe feature
such works,extraction and preprocessing
unsupervised learning methods of the
data
are to be used
typically usedinfor a supervised
the featurelearning
extraction process.
and preprocessing of the data to be used in a
supervised learning process.
Combination of both Regression Combination of both
11% 10% 15%
Unsupervised
6%
Deep Learning
21%
Conventional
64%
Supervised Classification
83% 90%
(a) (b) (c)
Figure 4. Type
Figure of ML
4. Type techniques
of ML employed
techniques in the
employed inreviewed papers:
the reviewed (a) type
papers: (a) of learning;
type (b) type
of learning; (b) of problem;
type (c) type
of problem; (c)of MLof
type model.
ML model.
The task of supervised learning can be either classification or regression [8]. In a clas-
sification task,
The task ofthe labels arelearning
supervised categorical,
cani.e., have aclassification
be either set of limitedor values, however,
regression [8]. in
In the
a
case of regression,
classification labels
task, the take
labels arecontinuous
categorical,numerical
i.e., have avalues. As per values,
set of limited Figure 4b, in 90%inof
however,
thecase
the reviewed records,labels
of regression, the objective of usingnumerical
take continuous ML is classification.
values. As per Classification
Figure 4b, intasks
90% can
of
be, for instance, determining the type of minerals [73,77,94,95], texture [66,89],
the reviewed records, the objective of using ML is classification. Classification tasks can be, or rock
for instance,
[86,93], classdetermining
of mineral thefacetype
[86],ofclass
minerals [73,77,94,95],
of hematite texture
crystals [66,89], or rock between
[78], distinguishing [86,93],
class
quartzof mineral
and resinface [86], class
in optical of hematite
microscopy crystals
images [80], [78], distinguishing
presence or absence ofbetween
specificquartz
miner-
and resin
als in in optical
a sample [96],microscopy
zeolite typeimages [80], presence
[97], material or absence
fingerprints of specific
[98], class minerals
of regolith in
landform
a[99],
sample
and[96],
classzeolite type [97],
of carbonates material
[100] based onfingerprints [98], class of or
a set of measurements regolith
knownlandform [99],
features about
and class of carbonates [100] based on a set of measurements or known features about aMinerals 2021, 11, 816 10 of 20
material. On the other hand, in regression problems, the goal is to estimate a continuous
numerical value, for instance, prediction of concentrate yield and modal mineralogy [79]
and estimation of drill-core mineral abundance [63], mineral density of elements [101], and
calculation of amphibole formula [76].
From another perspective, ML methods can be categorized as conventional models
and deep learning techniques. The latter is based upon the multilayer artificial neural
networks. As presented in Figure 4c, deep learning models have been used in 36% of the
reviewed papers from which 21% solely utilized deep learning, whereas the remainder
employed both deep learning and conventional machine learning methods to choose the
best [49,54,58,63,66,70,96]. It is worth noting that the superiority of an approach depends
on the application.
A list of different ML methods used in the reviewed papers together with their
frequency of usage is provided in Table 2. As per this table, SVM, RF, and different
types of feed-forward ANN are the most frequently used approaches in the supervised
learning category. SVM classifiers are very powerful and flexible for linear and nonlinear
classification of complex but relatively small-sized datasets [8]. The main idea behind
a linear SVM classification is to find an optimal hyper plane that can separate different
classes while maximizing the margin of the plane [102]. In the case of nonlinearly separable
datasets, the data is mapped to a higher dimension space, where the classes become linearly
separable [102]. The mapping is carried out using a kernel function, typically a polynomial
or Gaussian radial basis function (RBF) [8]. In most of the reviewed works, SVM is used
with a Gaussian RBF kernel.
RF belongs to a category of ML named ensemble methods. Ensemble methods are based
on the wisdom of crowd concept, implying that aggregating the outputs of numerous simple
models through a voting system usually performs better than leveraging a single but more
complex model [8]. An RF comprises several classification and regression trees, each of
which are trained on a bootstrap sample of the original dataset [103]. Notwithstanding
their simplicity, RFs are among the most powerful ML techniques [8,104].
ANNs have a relatively long history and were originally developed to simulate the
nervous system. An ANN is comprised of numerous basic units called artificial neurons.
From a mathematical perspective, an ANN is a complex nonlinear function, which can be
tuned for a specific task to perform the desired mapping from an input vector to the output
value(s) [104]. ANNs proved to be very powerful tools and outperformed the other ML
algorithms in many applications [104].
On the other hand, in the class of unsupervised learning techniques, K-means and
hierarchical clustering are used more frequently compared to the other techniques. K-
means algorithm partitions datapoints into a predetermined number of clusters such
that the similarity among the points in a cluster is the highest, while it is the lowest for
the datapoints falling in different clusters. To achieve this goal, in K-means method, an
optimization model is solved to minimize the sum of the distances of the datapoints to the
nearest cluster center, where the positions of the cluster centers are the decision variables
of the optimization model [105]. In contrast to the K-means algorithm, which is centroid-
based, i.e., assigning a datapoint to the cluster with the nearest cluster center, in hierarchical
clustering datapoints with distances lower than a specific threshold are assigned to the
same cluster [106].
Aside from the ML techniques presented in Table 2, the implementation of real-time
expert systems in mineral processing operations is discussed in [107], where generating
quantitative data using natural language processing (NLP) of process data including ore
mineralogy is proposed.
Table 3 summarizes the applications of ML methods as well as the type of datasets uti-
lized in the reviewed papers. As per this table, principal component analysis (PCA) is the
most frequently used technique for feature engineering, more specifically for dimensional-
ity reduction [48,49,56,67,76,82,83,95,96]. Weight of evidence (WOE) [49], minimum noise
fraction (MNF) [61], orthogonal total variation component analysis (OTVCA) [61,62,65],Minerals 2021, 11, 816 11 of 20
stacked denoising autoencoder (SDAE) [56], hierarchical clustering [56], CNN [72,80],
grey-level co-occurrence matrix (GLCM) statistics [66], local binary patterns (LBP) [66],
maximum margin metric learning (MMML) [55], and K-means++ [93] are the other tech-
niques leveraged in the selected works for feature engineering.
Table 2. ML models leveraged in the selected papers.
Category ML Method Reference
[49,52,54,57,59,61–
Support vector machine (SVM)
63,65,66,68,86,87,92]
[47,58,63,64,66–68,73,82,87,90–
Random forest (RF)
93,97]
Feed-forward artificial neural network
[58,63,66,70,79,84,87,94–96,99]
(FF-ANN)
k-nearest neighbors (k-NN) [66,71,73,77,87,89]
Convolutional neural network (CNN) [50,51,72,80,85]
Gaussian processes (GP) 1 [53,60,86,88]
Supervised Decision tree (DT) [75,77,87,96]
Linear discriminant analysis (LDA) [70,78,82,92]
Radial basis function neural networks
[49,81]
(RBFNN)
Adaptive Coherence Estimator (ACE) [55]
Bayes nets [100]
Isolation forest (IF) [56]
Linear regression (LR) [101]
Naive Bayes (NB) [78,87]
Principal components regression (PCR) [76]
Quadratic discriminant analysis (QDA) [92]
Support vector regressor [101]
Variational autoencoder (VAE) network [45]
K-means clustering [48,73,92,93]
Hierarchical clustering [48,79,92]
Deep belief networks(DBNs) [54]
Unsupervised
Fuzzy C-means clustering [73]
Gaussian mixture model (GMM)
[48]
clustering
Unsupervised random forest [83]
1 With either the squared exponential (SE) or the observation angle dependent (OAD) covariance functions.
3.5. General Trends and Research Gaps in the Application of ML in the Selected Literature
Development of effective methods together with the availability of large datasets and
more powerful hardware have resulted in flourishing of ML in recent years [6,8]. This
has been reflected in the application of ML in various science and engineering domains.
Figure 5 shows the yearly distribution of reviewed literature and their type, namely re-
search articles and conference papers. As per this figure, the number of publications has
increased rapidly since 2018. It is worth mentioning that 9 out of 55 papers reviewed are
open access.Minerals 2021, 11, 816 12 of 20
Table 3. ML models leveraged—application and dataset.
Application Dataset Feature Engineering Method ML Technique
Routine electron microprobe
Calculating amphibole formula PCA [76] PCR [76]
analysis (EMPA) data
Characterizing the composition Raman spectra of mineral
PCA [96] DT [97]; ANN [96]
of igneous rocks samples
SVM [92]; LDA [92];
Classification and prediction of Hierarchical clustering [92];
Multi-element geochemical data QDA [92]; CART [92];
alteration facies K-means [92]
RF [92]
Classification of inorganic solid Topological attributes of
-1 RF [97]
materials of known structure Delaunay simplex properties
Classifying hematite crystals Optical microscope images LDA [78] NB [78]
Detecting potential Cu
mineralization in bedrocks
Geochemical data PCA [83] Unsupervised RF [83]
based on the composition of
basal till
Determining mineralogical
spatial distribution of the Near-infrared hyperspectral
- k-NN [71]
different components in a image
concentrate sample
Determining type of rock
Rock images - k-NN [89]
texture
Discrimination of lithologic
Hyperspectral data MNF [61]; OTVCA [61] SVM [61]
domains
Hyperspectral data PCA [67] RF [64,67,68]; SVM [68]
Drill-core mapping
Hyperspectral short-wave
infrared (SWIR); scanning
electron microscopy-based
RF [63]; SVM [63]; [65];
image analyses using a mineral OTVCA [65]
FF-ANN [63]
liberation analyzer (SEM-MLA);
visible/near-infrared (VNIR);
long-wave infrared (LWIR)
Elemental data acquired using
Estimating the mineralogical
X-ray fluorescence (XRF) - ANN [84]
compositions
instruments
Finding association between
Images of rock samples - LR [101]; SVM [101]
imaging and XRF sensing
Generating 2D mineral map of
Optical micrograph images - RF [90]
chromite samples
Feature elimination with
cross-validation based on
Geochemical exploration data; random forest [47]; VAE [45]; RF [47]; CNN
concentration of major and trace unsupervised deep belief [51]; SVM [54]; ACE [55];
Geochemical anomaly detection;
elements networks (DBNs) [54]; MMML IF [56]
prospectivity for future
[55]; hierarchical clustering [56];
exploration
SDAE [56]; PCA [56]
Litho geochemistry of
sandstones obtained from drill PCA [82] LDA [82]; RF [82]
cores
Geochemical assay (ppm Cu);
total magnetic intensity; - SVM [52]
isostaticresidual gravity
Spatial proxies - ANN [58]; RF [58]Minerals 2021, 11, 816 13 of 20
Table 3. Cont.
Application Dataset Feature Engineering Method ML Technique
K-means [48]; agglomerative
Geochemical imaging Qualitative LIBS spectral data PCA [48] hierarchical clustering [48];
GMM [48]
Geological and Geophysical
Mapping for mineral Multispectral, RGB, and
OTVCA [62] SVM [62]
exploration, mine planning, hyperspectral data
and ore extraction
Geological texture RF [66]; SVM [66]; k-NN [66];
Images of drill cores GLCM [66]; LBP [66]
classification ANN [66]
Identifying and mapping
geology andmineralogy on a Hyperspectral data - GP [60]
vertical mine face
Lithogeochemical major oxide
PCA [49]; WOE [49] RBFNN [49]; SVM [49]
Mapping of gold deposits and data; spatial data
prospects
Geoscience data - CNN [50]
Geological, geochemical,
structural, and geophysical - RBFLN [81]
datasets
Reflected light optical
- CNN [80]
microscopy (RLOM) images
µCT images - CNN [72]
Mineral identification Multispectral images - LDA [70]; FF-ANN [70]
Reflectance spectra - Bayes nets [100]
X-ray spectrum data PCA [95] ANN [95]
Fuzzy inference system (FIS)
X-ray microtomography scans -
[74]
Images of microscopic rock
- k-NN [77]; DT [77]
thin section (RGB pixels)
Mineral properties such as
Cramer’s Vand Pearson
Optical identification of color, hardness, pleochroism,
correlation coefficient (PCC) DT [75]
minerals anisotropism, and internal
[75]
reflections
Bulk chemistry data from the
Prediction of concentrate yield
mining company open pit - ANN [79]
and modal mineralogy
database
Physical properties of rocks - SVM [59]
Predicting rock type and mine
face, detecting hydrothermal GP [53,86]; SVM [86]; SAM
Hyperspectral data -
alteration [86]
Multi-element geochemistry K-means++ [93] RF [93]
Images of the rocks - ANN [94]
Reducing noise in Hyperspectral imagery from
- GP [88]
hyperspectral data vertical mine faces
Gamma-ray spectrometry
data; derivatives of the SRTM
Regolith landform mapping - ANN [99]
elevation model, Landsat, and
polarimetric radarMinerals 2021, 11, 816 14 of 20
Table 3. Cont.
Application Dataset Feature Engineering Method ML Technique
Segmenting hyperspectral SVM [87]; RF [87]; ANN [87];
Hyperspectral data -
images k-NN [87]; DT [87]; NB [87]
K-means [73]; FCM [73]; RF
Segmenting mineral phases µCT dataset -
[73]; k-nearest neighbors [73]
Minerals 2021, 11, x 1
14 of 20
Feature engineering methods are not used/mentioned in the corresponding works.
18 Article Conference Paper
16
14
Number of Records
12
10
8
6
4
2
0
Year Published
Yearlydistribution
Figure5.5.Yearly
Figure distributionofofthe
thenumber
numberofofselected
selectedpapers
papers(January
(January2000–April
2000–April2021).
2021).
Forthe
For thesake
sakeofofproviding
providinga ageneral
generalinsight
insightinto
intothethescope
scopeofofthe thereviewed
reviewedpapers,
papers,
Figure 6 illustrates the word frequency map of their titles, where the more
Figure 6 illustrates the word frequency map of their titles, where the more popular words popular words
arerepresented
are representedwith witha abigger
biggerfont
fontsize.
size.As
Asdepicted,
depicted,aside
asidefrom
fromthe thecommon
commonkeywords,
keywords,
namely using,machine,
namelyusing, machine,learning,
learning,and mineral,we
andmineral, wecan
cangenerally
generallyinfer
inferthethemain
maintrends
trendsdis-
dis-
cussed in the previous sections considering the relatively high frequency
cussed in the previous sections considering the relatively high frequency of the words of the words
hyperspectral,mapping,
hyperspectral, mapping, andand classification.
classification.Complementary
Complementarytoto this, Figure
this, 7 presents
Figure the word
7 presents the
frequency map for the authors’ keywords as well as index keywords,
word frequency map for the authors’ keywords as well as index keywords, where where aside from the
aside
the terms exploration, geochemical, and mapping
from the familiar words, the terms exploration, geochemical, and mapping are perceptible.in
familiar words, are perceptible. These,
line with
These, the with
in line findings presentedpresented
the findings previously, represent represent
previously, the currentthe trends in the
current application
trends in the
of ML for processing
application large datasets
of ML for processing comprising
large datasets mainly hyperspectral
comprising and geochemical
mainly hyperspectral and data
ge-
for anomaly detection and mapping of minerals in exploration studies.
ochemical data for anomaly detection and mapping of minerals in exploration studies.
Based upon our review of the selected works, we noticed the lack of high-quality
data for applying ML in the mining and mineral studies. This issue, in many cases, is
not simply related to not storing the data, but the unavailability of accurate and reliable
labels for the data, which is required for training the supervised learning models. In
many cases, the required labels need to be generated manually, thereby it is not only time
consuming but also prone to biases and human errors. Unfortunately, since most of the
works lack economic studies about the practical value of leveraging ML in the proposed
applications, investing in providing reliable datasets seems to be challenging. Thus, a
potentially valuable research avenue is the economic evaluation of using AI and ML in
mining and mineral industry.
Figure 6. Word frequency map of the title of the reviewed records.You can also read