Historical droughts in the Qing dynasty (1644-1911) of China - CP
←
→
Page content transcription
If your browser does not render page correctly, please read the page content below
Clim. Past, 16, 911–931, 2020
https://doi.org/10.5194/cp-16-911-2020
© Author(s) 2020. This work is distributed under
the Creative Commons Attribution 4.0 License.

Historical droughts in the Qing dynasty (1644–1911) of China
Kuan-Hui Elaine Lin1 , Pao K. Wang2,3 , Pi-Ling Pai4 , Yu-Shiuan Lin2 , and Chih-Wei Wang2
1 Graduate Institute of Environmental Education, National Taiwan Normal University, Taipei, Taiwan
2 Research Center for Environmental Changes, Academia Sinica, Taipei, Taiwan
3 Department of Atmospheric and Oceanic Sciences, University of Wisconsin–Madison, Madison, Wisconsin, USA
4 Research Center for Humanities and Social Sciences, Academia Sinica, Taipei, Taiwan

Correspondence: Kuan-Hui Elaine Lin (khelin@ntnu.edu.tw) and Pao K. Wang (pkwang@gate.sinica.edu.tw)

Received: 31 August 2019 – Discussion started: 7 October 2019
Revised: 17 March 2020 – Accepted: 8 April 2020 – Published: 2 June 2020

Abstract. This study presents a new epistemological analy-        1   Introduction
sis of drought chronology through a well-defined methodol-
ogy for reconstructing past drought series, as well as series
                                                                  Global warming is expected to influence the earth’s hydro-
of other associated ecological and societal impact variables.
                                                                  logical cycle and put greater stress on water resources. Cli-
Instead of building a grading system based on mixed crite-
                                                                  mate simulations reveal a wide expansion of dry areas over
ria, this method facilitates transparency in the reconstruction
                                                                  land and an intensification of wet–dry contrast at lower lat-
process and enables the statistical examination of all vari-
                                                                  itudes (Held and Soden, 2006; Schewe et al., 2014). There
ables when building series. The data for the present study
                                                                  are some recent observations that hint at the agreement with
are derived mainly from the REACHES (Reconstructed East
                                                                  the projected enlarging wet–dry contrast pattern and intensi-
Asian Climate Historical Encoded Series) database; however,
                                                                  fied drought (Schewe et al., 2014), although substantial un-
other archival documentary and index data from indepen-
                                                                  certainties about specific patterns and trends remain. Even
dent sources are also applied to understand drought narra-
                                                                  less understood is the interannual- and decadal-scale change
tives and to cross-check and validate the analysis derived
                                                                  patterns of regional precipitation and the duration and mag-
from REACHES. From the time series analysis, six severe
                                                                  nitude of drought at finer spatial and temporal resolutions
drought periods are identified in the Qing dynasty, and then
                                                                  (IPCC, 2013). Obviously, more high-quality hydroclimate
a spatial analysis is performed to demonstrate the spatial dis-
                                                                  data are necessary if we wish to remove these uncertainties.
tribution of drought and other variables in the six periods, as
                                                                  Such data are also necessary for assessing the performance
well as a social network analysis to reveal connections be-
                                                                  of climate models, especially on their capability in project-
tween drought and other ecological and societal variables.
                                                                  ing reliably the climates of the next few decades. The length
Research results clearly illustrate the role of human interven-
                                                                  of the instrumental meteorological data series is only a little
tion in influencing the impacts of drought and their societal
                                                                  more than a hundred years, which is not long enough to as-
consequences. Particularly, the correlation between drought
                                                                  sess the validity of climate models that make predictions for
and socioeconomic turmoil is not strong; crop failure and
                                                                  many decades into the future (Cook et al., 2014; Ljungqvist
famine are important intermediate factors, while ecological
                                                                  et al., 2016).
factors such as locust and disaster relief measures are all im-
                                                                     The most direct manifestation of hydroclimate variabil-
perative to intervene between crop production and famine.
                                                                  ity is drought and the flooding of the environment (Routson
Implications of the study on drought impact are provided, as
                                                                  et al., 2016; Stevenson et al., 2018). Drought and flood are
well as the significance of drought on historical climate re-
                                                                  two extremes of the hydrological cycle, and both can induce
construction studies.
                                                                  severe environmental and socioeconomic consequences. A
                                                                  flood, which generally represents the sudden onset of ex-
                                                                  cessive water, can lead to immediate loss of lives and ma-
                                                                  terial damages. The formation of drought, on the contrary,

Published by Copernicus Publications on behalf of the European Geosciences Union.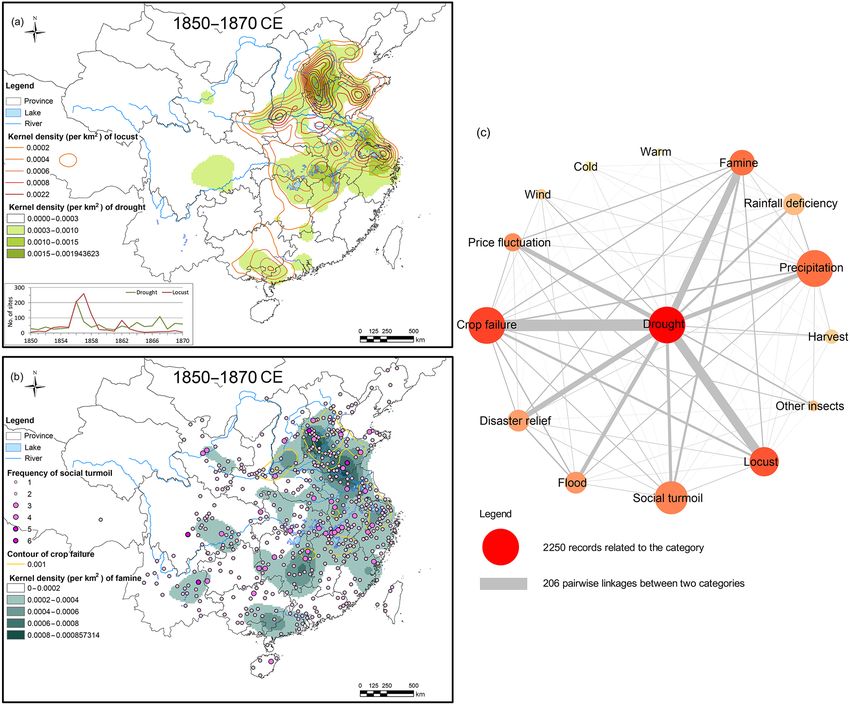
912                                                                K.-H. E. Lin et al.: Historical droughts in the Qing dynasty

normally refers to a slower and longer water deficiency pro-       et al., 2019). To be sure, there are also some criticisms
cess that can result in a more chronologically extended range      about inferring drought from documented records; for exam-
of impacts on agriculture and water scarcity, contributing to      ple, it is sometimes hard to distinguish whether the drought
catastrophic socioeconomic outcomes (Brázdil et al., 2019).        record refers to a rainfall deficiency, hydrological process, or
Given the intensified drought conditions in the future sce-        crop irrigation need. Several studies tried to remedy this by
narios as described above, there is an urgent need to study        proposing four categories of drought: meteorological drought
past droughts, especially the severe drought cases, to deci-       caused by significant reduction of precipitation for weeks
pher their occurrence, duration, magnitude, and the associ-        or months compared to normal precipitation; agricultural
ated ecological and societal consequences for implications         drought associated with lack of water for plant growth for
of future adaptation.                                              a period lasting from weeks to 6–9 months; hydrological
   Studying past drought and humidity has been a long prac-        drought characterized by a shortage or absence of water in
ticed subject in historical climatology and paleoclimatology       water courses, reservoirs, or aquifers; and socioeconomic
(Stahle et al., 2007; Tan and Liao, 2012; Yi et al., 2012; Cook    drought caused by the negative effect of drought on every-
et al., 2015; Ge et al., 2016; Hao et al., 2016; Brázdil et al.,   day life, social systems, and stability (Heim, 2002; Brázdil et
2018; Shi et al., 2018). In the instrumental era, drought is       al., 2018). There is yet another view suggesting that drought
relatively easy to define based on temperature and precip-         is a complicated process of water shortage caused and mod-
itation measurements. The instrumental era can be traced           ified by human processes (Van Loon et al., 2016). Despite
back to the mid or late 19th century, when many national           such shortages, documentary records are still one of the most
weather services started (Broennimann et al., 2018). Some          important sources for reconstructing drought series, only we
early instrumental meteorological data might be acquired in        have to be very careful in extracting proper information from
some regions, dating back to the late 17th and early 18th          them.
centuries. Prior to the instrumental era, there were primarily         Brázdil et al. (2018) have described various types of doc-
two sources of data that can be used to build drought series       umentary records that can be used for extracting drought in-
of high temporal resolution: tree-ring data and documentary        formation. Before the instrumental era, all historical climate
records (White, 2019). Tree rings provide abundant informa-        records were essentially qualitative or narrative in nature, and
tion about moisture, and sometimes temperature, for recon-         it is necessary to transform them into numerical data series so
structing millennial-long hydroclimate indices from which          that statistical analysis of them can be performed. The most
drought can be inferred. The most well-known works in-             common practice is to design a three-, five- or seven-grade
clude the Old World Drought Atlas (Cook et al., 2015),             system based on the duration and severity of drought (Zheng
which uses tree-ring data and is calibrated with the Palmer        et al., 2014; Brázdil et al., 2018) so that every single quota-
Drought Severity Index (PDSI) (Palmer, 1965), the Monsoon          tion of drought recorded can be assigned a specific value ac-
Asia Drought Atlas (Cook et al., 2010), and “Tree-ring re-         cording to the grading criteria. By arranging these grades as a
constructed megadroughts over North America since A.D.             sequence in time, we get a time series of drought grade, often
1300” (Stahle et al., 2007). Yet, tree-ring reconstruction often   called a drought index series. In reality, however, the trans-
suffers from the uncertainty in the seasonal growth of trees       formation process from qualitative narratives to digital series
and the ambiguous interpretation of isotopes (Schofield et         can be tricky because a wide spectrum of grade assignment
al., 2016). Nonetheless, high-quality quantitative drought in-     strategy exists and different investigators can derive very dif-
dex series, such as the Standardized Precipitation Index (SPI)     ferent index series based on the same set of drought records.
(Mckee et al., 1993), the Standardized Precipitation Evap-         More detailed discussions on this matter have been given by
otranspiration Index (SPEI) (Vicente-Serrano et al., 2010),        Brázdil et al. (2005) and Pfister et al. (1999).
the PDSI, and the Palmer Z-Index, can also be reconstructed            In China, a dryness–wetness (also referred to as drought–
from documentary data. For example, Brázdil et al. (2016)          flood) index has been widely used in recent decades for re-
and Možný et al. (2016) have built monthly, seasonal, half-        constructing past climates (Tan and Liao, 2012; Yi et al.,
year, and annual resolution SPI, SPEI, Z-Index, and self-          2012; Zheng et al., 2014, Hao et al., 2016; Shi et al., 2018;
calibrated PDSI series for the Czech lands. Moreover, some         for detailed review on historical climate records in China and
other special drought index series were developed in Europe        a reconstruction of past climates, please refer to Zhang and
like the Drought Rogation Index in Spain (Barriendos, 1997)        Crowley, 1989). The index series was initially built by the
and the Drought Index in Italy (Diodato and Belocchi, 2011).       Academy of Chinese Meteorological Science (CMA, 1981;
   Documentary records reflect direct human observations of        Wang and Zhao, 1981), based on historical documentary
weather conditions and are less ambiguous when used for            records, and was sequentially expanded by several Chinese
reconstructing past climates. They contain weather, climate,       scholars (see Zhang, 2003; also see Hao et al., 2020). The
and phonological and socioeconomic situations in specific          index system, based on Yi et al. (2012) with modifications
locations in various time resolutions such as daily, monthly,      from Zheng et al. (2014) and Tan et al. (2012), specifies a
or seasonal, allowing the comprehensive analysis of drought        five-grade scheme as described in Table 1.
events, scales, and contexts (Brázdil et al., 2019; Huang

Clim. Past, 16, 911–931, 2020                                                          https://doi.org/10.5194/cp-16-911-2020
K.-H. E. Lin et al.: Historical droughts in the Qing dynasty                                                                       913

Table 1. Dryness–wetness index in China.

           Grade    Severity    Examples of some descriptions
           1        Very wet    Prolonged heavy rain (e.g., excessive rain continued for over a month in spring or summer),
                                extensive flooding (e.g., heavy rain for several days, land flooded, boating on land), unusually
                                heavy typhoon rain (e.g., cropland and houses of several counties inundated by typhoon rainfall)
           2        Wet         Spring or autumn prolonged rain with moderate damage (e.g., protracted rain in spring or au-
                                tumn), local flooding (e.g., counties flooded for months, drought in spring but heavy rain in
                                summer)
           3        Normal      Favorable weather (e.g., good weather for crops, bumper harvest)
           4        Dry         Light drought disaster in single season (e.g., drought in spring or autumn), local light drought
                                disaster (e.g., short rainfall in summer, drought in other months, drought and locust outbreak)
           5        Very dry    Continued drought for more than one season or for several months (e.g., drought from spring
                                to summer or from summer to autumn, no rain in four months, rivers dried out), severe drought
                                over extensive area (e.g., thousands of miles of barren land, severe drought throughout the
                                south of the Yangtze River’s lower reach), famine (e.g., tens of thousands starving to death on
                                the street, hungry people consuming tree roots or fine soils)

   This scheme uses mixed meteorological, hydrological, and            examine the six severe drought periods, their spatiotemporal
socioeconomic criteria to determine the drought grade to               patterns, and the details of the narratives (Sect. 4). Finally,
form China’s dryness–wetness index series. This system has             the climate–society interaction will be explored, followed by
the advantage of evaluating drought severity; however, it is           an outlook on future research work (Sect. 5).
difficult to identify specific drought categories in the records,
as mentioned earlier. Thus, one cannot identify whether or
not a certain drought event was associated with a meteoro-             2     Data
logical deficiency of rainfall or had more to do with the fail-
ure of the agricultural irrigation systems. This can lead to a         2.1    Drought and associated data from the REACHES
biased interpretation of drought records as representing the                  database
atmospheric humidity condition. It also prevents proper sta-
                                                                       The main data source of this study is the REACHES (Re-
tistical associations among different drought categories (each
                                                                       constructed East Asian Climate Historical Encoded Series)
as an independent variable) and could lead to erroneous con-
                                                                       database, which is a digitized and category-coded climate
clusions about the nature of the drought and its impact.
                                                                       record of Chinese historical documents from the last three
   This study takes a new conceptual point in examining the
                                                                       millennia (readers are referred to Wang et al., 2018, for de-
drought records and proposes a new method to reconstruct
                                                                       tailed descriptions of the database). The present study uti-
past drought series and other associated ecological and soci-
                                                                       lizes only the records from the last imperial dynasty of
etal variables from Chinese historical documentary records.
                                                                       China, i.e., the Qing dynasty (1644–1911). There is a total of
Our objective is to make the interpretation of every drought
                                                                       93 415 records (database version VOL34-V3.1-04-E2) from
and associated variables as clear and operationally indepen-
                                                                       this period, and we retrieved drought and related records in-
dent as possible. This method can facilitate the statistical ex-
                                                                       cluding on locust outbreaks, dried water bodies (representing
amination of these variables and enable transparency in the
                                                                       hydrological drought), crop failures (representing agricul-
reconstruction process of historical drought series. Moreover,
                                                                       tural drought), famines, and socioeconomic turmoil (along
we will also perform a contextual analysis of severe drought
                                                                       with famine to represent socioeconomic drought). Locust
events by analyzing the strength of relation among differ-
                                                                       outbreak is an important ecological indicator closely related
ent variables and at the same time by examining their spatial
                                                                       to drought and famine as locust outbreaks often occur in
characteristics. In order to assess more clearly the true nature
                                                                       drought conditions, and these insects consume great quan-
of the drought event, we acquired more archival information
                                                                       tities of crops, resulting in widespread famine and even can-
from historical documents so as to gauge governmental and
                                                                       nibalism (Huang et al., 2019). Rigorous statistical studies on
societal responses to severe drought events.
                                                                       locust outbreaks and their relation to drought and the societal
   In the following sections, we will first briefly introduce the
                                                                       impacts they cause are rarely performed.
data used for analysis (Sect. 2). Then the methods will be de-
                                                                           REACHES has a sophisticated code system to include as
scribed (Sect. 3), followed by the presentation of the results
                                                                       much information as conveyed in the historical records. It
of the time series analysis of those variables. We will then
                                                                       uses a nine-digit code scheme: the first two digits describe

https://doi.org/10.5194/cp-16-911-2020                                                                 Clim. Past, 16, 911–931, 2020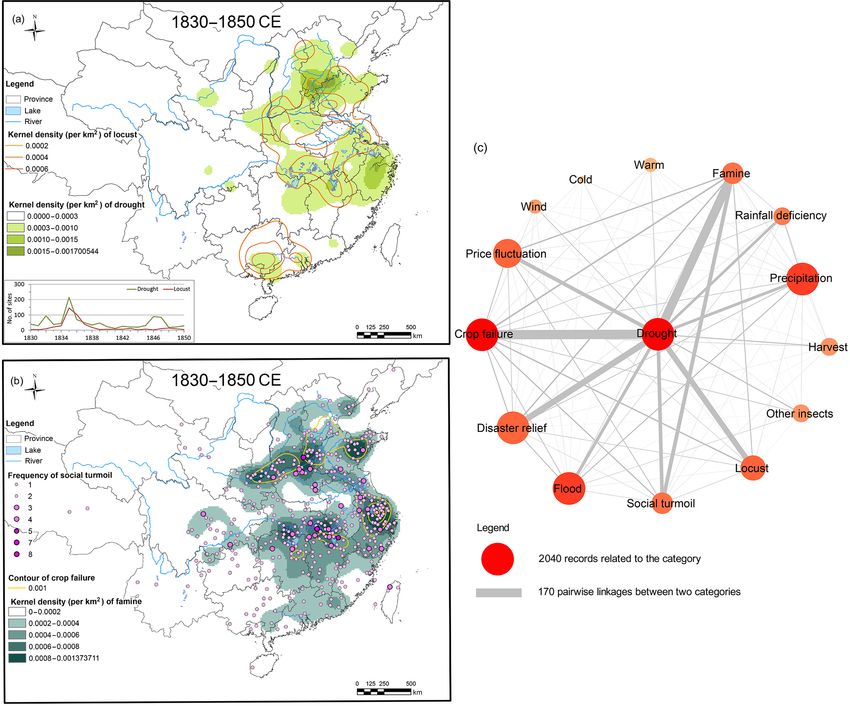
914                                                                K.-H. E. Lin et al.: Historical droughts in the Qing dynasty

the main category of the climate nature (for example, precip-      man society, they may be linked in some indirect way. This
itation, temperature). The next two digits describe the sub-       means that care must be taken when using and analyzing the
category (for example, rainfall and snow are two of many           socioeconomic variables in REACHES because of the poten-
subcategories under the precipitation category), and the next      tially biased sampling. Other sources of relevant socioeco-
three digits describe special vocabularies (for example, light     nomic data should be considered to cross-check and validate
rain and torrential downpour under the rainfall subcategory).      the analysis.
The last two digits denote the magnitude and time informa-            We retrieved 51 974 records related to drought and other
tion. As an example, a code of a record 300130156 can be de-       related variables from the REACHES database (version
ciphered as follows: the first two digits “30” indicate that the   VOL34-V3.1-04-E2) for the period 1644–1911. Figure 1a
record belongs to the main category of drought, and the next       shows the time evolution of records for the variables of
two digits “01” indicate that it is in the “drought” subcate-      drought, locust, crop failure, famine, and socioeconomic tur-
gory (i.e., the record says “drought” directly). There are other   moil, and Fig. 1b shows the number of sites (i.e., counties,
subcategories related to drought, but they were described in       cities, and prefectures in REACHES. Total number of sites
different contexts; for example, “watercourse dried out” is        with drought records = 1404) that have the corresponding
assigned as subcategory 11. The next three digits “301” in-        records of the year. The two diagrams exhibit almost iden-
dicate that its vocabulary is major drought (Kang Han). The        tical trends, showing good general consistency of the data
last two digits “56” denote magnitude and time-duration in-        series of these variables, and it is also highly likely that the
formation. In this case, “5” means the magnitude is “heavy         records are evenly or randomly distributed over the sites. All
and occurred many times”, and “6” indicates the event dura-        data derived from the REACHES database pertinent to this
tion lasted between 60 and 90 d.                                   study will be deposited at NOAA’s National Centers for En-
   Famine is also a main category item with the code 35. On        vironmental Information (https://www.ncdc.noaa.gov/paleo/
the other hand, locust outbreak is a subcategory (code 01)         study/29472, last access: 21 May 2020).
item under the main category of pest/vermin (code 32). Thus,
the complete code representing a locust record is 3201. Crop       2.2   Other archival and index data
is a main category item (code 33) that comprises various de-
grees of harvest conditions and crop species, and a vocabu-        As mentioned previously, the Compendium does not focus
lary code system ranging from 100 to 499 is assigned to de-        on and hence collect in a comprehensive manner socioeco-
scribe them individually. Similarly, socioeconomic turmoil is      nomic events; therefore, sampling bias may exist. To com-
a main category item with code 71, and the subcategory items       prehensively compare and analyze drought and associated
most relevant to this study include immigration/displacement       data series from REACHES with socioeconomic variables,
(code 03, so the full retrieval code is 7103), battle/war (code    we have consulted independent documentary sources aside
05), impoverishment (code 09), death/severely injured (code        from the Compendium. These include the Draft History of
10), human trafficking (code 12), and abandoned settlements        Qing (Qingshi Gao), the Veritable Records of Emperors of
(code 16).                                                         the Qing Dynasty (Qing Shilu), gazetteers from Xunzhou
   As the historical documents were written by a great va-         Prefecture (Tongzhi reign edition) ((Tong Zhi) Xun Zhou Fu
riety of author types, not all of them were written in a           Zhi), gazetteers from Gui County (Guangxu reign edition)
fixed standard style, and special care must be taken to de-        ((Guang Xu) Gui Xian Zhi), gazetteers from Pingnan County
note and encode these records. For example, some records           (Guangxu reign edition) ((Guang Xu) Ping Nan Xian Zhi),
sometimes use a negation to describe the absence of a phe-         and gazetteers from Yongchun County (Chinese Republican
nomenon which should take place around the time, such as           Period edition (Min Guo)) (Yong Chun Xian Zhi). Practi-
“no drought” (Wu Hang). In this case, it would be encoded          cally, it might be unavoidable that some of the contents in
under the drought category with magnitude code 8 denot-            the historical books, if referring to climatic and weather con-
ing “not occurring”. Since “no drought” items should not be        ditions, are quoted in the Compendium. For example, there
taken into the drought series in this study, we have carefully     are five quotations of records from the Veritable Records of
removed all those records with magnitude code 8 in the data        Emperors of the Qing Dynasty and 148 records from the
series.                                                            Draft History of Qing found in REACHES among the overall
   Finally, and importantly, all records of REACHES are            93 415 records from the Qing dynasty. The coverage, how-
taken from the Compendium of Chinese Meteorological                ever, is minimal in quantity among them all, while these doc-
Records of the Last 3000 Years (Zhang, 2013), which in-            uments contain meticulous records of social, economic, and
cludes only records that have direct (or indirect) implications    institutional events of the time. Local gazetteers particularly
or linkages with meteorological phenomena. Those not di-           contain detailed information about social unrest such as the
rectly related to meteorological matters were not included in      massive rebellion, the Taiping Civil War (Tai Ping Tian Guo),
the Compendium. In particular, some socioeconomic events           in the mid 19th century.
that are not explicitly linked to climate conditions may not          Besides the above documents, we also collected records
be included in the Compendium but, as often happens in hu-         on grain price, civil war, and population indices for further

Clim. Past, 16, 911–931, 2020                                                          https://doi.org/10.5194/cp-16-911-2020
K.-H. E. Lin et al.: Historical droughts in the Qing dynasty                                                                               915

Figure 1. Time series plots of drought and associated series derived from the REACHES database. Panel (a) shows the number of records
per year and panel (b) shows the number of sites (counties, cities, or prefectures) that have records for the year. Thus, one site may have more
than one record for the year. Note that the drought variable here includes meteorological and dried-water-body-related hydrological drought,
crop failure is interpreted as agricultural drought, and famine and socioeconomic turmoil are taken to represent socioeconomic drought.

analysis. Grain price data (1738–1911) were derived from                  ysis, the drought variable only corresponds to those records
the Qing Dynasty Grain Price Database, which compiles the                 with the vocabulary category of drought (such as Tien Han,
monthly grain price reports preserved in the First Historical             Kang Han, and Ku Han, all with category code 3001), endur-
Archives of China in Beijing and the National Palace Mu-                  ing scorching sun, sultry weather (e.g., Heng Yang, with code
seum in Taipei by Wang (2009). Civil war data that reveal                 3002), and different types of dried out water bodies, which
the frequency of civil wars in the Qing Dynasty were derived              include dried watercourses (e.g., Shuei Jyue, code 3011),
from the Chronology of China’s Ancient Wars by the Chi-                   dried tide/sea water (e.g., Chao Shuei He, code 3021), dried
nese Military History Writing Group (1985). Population in-                lake/pond (e.g., Hu He, code 3031), dried underground wa-
dex data come from several different sources: provincial pop-             ter (e.g., Wu Quan, code 3041), and dried river/creek (e.g.,
ulation statistics 1661–1776 CE from the Encyclopedia of                  He Shuei Jyue, code 3051). We further divided the drought
Official Documents of the Qing Dynasty (Qingchao Wenxian                  records into two groups: one group that consists of pure
Tongkao); provincial population statistics 1780–1890 from                 drought vocabularies (codes 3001 and 3002) is interpreted as
the Annual Registers of Quantities of Provincial Population               meteorological drought and the other that consists of dried
and Grain Storage by the Ministry of Revenue (Gesheng                     water bodies (codes 3011–3051) is interpreted as hydrolog-
Minshu Gushu Qingce); and the History of Population in                    ical drought. Figure 2 shows the comparison of the time se-
China, Vol. 5: Qing Dynasty (Zhongguo Renkoushi Diwujuan                  ries. We found that a higher number of hydrological drought
Qingshiqi) by Cao (2001).                                                 records often occurred in the years having more meteorolog-
                                                                          ical drought records. The correlation coefficient of the two is
                                                                          0.67, and the coefficient increases to 0.77 when only severe
3     Methods                                                             drought (to be explained later) is considered. This finding
                                                                          indicates that the large majority of hydrological drought in
3.1    Time series and cross-checking of the variables                    China can be caused by metrological drought; however, the
We used the retrieved records to build several time series for            relation is not perfect.
different variables and performed tests to cross-check the re-               To further understand the impact of different drought
liability and robustness of the drought data. First of all, we            types, we divide drought events into normal drought and se-
gave strict definitions for the drought variable. In this anal-           vere drought. The criteria of severity assignment are based

https://doi.org/10.5194/cp-16-911-2020                                                                     Clim. Past, 16, 911–931, 2020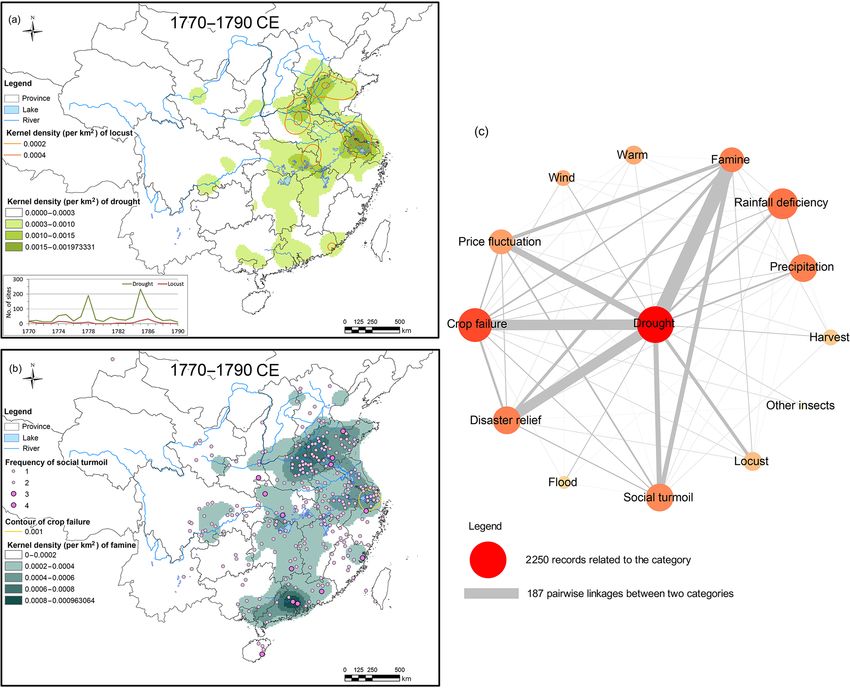
916                                                                   K.-H. E. Lin et al.: Historical droughts in the Qing dynasty

Figure 2. Comparison of drought records that indicate pure drought vocabularies (interpreted as meteorological drought) and dried water
body (interpreted as hydrological drought).

Figure 3. Time series plot of annual normal drought, severe drought, and all drought populations in REACHES during the Qing dynasty.

on the attributes of the vocabulary used and the duration de-         3.2   Spatial analysis of kernel density estimation
scribed in the record. Records that contain adjectives indicat-
ing extreme or severe drought (magnitude code 2 and 5) or             Precise geographical information in REACHES makes it rel-
indicate that the event lasted for more than 2 months (time-          atively easy to perform a spatiotemporal analysis of the cli-
duration code 6 and 7) are categorized as severe drought. In          mate data series derived from it. There are in total 1660 sites
contrast, those records that do not have any adjectives in-           representing cities, counties, or prefectures in the REACHES
dicating the severity or those with a duration of less than           database. We performed the spatial analysis of the kernel
2 months are categorized as normal drought. In this way               density function for the drought data. We first determined the
we form the annual drought population and annual severe               number of certain kinds of records each year, and the num-
drought population series, and Fig. 3 shows the time series           bers were summed over the time period defined for the analy-
plot of these two series. It is obvious that the severe drought       sis. For example, in the 1720–1740 severe drought, Baoshan
and normal drought series have good consistency and match             district of Shanghai City had three drought records occurring
very well especially for the peak years of the drought events.        separately in the years 1720, 1723, and 1724. The frequency
Remarkably, those peak drought years mostly appeared in               for the period of Baoshan district would therefore be three.
the mid to late 17th century and after the late 18th century.         We then used ArcGIS (version 10.4) to relate the data to the
The top 3 % of the drought years (those with more than 169            maps and implemented the kernel density function to con-
records for the year) are the years 1665, 1671, 1679, 1721,           duct spatial analysis.
1778, 1785, 1835, 1856, and 1876.                                        Kernel density estimation is a non-parametric method to
                                                                      estimate the probability density function of a random vari-
                                                                      able. In ArcGIS it is often used to calculate the density of
                                                                      point features around each raster cell depending on the ge-
                                                                      ographic distance and value of certain features. Namely, ev-

Clim. Past, 16, 911–931, 2020                                                             https://doi.org/10.5194/cp-16-911-2020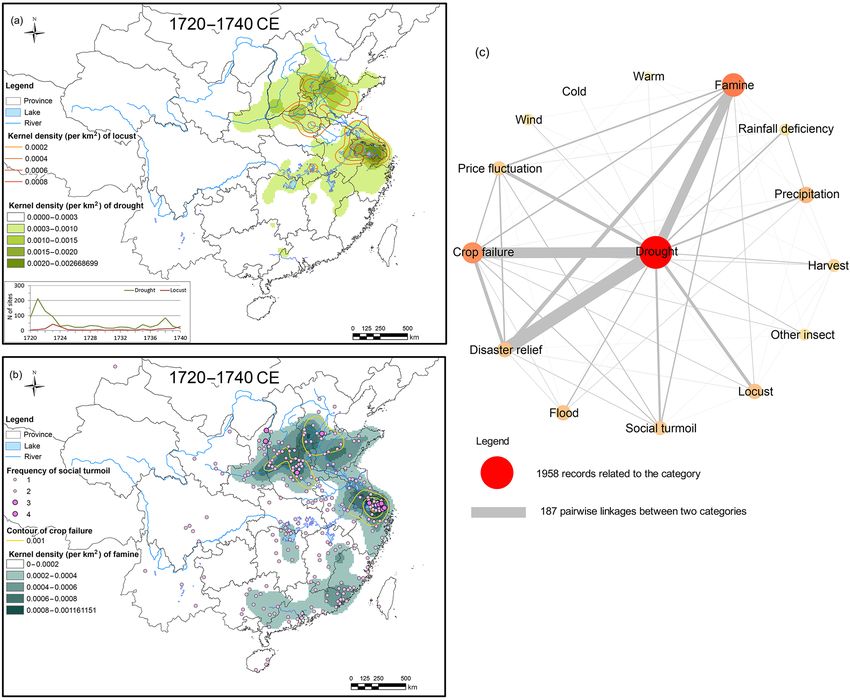
K.-H. E. Lin et al.: Historical droughts in the Qing dynasty                                                                  917

ery cell value is the highest at the location of the point fea-    frost, or drought with rice price. When all events of every
tures, diminishes with increasing distance from the point, and     record had been deconstructed and restructured following the
reaches zero at the search radius distance, called bandwidth,      algorithm, then the analysis could be performed to estimate
from the point. On every data point, a kernel function K can       the magnitude of every event (i.e., variable) and to calculate
be expressed as Eq. (1):                                           the strength of connections among those variables during cer-
                                                                 tain time periods. The function of edge list was applied to
 ˆ         1 Xn           di (x, y)
f (xy) = 2            K               ,                     (1)    perform this analysis with Gephi software (https://gephi.org/,
          nh      i=1         h                                    last access: 15 March 2020).
where fˆ(xy) is the estimated density value at location (xy), n
is the value of the point of concern (for example, in this case,   4     Results
n is the number of drought records during the period), h is
a measure of bandwidth (for a circular kernel it is the radius     4.1    Chronologies of drought and related variables
of the circle), and di (x, y) is the distance between the point
i and location (xy). Equation (1) shows that K is a density        Figure 4 shows the time series of all variables (in their annual
function characterizing how the contribution of point i varies     values) reconstructed from the REACHES database. There
as a function of di (x, y).                                        are two temperature time series in the lowest part of the fig-
   Thus, the method estimates a smoothly curved kernel sur-        ure for comparison purposes to be discussed later. Naturally
face fitted over each point depending on the point value and       there are multidecadal and centennial variabilities which are
the values of its neighboring points within the desired band-      more obvious in some periods amid regular fluctuations in
width. The choice of bandwidth is therefore important since        1644–1911.
a larger bandwidth would result in a more smoothened sur-             One of the unique features of Fig. 4 is the inclusion of the
face when considering the point value of a larger distance. In     locust outbreak series. While there had been studies on locust
the environment of ArcGIS, the kernel density estimation is        outbreak and climate, Wang (1985) was perhaps the first one
based on the quadratic kernel function (Silverman, 1986).          to utilize Chinese historical records of locust outbreaks to
                                                                   investigate their temporal and spatial behaviors. The analysis
                                                                   we present here will further reveal how close this biological
3.3   Social network analysis
                                                                   phenomenon is related to the climate factor.
To explore statistical characteristics of the relations between       We first observe that there appears to be a good synchro-
one variable and other variables in the drought data set, we       nization of large amplitude events (high peaks in the curves)
performed a social network analysis. This analysis allows us       for all variables in six periods highlighted by light yellow
to understand more quantitatively the underlying relations of      columns. These periods are roughly as follows: 1665–1680,
all variables. Social network analysis is a statistical method     ∼ 1720, 1770–1790, the 1830s, the 1850s, and the 1870s, and
widely applied in sociology to explore how different agents        the periods are also correspondent to the top 3 % of drought
are connected with each other so as to decide their distinc-       years in the previous analysis (Sect. 3.1). The most promi-
tive network types and to analyze if and how various types         nent of the synchronization is between the locust and drought
of networks would influence individual behaviors and per-          series, which is to say that locust outbreaks occurred most
formances (Lin, 1999; Scott, 2017). In this study, we treated      often during high drought occurrence periods. The close re-
each variable as an independent agent and then calculated          lation between locust outbreak and drought has been known
their statistical relations.                                       in China since ancient times. For example, the famous poet
   Generally, social network analysis adopts a pairwise ap-        of the northern Song dynasty (960–1127 CE) Su Shi (1037–
proach to calculate relations between variables (e.g., if agent    1101) wrote in his poem “Rhymed after Zhang Chuandao’s
A is linked with agent B). Thus, to implement the analysis,        ‘Happy for the Rain’, made after I prayed for rain in Chang-
data transformation is needed to display and inventory events      shan Temple”: “As always locust and drought will occur to-
(with specific codes) under every single record. For example,      gether, this is what I learned from old farmers”. Chen Fang-
one record says that “in 1833, Guangling County of Shanxi          sheng, a Qing dynasty scholar, authored the book A Study
Province, the misery [of the year] began with drought, fol-        on Catching Locusts (Bu Huang Kao), published in 1776, in
lowed by excessive rainfall, and ended with frost damages.         which he commented “when drought becomes extreme, lo-
The rice costed a thousand per dou [traditional Chinese vol-       cust outbreak occurs”. The synchronization in the two series
ume unit, equivalent to 10 Chinese liters]. There hadn’t been      thus provides a statistical verification of this ancient wisdom.
so extreme in the previous several decades” (1833) (record            The synchronization is not limited to drought and locust.
ID 2945-25). To perform the social network analysis, we de-        Other variables exhibit similar behaviors. Thus, Fig. 4 shows
constructed the record so that the drought, excessive rain-        that when drought occurs, it is very likely that a locust out-
fall, and frost damages are each listed as separate events, and    break will occur, as well as crop failure, famine, and socioe-
then we calculated the pairwise coefficients between differ-       conomic turmoil. We have not yet gone into the detailed ram-
ent variable pairs, e.g., drought with rainfall, drought with      ifications of the cause and effect analysis of this synchro-

https://doi.org/10.5194/cp-16-911-2020                                                           Clim. Past, 16, 911–931, 2020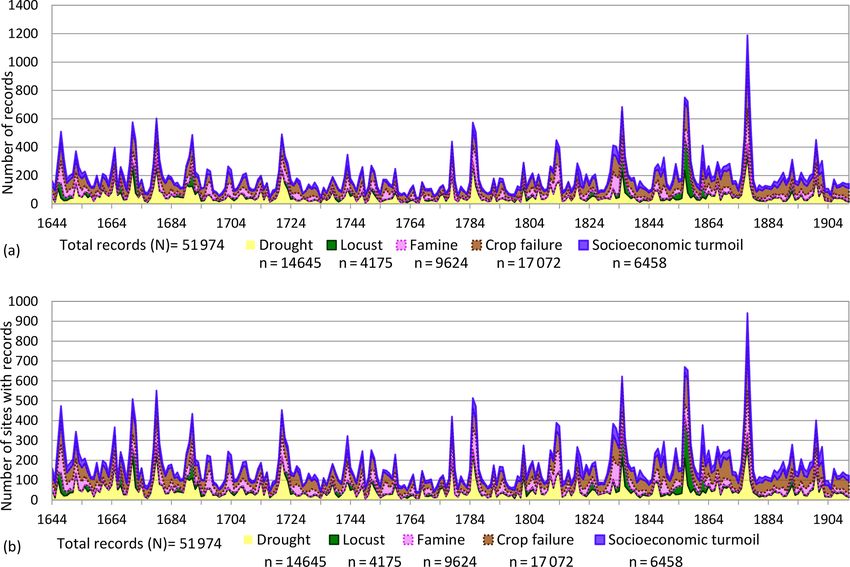
918                                                                    K.-H. E. Lin et al.: Historical droughts in the Qing dynasty

Figure 4. Time series plots of socioeconomic turmoil, famine, crop failure, locust, drought, and the Chinese monsoonal annual temperature
anomaly reconstructed from REACHES. The bottom panel shows assembled Northern Hemisphere temperature anomalies from Frank et
al. (2010). Periods with more frequent drought records are highlighted in yellow bars.

nization, but the order of events as described in the previous         We are currently collecting more evidence to further study
sentence seems to match the “common sense” that under the              such links.
general background of drought conditions, a locust outbreak               In order to further understand this synchronization feature,
has a high chance to occur, which in turn results in crop fail-        we calculated the 9-year running variance for the time series
ure causing famine. Finally, in the absence of effective inter-        as shown in Fig. 5. The six periods identified previously now
vention by the government, socioeconomic disasters occur.              become even clearer. Notwithstanding the synchronization

Clim. Past, 16, 911–931, 2020                                                               https://doi.org/10.5194/cp-16-911-2020
K.-H. E. Lin et al.: Historical droughts in the Qing dynasty 919
of high occurrence, however, the amplitudes of the variables we also considered auxiliary information we found in the
are not related linearly. While the amplitudes of drought are aforementioned historical documents such as the Draft His-
more or less even in the six periods, the amplitudes of other tory of Qing, the Veritable Records of Emperors of the Qing
variables seem to vary significantly. For example, locust out- Dynasty, and the gazetteers. For example, during the pe-
breaks were more numerous in 1660–1680, the 1830s, and riod 1720–1740, the severe drought mainly occurred around
the 1850s (the highest peak). There were fewer in the rest 1720, but the drought soon continued in the 1730s and
of the three periods. On the other hand, there were fewer 1740s, and their socioeconomic effects were closely linked.
famines in the 1600s, but they became more numerous in So it seems to be strategically prudent to consider the period
1770–1790 and the 1850s and peaked in the 1870s. Socioe- 1720–1740 as a high severity period. On the other hand, the
conomic turmoil had a relatively low amplitude in the early three severe drought periods in the 1800s appear to be less
and mid-Qing dynasty until the 1820s when it showed an in- closely linked in time (one peak every two decades), and the
crease and peaked in the 1870s. This is just to say that the auxiliary information shows that their socioeconomic con-
correlations of these series are not perfect, and their relations sequences were not closely linked either. Thus, we do not
are nonlinear; however, they have a tendency to occur in the see the necessity of lumping the three periods together. In
same period. Table 2 shows correlation coefficients among this way, we demarcate the six severe drought periods in
all those variables. We see that drought is highly correlated the Qing dynasty as follows: 1665–1691, 1720–1740, 1770–
with crop failure and famine but is less correlated with lo- 1790, 1830–1850, 1850–1870, and 1870–1890.
custs and socioeconomic turmoil. This probably can be in- In the following, we will examine the spatial distributions
terpreted as drought resulting directly in crop failure which of the droughts and the corresponding distribution of locust
very likely led to famine, but there were circumstances in outbreaks and socioeconomic turmoil. We will also provide
which a locust outbreak did not occur during the drought. a summary of the population and of the frequency of war and
The real reason needs to be investigated further. It is possible the results of the social network analysis in these six periods.
that measures of locust prevention had sometimes been taken The following discussion will frequently mention provin-
effectively and not so in other times. Likewise, the socioeco- cial names in China; hence, it may be confusing for readers
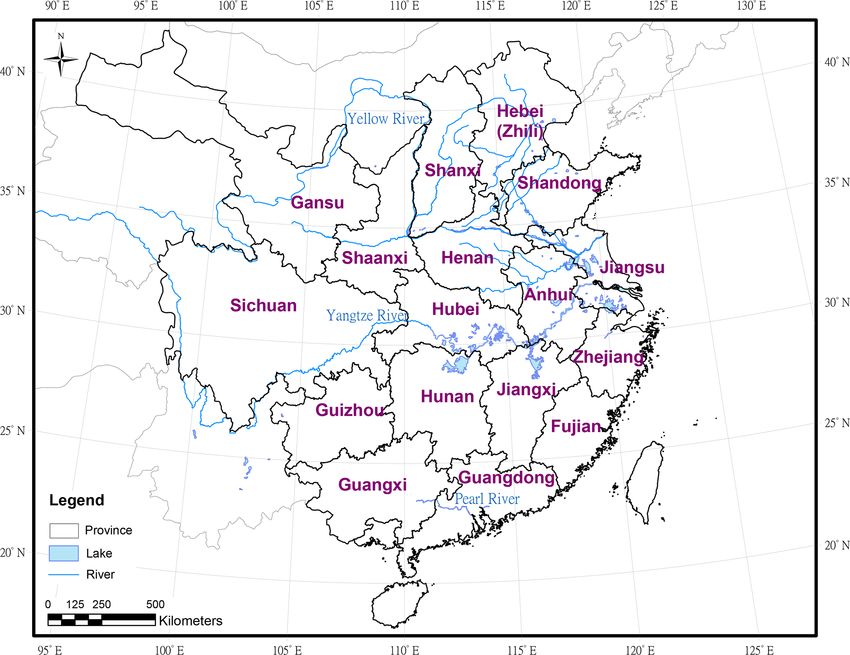
nomic situation would not be that directly linked to drought not familiar with Chinese geography. Figure 6 is a simplified
if the government provided adequate relief (provide food, tax map showing the locations of the provinces mentioned in the
waiver, etc.). We plan to look into more details about the re- discussion for reference.
lations among these variables in the future.
To further understand the multidecadal and centennial 4.2.1 The period 1665–1691
variabilities, we compare these series with two temperature
series: one reconstructed from REACHES (Lin et al., 2019) Figure 7 shows the overall situation of drought-related vari-
and the other from the assembled Northern Hemisphere tem- ables in the period 1665–1691, including the spatial distri-
peratures of Frank et al. (2010). The two temperature se- bution of the kernel density function of drought (Fig. 7a),
ries show similar trends in anomalies which appear to aug- the associated locust outbreaks and social turmoil (Fig. 7b),
ment the reliability of data derived from REACHES. Fig- and the social network chart (Fig. 7c). Figure 7a shows the
ure 4 shows that the higher frequency of all the drought- drought kernel density distribution, which is an indicator of
related variables tends to occur more often when tempera- the severity of the drought. It is seen that in this period
tures were lower in the 17th century and after the late 18th drought was fairly widespread in the eastern half of China
century. Thus, colder periods in historical times also tend to from as far north as Hebei Province and as far south as
be periods of low agricultural yields and social instability, Guangdong Province. There appear to be two “epicenters”
which is consistent with some previous studies (Pei et al., of drought, one in the lower Yellow River floodplain (Hebei
2019; Su et al., 2016; Wei et al., 2017) and Shandong) and the other in the middle and lower reaches
All coefficients have a p-value < 0.001 in Table 2. Note of the Yangtze River (Anhui and northern Jiangsu). There are
that we have in Sect. 3.1 identified the correlation coefficient also secondary centers in Hubei, Jiangxi, and Zhejiang. The
between meteorological drought and hydrological drought as droughts in the south, such as in Fujian and Guangdong, were
0.67, which increases to 0.77 when severe drought is consid- relatively mild.
ered. Here we would like to stress an important caution when
reading the spatial patterns: they should be viewed as a map
4.2 The spatial pattern of drought during the six
of anomaly instead of a map of humidity. This is because the
high-occurrence periods
drought index (as well as other severity indices such as tem-
perature) derived here represents the deviation from the local
In the above analysis, we identified six periods in which the norm, and the local norm can be quite different in different
drought-related variables exhibit nearly synchronous fluctua- locations in a country as large as China. Thus, a certain dry
tions. We now would like to demarcate more precisely these condition lasting for, say, a month may well be considered a
periods based primarily on the drought series. In doing so, drought in the normally humid southern China, but it could
https://doi.org/10.5194/cp-16-911-2020 Clim. Past, 16, 911–931, 2020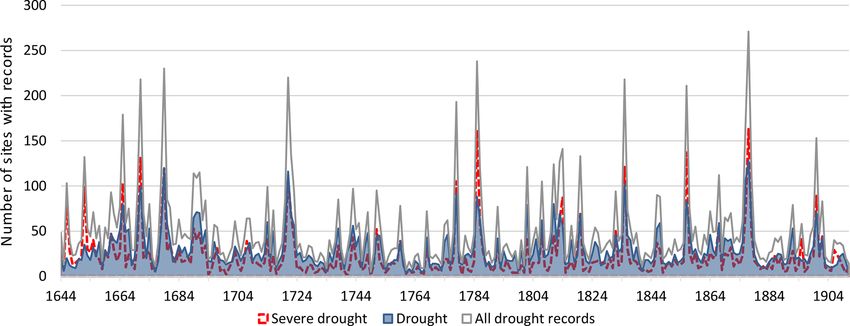
920 K.-H. E. Lin et al.: Historical droughts in the Qing dynasty
Figure 5. The 9-year running variance for the multiple variables of REACHES.
Table 2. Correlation coefficients of REACHES multiple variables.
Drought category Variable Drought Locust Socioeconomic Famine Crop failure
turmoil
Meteorology & hydrology Drought 1.000
Ecological-related Locust 0.375 1.000
Socioeconomics Socioeconomic turmoil 0.442 0.287 1.000
Famine 0.618 0.379 0.718 1.000
Agriculture Crop failure 0.626 0.511 0.685 0.675 1.000
be regarded as a normal condition in the Loess Plateau re- Revolt of the Three Feudatories in 1673–1681). This will re-
gion in northern China because their norms are quite differ- quire further study.
ent. There is a need of an algorithm that converts the anomaly
index to actual humidity which must consider this local norm
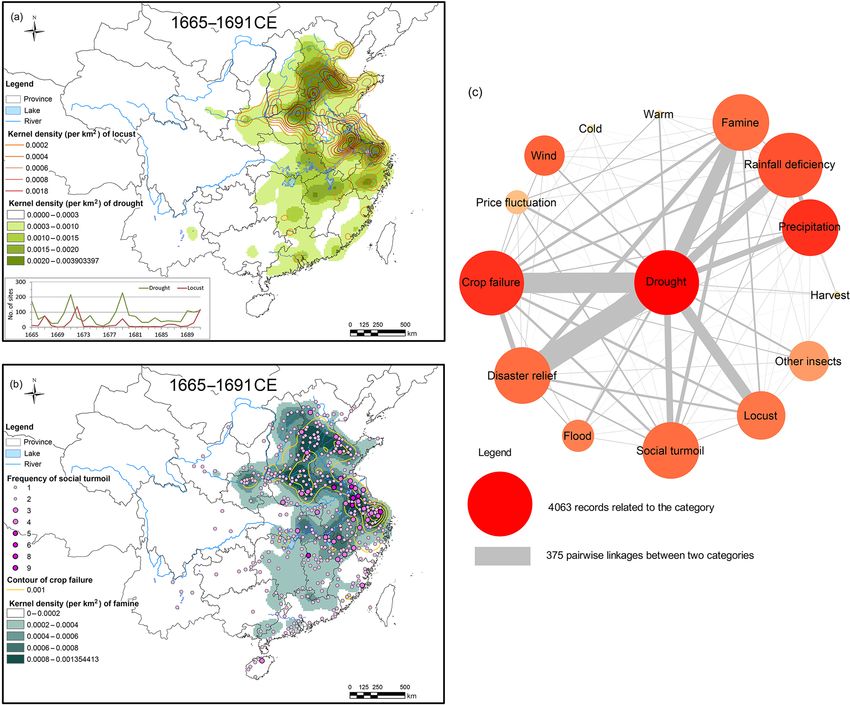
factor. An investigation is being conducted on this subject. 4.2.2 The period 1720–1740
Figure 7a shows the pattern of locust outbreaks, and Fig-
ure 7b shows the corresponding spatial patterns of famine The 1720–1740 drought as shown in Fig. 8a appears to be not
and social turmoil in this period. We observe that the pat- as widespread as that in 1665–1691. While there are still two
terns are similar to those of drought, and both are also cen- centers – one in the lower Yellow River and another in the
tered around the lower Yellow and middle and lower Yangtze lower Yangtze River – the latter appears to be the more se-
rivers, which again vindicates the ancient wisdom of the vere one. The corresponding locust outbreaks and social tur-
close relationship between drought and locusts (and the con- moil are also centered in these two regions, although those in
sequential social turmoil they might cause). the lower Yellow River appears to be somewhat more exten-
The period 1665–1691 is about 2 decades after the col- sive. There was famine reported in Fujian, Guangdong, and
lapse of the Ming empire in 1644, which was replaced by the Guangxi provinces, but there was not much corresponding
Manchurian Qing empire after the bloody wars among differ- drought reported in these areas. There was also social tur-
ent parties, including Ming, Qing, and the rebellious farmers moil in areas not affected by drought or locust. Were these
led by Li Zicheng. The population of China was substantially disturbances not climate related? The reason is unclear and
reduced due to the wars. But even at this time, revolts in dif- will require further study.
ferent parts of China were still going on. Severe drought and There is a term in the Chinese historical community called
locust outbreaks occurred in 1670–1672 and appeared again High Qing era or the Kang Yong Qian prosperity period, re-
in 1679 and 1689–1691. Given the very similar patterns of ferring to the period reigned over by the emperors Kangxi,
drought, locust outbreak, and social turmoil distributions at Yongzheng, and Qianlong when the Chinese economy was
the time, it is possible that many of these revolts were mo- relatively prosperous. It is often considered the golden era of
tivated by the food shortage (thus climate related) in addi- the whole Qing dynasty. The demarcations of the period dif-
tion to those motivated by political considerations (e.g., the fer among scholars, but a generally usable one is 1684–1799
(Guo, 2002). The period 1720–1740 of concern here falls in
this golden era.
Clim. Past, 16, 911–931, 2020 https://doi.org/10.5194/cp-16-911-2020K.-H. E. Lin et al.: Historical droughts in the Qing dynasty 921
Figure 6. Provincial boundaries and names in the eastern part of China. The basic latitude and longitude grid map is from the Esri data set,
and provincial and city and county boundary and river shapefiles are from the Chinese State Bureau of Surveying and Mapping, Digital Map
Database of China (1990 version).
Emperor Kangxi died in 1721 and was succeeded by his the disaster-affected areas and the implementation of locust
son, Emperor Yongzheng, after a conspiratorial process. But elimination, might have played a significant role here.
Yongzheng himself died in 1735 after another process also
full of rumors, and his heir was Emperor Qianlong, who died
in 1799. Thus, Emperor Yongzheng was the main ruler in the 4.2.3 The period 1770–1790
period 1720–1740. During this time, the whole Chinese em-
This period was entirely under the reign of Emperor Qian-
pire was generally stable. There were some wars with minor-
long. Five years later in 1795 he claimed to have passed the
ity tribes, such as the one with the Mongolian Galdan Tseren
throne to his son, Emperor Jiaqing, although in reality he was
of the Dzungar Khanate, but none were extensive.
still in control until he died in 1799. China was relatively sta-
The population of China had generally grown during this
ble politically in this period. It was reported that the national
period, but the drought and locust outbreaks certainly left
population had returned to that in the Ming dynasty. Only
their marks on the affected areas. According to a 1725 pop-
some minor revolts occurred in western China in 1771–1776
ulation record, Shandong’s population grew slowly at this
by Jinchuan tribes, who were related to Tibetan tribes, and
time, and the population of Jiangsu declined. Later famine
in Taiwan in 1786–1788 led by Lin Shuangwen Tiandihui
occurred in the north of the Huai River floodplain around
(literally Heaven and Earth Society, a secret society that still
1738, which is drought related and lasted for several years
exists today). A British diplomatic mission led by George
(Fig. 8b).
Macartney was granted an audience with Emperor Qianlong
The social network analysis (Fig. 8c) shows some interest-
in 1793, an event that became the prelude to wars between
ing features. The links between the pairs of drought–locust,
China and western powers later.
drought–crop failure, and drought–famine, though still sig-
The spatial distributions of drought and the correspond-
nificant compared to other pairs, were much weaker than
ing locust outbreaks, famine, and social turmoil as shown
in the previous period. This seems to indicate that while
in Fig. 9a and b are both similar to those in 1720–1740;
drought occurred, the societal impact was relatively mild. Al-
namely, both are still centered on the lower Yellow and lower
though the real reasons still need to be researched carefully,
Yangtze regions and a smaller center in Guangdong in the
there is documentary evidence showing that the governmen-
south. Drought appears to be more mild, but affected areas
tal policies, such as the shipment of grain to and tax relief for
appear to be wider and social turmoil appears to be some-
what worse than in 1720–1740.
https://doi.org/10.5194/cp-16-911-2020 Clim. Past, 16, 911–931, 2020922 K.-H. E. Lin et al.: Historical droughts in the Qing dynasty
Figure 7. Spatial distribution of the kernel density function of drought and locust outbreaks (a) and social turmoil (b), and the social network
chart (c) in the drought period 1665–1691.
The social turmoil was likely linked to social inequality was facing an increasing economic downturn after Emperor
due to the gap between the rich and poor. The wide spread of Daoguang assumed the throne in 1820 when his father, Ji-
locust outbreaks also prompted the government to pay more aqing, died. Many Chinese historians consider that the over-
attention to the technology of locust eradication, and the pre- spending of Qianlong is to blame for the declining economy,
viously mentioned A Study on Catching Locusts was pub- especially since the discovery of the stunning corruption of
lished in this period. Drought in this period led to a reduction his most favored minion, Heshen, who was believed to have
in crop yield, resulting in famine and a sharp rise in grain amassed illegally a net wealth equal to 15 years worth of to-
price around 1779 and 1786. Figure 9c shows the social net- tal tax collection by the Qing government. But from today’s
work analysis of this period. point of view, the challenge from western powers at the time,
such as the British, French, and Germans, was probably a
4.2.4 The period 1830–1850 more serious problem. Although there were some smaller ri-
ots occurring in this period, the most well-known armed con-
The overall political and economic situation of China was flict was the Opium War which occurred in 1840 between the
going downhill after nearly 200 years of Qing rule. The mid- Qing and British empires. After the war, the inability of the
dle of Emperor Qianlong’s rule was generally considered the Qing government to cope with the international pressure in
peak of the heyday of the Qing dynasty, and by 1830 China
Clim. Past, 16, 911–931, 2020 https://doi.org/10.5194/cp-16-911-2020K.-H. E. Lin et al.: Historical droughts in the Qing dynasty 923 Figure 8. Spatial distribution of the kernel density function of drought and locust outbreaks (a) and social turmoil (b), and the social network chart (c) in the drought period 1720–1740. various aspects was completely exposed and ushered in more social network analysis in Fig. 10c. But overall, drought is serious challenges internally. mostly related to crop failure and famine. Perhaps part of the blame can be attributed to the climate An interesting feature worthy of note here is the spatial factor. Figure 10a and b show the drought and the corre- patterns of locust outbreaks and social turmoil, which ex- sponding locust outbreaks, famine, and social turmoil spa- hibit an east–west (E–W) orientation. There are apparently tial patterns. The drought conditions look similar to those two prominent E–W belts: the north one along Shandong, in Fig. 8a, but the locust–social turmoil patterns look much southern Hebei, and southern Shaanxi provinces and the worse and more widespread than in 1770–1790. Locust out- south one along Jiangsu, southern Hubei, and northern Hu- breaks and famine reached as far west as Shaanxi Province in nan provinces. northern China and Sichuan Province in central China, which Documentary sources show that the national population were largely spared in the previous period, and as far south continued to grow rapidly, but per capita arable land declined as Guangdong and Guangxi provinces. Hubei Province in significantly. Whether or not the decrease in arable land was central China was plagued badly by locusts and social un- due to climate factors remains to be studied, but there is lit- rest. Even the relatively wealthy province of Zhejiang had tle doubt that the society was under a great stress of resource seen serious locust outbreaks and social unrest. Such rela- competition. This eventually led to numerous uprisings. tions among drought-related factors can also be seen in the https://doi.org/10.5194/cp-16-911-2020 Clim. Past, 16, 911–931, 2020
924 K.-H. E. Lin et al.: Historical droughts in the Qing dynasty
Figure 9. Spatial distribution of the kernel density function of drought and locust outbreaks (a) and social turmoil (b), and the social network
chart (c) in the drought period 1770–1790.
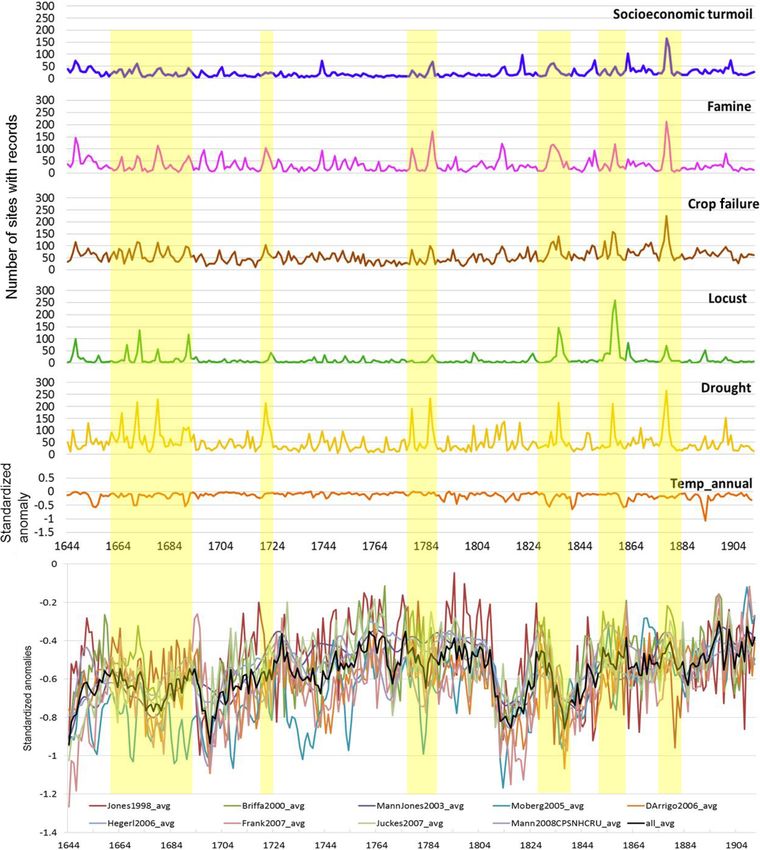
One would expect that many of the uprisings must have 4.2.5 The period 1850–1870
been due to food shortages given the declining production
of grains. Curiously, the rice price information in 1825–1860 In this period, drought conditions in the Yellow River plain in
which we obtained for several places including Suzhou (of Hebei and Shandong in northern China worsened, and locust
Jiangsu Province), Hubei, and Guangxi paints a fairly dif- outbreaks were also widespread similar to the 1830–1850 pe-
ferent scene. Suzhou’s rice price fluctuated more wildly but riod. Figure 4 shows that the locust outbreak frequency in
appears to have been steady when averaged throughout the this period is the highest in the whole Qing dynasty. Famine
period. Guangxi’s rice price was very steady, and Hubei’s occurred in locations where locust outbreaks were severe.
price was even declining during this period. Perhaps this phe- The center of the worst condition – severe drought, heavy
nomenon only pertains to these few cities as we have not locust outbreaks, and high famine density – was in the com-
studied the situation of other locations. This will be left for bined region of Hebei and Shandong provinces, forming a
future research. northwest–southeast (NW–SE) belt as shown in Fig. 11a
and b. This is in contrast to the E–W orientation of the cor-
responding distributions in the previous period as shown in
Fig. 10. Could this difference in orientations be an indication
of the regional atmospheric circulation pattern change? We
will conduct further studies on this subject in the future.
Clim. Past, 16, 911–931, 2020 https://doi.org/10.5194/cp-16-911-2020K.-H. E. Lin et al.: Historical droughts in the Qing dynasty 925 Figure 10. Spatial distribution of the kernel density function of drought and locust outbreaks (a) and social turmoil (b), and the social network chart (c) in the drought period 1830–1850. This was a time when the political situation of the Qing try. “Nian” was one of the cult-like secret societies active in dynasty became increasingly unstable. Emperor Daoguang central China, especially along the region between Anhui and died in 1850 and was succeeded by his son, Emperor Xian- Henan provinces, after the disastrous Yellow River flood in feng. Rebellions erupted all over China. The deadliest one 1851, which deluged hundreds of thousands of square miles was the Taiping Rebellion led by Hong Xiuquan, who was a and killed a large number of people. The scale of the soci- self-proclaimed Christian and who claimed to be the brother etal turmoil was not as large as the Taiping Rebellion, but it of Jesus Christ, which started in 1850 and ended in 1864. still caused serious social disruption and loss of lives. The This is thought to be the largest-scale civil war in China in rebellion lasted from 1853 to 1868. There is no doubt that the Qing dynasty and the bloodiest. Casualties are estimated this and the Taiping Rebellion caused huge damage to the to be in the range of 10–30 million, and another 30 million Chinese economy and contributed to the many heavy-turmoil fled to other settlements in China. This 14-year war impacted circles in Fig. 11b. Since these turmoil circles are unrelated 18 provinces, but the region south of the Yangtze River suf- to drought, they could appear in locations not affected by fered the most casualties in this conflict. drought. The social network analysis in Fig. 11c shows the In central and northern China, it was another bloody war, strong links between drought–locust, drought–crop failure, the Nian Rebellion, that caused severe damage to the coun- and drought–famine. https://doi.org/10.5194/cp-16-911-2020 Clim. Past, 16, 911–931, 2020
926 K.-H. E. Lin et al.: Historical droughts in the Qing dynasty
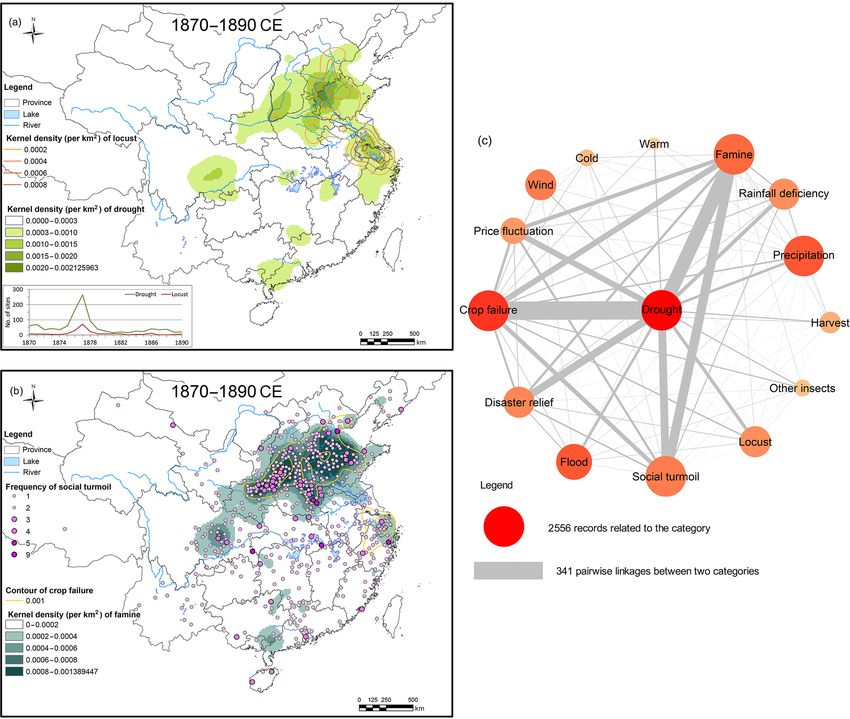
Figure 11. Spatial distribution of the kernel density function of drought and locust outbreaks (a) and social turmoil (b), and the social
network chart (c) in the drought period 1850–1870.
4.2.6 The period 1870–1890 This period was near the end of the Qing dynasty, which
lasted 21 more years and finally ended in 1911. China was
devastated by the Taiping Rebellion in the previous pe-
Figure 12a and b show the drought spatial distribution and riod, and the political situation was highly unstable as for-
the corresponding locust outbreaks, famine, and social tur- eign powers posed huge challenges to the Qing government.
moil distribution. In northern China, the spatial patterns Emperor Xianfeng died in 1874, and Emperor Guangxu, a
match quite well. The drought was centered on the region be- nephew of Xianfeng but adopted as a son later, succeeded to
tween Hebei and Shandong. The center of famine and social the throne, although the person in real power was the Em-
turmoil was larger, encompassing Shandong, Hebei, Shanxi, press Dowager Cixi. She declared war on all foreign powers
and Shaanxi. There was a small pocket of drought, as well after the Boxer Rebellion erupted in 1900, leading to the in-
as locusts, famine, and social turmoil, in Sichuan Province. vasion of Beijing by the allied armies of eight countries.
The whole belt shows a NE–SW orientation. There was also The social network chart in Fig. 12c shows a feature
a small center of drought, locust, and social turmoil in north- unique in this period that is not prominent in other periods:
ern Jiangsu. The rest of China, especially the south, appeared the link between famine and social turmoil is very strong (the
to be under no serious threat of drought, although there were gray bar linking the two is very thick). This can also be un-
still sporadic social disturbances occurring in various places.
Clim. Past, 16, 911–931, 2020 https://doi.org/10.5194/cp-16-911-2020You can also read