Bioaerosols in the Amazon rain forest: temporal variations and vertical profiles of Eukarya, Bacteria, and Archaea - Biogeosciences
←
→
Page content transcription
If your browser does not render page correctly, please read the page content below
Biogeosciences, 18, 4873–4887, 2021
https://doi.org/10.5194/bg-18-4873-2021
© Author(s) 2021. This work is distributed under
the Creative Commons Attribution 4.0 License.

Bioaerosols in the Amazon rain forest: temporal variations and
vertical profiles of Eukarya, Bacteria, and Archaea
Maria Prass1 , Meinrat O. Andreae2,3 , Alessandro C. de Araùjo4 , Paulo Artaxo5 , Florian Ditas1,a , Wolfgang Elbert1 ,
Jan-David Förster1 , Marco Aurélio Franco1,5 , Isabella Hrabe de Angelis1 , Jürgen Kesselmeier1,2 , Thomas Klimach1 ,
Leslie Ann Kremper1 , Eckhard Thines6,7 , David Walter1 , Jens Weber1 , Bettina Weber1,8 , Bernhard M. Fuchs9 ,
Ulrich Pöschl1 , and Christopher Pöhlker1
1 Multiphase   Chemistry Department, Max Planck Institute for Chemistry, 55128 Mainz, Germany
2 Biogeochemistry    Department, Max Planck Institute for Chemistry, 55128 Mainz, Germany
3 Scripps Institution of Oceanography, University of California San Diego, La Jolla, CA 92083, USA
4 Empresa Brasileira de Pesquisa Agropecuária (EMBRAPA), Belém, PA, Brazil
5 Institute of Physics, University of São Paulo, São Paulo 05508-900, Brazil
6 Institute for Microbiology and Wine Research, Johannes Gutenberg University Mainz, 55128 Mainz, Germany
7 Institute of Molecular Physiology, Johannes Gutenberg University Mainz, 55128 Mainz, Germany
8 Institute of Biology, University of Graz, Holteigasse 6, 8010, Graz, Austria
9 Department of Molecular Ecology, Max Planck Institute for Marine Microbiology, 28359 Bremen, Germany
a now at: Hessisches Landesamt für Naturschutz, Umwelt und Geologie, 65203 Wiesbaden, Germany

Correspondence: Christopher Pöhlker (c.pohlker@mpic.de) and Maria Prass (m.prass@mpic.de)

Received: 15 December 2020 – Discussion started: 18 January 2021
Revised: 2 June 2021 – Accepted: 4 June 2021 – Published: 6 September 2021

Abstract. The Amazon rain forest plays a major role in          the sources and dispersion of different types of Amazonian
global hydrological cycling, and biogenic aerosols are likely   bioaerosols as a solid basis for model studies on biosphere–
to influence the formation of clouds and precipitation. In-     atmosphere interactions such as bioprecipitation cycling.
formation about the sources and altitude profiles of primary
biological aerosol particles, however, is sparse. We used
fluorescence in situ hybridization (FISH), a molecular bio-
logical staining technique largely unexplored in aerosol re-    1   Introduction
search, to investigate the sources and spatiotemporal distri-
bution of Amazonian bioaerosols on the domain level. We         The study of atmospheric bioaerosols represents a challeng-
found wet season bioaerosol number concentrations in the        ing field in aerosol research because of their diverse particle
range of 1–5 × 10⁵ m−3 accounting for > 70 % of the coarse      properties, including size, morphology, mixing state, hygro-
mode aerosol. Eukaryotic and bacterial particles predomi-       scopic behavior, and metabolic activity. Bioaerosols are ubiq-
nated, with fractions of ∼ 56 % and ∼ 26 % of the intact air-   uitous in the atmosphere worldwide and comprise prokary-
borne cells. Archaea occurred at very low concentrations.       otic (Bacteria and Archaea) and eukaryotic (e.g., fungi and
Vertical profiles exhibit a steep decrease in bioaerosol num-   algae) cells, various reproductive entities (e.g., spores and
bers from the understory to 325 m height on the Amazon          pollen), and fragments of biological material (Andreae and
Tall Tower Observatory (ATTO), with a stronger decrease         Crutzen, 1997; Jaenicke, 2005; Després et al., 2012). The sci-
in Eukarya compared to Bacteria. Considering earlier in-        entific and socioeconomic attention that bioaerosols have re-
vestigations, our results can be regarded as representative     ceived can be explained by their manifold and fundamental
for near-pristine Amazonian wet season conditions. The ob-      roles in atmospheric chemistry and physics, biogeography,
served concentrations and profiles provide new insights into    public health, ecology, and agriculture (e.g., Pöschl et al.,
                                                                2010; Morris et al., 2014; Fröhlich-Nowoisky et al., 2016;

Published by Copernicus Publications on behalf of the European Geosciences Union.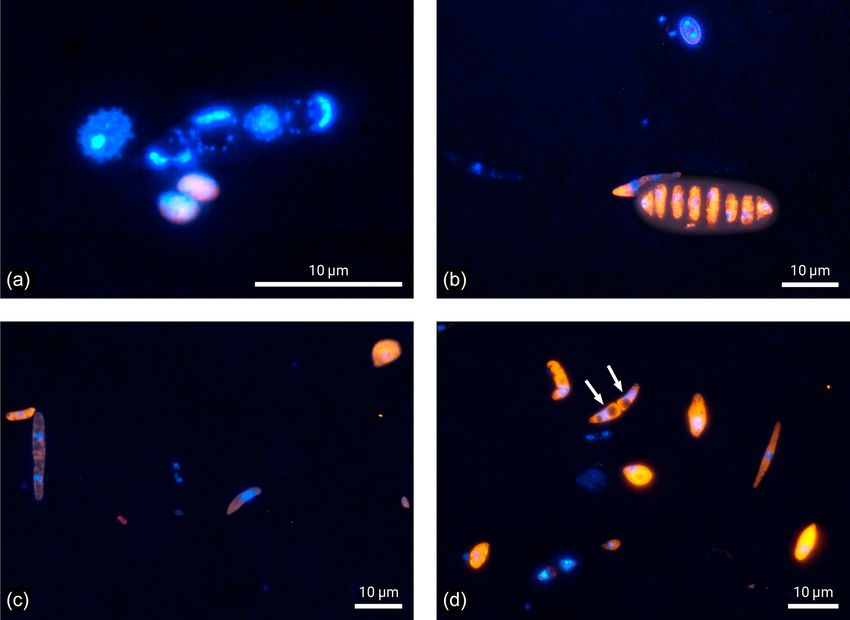
4874                                                                     M. Prass et al.: Bioaerosols in the Amazon rain forest

Reinmuth-Selzle et al., 2017). To date, central aspects of their   most pristine conditions, which is unique data for this glob-
mechanistic roles and relevance in these fields are not fully      ally important ecosystem. In fact, the atmospheric Bacteria
understood, and they are even largely unexplored. Progress         and Archaea concentrations are the first published results of
in our understanding is hampered by analytical limitations in      this type for a tropical rain forest environment (Table S3 in
resolving the complexity, diversity, and highly dynamic life       the Supplement). The concentrations obtained here can serve
cycle of bioaerosols in the atmosphere (Morris et al., 2011;       as a reference for modeling and process studies on climate-
Šantl-Temkiv et al., 2019). Particularly scarce are techniques     relevant forest–atmosphere interactions such as bioprecipi-
that provide atmospheric number concentrations for specific        tation cycles. Third, this study has utilized the tall tower at
and clearly defined organism groups within the bioaerosol          the remote Amazon Tall Tower Observatory (ATTO) site to
population (e.g., Mbareche et al., 2017; Kabir et al., 2020;       obtain vertical gradients of Bacteria, Archaea, and Eukarya
Sect. S1.4 in the Supplement).                                     concentrations over the rain forest (with sampling heights at
   The number of bioaerosol field observations worldwide           5, 60, and 325 m). These gradients allow us to estimate con-
is constantly increasing (Després et al., 2012; Fröhlich-          centration ranges for bacterial, archaeal, and eukaryotic cells
Nowoisky et al., 2016; Šantl-Temkiv et al., 2019, and ref-         touching the cloud base and thus to assess their potential rel-
erences therein) with bioaerosol studies in regions that are       evance for cloud microphysics.
essential for the climate system being particularly relevant.         The samples analyzed in this study were collected during
This refers to the oceans and forested ecosystems which            prevailing clean wet season conditions in the Amazon. The
cover large areas of the Earth and entail intense surface–         6 d sampling period was chosen for detailed analysis as the
atmosphere interactions (e.g., Bonan, 2008; Mayol et al.,          aerosol mixture approximated a pre-industrial state with the
2014; Artaxo et al., 2021). Moreover, certain (though in-          bioaerosol population originating from the primary rain for-
creasingly few) regions of the oceans and the large forests are    est region within the ATTO site’s footprint. A detailed char-
still sufficiently unperturbed by human emissions and activ-       acterization of the conditions can be found in the Supple-
ities to approximate a preindustrial and thus pristine state of    ment. The FISH protocol used in this work is an adaptation
the atmosphere (Hamilton et al., 2014; Pöhlker et al., 2018).      of pre-existing protocols (Glöckner et al., 1996; Pernthaler et
Along these lines, it has remained largely unknown which           al., 2004) with modifications and optimizations for the spe-
mechanistic roles “[bio]aerosols before pollution” (Andreae,       cific requirements of bioaerosol analysis. The main experi-
2007) have played in biogeochemical and hydrological cy-           mental steps of the FISH protocol are illustrated and (briefly)
cles and to what extent such processes have been perturbed         explained in Fig. 1. A focal point of this study has been
by the nowadays pervasive anthropogenic emissions and ac-          the careful cross-validation and comparison of the obtained
tivities. One important topic in this context is the ability of    FISH results with online aerosol data, as well as a synthesis
certain bioaerosols to act as efficient ice nuclei (IN) at com-    with existing literature knowledge. This validation is impor-
paratively warm temperatures (i.e., > −10 ◦ C) with impor-         tant since FISH is experimentally demanding and prone to
tant implications for cloud microphysics and precipitation         various artifacts (i.e., false positive or false negative counts)
formation (e.g., Delort et al., 2010; Morris et al., 2014).        and thus may yield biased results (Thiele et al., 2011). A
   The analytical and scientific novelty of this study is          comparison with data from different locations or obtained
threefold. First, it widens the spectrum of techniques for         by different methods is meaningful only within certain lim-
bioaerosol investigations in environmental samples by ex-          its (for details see Sect. S1.4 in the Supplement). We over-
ploring the analytical potential of fluorescence in situ hy-       all found a high consistency with complementary online data
bridization (FISH) in this field. FISH is a molecular ge-          from the ATTO site, as well as from previous studies, which
netic technique for the specific staining of cells by targeting    underlines that the obtained organism concentrations are a
characteristic RNA or DNA sequences with complementary             solid representation of the Amazonian wet season bioaerosol
and fluorescently labeled nucleotide probes (e.g., Amann and       population.
Fuchs, 2008). In terrestrial and marine microbiology, FISH
has become an important technique in identification and enu-
meration of microbial organisms with numerous applications         2     Materials and methods
(e.g., Christensen et al., 1999; Pernthaler et al., 2004). How-
ever, applications in bioaerosol research have remained re-        2.1    Measurement location: the Amazon Tall Tower
markably sparse (Lange et al., 1997; Harrison et al., 2005;               Observatory
Yoo et al., 2017). Our results demonstrate that FISH has po-
tential in bioaerosol analysis as it provides number concen-       The Amazon Tall Tower Observatory is a research site
trations of specific organism classes (i.e., from domain down      located in the Uatumã Sustainable Development Reserve,
to species level) and, therefore, combines bioaerosol identi-      Amazonas State, Brazil (Andreae et al., 2015). It comprises
fication, enumeration, and visualization. Second, this study       several ground-based containers and three towers of differ-
provides number concentrations for prokaryotic and eukary-         ent heights (80 m height: “triangular mast” and “walk-up
otic cells in the Amazonian rain forest atmosphere under al-       tower”; 325 m height: “tall tower”) equipped with state-of-

Biogeosciences, 18, 4873–4887, 2021                                                   https://doi.org/10.5194/bg-18-4873-2021
M. Prass et al.: Bioaerosols in the Amazon rain forest                                                                                  4875

Figure 1. Bioaerosol sampling strategy in the Amazon rain forest and molecular genetic staining for microscopic identification and quantifi-
cation. (1) Bioaerosols were collected on polycarbonate membranes at three different sampling heights at ATTO. (2) Biological material on
the filters was prepared for staining by fixation and cell wall permeabilization. Then, fluorescently labeled oligonucleotide probes were used
to assign bioaerosols at the domain level in a hybridization step. Overall bioaerosol numbers were obtained by DNA staining with DAPI,
the so-called counterstaining. (3) Fluorescence signals were systematically enumerated and converted into atmospheric bioaerosol number
concentrations.

the-art instrumentation to analyze biosphere–atmosphere ex-              based container and connected to a TSP inlet via stainless
change processes in this remote continental location. The for-           steel inlet lines. Aerosols were filtered onto white polycar-
est ecosystem is driven by alternating wet and dry seasons in-           bonate membranes (Isopore PC membrane, 0.2 µm pore size,
ducing conditions that temporarily resemble a pre-industrial             47 mm diameter, GTTP04700, Merck, Darmstadt, Germany)
and thus pristine state. Hundreds of square kilometers of un-            by applying a vacuum. Filters were autoclaved at 121 ◦ C and
touched primary forest surround the research station, form-              220 kPa for 15 min before use. The sample airflow rate was
ing its biogeochemical footprint region (Pöhlker et al., 2019).          set to 9 L min−1 by a digital mass flow controller (D-6341-
Further information on the sampling location can be found in             FGD-22-AV-99-D-S-DR, Wagner Mess- und Regeltechnik,
the Supplement.                                                          Offenbach am Main, Germany) installed between the pump
                                                                         (N840.3FT.18, KNF Neuberger, Freiburg im Breisgau, Ger-
2.2   Aerosol sampling at ATTO                                           many) and a custom-made filter holder.
This study focuses on seven aerosol samples collected during             2.3    Complementary online measurements at ATTO
the wet season from 25 February to 3 March 2018 with an ap-
proximate sampling duration of 23 h each. Samples at 5 and               During filter sampling, three instruments measured aerosol
60 m height were collected at the triangular mast and those              number concentrations in parallel at 60 m height: an optical
at 325 m at the tall tower. At 5 m, the filter holder was con-           particle sizer (OPS; model 3330, size range 0.3–10 µm, TSI
nected directly to a total suspended particle (TSP) inlet. At 60         Inc., Shoreview, MN, USA) and a scanning mobility particle
and 325 m heights, filter holders were mounted in a ground-              sizer (SMPS; classifier 3080, detector 3722, DMA 3081, size

https://doi.org/10.5194/bg-18-4873-2021                                                           Biogeosciences, 18, 4873–4887, 2021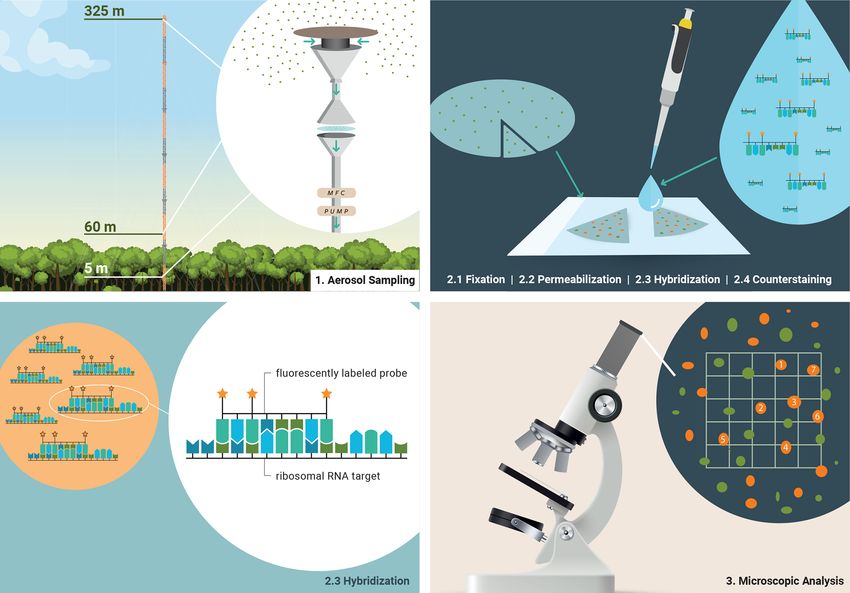
4876                                                                     M. Prass et al.: Bioaerosols in the Amazon rain forest

range: 0.01–0.42 µm, TSI Inc., Shoreview, USA). Both de-           mix), ARCH915, and NON338) and achromopeptidase solu-
tected aerosols in a size resolved manner, and a condensation      tion (60 U mL−1 , 20 min for EUB338-mix, ARCH915, and
particle counter (CPC; model 5412, GRIMM Aerosol, Ain-             338), both at 37 ◦ C, enabled the entrance of oligonucleotide
ring, Germany) measured total aerosol concentrations. De-          probes during hybridization. To remove all enzymes, fil-
tailed information on OPS, SMPS, and CPC measurements              ter sections were washed in excess MILLI-Q water. Subse-
can be found in Andreae et al. (2015) and Moran-Zuloaga            quently, the filter sections were incubated in 30 µL hybridiza-
et al. (2018). Stained bioaerosols could only be detected          tion buffer – 900 mM NaCl, 20 mM Tris / HCl, 1 % block-
and identified as such by microscopy if their diameter was         ing reagent, 0.01 % SDS (sodium dodecyl sulfate), and for-
∼ 0.7 µm or larger. For a comparison between NFISH and to-         mamide depending on probe – containing 2 µL probe work-
tal aerosol numbers, only OPS data detected in the accord-         ing solution (8.4 pmol µL−1 ) at 46 ◦ C for 120 min. Oligonu-
ing channels were considered (0.74–10 µm, N0.7–10 ). Sev-          cleotide probes targeting bacterial, eukaryotic, and archaeal
eral sensors monitored meteorological conditions at ATTO           cells were used. The probe NON338 served as negative con-
such as incoming shortwave radiation (pyranometer, CMP21,          trol. Probe sequences, labels, and the respective formamide
Kipp & Zonen, Netherlands) and rainfall (rain gauge, TB4,          concentrations are presented in Table 1. After hybridization,
Hydrological Services Pty. Ltd., Australia). Further informa-      filter sections were directly transferred into 50 mL preheated
tion on micrometeorological sensors and instrumentation at         washing buffer – 0.9 M (EUK516) or 0.08 M (EUB338-mix,
ATTO can be found in Andreae et al. (2015).                        ARCH915, NON338) NaCl, 20 mM Tris / HCl (pH 7.4),
                                                                   5 mM EDTA (ethylenediaminetetraacetic acid), and 0.01 %
2.4    Fluorescence in situ hybridization                          SDS – and incubated floating freely for 15 min at 48 ◦ C in
                                                                   the dark. The 50 mL tubes containing washing buffer and fil-
Several previous studies containing fluorescence in situ hy-       ter sections were gently inverted when the incubation started
bridization (FISH) protocols were considered in terms of           and ended. Subsequently, filter sections were rinsed in a Petri
buffer ingredients, incubation times, and further details to       dish containing MILLI-Q water and a second Petri dish con-
obtain reliable results in bioaerosol analysis. Original refer-    taining 70 % ethanol. Filter sections were dried on Kim wipes
ences can be found in Glöckner et al. (1996, 1999), Pern-          at room temperature for 15–30 min. Dry filter sections were
thaler et al. (2004), Fuchs et al. (2007), and Schmidt et          mounted in Citifluor AF1 containing 4 µg mL−1 DAPI.
al. (2012). The chemicals used for fixation, permeabilization,
hybridization, staining, and mounting are listed in the Sup-       2.5    Epifluorescent microscopic enumeration and
plement (Table S4). Best results were obtained by applying                bioaerosol projection
the following procedure. Directly after sampling, bioaerosols
on the filters were fixed by an incubation in a freshly pre-
                                                                   Filter sections were inspected with a Nikon Ti2-E in-
pared solution of 2 % formaldehyde in phosphate-buffered
                                                                   verse epifluorescence microscope (Nikon, Microscope Solu-
saline (PBS). For this purpose, filters were inserted into glass
                                                                   tions, Minato, Japan) at 600× magnification (objective: Apo
filtration towers (item number 16309, Sartorius, Göttingen,
                                                                   Lambda S 60× oil with 1.4 numerical aperture and a 10×
Germany) and covered with ∼ 15 mL of the solution. The liq-
                                                                   wide-field ocular). Epifluorescence filter cubes were chosen
uid was removed after 1 h at 28 ◦ C ambient temperature by
                                                                   according to the fluorescent dye properties as summarized
applying a gentle vacuum. Subsequently, filters were flushed
                                                                   in Table 1. Fluorescence signals derived from DAPI stain-
by covering them with 20 mL deionized water (Milli-Q wa-
                                                                   ing or FISH were counted manually using an ocular grid
ter) and applying vacuum again. The same procedure was
                                                                   (Zeder et al., 2011). One person examined all filter samples
repeated with 20 mL ethanol 70 %. Filters were air-dried and
                                                                   for FISH and DAPI signals to ensure consistent counting pro-
stored in Analyslide® petri dishes (7231, Pall corporation,
                                                                   cedure. As in previous studies, the examiner rested regularly
New York, USA) at −20 ◦ C in the freezer. Filters were trans-
                                                                   to avoid eye fatigue leading to decreasing signal detection.
ported to Germany frozen and stored in the freezer at −20 ◦ C
                                                                   FISH and DAPI signals were detected by taking their color,
until further processing.
                                                                   fluorescence intensity, size, shape, and surface structure into
    The filters were then cut into sections and numbered with a
                                                                   account. Raw counts were documented with the help of a me-
pencil at room temperature. For each sample, one fixed, cut,
                                                                   chanical counter. In a first step, filter sections that were em-
and numbered filter section was directly mounted in Citifluor
                                                                   bedded in a mix of Citifluor and DAPI were analyzed. The
AF1 (Citifluor Ltd., Canterbury, UK) containing 4 µg mL−1
                                                                   atmospheric number concentrations of bioaerosols that were
DAPI (40 ,6-diamidino-2-phenylindole; SERVA, Heidelberg,
                                                                   stained with the DNA dye were calculated by extrapolating
Germany) for total cell number detection.
                                                                   DAPI raw counts with respect to the grid size, covered filter
    To prevent cell loss during FISH, filter sections were
                                                                   area, and sampled air volume following Eq. (1):
covered with a thin layer of low gelling point agarose
(0.2 % in MILLI-Q water). Cell wall permeabilization by
means of incubation in lysozyme solution (10 mg mL−1 ;                        Ngrid · Af
                                                                   NDAPI =                 ,                                   (1)
60 min for EUK516 and 45 min for EUB338-I-III (EUB-                           Agrid · Vair

Biogeosciences, 18, 4873–4887, 2021                                                     https://doi.org/10.5194/bg-18-4873-2021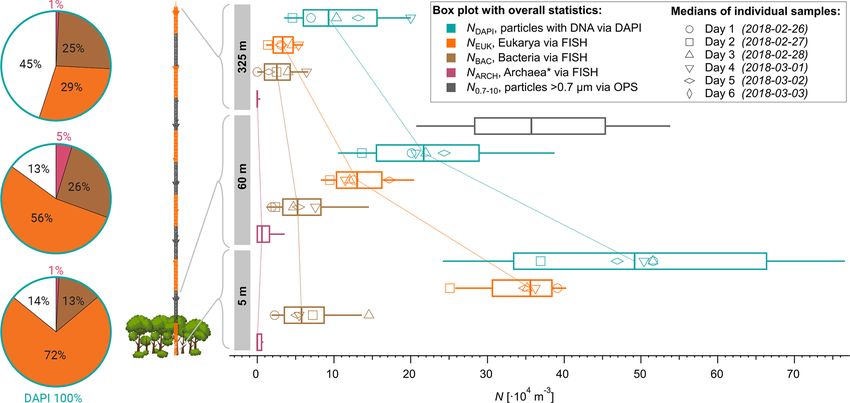
M. Prass et al.: Bioaerosols in the Amazon rain forest                                                                              4877

Table 1. Technical details of rRNA targeting probes and corresponding microscopic filters (excitation, Exc., dichroic mirror, Dic., and
emission, Em.) used for FISH. As described in Daims et al. (1999), a mixture of EUB338 I, II, and III (referred to as EUB-mix) was applied
for identification of Bacteria. By use of ARCH915, Archaea were identified, and EUK516 was applied to hybridize Eukarya. NON338
served as negative control. DAPI stains all particles containing DNA by attaching preferably to adenine- and thymine-rich sequences. For
our experiments, fluorescent labels in the reddish wavelength range were chosen to avoid overlap with the autofluorescence of bioaerosols
which is typically strong in the green wavelength range (Pöhlker et al., 2012).

   Probe/stain   Sequence/target                     Label            Form-     Reference                     Exc.    Dic.        Em.
                                                                      amide                                          mirror
   EUB338I       GCTGCCTCCCGTAGGAGT                  4× ATTO594        35 %     Amann et al. (1990)
   EUB338II      GCAGCCACCCGTAGGTGT                  4× ATTO594        35 %     Daims et al. (1999)
   EUB338III     GCTGCCACCCGTAGGTGT                  4× ATTO594        35 %     Daims et al. (1999)        562/40       593    624/40
   NON338        ACTCCTACGGGAGGCAGC                  4× ATTO594        35 %     Wallner et al. (1993)
   ARCH915       GTGCTCCCCCGCCAATTCCT                1× ATTO594        35 %     Stahl and Amann (1991)
   EUK516        ACCAGACTTGCCCTCC                    1× ATTO542            0%   Amann et al. (1990)        545/25       565    605/70
   DAPI          DNA                                                                                       387/11       400    409 LP

where NDAPI = atmospheric bioaerosol number concentra-                 the National Center for Biotechnology Information (NCBI)
tion stained with DAPI (m−3 ), Ngrid = number of DAPI                  database were ∼ 4.8 and ∼ 4.3 Mb for Proteobacteria
stained cells counted per grid, Af = area filter (mm2 ),               and Actinobacteria, respectively (https://www.ncbi.nlm.nih.
Agrid = area grid (mm2 ), and Vair = sampled air volume (m3 ).         gov/genome/browse#!/prokaryotes/proteobacteria, last ac-
   Afterwards, filter sections treated with the FISH tech-             cess: 10 April 2021). By comparing these numbers to re-
nique were inspected. The FISH signals were enumerated                 sults by Landenmark et al. (2015) and Trevors (1996), the
first (NFISH ), and consecutively DAPI counterstaining sig-            approximate bacterial and archaeal genome size were de-
nals were quantified in the same field of view to avoid bleach-        fined as 4 Mb for bioaerosols. The genome size of fungi was
ing of the former. Ratios of hybridized bioaerosols were cal-          used as a representative value for Eukaryotes since coarse
culated and multiplied with the bioaerosol number concen-              mode bioaerosols in the Amazon were reported to mainly
trations obtained by DAPI staining only. To achieve robust             consist of fungal spores (Graham et al., 2003a; Huffman et
statistics at least 500 DAPI stained cells per filter sample           al., 2012). As these genome sizes are several orders of magni-
and probe were inspected, and often more than 1000 were                tude smaller compared to those of higher plants, we consider
counted. According to Pernthaler et al. (2003) this reduces            airborne DNA mass obtained this way and presented here as
the counting error to < 5 %. Raw counts of hybridized and              a lower limit for the Amazon forest bioaerosol. In NCBI the
DAPI stained cells for each filter sample are presented in the         typical genome size for basidiomycetes and ascomycetes is
Supplement (Table S1).                                                 indicated as 30 Mb.

2.6   Quantification of atmospheric DNA concentration

Airborne DNA mass was calculated by the multiplication of              3    Results and discussion
mean bioaerosol numbers obtained by FISH with the typical
DNA mass of a bacterial, eukaryotic, or archaeal cell follow-          In the wet season atmosphere at the ATTO site, Eukarya and
ing Eq. (2):                                                           Bacteria accounted for the majority of cells, whereas Ar-
                                                                       chaea occurred at lower numbers and appeared to be rather
          NFISH · bp · 609.7 g mol−1                                   rare in the investigated bioaerosols. At all sampling heights,
mDNA =                               ,                         (2)     the number concentration of eukaryotic cells (NEUK ) was
                      NA
                                                                       highest ranging from ∼ 3.5–38 × 104 m−3 , followed by Bac-
where      mDNA = airborne    DNA       mass      (g m−3 ),            teria (NBAC ) ranging from ∼ 3.0–7.0 × 10⁴ m−3 , and Ar-
NFISH = bioaerosol number concentration obtained by                    chaea (NARC ) ranging from ∼ 0.1–1.3 × 10⁴ m−3 (Table 2,
FISH (1 m−3 ), bp = genome size (base pair cell−1 ),                   Fig. 2). These numbers are in good agreement with estimated
609.7 g mol−1 = average mass of a base pair in bound form,             and measured concentrations in previous bioaerosol stud-
and NA = Avogadro constant.                                            ies (e.g., Burrows et al., 2009b; Fröhlich-Nowoisky et al.,
   The genome sizes were determined as follows. Souza                  2016). For instance, the measured NBAC values fall within
et al. (2019) found Proteobacteria and Actinobacteria to               the estimated range of bacterial cell concentrations for forest
be the dominant phyla within the airborne Amazonian                    ecosystems (i.e., 3.3–8.8 × 10⁴ m−3 ) according to Burrows
bacterial population. The median genome sizes found in                 et al. (2009a). Furthermore, a predominance of Eukaryotes

https://doi.org/10.5194/bg-18-4873-2021                                                         Biogeosciences, 18, 4873–4887, 2021
4878 M. Prass et al.: Bioaerosols in the Amazon rain forest
in the Amazon was shown by Souza et al. (2019) and El- to the local and regional meteorology requires more extended
bert et al. (2007), which is consistent with our results. Of follow-up FISH studies. In contrast to the bioaerosol bur-
further atmospheric relevance is the number concentration of den mainly originating from forest emission during clean wet
all airborne cells that were determined by staining the in- season conditions, an investigation of long-range-transport-
tracellular DNA with the fluorescent dye DAPI1 (NDAPI ). related changes in the air microbiome might be of interest,
Here, NDAPI ranged on average from ∼ 12–53 × 104 m−3 for instance with respect to dust-associated bacteria as found
(Tables 2 and 3). Due to the given specificity of the FISH by Prospero et al. (2005) and Yamaguchi et al. (2012).
probes (∼ 80 %–90 % of all target cells according to the SIL- In addition to intact airborne cells, bioaerosol definitions
VAref138.1 database, https://www.arb-silva.de, last access also include biological fragments (Després et al., 2012).
8 December 2020), a certain fraction of cells remains un- These fragments – a complex mixture of biological material
classified (i.e., NFISH < NDAPI with NFISH = NARC +NBAC + in a continuum of degradation states, e.g., from mechanical
NEUK ). In this study, NFISH accounted for ∼ 60 %–90 % of fragmentation, cell rupture, or cytosol release – can be of sig-
NDAPI (Tables 2, S1), which indicates a good performance nificant atmospheric relevance as they may comprise (high)
of the FISH protocol (Thiele et al., 2011, and references ice activity or allergenic potential (Šantl-Temkiv et al., 2015;
therein). Steiner et al., 2015; Reinmuth-Selzle et al., 2017). However,
Figure 2 shows the time series of NEUK , NBAC , NARC , and a direct analysis of these fragments is often notoriously diffi-
NDAPI at 60 m height with complementary meteorological cult because of their morphologically and biologically unde-
and aerosol data under pristine rain forest conditions. Here, fined state. Both the DAPI and FISH quantifications predom-
the total aerosol particle count between ∼ 0.7 and 10 µm inantly target intact cells since upon cell rupture or damage,
(N0.7–10 ) – corresponding to the effectively DAPI- and FISH- the contained nucleic acids might be released and degraded.
counted size range – serves as a reference number concen- Therefore, the ratio of NDAPI vs. N0.7–10 provides a valuable
tration and ranges from ∼ 30–48 × 104 m−3 (Table 3). Rela- estimate of the presumably intact cell fraction vs. the fraction
tive to NDAPI , Eukaryotes accounted on average for ∼ 56 %, of fragments within the size range from 0.7 to 10 µm of the
Bacteria for ∼ 26 %, and Archaea for ∼ 5 % of the cells. Amazonian bioaerosol population. This estimate relies on the
The bioaerosol number concentrations NEUK , NBAC , NARC , assumption that under unperturbed wet season conditions the
and NDAPI show a clear day-to-day variability. For instance, vast majority of coarse mode particles originates more or less
NEUK varies by a factor of 2, whereas NBAC varies by a factor directly from primary emissions of the rain forest (compare
of 4 (Table S1). NARC shows even larger variations, although Moran-Zuloaga et al., 2018; Pöhlker et al., 2018). This as-
the low counting statistics here require caution in interpret- sumption is justified here since other potential coarse mode
ing these results2 . Along these lines, the bioaerosol mixture sources (i.e., Saharan dust, Atlantic sea salt, and ash from
– i.e., the ratios of NEUK , NBAC , and NARC relative to NDAPI biomass burning) can be largely excluded during the sam-
as represented by the pie charts in Fig. 2 – also shows a clear pling period. On average, intact cells accounted for the ma-
variability. Here the days from 1 to 3 March 2018 stand out as jority of coarse mode particles with NDAPI /N0.7–10 values
they are characterized by a rather high abundance of NBAC . of ∼ 70 %, which is in good agreement with previous stud-
This increase in NBAC , might be related to the strong rain ies (Tables 3 and S3). Accordingly, we obtained ∼ 30 % on
event in the night from 27 to 28 February 2018. Bacterial average as an upper limit estimate for the fraction of frag-
cells on the leaf surfaces might have been emitted through ments and degraded biological material in this size range.
mechanical momentum of the raindrop impaction according The estimated concentration (3–19 × 104 m−3 ) and fraction
to Joung et al. (2017) and/or might be related to a “post-rain” (12 %–58 %) of fragments is quite variable, which points at
bioaerosol enhancement according to Huffman et al. (2013). interesting open questions for follow-up studies on potential
While the results presented here emphasize such potential degradation pathways in the Amazonian bioaerosol cycling.
links between the variability in bioaerosol concentrations and Furthermore, we investigated the bioaerosol variability
meteorological environmental parameters (which are specu- with height across the lower 325 m of the boundary layer to
lative so far), the statistical basis of these initial FISH results assess the gradients of specific organism classes in this par-
is too small to constrain these relationships. Accordingly, an ticularly important part of the atmospheric vertical structure.
investigation of bioaerosol emission mechanisms in relation As expected, the vertical profiles displayed in Fig. 3 show
a general and rather steep decrease in the average cell con-
1 DAPI = 40 ,6-diamidino-2-phenylindole is a widely used fluo- centrations ranging from NDAPI = 53 × 104 m−3 at 5 m and
25 × 104 m−3 at 60 m (a 52 % reduction) to 12 × 104 m−3
rescent stain for DNA.
2 In fact, we refrain from interpreting N at 325 m (77 % reduction compared to 5 m). The eukaryotic
ARC in great detail in this
work due to the low statistics. Furthermore, the probe ARCH915 cell concentration, NEUK , shows a similarly steep decrease
used here was found to hybridize with some Bacteria, which could in its profile. For bacterial cells, however, we found a less
lead to false-positive signals. We assume that this could have been steep vertical trend with similar concentrations at 5 and 60 m
the case on 1 and 2 March at 60 m sampling height, leading to no (∼ 7.1 × 10⁴ m−3 vs. 6.5 × 10⁴ m−3 ), followed by a 54 %
“unknowns” with respect to DAPI numbers. reduction from 60 to 325 m (∼ 3 × 10⁴ m−3 ). For Archaea,
Biogeosciences, 18, 4873–4887, 2021 https://doi.org/10.5194/bg-18-4873-2021M. Prass et al.: Bioaerosols in the Amazon rain forest 4879
Table 2. Bioaerosol number concentrations at different heights (avg ± SD; n = 5–6, samples for ∼ 23 h at each height) on the domain level
(Archaea, Bacteria, and Eukarya) obtained by FISH. In addition, overall bioaerosol concentrations obtained by DAPI staining. The last
column shows the fraction of cells that could be assigned to one of the domains by FISH in relation to the DAPI-derived concentration.
height Archaea Bacteria Eukarya DAPI Fraction
(× 104 m−3 ) (× 104 m−3 ) (× 104 m−3 ) (× 104 m−3 ) probe/DAPI
5m 0.25 ± 0.38 7.0 ± 2.1 38 ± 15 53 ± 21 0.86
60 m 1.3 ± 1.2 6.5 ± 2.5 14 ± 3.3 25 ± 10 0.85
325 m 0.10 ± 0.21 3.0 ± 1.3 3.5 ± 1.2 12 ± 4.6 0.61
Figure 2. Time series of aerosol number concentrations and complementary aerosol and meteorological data at 60 m height, observed over 6 d
during the wet season 2018. From top to bottom: (i) meteorological data including incoming solar radiation (SWin , grey shaded), precipitation
rates (P , blue curve and bars), and wind vectors (red arrows), (ii) contour plots displaying total aerosol number size distributions obtained
by a scanning mobility particle sizer (0.01 to 0.4 µm) and an optical particle sizer (0.5 to 10 µm), (iii) bioaerosol number concentrations at
the domain level from FISH and DAPI staining (markers as mean and error bars as 1 standard deviation) with shaded areas as filter sampling
periods (each approx. 23 h), and (iv) pie charts showing daily bioaerosol mixture based on number concentrations at the domain level.
https://doi.org/10.5194/bg-18-4873-2021 Biogeosciences, 18, 4873–4887, 20214880 M. Prass et al.: Bioaerosols in the Amazon rain forest
Figure 3. Height profiles of aerosol number concentrations observed at 5, 60, and 325 m above ground at the ATTO-tower. The median
concentrations of all daily samples are displayed as vertical box and whisker plots with 25 and 75 quartiles as boxes and 10 and 90 percentiles
as whiskers. Daily median values are shown as markers according to the legend. Bioaerosols were quantified with FISH and DAPI staining.
The total aerosol number concentration at 60 m was determined by an optical particle sizer (OPS) in the corresponding size range.
Table 3. Mean diel aerosol number concentrations at 60 m height DNA concentrations are sparse and typically based on pho-
obtained by an optical particle sizer (OPS) and by bioaerosol stain- tometric DNA quantification after extraction from aerosol fil-
ing with DAPI (avg ± SD). The fraction of DAPI-stained particles ters. We obtained average airborne DNA mass concentrations
in relation to total aerosol numbers in the same size range provides of 11.9 ng m−3 at 5 m, 4.5 ng m−3 at 60 m, and 1.2 ng m−3 at
an estimation of presumably intact cells vs. degraded biological ma- 325 m (Table S2). In general, these results are comparable
terial.
to studies conducted at an urban site yielding 7 ng m−3 (De-
Sample OPS DAPI Fraction
sprés et al., 2007), a boreal forest yielding 8.60±11.1 ng m−3
(× 10−4 m−3 ) (× 10−4 m−3 ) DAPI/OPS
(Helin et al., 2017), and the tropical region of Singapore
yielding 0.69 to 6.9 ng m−3 (Gusareva et al., 2019). The
Day 1 36 ± 13 26 ± 15 0.72 Amazonian DNA concentrations presented here can be con-
Day 2 37 ± 9.7 16 ± 8.2 0.42 sidered as a lower limit. Our data suggest that the Amazonian
Day 3 34 ± 5.9 24 ± 7.7 0.71 air microbiome hosts larger quantities of DNA mass concen-
Day 4 39 ± 14 20 ± 8.0 0.52
tration than reported for other ecosystems before.
Day 5 30 ± 10 27 ± 9.4 0.88
Day 6 48 ± 9.1 38 ± 14 0.80
The clear difference in the NEUK vs. NBAC profile struc-
tures might be due to different distributions of the organism
Avg (1–6) 37 ± 10 25 ± 10 0.67 sources inside and below the canopy space (i.e., biofilms on
leaves according to Morris et al., 1997, vs. pronounced fun-
gal spore emission at the ground according to Elbert et al.,
the highest concentrations were found at 60 m, although the 2007, and Löbs et al., 2020). Another reason might be the dif-
low concentrations and counting statistics do not allow ro- ferent sedimentation velocities and thus airborne residence
bust conclusions on the vertical profile of this organism class. times due to widely different particle mass. Further, please
All concentrations are summarized in Table 2. As an addi- note that the fraction of unclassified particles increased sub-
tional aspect, we also calculated airborne DNA mass concen- stantially towards 325 m, which may be related to enhanced
trations based on the aforementioned FISH number concen- cell aging due to radiation and/or atmospheric oxidation upon
trations in combination with typical mean genome sizes of upward transport. Typical cloud base heights in the central
fungi, Bacteria, and Archaea3 . Such results on atmospheric Amazon range between 500 and 1500 m (Oliver Lauer, per-
sonal communication, 2020), which is substantially higher
3 With the chosen approach, this quantification exclusively ac- than the 325 m sampling height used here. Still, the measured
counts for intracellular DNA and omits the fraction of extracellular values for NEUK , NBAC , NARC , and NDAPI at 325 m can serve
DNA.
Biogeosciences, 18, 4873–4887, 2021 https://doi.org/10.5194/bg-18-4873-2021M. Prass et al.: Bioaerosols in the Amazon rain forest 4881 Figure 4. Microscopic images of fluorescence signals after DNA staining with DAPI (blue) and FISH (eukaryotes in orange and bacteria in red). Bioaerosol samples were collected at 5 m height. Except for one bacterial bioaerosol in (c), all other fluorescent bioaerosol signals in these panels were attributed to the eukaryotic domain. as a solid upper limit estimate for cell concentrations being itive signal but overall low fluorescent intensity of the spore convectively lifted to cloud base. This estimate may be of on the left side in Fig. 4c). Here, the manual microscopic in- value for cloud microphysical process studies in combina- spection is of advantage as parameters such as particle size, tion with Amazonian IN observations and parameterizations morphology, surface structure, and fluorescent color can be (e.g., Prenni et al., 2009; Schrod et al., 2020). considered beyond fluorescence intensity to discriminate bi- Finally, the microscopic visualization of cells after stain- ological from non-biological and potentially autofluorescent ing also provides qualitative insights into the Amazonian particles. In terms of counting statistics, the manual enu- bioaerosol population, which is a strength of the FISH ap- meration can be beneficial as particles yielding two or more proach. Figure 4 shows selected examples of bioaerosols typ- DAPI stained cores can be identified as a single bioaerosol as ically found at 5 m height at the ATTO site. Most of the shown in the form of an ascospore (white arrows) in Fig. 4d. bioaerosols visualized in Fig. 4 belong to the eukaryotic do- Additionally, the microscopic identification of the Ama- main. Some of them could also be identified as spores based zonian bioaerosol population can provide insights into the on morphological criteria (Gregory, 1973; Lacey and West, bioaerosol mixing and vertical dispersion, which is an im- 2007). Figure 4a further illustrates the importance of a care- portant aspect of the Amazonian bioaerosol cycling (Pöschl ful fixation and permeabilization prior to hybridization to et al., 2010). Figure 5 shows typical fluorescence images af- enable the entrance of the FISH probe into the cells. Here, ter DAPI and FISH staining obtained from the three differ- bioaerosol that are most likely fern spores according to their ent sampling heights. Figure 5g and h show an example of typical spike-like surface structure as shown in Lacey and a cell agglomerate comprising multiple eukaryotic and bac- West (2007) emit nearly no orange fluorescence, indicating terial cells. In the course of the microscopic analysis, Ar- a lack of hybridized eukaryotic probe due to insufficient cell chaea were found as single particles only. Fungal spores were lysis. In comparison, the ascospore in Fig. 4b shows intense found occasionally in physical association with bacteria (as orange fluorescence as a sign of successful hybridization. shown in Fig. 5g and h) or with other fungal spores. The vast However, signal intensities may vary also due to different majority of cells, however, was observed as separated cells, rRNA contents as a matter of metabolic activity (e.g., pos- which suggests that under the given wet season conditions https://doi.org/10.5194/bg-18-4873-2021 Biogeosciences, 18, 4873–4887, 2021
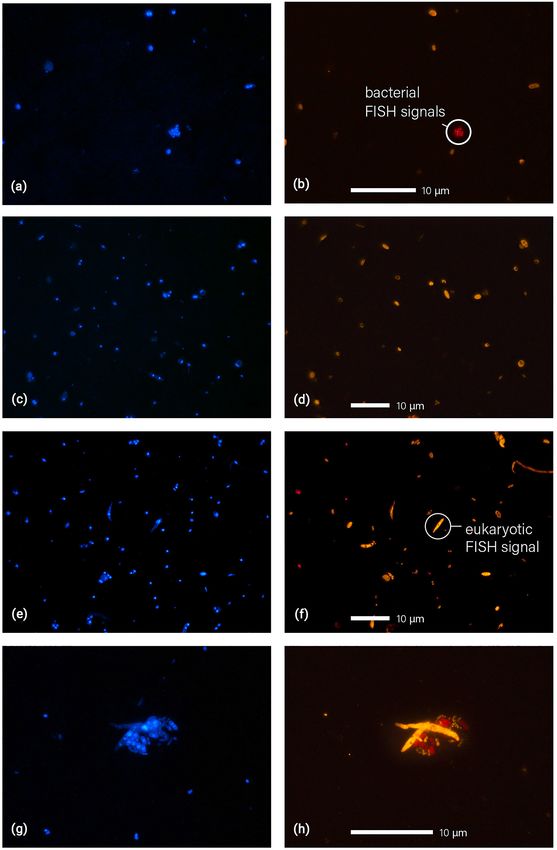
4882                                                                             M. Prass et al.: Bioaerosols in the Amazon rain forest

Figure 5. Microscopic images of fluorescence signals after DNA staining with DAPI (a, c, e, g, blue) and FISH (b, d, f, h, eukaryotes in
orange and bacteria in red). Filter samples displayed here were collected at 325 m (a, b), 60 m (c, d), and 5 m (e, f, g, h). Particle agglomerates,
as shown in (g) and (h), were found rather rarely. The agglomerate here shows a cluster of fungal spores and bacterial cells.

Biogeosciences, 18, 4873–4887, 2021                                                               https://doi.org/10.5194/bg-18-4873-2021
M. Prass et al.: Bioaerosols in the Amazon rain forest                                                                         4883

the bioaerosol components are largely externally mixed. An-       may be attributed to different source locations in and below
other (qualitative) observation worth noting is a decrease in     the canopy and/or differences in aerodynamic mobility of the
average cell size with height (i.e., more larger particles with   cells upon vertical transport. Overall, the results of this study
> 2 µm at 5 and 60 m relative to 325 m). Several of the large     extend the knowledge on the life cycle of the Amazonian
cells could be identified as fungal and fern spores based on      aerosols and provide a solid experimental basis for model in-
morphological criteria. An enrichment of larger particles at      vestigations of bioaerosol-related processes, such as the role
the lower heights is likely a result of the high abundance        of biological ice nuclei or giant cloud condensation nuclei in
sources within and under the canopy in combination with           cloud microphysics and potential bio-precipitation cycling.
higher sedimentation tendency and lower atmospheric res-             Pronounced diurnal patterns with a maximum of coarse
idence times of large particles. The decreasing size with         mode particle abundance during the night represent a char-
height corresponds well to the increasing fraction of bacte-      acteristic feature of Amazonian aerosol cycling (Fig. 2). The
rial cells which are typically smaller than eukaryotic cells. A   current study demonstrates that a dedicated FISH analysis
systematic retrieval of bioaerosol number size distributions      with separated day vs. night sampling promises to resolve
from the FISH micrographs to investigate such trends in de-       and quantify the organism classes that constitute the diur-
tail, however, is rather challenging and thus will be subject     nal pattern. This further relates to the open question on the
of a follow-up study.                                             main meteorological drivers for bioaerosol emissions in the
                                                                  rain forest ecosystem. For this purpose, a broader statisti-
                                                                  cal basis of FISH results and comparisons with bioaerosol
4   Conclusions and outlook                                       analysis techniques (such as next generation sequencing or
                                                                  quantitative polymerase chain reaction) along with meteoro-
Our study showed that FISH has analytical potential in            logical observations are needed. Essential for microphysical
bioaerosol analysis. It combines bioaerosol identification,       bioaerosol analyses is a retrieval of the number size distri-
quantification, and visualization and thus provides insights      butions from the DAPI and FISH data sets. Fluxes of spe-
into the concentration levels and spatiotemporal variability      cific organism classes from the forest could potentially be
of specific and clearly defined organism groups within the        determined with a dedicated FISH sampling during periods
bioaerosol population. Besides airborne abundances, only a        of strong convection. In addition, the wet season character-
little is known about single particle properties such as iden-    ization presented here requires a complementary dry sea-
tity, mixture, or size. Here, we propose FISH to be an inter-     son sampling to resolve potential seasonal differences in the
esting tool to complement the methods currently established       bioaerosol abundance and mixture. Finally, the taxonomic
for environmental bioaerosol analysis (Sect. S1.4). As this is    resolution of this study operates exclusively on the domain
the first study using FISH for Amazonian bioaerosol analy-        level. Future studies should use the analytical potential of
sis, we applied three broad taxonomic probes to obtain a first    FISH by targeting organism classes on lower taxonomic lev-
overview on the domain level before exploring the bioaerosol      els (e.g., theoretically down to species level) in combination
population at a higher taxonomic resolution. The Amazo-           with sequencing-based techniques. This is of particular in-
nian bioaerosols were investigated on the domain level by         terest in terms of differences in IN activity influencing the
quantifying eukaryotic, bacterial, and archaeal cells, as well    formation of clouds. In the bigger picture, we envision that
as the overall concentrations of airborne cells as a func-        dedicated FISH studies may be conducted in close relation
tion of time and height within and above the forest canopy.       to cloud microphysical process studies. Targeted bioaerosol
These bioaerosol abundances are characteristic for natural        characterizations during periods of climate extremes, such
and clean background aerosol conditions as during the ana-        as El-Niño-related droughts in the Amazon, would be of
lyzed sampling period local emissions from the primary rain       great importance to study the response and resilience of the
forest dominated. Eukarya (29 %–72 %) and Bacteria (13 %–         bioaerosol population in the Amazon under warmer and pre-
26 %) dominated the bioaerosol population and variability,        sumably drier climatic conditions in the future.
whereas Archaea (0.5 %–5 %) played numerically only a mi-
nor role. On average ∼ 70 % of the coarse mode particles
(i.e., 0.7–10 µm) were attributed to presumably intact cells,     Data availability. All essential results from FISH and DAPI stain-
whereas the remaining ∼ 30 % can be regarded as an upper          ing are provided in the main text and the tables in the Supplement.
limit estimate for biological fragments and degenerated bio-      Online ATTO data can be found in the ATTO data portal under
logical material in this size fraction under the given condi-     https://www.attodata.org/ (ATTO, 2020) with data ID 130 for the
                                                                  OPS measurements and data ID 202 for meteorological data. For
tions. The bioaerosol concentrations decreased substantially
                                                                  data requests beyond the available data, please refer to the corre-
with height with ∼ 2 times less Bacteria and even ∼ 10 times
                                                                  sponding authors.
less Eukaryotes at 325 m than under the canopy. This em-
phasizes the importance of the sampling height as a vari-
able for bioaerosol observations in the Amazon. The different
shapes of the bacterial vs. eukaryotic concentration profiles

https://doi.org/10.5194/bg-18-4873-2021                                                   Biogeosciences, 18, 4873–4887, 2021
4884 M. Prass et al.: Bioaerosols in the Amazon rain forest
Supplement. The supplement related to this article is available on- Federal Ministry of Education and Research (BMBF contract nos.
line at: https://doi.org/10.5194/bg-18-4873-2021-supplement. 01LB1001A and 01LK1602B), the Brazilian Ministério da Ciência,
Tecnologia e Inovação (MCTI/FINEP contract 01.11.01248.00),
the Amazonas State University (UEA), FAPEAM, LBA/INPA, and
Author contributions. MP and CP developed the research and the SDS/CEUC/RDS Uatumã.
experiments. MP conducted the sampling, the sample analysis, and
manuscript preparation with contributions from all co-authors. FD, The article processing charges for this open-access
LAK, MAF, and ACdA supported the sample collection, data ac- publication were covered by the Max Planck Society.
quisition at the ATTO site, and online data analysis. IHdA, JW, and
JDF supported the laboratory filter analysis and microscopic visu-
alization. BMF provided advice and guidance for the adaptation of Review statement. This paper was edited by Tina Treude and re-
FISH protocols for bioaerosol analysis. DW and TK developed data viewed by Boris Vinatzer and two anonymous referees.
analysis routines. MOA, JK, BW, PA, and ET provided valuable
ideas to the data analysis and interpretation. WE contributed to the
literature research and comparison with earlier studies. CP and UP
supervised the work. All the authors contributed to the interpreta- References
tion of the results and writing of the paper.
Amann, R. and Fuchs, B. M.: Single-cell identification in micro-
bial communities by improved fluorescence in situ hybridization
techniques, Nat. Rev. Microbiol., 6, 339–348, 2008.
Competing interests. The authors declare that they have no conflict
Amann, R. I., Krumholz, L., and Stahl, D. A.: Fluorescent-
of interest.
oligonucleotide probing of whole cells for determinative, phylo-
genetic, and environmental studies in microbiology, J. Bacteriol.,
172, 762–770, 1990.
Disclaimer. This paper contains results of research conducted Andreae, M. O.: Aerosols before pollution, Science, 315, 50–51,
under the technical and scientific cooperation agreement between https://doi.org/10.1126/science.1136529, 2007.
the National Institute for Amazonian Research, the Amazonas State Andreae, M. O. and Crutzen, P. J.: Atmospheric aerosols: Biogeo-
University, and the Max-Planck-Gesellschaft e.V.; the opinions chemical sources and role in atmospheric chemistry, Science,
expressed are the entire responsibility of the authors and not of the 276, 1052–1058, 1997.
participating institutions. Andreae, M. O., Acevedo, O. C., Araùjo, A., Artaxo, P., Barbosa, C.
G. G., Barbosa, H. M. J., Brito, J., Carbone, S., Chi, X., Cintra,
Publisher’s note: Copernicus Publications remains neutral with B. B. L., da Silva, N. F., Dias, N. L., Dias-Júnior, C. Q., Ditas, F.,
regard to jurisdictional claims in published maps and institutional Ditz, R., Godoi, A. F. L., Godoi, R. H. M., Heimann, M., Hoff-
affiliations. mann, T., Kesselmeier, J., Könemann, T., Krüger, M. L., Lavric,
J. V., Manzi, A. O., Lopes, A. P., Martins, D. L., Mikhailov, E.
F., Moran-Zuloaga, D., Nelson, B. W., Nölscher, A. C., Santos
Acknowledgements. We would like to thank Reiner Ditz, Nogueira, D., Piedade, M. T. F., Pöhlker, C., Pöschl, U., Que-
Stefan Wolff, Susan Trumbore, Alberto Quesada, Her- sada, C. A., Rizzo, L. V., Ro, C.-U., Ruckteschler, N., Sá, L. D.
mes Braga Xavier, Andrew Crozier, Nagib Alberto de Castro Souza, A., de Oliveira Sá, M., Sales, C. B., dos Santos, R. M. N., Sat-
Thiago de Lima Xavier, Thomas Disper, Josué Ferreira de Souza, urno, J., Schöngart, J., Sörgel, M., de Souza, C. M., de Souza,
Feliciano de Souza Coelho, Antonio Huxley Melo Nascimento, R. A. F., Su, H., Targhetta, N., Tóta, J., Trebs, I., Trumbore,
André Luiz Matos, Elton Mendes da Silva, Björn Nillius, An- S., van Eijck, A., Walter, D., Wang, Z., Weber, B., Williams,
tonio Ocimar Manzi, Roberta Pereira de Souza, Wallace Ra- J., Winderlich, J., Wittmann, F., Wolff, S., and Yáñez-Serrano,
belo Costa Amauri Rodriguês Perreira, Steffen Schmidt, A. M.: The Amazon Tall Tower Observatory (ATTO): overview
Uwe Schulz, Bruno Takeshi, and Adir Vasconcelos Brandão of pilot measurements on ecosystem ecology, meteorology, trace
for technical, logistical, and scientific support within the ATTO gases, and aerosols, Atmos. Chem. Phys., 15, 10723–10776,
project. We thank Annemarie Zahn and Dominic Jack for graphical https://doi.org/10.5194/acp-15-10723-2015, 2015.
support with figure design. We thank especially Jörg Wulf, Artaxo, P., Hansson, H. C., Andreae, M. O., Bäck, J., Alves, E. G.,
Andreas Ellrott, Stefan Thiele, Jan Brüwer, and Rudolf Amann for Barbosa, H. M. J., Bender, F., Bourtsoukidis, E., Carbone, S.,
substantial scientific and technical support with the FISH analysis. Chi, J., Decesari, S., Després, V. R., Ditas, F., Ezhova, E., Fuzzi,
Moreover, we thank Viviane Després, Janine Fröhlich-Nowoisky, S., Hasselquist, N. J., Heintzenberg, J., Holanda, B. A., Guenther,
Cybelli Barbosa, Ricardo Godoi, Thomas Behrendt, Anna Kunert, A., Hakola, H., Heikkinen, L., Kerminen, V. M., Kontkanen, J.,
Ovid Krüger, Oliver Lauer, Bruna A. Holanda, Matthias Sörgel, Krejci, R., Kulmala, M., Lavric, J. V., de Leeuw, G., Lehtipalo,
and Luiz A. T. Machado for scientific support and stimulating K., Machado, L. A. T., McFiggans, G., Franco, M. A. M., Mohr,
discussions. C., Morgan, W., Nilsson, M. B., Peichl, M., Petäjä, T., Praß, M.,
Pöhlker, C., Pöhlker, M. L., Pöschl, U., Von Randow, C., Riip-
inen, I., Rinne, J., Rizzo, L. V., Rosenfeld, D., Assunção Faus da
Financial support. This research work has been supported by the Silva Dias, M., Sogacheva, L., Stier, P., Swietlicki, E., Sörgel, M.,
Max Planck Society (MPG), the Max Planck Graduate Center with Tunved, P., Virkkula, A., Wang, J., Weber, B., Yáñez-Serrano,
the Johannes Gutenberg University Mainz (MPGC), the German A. M., and Zieger, P., Eugene Mikhailov, E., Smith, J. N., and
Biogeosciences, 18, 4873–4887, 2021 https://doi.org/10.5194/bg-18-4873-2021M. Prass et al.: Bioaerosols in the Amazon rain forest 4885 Kesselmeier, J.: Tropical and boreal forests – Atmosphere inter- Glöckner, F. O., Fuchs, B. M., and Amann, R.: Bacterioplankton actions, a review, under revision, 2021. compositions of lakes and oceans: a first comparison based on ATTO (Amazon Tall Tower Observatory): Data portal, available at: fluorescence in situ hybridization, Appl. Environ. Microbiol., 65, https://www.attodata.org/ (last access: 16 July 2021), 2020. 3721–3726, 1999. Bonan, G. B.: Forests and climate change: forcings, feedbacks, and Graham, B., Guyon, P., Maenhaut, W., Taylor, P. E., Ebert, M., the climate benefits of forests, Science, 320, 1444–1449, 2008. Matthias-Maser, S., Mayol-Bracero, O. L., Godoi, R. H. M., Burrows, S. M., Butler, T., Jöckel, P., Tost, H., Kerkweg, A., Artaxo, P., Meixner, F. X., Moura, M. A. L., Rocha, C., Pöschl, U., and Lawrence, M. G.: Bacteria in the global at- Van Grieken, R., Glovsky, M. M., Flagan, R. C., and An- mosphere – Part 2: Modeling of emissions and transport be- dreae, M. O.: Composition and diurnal variability of the nat- tween different ecosystems, Atmos. Chem. Phys., 9, 9281–9297, ural Amazonian aerosol, J. Geophys. Res.-Atmos., 108, 4765, https://doi.org/10.5194/acp-9-9281-2009, 2009a. https://doi.org/10.1029/2003jd004049, 2003a. Burrows, S. M., Elbert, W., Lawrence, M. G., and Pöschl, U.: Bac- Graham, B., Guyon, P., Taylor, P. E., Artaxo, P., Maenhaut, W., teria in the global atmosphere – Part 1: Review and synthesis of Glovsky, M. M., Flagan, R. C., and Andreae, M. O.: Organic literature data for different ecosystems, Atmos. Chem. Phys., 9, compounds present in the natural Amazonian aerosol: Character- 9263–9280, https://doi.org/10.5194/acp-9-9263-2009, 2009b. ization by gas chromatography-mass spectrometry, J. Geophys. Christensen, H., Hansen, M., and Sørensen, J.: Counting and size Res.-Atmos., 108, 4766, https://doi.org/10.1029/2003jd003990, classification of active soil bacteria by fluorescence in situ hy- 2003b. bridization with an rRNA oligonucleotide probe, Appl. Environ. Gregory, P. H.: The Microbiology of the Atmosphere, Wiley, New Microb., 65, 1753–1761, 1999. York, 1973. Daims, H., Brühl, A., Amann, R., Schleifer, K.-H., and Wagner, Gusareva, E. S., Acerbi, E., Lau, K. J., Luhung, I., Premkrishnan, B. M.: The Domain-specific Probe EUB338 is Insufficient for the N., Kolundžija, S., Purbojati, R. W., Wong, A., Houghton, J. N., Detection of all Bacteria: Development and Evaluation of a more and Miller, D.: Microbial communities in the tropical air ecosys- Comprehensive Probe Set, Syst. Appl. Microbiol., 22, 434–444, tem follow a precise diel cycle, P. Natl. Acad. Sci. USA, 116, https://doi.org/10.1016/S0723-2020(99)80053-8, 1999. 23299–23308, 2019. Delort, A.-M., Vaïtilingom, M., Amato, P., Sancelme, M., Parazols, Hamilton, D. S., Lee, L. A., Pringle, K. J., Reddington, C. L., M., Mailhot, G., Laj, P., and Deguillaume, L.: A short overview Spracklen, D. V., and Carslaw, K. S.: Occurrence of pristine of the microbial population in clouds: potential roles in atmo- aerosol environments on a polluted planet, P. Natl. Acad. Sci. spheric chemistry and nucleation processes, Atmos. Res., 98, USA, 111, 18466–18471, 2014. 249–260, 2010. Harrison, R. M., Jones, A. M., Biggins, P. D. E., Pomeroy, N., Després, V. R., Nowoisky, J. F., Klose, M., Conrad, R., Andreae, M. Cox, C. S., Kidd, S. P., Hobman, J. L., Brown, N. L., and O., and Pöschl, U.: Characterization of primary biogenic aerosol Beswick, A.: Climate factors influencing bacterial count in particles in urban, rural, and high-alpine air by DNA sequence background air samples, Int. J. Biometeorol., 49, 167–178, and restriction fragment analysis of ribosomal RNA genes, Bio- https://doi.org/10.1007/s00484-004-0225-3, 2005. geosciences, 4, 1127–1141, https://doi.org/10.5194/bg-4-1127- Helin, A., Sietiö, O. M., Heinonsalo, J., Bäck, J., Riekkola, M. L., 2007, 2007. and Parshintsev, J.: Characterization of free amino acids, bacteria Després, V. R., Huffman, J. A., Burrows, S. M., Hoose, C., Safa- and fungi in size-segregated atmospheric aerosols in boreal for- tov, A. S., Buryak, G., Fröhlich-Nowoisky, J., Elbert, W., An- est: seasonal patterns, abundances and size distributions, Atmos. dreae, M. O., Pöschl, U., and Jaenicke, R.: Primary biological Chem. Phys., 17, 13089–13101, https://doi.org/10.5194/acp-17- aerosol particles in the atmosphere: a review, Tellus B, 64, 1–58, 13089-2017, 2017. https://doi.org/10.3402/tellusb.v64i0.15598, 2012. Huffman, J. A., Sinha, B., Garland, R. M., Snee-Pollmann, A., Elbert, W., Taylor, P. E., Andreae, M. O., and Pöschl, U.: Contribu- Gunthe, S. S., Artaxo, P., Martin, S. T., Andreae, M. O., and tion of fungi to primary biogenic aerosols in the atmosphere: wet Pöschl, U.: Size distributions and temporal variations of bio- and dry discharged spores, carbohydrates, and inorganic ions, At- logical aerosol particles in the Amazon rainforest characterized mos. Chem. Phys., 7, 4569–4588, https://doi.org/10.5194/acp-7- by microscopy and real-time UV-APS fluorescence techniques 4569-2007, 2007. during AMAZE-08, Atmos. Chem. Phys., 12, 11997–12019, Fröhlich-Nowoisky, J., Kampf, C. J., Weber, B., Huffman, J. A., https://doi.org/10.5194/acp-12-11997-2012, 2012. Pöhlker, C., Andreae, M. O., Lang-Yona, N., Burrows, S. M., Huffman, J. A., Prenni, A. J., DeMott, P. J., Pöhlker, C., Ma- Gunthe, S. S., Elbert, W., Su, H., Hoor, P., Thines, E., Hoffmann, son, R. H., Robinson, N. H., Fröhlich-Nowoisky, J., Tobo, Y., T., Després, V. R., and Pöschl, U.: Bioaerosols in the earth sys- Després, V. R., Garcia, E., Gochis, D. J., Harris, E., Müller- tem: climate, health, and ecosystem interactions, Atmos. Res., Germann, I., Ruzene, C., Schmer, B., Sinha, B., Day, D. A., An- 182, 346–376, 2016. dreae, M. O., Jimenez, J. L., Gallagher, M., Kreidenweis, S. M., Fuchs, B., Pernthaler, J., and Amann, R.: Single cell identification Bertram, A. K., and Pöschl, U.: High concentrations of biolog- by fluorescence in situ hybridization, Methods for General and ical aerosol particles and ice nuclei during and after rain, At- Molecular Microbiology, 3, 886–896, 2007. mos. Chem. Phys., 13, 6151–6164, https://doi.org/10.5194/acp- Glöckner, F. O., Amann, R., Alfreider, A., Pernthaler, J., Psen- 13-6151-2013, 2013. ner, R., Trebesius, K., and Schleifer, K.-H.: An in situ Jaenicke, R.: Abundance of cellular material and pro- hybridization protocol for detection and identification of teins in the atmosphere, Science, 308, 73–73, planktonic bacteria, Syst. Appl. Microbiol., 19, 403–406, https://doi.org/10.1126/science.1106335, 2005. https://doi.org/10.1016/S0723-2020(96)80069-5, 1996. https://doi.org/10.5194/bg-18-4873-2021 Biogeosciences, 18, 4873–4887, 2021
You can also read