Patterns of woodboring beetle activity following fires and bark beetle outbreaks in montane forests of California, USA
←
→
Page content transcription
If your browser does not render page correctly, please read the page content below
Ray et al. Fire Ecology    (2019) 15:21
https://doi.org/10.1186/s42408-019-0040-1
                                                                                                                                                   Fire Ecology

 ORIGINAL RESEARCH                                                                                                                               Open Access

Patterns of woodboring beetle activity
following fires and bark beetle outbreaks
in montane forests of California, USA
Chris Ray1* , Daniel R. Cluck2, Robert L. Wilkerson1, Rodney B. Siegel1, Angela M. White3, Gina L. Tarbill3,
Sarah C. Sawyer4 and Christine A. Howell5

  Abstract
  Background: Increasingly frequent and severe drought in the western United States has contributed to more
  frequent and severe wildfires, longer fire seasons, and more frequent bark beetle outbreaks that kill large
  numbers of trees. Climate change is expected to perpetuate these trends, especially in montane ecosystems,
  calling for improved strategies for managing Western forests and conserving the wildlife that they support.
  Woodboring beetles (e.g., Buprestidae and Cerambycidae) colonize dead and weakened trees and speed
  succession of habitats altered by fire or bark beetles, while serving as prey for some early-seral habitat
  specialists, including several woodpecker species. To understand how these ecologically important beetles
  respond to different sources of tree mortality, we sampled woodborers in 16 sites affected by wildfire or bark
  beetle outbreak in the previous one to eight years. Study sites were located in the Sierra Nevada, Modoc
  Plateau, Warner Mountains, and southern Cascades of California, USA. We used generalized linear mixed
  models to evaluate hypotheses concerning the response of woodboring beetles to disturbance type, severity,
  and timing; forest stand composition and structure; and tree characteristics.
  Results: Woodborer activity was often similar in burned and bark beetle outbreak sites, tempered by localized
  responses to bark beetle activity, burn severity, tree characteristics, and apparent response to ignition date.
  Larval woodborer activity was inversely related to bark beetle sign within a sampling quadrat, was higher on
  pines, and—in burned sites—was higher on the south-facing sides of smaller trees. Adults—especially
  buprestids—were more abundant where burn severity was higher. Fires with intermediate ignition dates
  during the study period supported higher rates of larval woodborer activity and higher numbers of adult
  buprestids as well as cerambycids in the genus Monochamus Dejean 1821.
  Conclusions: Woodboring beetle abundance was related to bark beetle activity, burn severity, tree
  characteristics, and ignition date. Considering these patterns when managing disturbed forest stands could
  yield improved outcomes for wildlife, including species that prey on woodboring beetles. We also reported
  preliminary evidence that the current trend toward more frequent wildfires might not stimulate larger
  woodboring beetle populations if those fires increasingly occur outside the historical fire season.
  Keywords: Buprestidae, burn severity, Cerambycidae, fire season, forest management, Scolytinae, snags,
  succession, wildfire, woodborers

* Correspondence: cray@birdpop.org
1
 The Institute for Bird Populations, P.O. Box 1346, Point Reyes Station,
California 94956, USA
Full list of author information is available at the end of the article

                                         © This is a U.S. Government work and not under copyright protection in the US; foreign copyright protection may apply. 2019
                                         Open Access This article is distributed under the terms of the Creative Commons Attribution 4.0 International License (http://
                                         creativecommons.org/licenses/by/4.0/), which permits unrestricted use, distribution, and reproduction in any medium, provided
                                         you give appropriate credit to the original author(s) and the source, provide a link to the Creative Commons license, and
                                         indicate if changes were made.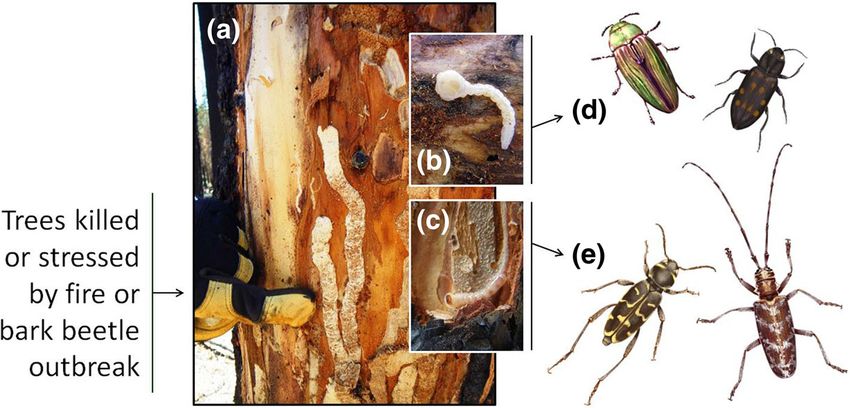
Ray et al. Fire Ecology   (2019) 15:21                                                                               Page 2 of 20

  Resumen
  Antecedentes: El aumento frecuente y severo de sequías en el oeste de los EEUU ha contribuido a
  incrementar la frecuencia y severidad de los incendios forestales, el alargamiento de la temporada de estos
  y el incremento de brotes de escarabajos descortezadores que matan un gran número de árboles. Se
  espera que el cambio climático perpetúe estas tendencias, especialmente en ecosistemas montañosos, lo
  que llama a mejorar las estrategias para el manejo de los bosques del oeste de los EEUU y conservar la
  vida silvestre que estos sostienen. Los escarabajos barrenadores (i.e., Buprestidae y Cerambycidae) colonizan
  árboles muertos y débiles y aceleran la sucesión secundaria en hábitats alterados por fuego o por
  escarabajos descortezadores; al mismo tiempo, sirven de presa para algunos especialistas que actúan
  durante las etapas tempranas de la sucesión, incluyendo diferentes especies de pájaros carpinteros. Para
  entender ecológicamente cómo los escarabajos barrenadores responden a las diferentes causas de
  mortalidad de árboles, estos fueron muestreados en 16 sitios afectados en 16 sitios afectados por incendios
  o por brotes de escarabajos descortezadores ocurridos de uno a ocho años antes. Los sitios de estudio se
  ubicaron en la Sierra Nevada, en el Plateau Modoc, en las montañas Warner y las Cascadas del Sur de
  California, EEUU. Se usaron modelos mixtos lineales generalizados para evaluar las hipótesis concernientes a
  la Respuesta de los escarabajos barrenadores al tipo de disturbio, severidad, tiempo de ocurrencia, la
  composición del rodal y su estructura, y las características de los árboles.
  Resultados: La actividad de los barrenadores fue frecuentemente similar en áreas quemadas y en sitios que
  presentaron brotes de escarabajos descortezadores, y atemperada por respuestas localizadas por la actividad de
  escarabajos descortezadores, la severidad de los incendios, las características de los árboles, y la aparente respuesta a la
  fecha de ignición. La actividad de las larvas de barrenadores presento una relación inversa a la presencia de
  escarabajos descortezadores dentro de un cuadrante de muestreo; esta relación fue más alta en pinos y en los lados
  con orientación sur de árboles pequeños en los sitios quemados. Los adultos de la familia Buprestidae fueron más
  abundantes donde la severidad del incendio fue mayor. Los incendios con fechas de ignición intermedias durante el
  período de estudio mantuvieron mayores tasas de actividad larval de barrenadores y mayores números de bupréstidos
  adultos como así también de cerambícidos del género Monochamus Dejean 1821.
  Conclusiones: La abundancia de los escarabajos barrenadores estuvo relacionada con la actividad de
  escarabajos descortezdores, la severidad del incendio, las características de los árboles, y la fecha de ignición.
  Considerar estos patrones cuando se manejan rodales perturbados puede beneficiar a la vida silvestre;
  incluyendo a aquellas especies que presan sobre escarabajos barrenadores. Así mismo, reportamos evidencia
  preliminar que la tendencia actual hacia incendios forestales más frecuentes podría no estimular mayores
  poblaciones de escarabajos barrenadores si estos incendios forestales ocurren de manera incremental fuera
  del lapso histórico de la temporado de estos.

Abbreviations                                                     VRP: variable radius plot

AIC: Akaike’s information criterion                               Background
BA: basal area                                                    Forests in the western United States have entered a
BBO: bark beetle outbreak                                         period of intensifying disturbance. Drought years have
BUPR: buprestids                                                  become increasingly common and severe, and projected
CERA: cerambycids                                                 changes in precipitation are expected to exacerbate these
CWHR: California Wildlife Habitat Relationships                   trends (Seager et al. 2007; Diffenbaugh et al. 2015). Se-
DBH: diameter at breast height                                    vere drought and increasing temperatures leave forests
DOY: day of year                                                  drier and more susceptible to bark beetle (Coleoptera:
EPN: Eastside Pine (forest)                                       Scolytinae) outbreaks triggered by the lower resistance
MECO: Melanophila consputa                                        of drought-stressed trees (Bentz et al. 2010; Williams et
MONO: Monochamus species                                          al. 2013; Kolb et al. 2016; Marini et al. 2017). The fre-
RdNBR: Relative differenced Normalized Burn Ratio                 quency and area of large fires (Littell et al. 2009; Denni-
SE: standard error                                                son et al. 2014), as well as fire-season length (Westerling
SMC: Sierran Mixed Conifer (forest)                               et al. 2006; Westerling 2016), have increased in recent
QAIC: quasi-AIC (see AIC)                                         decades across the western US, where forest fires are
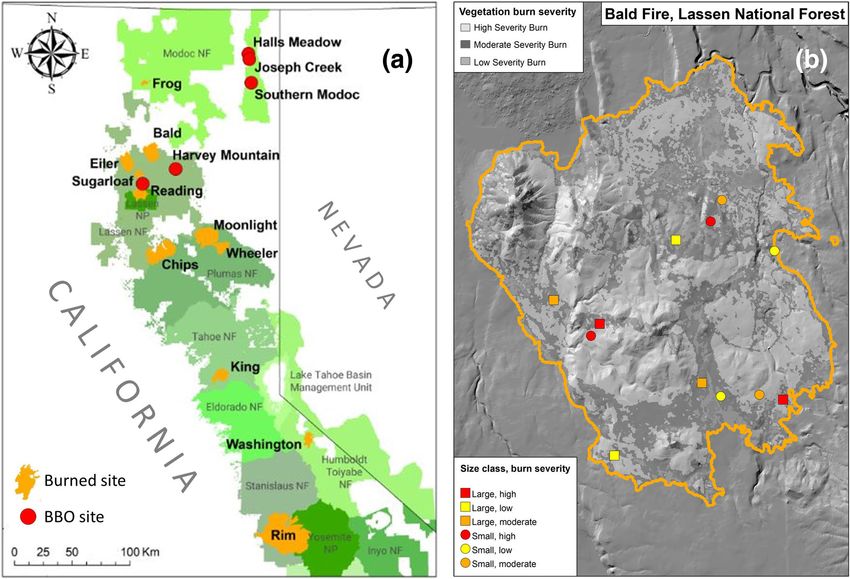
Ray et al. Fire Ecology    (2019) 15:21                                                                                                Page 3 of 20

expected to become more common in response to pre-                          disjunct, and there is some evidence of competition for
dicted changes in climate, especially in montane forests                    phloem between species within trees (Coulson et al. 1976;
(Abatzoglou and Williams 2016). Larger and more se-                         Foelker et al. 2018), as well as some evidence that woodbor-
vere wildfires have been facilitated by increased forest                    ing larvae consume bark beetle larvae (Dodds et al. 2001).
density, fuel loading, and the loss of forest heterogeneity                 Larval woodborers feed within the cambium layer during
resulting from fire exclusion (Miller et al. 2009a; Taylor                  early development (Fig. 1) and later tunnel into sapwood
et al. 2014; Boisramé et al. 2016). Over the next two de-                   and heartwood. Their tunneling introduces fungi that re-
cades, as many as 11 states in the western US might see                     duce the economic value of harvested timber but also facili-
the average annual area burned increase by 500 percent                      tate the decomposition of dead wood, recycling nutrients
(Kitzberger et al. 2017), and temperature-driven models                     and reducing fuel loads (Harrington 1993; Lowell and
indicate that there is potential for extensive bark beetle                  Cahill 1996). The life cycle of both cerambycid and bupres-
outbreaks in forests of the western US throughout this                      tid beetles is dominated by the larval stage, which typically
century (Raffa et al. 2008; Bentz et al. 2010). The increase                lasts one year but can extend to several years (Kariyanna et
in tree mortality resulting from these large and frequent                   al. 2017). Adults emerge and fly during the warmer months,
disturbances is expected to provide abundant habitat for                    seeking out recently dead or weakened trees. Most wood-
woodboring beetles that typically colonize trees killed or                  borers are unable to attack healthy trees and are more often
weakened by other agents (Cranshaw et al. 2000). Many                       attracted to trees that release chemical signals of stress
woodboring beetles aid decomposition and nutrient recyc-                    (Ikeda et al. 1980; Kelsey and Joseph 2003; Miller 2006).
ling in disturbed forest stands (Jacobsen et al. 2015; Kahl                 Some woodborers locate burned trees by sensing heat or
et al. 2017). Understanding how woodborers respond to                       smoke (Schmitz et al. 1997; Schütz et al. 1999; Álvarez et
different types of forest disturbance and stand characteris-                al. 2015). Females deposit eggs in bark crevices, under bark
tics will be important for predicting the response of forest                scales, or in small niches cut into the bark, and have been
communities to changes in the disturbance regime.                           observed to avoid oviposition where bark beetle activity is
   Woodboring beetle families Cerambycidae and Bupresti-                    high (Gardiner 1957).
dae contain hundreds of species, many of which are com-                        Research on woodboring beetles has concentrated pri-
mon and widespread throughout coniferous forests of the                     marily on native species that cause damage to wood
western US. As reviewed in Furniss and Carolin (1977),                      products (Álvarez et al. 2015) or exotic and invasive spe-
most woodboring beetles are considered secondary forest                     cies that disrupt entire ecosystems (Aukema et al. 2010;
pests because they generally colonize trees already killed or               Aukema et al. 2011). Much less is known about how na-
weakened by disturbance, including wildfire, blowdown,                      tive woodboring beetles colonize and use trees damaged
timber harvest activities, and outbreaks of primary forest                  by fire and primary bark beetles, and how woodborers
pests such as “primary” bark beetles that can kill healthy                  respond to the timing and severity of disturbance, forest
trees. In trees colonized by bark beetles, the spatial distribu-            composition and structure, host tree attributes, and in-
tion of woodborer and bark beetle larvae is sometimes                       terspecific competition (Costello et al. 2011; Costello

 Fig. 1 Galleries of woodboring beetle larvae exposed in a bark sample (a). Flat-headed woodborers (b) are the larvae of buprestid or jewel beetle
 adults (d), and round-headed woodborers (c) are the larvae of cerambycid or longhorn beetle adults (e). Buprestid species shown (d) are Cypriacis
 aurulenta (left) and Melanophila consputa (right). Cerambycid species shown (e) are Xylotrechus longitarsus (left) and Monochamus obtusus (right).
 Photos (a, b, and c) by D.R. Cluck. Illustrations (d and e) by Lauren Helton
Ray et al. Fire Ecology     (2019) 15:21                                                                                                   Page 4 of 20

2013; Brin and Bouget 2018). Given the observed poten-                        the activity (abundance) of both larval and adult wood-
tial for ecological and economic impacts of many wood-                        borers, under the simplifying assumption that processes
borer species, characterizing these responses could                           affecting one life stage should result in similar effects on
inform management of disturbed forests. Management                            the subsequent stage or generation. However, we con-
of post-disturbance forests often involves multiple objec-                    ducted separate analyses of larvae and several adult taxa
tives, such as recovering the economic value of dead                          to differentiate responses by stage and taxon. Our results
trees (Eklund et al. 2009), mitigating hazards associated                     represent the first characterization of woodborer re-
with disturbance, facilitating reforestation (Collins and                     sponse to disturbance type and stand conditions across
Roller 2013; Bohlman et al. 2016), reducing fuel levels                       multiple forests in California.
and the risk of type conversion (Coppoletta et al. 2016),
and providing a diversity of wildlife habitats (White et al.
2015). Achieving these objectives might be facilitated by                     Methods
manipulating woodborer impacts on woody fuel decom-                           Site selection
position, nutrient cycling, and succession, as well as in-                    During the summers of 2015 and 2016, we sampled 11
creasing the availability of woodboring larvae as prey for                    burned sites and five bark beetle outbreak (BBO) sites in
early-seral habitat specialists. For example, the black-                      the greater Sierra Nevada region of California, USA
backed woodpecker (Picoides arcticus Swainson, 1832) is                       (Fig. 2), including the physiographic Sierra Nevada,
a species of management interest (Saracco et al. 2011;                        Modoc Plateau, Warner Mountains, and southern Cas-
Siegel et al. 2018) that feeds primarily on the larvae of                     cades. Sierran Mixed Conifer (SMC) and Eastside Pine
woodboring beetles (Villard and Beninger 1993; Murphy                         (EPN) (California Department of Fish and Game 2005)
and Lehnhausen 1998). Relative to bark beetles, wood-                         forests were selected for sampling due to their common
borer larvae are larger and provide a more concentrated                       occurrence in the study region, and variety of constitu-
prey resource (Powell 2000).                                                  ent tree species. SMC forests typically consist of white
   To inform forest management strategies designed to                         fir (Abies concolor [Gordon and Glendinning] Lindley ex
maintain processes dependent on woodborers, we char-                          Hildebrand), Douglas-fir (Pseudotsuga menziesii [Mirb]
acterized woodborer activity in 16 sites representing 11                      Franco), ponderosa pine (Pinus ponderosa Douglas ex
wildfires and five bark beetle outbreaks. We tested sev-                      C.Lawson), sugar pine (Pinus lambertiana Douglas),
eral hypotheses (Table 1) regarding important controls                        incense-cedar (Calocedras decurrens [Torrey] Florin),
on woodborer activity, based on our own experiences in                        and California black oak (Quercus kelloggii Newb). EPN
the field as well as previous research on these species                       forests consist of ponderosa pine with less representa-
(e.g., Costello et al. 2011; Costello 2013). In general, our                  tion by Jeffrey pine (Pinus jeffreyi A.Murray bis), lodge-
hypotheses address processes that we expected to affect                       pole pine (Pinus contorta Douglas ex Loudon), white fir,

Table 1 Non-exclusive, alternative hypotheses (HA) regarding processes expected to affect the activity (abundance) of larval or adult
woodboring beetles that colonize trees killed or weakened by wildfire or bark beetle outbreak (BBO). These hypotheses were
addressed with respect to five BBO sites and 11 burned sites that were sampled in the greater Sierra Nevada region of California,
USA, during the summers of 2015 and 2016
HA Process
T   Type of disturbance: Woodborer activity is higher in burned than BBO stands because heat and smoke attract some woodborer taxa and
    because fire can create a pulse of resources (dead and weakened trees) not previously exploited by bark beetles.
M   Magnitude of disturbance: Woodborer activity is higher where dead trees are more abundant, due to the attractiveness of a large resource
    base.
S   Severity of disturbance: Woodborer activity is higher in stands burned at higher severity because more severe fires produce more smoke and
    heat as well as more dead and dying trees. Outbreak severity also affects woodborer activity, through positive effects on resource production
    and negative effects of increased interspecific competition.
A   Age of disturbance: Woodborer activity eventually declines with time after a disturbance, as the resource is depleted. Conversely, the activity of
    larval woodborers increases within the first year or two after a disturbance, as eggs continue to be deposited and larvae grow.
P   Phenology: Woodborer activity is lower in stands that ignite early or late in the fire season, if most adults disperse during the middle of the fire
    season when ignitions are most frequent.
H   Host quality: Woodborer activity varies by tree taxon due to taxon-specific differences in the quality of trees as a host resource.
G   Growth rate: Woodborer activity is higher on the southern sides of smaller snags (standing dead trees) in locations where diurnal warming can
    facilitate larval growth.
C   Competition: At scales appropriate to each life stage, woodborer activity varies inversely with bark beetle activity, due to adult host preferences
    and larval competition for phloem.
Ray et al. Fire Ecology (2019) 15:21 Page 5 of 20 Fig. 2 Study sites (a) previously burned by wildfire (n = 11) or attacked by bark beetles (n = 5) were sampled during the summers of 2015 and 2016 in national forests (NF) throughout California’s Sierra Nevada, Modoc Plateau, Warner Mountains, and California Cascades, USA. The Reading area included a burned site and an unburned bark beetle outbreak (BBO) site. A typical sampling design is shown for the Bald Fire site (b), in which 12 transects (of three plots each) were distributed in a stratified random design to sample two stands of larger trees and two stands of smaller trees within each of three levels of burn severity (Table 1). Darker gray shading indicates topographic relief (b), including lower (darker) and higher (lighter) elevations, while lighter gray shading indicates burn severity within the fire boundary (see legend) incense-cedar, Douglas-fir, California black oak, and post-disturbance logging had occurred; and to include western juniper (Juniperus occidentalis Hooker). only areas (e) within targeted forest types (SMC or We selected sampling sites non-randomly, based on EPN), and within either (f ) mapped wildfire boundaries, specific criteria and logistical concerns. All sites were se- or (g) areas with a high density of trees (>50 ha−1) killed lected prior to 2016, before large bark beetle outbreaks by bark beetles in the year prior to BBO site surveys. became evident in the southern Sierra Nevada. Burned The remaining area was stratified by the dominant (pre- and BBO sites were situated mainly in Plumas, Lassen, disturbance) tree size class (Additional file 1, e). Using and Modoc national forests for easy access by our pri- California Wildlife Habitat Relationships (CWHR) classi- mary field crew, augmented by additional burned sites fications (California Department of Fish and Game within the King, Washington, and Rim fires that were 2005), we focused our study on trees in two size classes: accessible by a secondary field crew (Fig. 2a). Burned class 3 trees (15 to 28 cm in diameter at breast height sites (Table 2) were selected from fires that occurred [DBH]), and classes 4 and 5 trees (>28 cm DBH). throughout the prior decade and that burned enough In burned sites, burn severity was classified as low, forest on national forest land to accommodate 12 sam- moderate, or high (Additional file 1, f ) based on a Rela- pling transects (Fig. 2b). BBO sites (Table 3) were tive differenced Normalized Burn Ratio (RdNBR) calcu- smaller and accommodated fewer transects. lated from pre- and post-fire imagery and calibrated To guide transect placement, we used several spatial using the Composite Burn Index (Miller et al. 2009b; data products (Additional file 1, a through g) to exclude Miller and Quayle 2015). Within each fire’s perimeter, areas (a) on private property, (b) with slopes exceeding transects were positioned randomly among the available 30%, (c) more than 250 m from roads, or d) where levels of our two focal tree size classes and three burn
Ray et al. Fire Ecology           (2019) 15:21                                                                                                Page 6 of 20

Table 2 Characteristics of 11 burned sites sampled in the greater Sierra Nevada region of California, USA, during the summers of
2015 and 2016, including the date on which each wildfire ignited (Ignition date)
                                                                                                               Survey
                                                                               a
Burned site (fire name)                National forest                   Area (ha)          Ignition date      Year        Transects (n)      Elevation (m)
Wheeler                                Plumas                                 9 484            5 Jul 2007      2015             12            1588–1726
Moonlight                              Plumas                                26 509           3 Sep 2007       2015             12            1565–2016
Sugarloaf                              Lassen                                 3 897          1 Aug 2009        2015             11            1225–1590
Readingb                               Lassen                                11 478          23 Jul 2012       2015             12            1659–2003
                                                                                                               2016             12            1669–2162
Chips                                  Plumas and Lassen                     31 210          28 Jul 2012       2016             12            1221–1834
Rim                                    Stanislaus                          104 460          17 Aug 2013        2015             12            1160–2073
Bald                                   Lassen                                16 258          30 Jul 2014       2016             12            1269–1599
Eiler                                  Lassen                                13 624          31 Jul 2014       2015             10            1154–1715
King                                   Eldorado                              39 843          13 Sep 2014       2015             12            1362–2206
Washington                             Humboldt-Toiyabe                       7 444          19 Jul 2015       2016              6            1866–2050
Frog                                   Modoc                                  2 036          30 Jul 2015       2016              6            1340–1358
a
Total area within fire boundary (Additional file 1, g), regardless of jurisdiction
n = 24 separate transects sampled during 2015 and 2016
b

severities; in most cases, 12 transects were positioned in                                 Data collection
order to sample two stands of smaller trees and two                                        We established 159 transects (Tables 2 and 3), each 100 m
stands of larger trees within each available level of burn                                 long and aligned with a cardinal or inter-cardinal azimuth
severity. In some cases, some combinations of size class                                   selected to fall within the defined tree size class and (if ap-
and burn severity were limited or unavailable within a                                     plicable) burn severity polygon. Each transect consisted of
fire boundary, resulting in fewer transects at those sites                                 three plots (n = 477 total). Plot centers were established at
(Table 2).                                                                                 0, 50, and 100 m along each transect.
   BBO sites (Table 3) were dominated by white fir killed                                     Larval activity and adult activity (Table 4) were selected
by fir engraver beetle (Scolytus ventralis LeConte), but                                   as response variables for statistical modeling, and were
also featured ponderosa pine killed by western pine bee-                                   measured at scales appropriate to each life stage. Adult
tle (Dendroctonus brevicomis LeConte) or Jeffrey pine                                      woodborer activity was sampled at the plot scale using
killed by Jeffrey pine beetle (Dendroctonus jeffreyi Hop-                                  unbaited traps to avoid influencing the beetles’ natural dis-
kins). Random transect positions in BBO sites were                                         tribution. Each plot contained one panel trap (Alpha
stratified by tree size class but not by severity of disturb-                              Scents, Inc., West Linn, Oregon, USA), mounted on a
ance because the density of trees killed by bark beetles                                   metal pole near the plot center and positioned at least 2 m
continued to increase unevenly across areas suitable for                                   from any tree. Traps were lubricated with Fluon (AGC
transect placement before our sampling could begin.                                        Chemicals, Exton, Pennsylvania, USA), and each contained
                                                                                           a pest strip in its collection cup. Traps were emptied every
                                                                                           two weeks (mean = 13.98 ± 0.12 days), and remained in
                                                                                           place for nearly eight weeks (52.65 ± 0.39 days) during
Table 3 Characteristics of five bark beetle outbreak sites                                 June through August, the period of peak woodborer flight
sampled in the greater Sierra Nevada region of California, USA,
                                                                                           in the greater Sierra Nevada (D.R. Cluck, USDA Forest
during the summer of 2016
                                                                                           Service, Forest Health Protection, Susanville, California,
                                                     Survey
                                                                                           USA, unpublished data).
BBO site                 National        Areaa       Year Transects        Elevations         Larval woodborer activity (Table 4) was sampled in
                         forest          (ha)             (n)              (m)
                                                                                           bark quadrats on the north and south sides of up to 6
Harvey Mountain          Lassen              1162 2016            4        1967–2046
                                                                                           (5.19 ± 0.09) of the closest snags within 25 m of each
Readingb                 Lassen               795 2016            9        1418–1619       trap or plot center. Bark quadrats were 15 cm × 15 cm
Halls Meadow             Modoc                542 2016            6        1797–1908       and were positioned at breast height (1.37 m) in snags
Joseph Creek             Modoc                403 2016            8        1698–1907       with at least one side suitable for larval sampling (bark
Southern Modoc           Modoc                245 2016            3        1710–2087       attached or sapwood surface intact) (Powell et al. 2002).
a
 Total area of 2015 Aerial Detection Survey polygons per site (see Additional file 1, g)
                                                                                           We placed quadrats in trees of a representative size by
b
 Adjacent to the Reading Fire but unburned                                                 targeting snags 15 to 40 cm DBH where trees were in
Ray et al. Fire Ecology (2019) 15:21 Page 7 of 20
Table 4 Response variable definitions for the two life stages of woodboring beetles analyzed in this study of 11 burned sites and
five bark beetle outbreak sites sampled in the greater Sierra Nevada region of California, USA, during the summers of 2015 and 2016
Response Definition
Larval activity Abundance of larval woodborer sign within a bark sampling quadrat, scored as 0 to 4 based on presence or absence of sign
in each of four sub-quadrats
Adult activity Number of adult woodborers (by taxon) captured per trap-visit within a plot
size class 3, and snags >40 cm DBH where trees were in Data analyses
size classes 4 and 5. Each quarter of each quadrat was We tested our focal hypotheses (Table 1) using an
scored separately for presence (1) or absence (0) of larval information-theoretic approach, fitting a set of alterna-
woodborer activity, including living or dead specimens tive models for each response (Table 4) based on one to
and characteristic frass or boring dust, exit or transit four fixed effects and selected interactions drawn from
holes, or galleries on any part of the quarter-quadrat, in- our list of potential predictor variables (Table 5). Re-
cluding the sapwood surface, bark interior, or (except frass sponse variables measured in burned sites were modeled
or boring dust) bark exterior (Furniss and Carolin 1977). separately from those in BBO sites, to address hypoth-
Larvae collected from quadrats were stored in vials eses regarding the effects of ignition date and burn se-
and identified to family, while adults collected from verity not applicable in unburned sites. Mixed-effects
traps were sealed in plastic bags and identified to spe- multiple regression was used to account for the random
cies, genus, or family using reference collections effects in this system (Table 5), including spatial depend-
(USDA Forest Service, Forest Health Protection, Ref- ence among samples and repeated measures at each
erence Insect Collection, Susanville, California, USA), trap. Larval activity was modeled as a binomial process,
online resources (http://www.mtent.org/projects/wood- and support for each larval model was ranked with re-
boring/index.html), identification keys (Furniss and spect to a null (random effects) model using AICc, an
Carolin 1977, Arnett Jr. et al. 2002, Evans and Hogue information criterion corrected for sample size (Burn-
2006, Schiff et al. 2006, LaBonte et al. 2013a, LaBonte ham and Anderson 2002). Adult activity was modeled as
et al. 2013b), and consultation with Oregon Depart- a Poisson process adjusted for over-dispersion, and each
ment of Agriculture for identification of Melanophila adult model was ranked using QAICc (Burnham and
Eschscholtz 1829 species. Non-target insects captured Anderson 2002). For each numeric predictor variable x,
in traps were generally identified to family. xi (ith value of x) was standardized by subtracting the
Bark quadrats used for sampling larval woodborers mean of x and dividing by the standard deviation of x.
were also used to quantify several tree characteristics Multicollinearity among fixed effects was avoided by
that were targeted as potential predictors of wood- screening predictor variables for high pairwise correla-
borer activity (detailed in Table 5). Each full quadrat tions (Kendall’s tau > 0.5), or by replacing a predictor
was scored for bark condition, char depth (Ryan variable with the residual of its linear regression on a
1982), and bark beetle activity (characteristic pitch correlated predictor (following Graham 2003).
tubes and other taxon-specific signs as listed above We reported the relative support for models using both
for woodboring larvae). Snags sampled via quadrat (a) Δ(Q)AICc = focal model (Q)AICc – minimum (Q)AICc
were also identified to species; measured for DBH, across each candidate model set, and (b) ΔNull = null model
height, char height, and percent needles retained; and (Q)AICc – focal model (Q)AICc. We assumed that
examined for broken top. Δ(Q)AICc > 2 indicated models with lower support than
To quantify predictor variables related to stand the top model, while (by extension) ΔNull > 2 indicated
characteristics (Table 5), we established a variable-radius models with higher support than the null model. We also
plot (VRP) centered on each trap. We used a summarized key data and results using means ± standard
slope-compensating angle gauge to count trees ≥10 cm errors (SE), and adopted α = 0.05 as our threshold for de-
DBH, and estimated stand basal area (m2 ha−1) from termining the significance of P-values. All analyses were
stem counts using a basal area factor of 10 or 20. For conducted using the R environment for statistical comput-
each stem counted within the VRP, we also recorded ing (R Core Team 2016), and mixed-effect models were fit
species and status (live or dead). using package lme4 (Bates et al. 2015).
Predictors related to geographic gradients (Table 5) were
calculated using a digital elevation model (Additional Results
file 1). Elevation was adjusted by 130.1 m per degree of Patterns in potential covariates of woodborer activity
latitude, to account for the declining elevation of tree line We measured 5683 trees (43% of which were snags)
with latitude in California (Brock and Inman 2006; Ting- across our variable-radius plots, including 1683 white
ley and Beissinger 2013). fir, 1268 ponderosa pine, 1265 Jeffrey pine, 568Ray et al. Fire Ecology (2019) 15:21 Page 8 of 20
Table 5 Predictor variable definitions and associated hypotheses (HA from Table 1) regarding woodborer response to disturbance
severity (S), magnitude (M), age (A), and phenology (P), as well as host quality (H) and factors affecting or indicating the potential for
larval growth (G) and interspecific competition (C). Values for each predictor variable in this study were drawn from 11 burned or
five bark beetle outbreak sites sampled in the greater Sierra Nevada region during the summers of 2015 and 2016. RdNBR = Relative
differenced Normalized Burn Ratio, BA = basal area, VRP = variable-radius plot, DOY = day of year, DBH = diameter at breast height,
CWHR = California Wildlife Habitat Relationships
Predictor Definition and unit of measurement HA
a
Bark beetle activity Bark beetle sign (present = 1, absent = 0) within a bark sampling quadrat C
Burn severityb RdNBR class (low, moderate, high) at the transect level S
Char depth Bark char depth class (deep = 3, moderate = 2, light = 1, unburned = 0, bark missing = NA) within a bark sampling S
quadrata
Char height Mean of two measures of maximum height (m) of char on a treea S
Snag BA ratio Snag BA : total BA (unitless) within a VRP S
Snag BA Dead tree basal area (m2 ha−1) within a VRP M,
S
Live tree BA Live tree basal area (m2 ha−1) within a VRP M,
S
Needles retained Percent of needles (estimated in 5% increments) retained on a treea A
Fire age Time (yr) since ignition of a burned site A
Bark condition General condition (tight, loose, missing) of bark within a quadrat A
Broken-top tree Top of tree is broken or missing (true, false)a A
Ignition date DOY of site-level ignition and its nonlinear effect (DOY × DOY) P
Host tree taxon Taxon (yellow pine, true fir, or incense-cedar) of a treea H
Tree sizeb Small (13–28 cm DBH = CWHR size class 3) or large (>28 cm DBH = CWHR size classes 4 and 5) G
DBH Diameter (cm) at breast height of a treea G
a
Height Maximum vertical height (m) of a tree G
Bark aspectb Aspect (northern or southern exposure) of a bark-sampling quadrat G
2
Elevation Latitude-adjusted plot elevation (m) and its nonlinear effect (m ) G
Latitude, longitude Coordinates of plot position (UTM WGS 84) G
b
Year Sampling year for the site
Random effectsb Site, transect, plot, and tree
a
For models of adult woodborer activity, sub-plot data were averaged at the plot level, except bark condition and aspect (not used in adult models) and host tree
taxon (replaced by dominant host tree taxon in each plot).
b
Study design variables
incense-cedar, and several less common taxa. Yellow nearly one third and over two thirds, respectively, of
pines dominated in burned sites and white fir domi- quadrats in burned and BBO sites (Table 6). Covariance
nated in BBO sites (Table 6). Basal area (BA) of all among transect-level metrics of tree size (mean height,
trees (live and dead) calculated at the plot level and aver- BA, and CWHR class) tended to be low but significant
aged at the transect level was significantly higher at BBO (0.07 < Kendall’s tau < 0.26, P < 0.015).
sites, while snag BA was significantly higher at burned Among our potential metrics of burn severity (Table 5,
sites. Tree size class and BA were correlated at the tran- Additional file 2), we found high and significant correla-
sect level (Kendall’s tau = 0.13, P = 0.041), but the mea- tions between RdNBR, char depth, and snag ratios (Ken-
sured size of trees averaged at the transect level did not dall’s tau ≥ 0.516, P < 0.001). However, percent needles
differ between site types (Table 6). retained and bark condition were less correlated with
In the subset of snags sampled for larval activity and RdNBR, and were instead significantly correlated with fire
additional covariates, mean DBH was slightly lower in age (Kendall’s tau ≥ 0.152, P ≤ 0.027). Snag ratios were
burned sites (Table 6), which contained very few snags most highly correlated with RdNBR (Additional file 3).
in the small size class. A similar proportion of trees
were snags, regardless of size class: snag proportion Larval woodborer activity
was 0.50 ± 0.05 in stands of larger trees and 0.49 ± 0.05 We rated larval woodborer activity on 2297 dead trees
in stands of smaller trees. Bark beetle sign was found in in 443 of 477 plots, including 355 plots within burnedRay et al. Fire Ecology (2019) 15:21 Page 9 of 20
Table 6 Comparisons of raw data from 11 burned sites and five bark beetle outbreak sites sampled in the greater Sierra Nevada
region of California, USA, during the summers of 2015 and 2016, summarized by transect as count ratios or mean ± standard error.
BBO = bark beetle outbreak, BA = basal area, DBH = diameter at breast height
Featurea Burned sites BBO sites
Dominant tree taxon (count ratio) Yellow pine (2.71:1) White fir (1.48:1)
BA (m2 ha−1)** 31.69 ± 1.27 39.28 ± 2.59
Snag BA (m2 ha−1)** 14.87 ± 1.31 11.20 ± 1.20
ns
Mean DBH (cm) 46.17 ± 1.22 45.42 ± 1.52
Snag mean DBH (cm)ns 42.38 ± 1.26 44.45 ± 2.27
**
Larval sampling snag DBH (cm) 36.55 ± 1.23 40.54 ± 1.50
Bark beetle presence per quadrat*** 0.61 ± 0.04 1.46 ± 0.05
ns
Larval woodborer activity per quadrat 1.99 ± 0.08 1.74 ± 0.12
Adult buprestids captured (n)ns 1.00 ± 0.12 0.88 ± 0.11
Adult cerambycids captured (n)ns 0.72 ± 0.07 0.90 ± 0.11
a
ns (P > 0.05), * (P < 0.05), **
(P < 0.01), ***
(P < 0.001)
sites and 88 plots within BBO sites; in the remaining 34 present (Fig. 3b). Larval activity was significantly higher
plots, no dead trees were available for sampling. Larvae on smaller trees in burned sites (where small and large
collected were identified as buprestids (n = 158), ceram- trees were sampled equally) but not in BBO sites
bycids (n = 221), bark beetles (n = 223), and a variety of (where there were few small trees available for sam-
less frequent taxa (n = 162). Larval woodborer activity pling) (Fig. 3c). Bark aspect had a significant but minor
(Table 4) was evident mainly from galleries, frass or bor- effect on larval activity after fire, and no significant ef-
ing dust, and exit or transit holes, rather than direct ob- fect in BBO sites (Fig. 3d).
servations of larvae. Although these indirect signs were Model rankings confirmed the support for negative ef-
sufficient for distinguishing larval woodborers from fects of bark beetle activity on larval woodborer activity
other taxa, they were often insufficient for differentiating in both burned and BBO sites. In burned sites (Table 7),
woodborers by family due to intermingled galleries of the top four models of larval activity confirmed support
unrelated taxa and deterioration of the inner bark and for effects of bark beetle activity, host tree taxon, tree
sapwood interface on older snags. Based on these data, size, and bark aspect, as in the often simpler models
the activity per quadrat of all larval woodborers com- used to generate Fig. 3. In the fifth-ranked model, there
bined was similar between burned and BBO sites for was also support for linear and quadratic effects of fire
data summarized at the transect level (Table 6). ignition date, with negative effects suggesting lower lar-
Our null model of larval activity for burned sites included val activity in fires ignited at earlier and (especially) later
nested random effects of site, transect, and tree. We omit- dates during our study period. Support was much higher,
ted plot effects because they explainedRay et al. Fire Ecology (2019) 15:21 Page 10 of 20
Fig. 3 Larval woodborer activity in burned (black) and bark beetle outbreak (BBO; red) sites in relation to host tree taxon (a), bark beetle activity
(b), tree size class at the transect level (c), and aspect of the bark sampling quadrat (d), in the greater Sierra Nevada region of California, USA,
sampled during the summers of 2015 and 2016. Point estimates and error bars represent mean responses and 95% confidence intervals (CIs)
from fits to models exemplified in Tables 7 and 8. Dashed lines connect means that do not differ significantly. Response variables are defined in
Table 4 and predictor variables are defined in Table 5
missing bark was expected, because signs of activity 285 Siricidae, 396 Melandryidae, and 971 Cupedidae.
were sometimes recorded from bark alone. Trees with The most frequently captured buprestids were Cypriacis
broken tops might have suffered damage prior to bark aurulenta Linneaus 1767 (n = 466), Melanophila con-
beetle outbreaks, allowing more time for woodborer sputa LeConte 1857 (n = 200), and Chalcophora anguli-
colonization. Needle loss appeared to represent out- collis LeConte 1857 (n = 193), while Xylotrechus
break age, rather than outbreak severity, as bark bee- longitarsus Casey 1912 (n = 190), Monochamus obtusus
tle activity and needles retained were uncorrelated at Casey 1891 (n = 89), and Ortholeptura valida LeConte
the transect level within BBO sites (Kendall’s tau = 1857 (n = 88) were most frequent among cerambycids
0.085). (Additional file 5). Annual differences in buprestid and
cerambycid captures could be explained by site (Add-
Adult woodborer activity itional file 6). Raw capture numbers were similar in
We identified 10 412 adults belonging to six families: burned and BBO sites for both buprestids and ceramby-
1718 Buprestidae, 1277 Cerambycidae, 5765 Elateridae, cids (Table 6).Ray et al. Fire Ecology (2019) 15:21 Page 11 of 20
Table 7 Fixed effects and associated hypotheses (HA from burned stands supported strong positive effects of
Table 5) in top models of larval woodborer activity across 11 latitude-adjusted elevation (Table 10) that were not sup-
burned sites sampled in the greater Sierra Nevada region of ported by buprestids (Table 9), and Monochamus Dejean
California, USA, during the summers of 2015 and 2016. 1821 species supported strong effects of burn severity
AICc = Akaike’s information criterion, corrected for small sample but were more common in stands burned at low to
size; DOY = day of year; Neg = negative; Pos = positive
moderate severity (Table 10), in contrast with buprestid
Model rank Predictor Effecta ΔAICc ΔNull HA
Melanophila consputa (Table 9).
***
1 Bark beetle activity Neg 0.00 115.86 C Across multiple buprestid and cerambycid taxa, we
Host tree taxon = pine Pos*** H found support for negative linear and quadratic effects
2 Host tree taxon = pine Pos ***
14.93 100.93 H of ignition date as well a negative effect of fire age and a
Host tree taxon = fir Posns H positive interaction between fire age and the quadratic
ns effect of ignition date. Buprestid data also repeatedly
Host tree taxon = cedar Pos H
supported the burn severity hypothesis.
3 Host tree size-class = small Pos*** 51.69 64.17 G
For buprestid captures in BBO sites (Table 11), the top
Bark aspect = south Pos*** G model included a negative effect of live tree BA, suggest-
Fire age Pos ns A ing support for disturbance magnitude and severity hy-
Bark aspect × Fire age Neg ***
G, A potheses. All other models of buprestid and cerambycid
4 Bark aspect = south Pos*** 71.91 43.95 G adults in BBO sites had much lower relative support and
suggested that processes related to habitat quality, larval
Longitude Pos*** G
growth, and competition explained adult activity.
Elevation Pos ns G
*
5 Ignition date (DOY) Neg 107.41 8.45 P Comparison of larval and adult activity within fires
DOY × DOY Neg** P We compared fire site effects on larval activity and adult
Fire age Pos ns
A captures by adding a fixed effect of site to null models of
DOY × DOY × Fire age Pos ns P, A larval activity or adult captures. In no case did this effect
a
ns (P > 0.05), * (P < 0.05), **
(P < 0.01), ***
(P < 0.001)
of site differ in direction between models of larval activ-
ity and adult captures. Both larval activity and adult cap-
Mixed models of adult activity included nested random ef- tures were significantly lower than average in samples
fects of site and transect for burned sites, or a fixed effect of from the King, Moonlight, and Rim fires (Table 12),
site and random effect of transect for BBO sites. Model which all ignited relatively late in the season (Table 1).
rankings confirmed predictive effects of bark beetle activity, At the Washington Fire (1 yr old), larval activity was sig-
tree size, and burn severity (Fig. 4), as well as ignition date nificantly lower than average but adult captures were
(Fig. 5), among others (Tables 9, 10, 11). moderate. At the Wheeler fire (8 yr old), larval activity
Except for negative effects of ignition date and fire was moderate but adult captures were significantly lower
age, top cerambycid models differed from top buprestid than average.
models either in hypotheses supported or direction of ef-
fects. For example, Xylotrechus longitarsus activity in Discussion
In these montane forests of California, the range of
Table 8 Fixed effects and associated hypotheses (HA from woodborer response to forest conditions suggests that
Table 5) in top models of larval woodborer activity across five managing for a diversity of disturbance types and sever-
bark beetle outbreak sites sampled in the greater Sierra Nevada ity will support a diverse woodborer community. The
region of California, USA, during the summers of 2015 and 2016. different taxa and life stages that we sampled appeared
AICc = Akaike’s information criterion, corrected; Neg = negative; to respond in characteristic ways. Buprestid adults were
Pos = positive much more frequent in stands that burned at high sever-
Model rank Predictor Effecta ΔAICc ΔNull HA ity, a pattern especially evident in Melanophila consputa,
1 Bark beetle activity Neg** 0.00 20.22 C which is known for its attraction to heat and smoke
Needles retained Neg*** A (Schmitz et al. 1997; Schütz et al. 1999). In contrast, cer-
2 Needles retained Neg*** 5.37 14.85 A ambycids that sense heat and smoke (Monochamus spp.;
3 Bark condition = tight Neg*** 7.73 12.49 A
Álvarez et al. 2015) were more frequent in transects
burned at low and moderate severity. Larval activity
Bark condition = missing Neg* A
responded more often to features that might represent
**
4 Broken-top tree = true Pos 12.73 7.49 A the capacity for larval growth and development. Disturb-
5 Bark beetle activity Neg** 13.90 6.32 C ance type, however, appeared to have a relatively minor
a
ns (P > 0.05), * (P < 0.05), **
(P < 0.01), ***
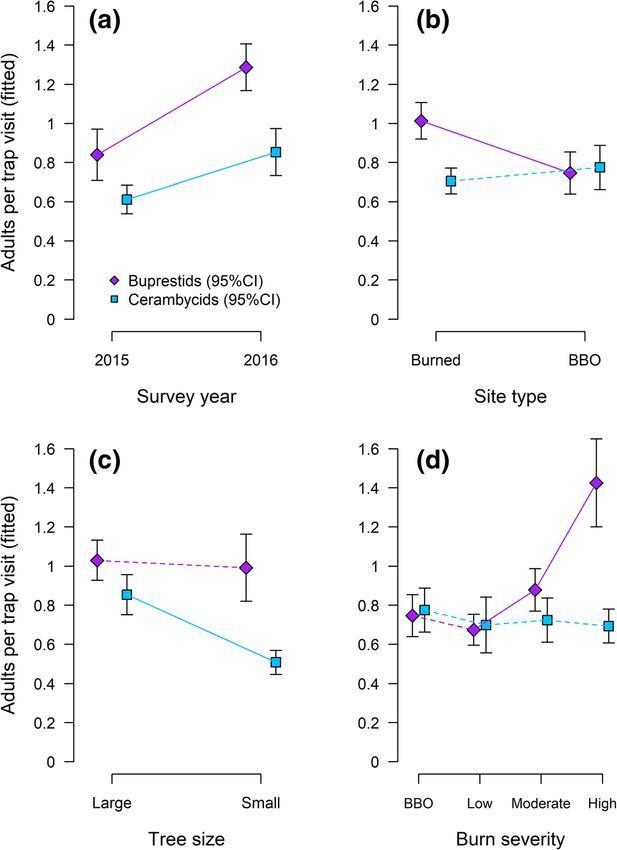
(P < 0.001) influence on the activity of most woodborers in ourRay et al. Fire Ecology (2019) 15:21 Page 12 of 20 Fig. 4 Adult activity in relation to year (a), site disturbance type (b), tree size class (c), and burn severity (d), shown for two families of woodboring beetles on sites in the greater Sierra Nevada region of California, USA, sampled during the summers of 2015 and 2016. In (d), data from unburned, bark beetle outbreak (BBO) sites are compared with data from sites that burned at low, moderate, or high severity according to RdNBR classifications. Point estimates and error bars represent mean responses and 95% confidence intervals (CIs) from fits to models exemplified in Tables 9, 10, 11. Dashed lines connect means that do not differ significantly. Response variables are defined in Table 4 and predictor variables are defined in Table 5 study. Except where burn severity was high, cerambycids strong patterns were revealed in our data that are likely and buprestids of both stages appeared to occur with relevant to many dry coniferous forests that occur similar frequency in burned and BBO sites. throughout the western US. Evidence for these relation- The scale and timing of each analysis should be con- ships should be investigated for generality in other re- sidered when interpreting an appropriate scope of infer- gions, and across a diversity of fire ages and outbreak ence. Burned sites were distributed throughout the sites, to facilitate inferences currently constrained by the Sierra Nevada, while BBO sites were clustered in the naturally high covariance and spatial clustering in values northern half of this region, and disturbance type also of key predictor variables. covaried with disturbance age, because large bark beetle The strong patterns we found, however, can help in- outbreaks had just begun to develop as we initiated the form where—and at what scale—management actions study. We also sampled during a period of extended might be most effectively applied. Within a disturbed drought in our study region, when primary and second- patch of forest, the deliberate retention of pockets or ary forest pests were likely to be responding in complex islands of snags with specific characteristics might limit ways to stress on the forests in this system (Kolb et al. the negative ecological impacts of a reduction in wood- 2016). Regardless of the unique features of this study, borer activity. For example, larval woodborers were
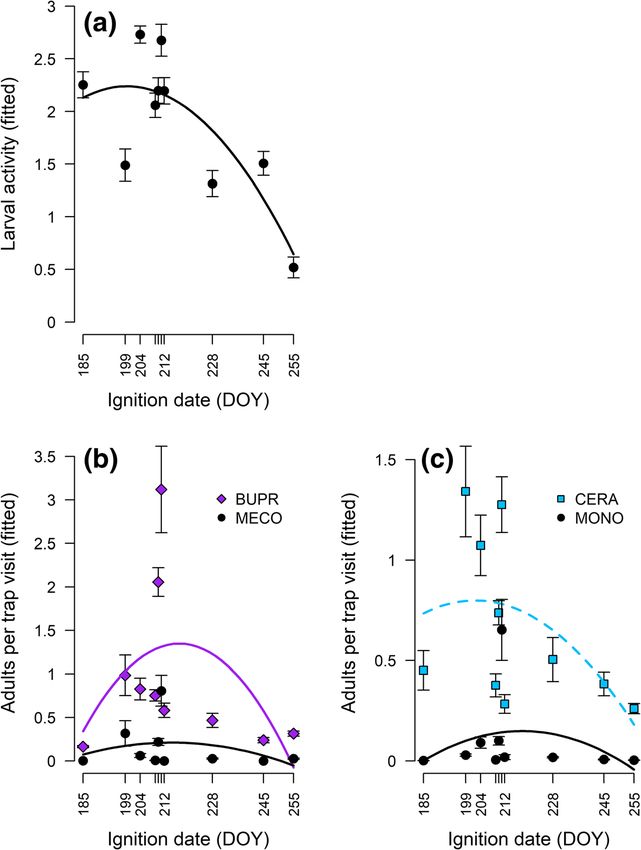
Ray et al. Fire Ecology      (2019) 15:21                                                                                                      Page 13 of 20

 Fig. 5 Activity of larvae (a) and adults (b, c), as defined in Table 4, in relation to fire ignition date (DOY = day of year) at sites in the greater Sierra
 Nevada region of California, USA, sampled during the summers of 2015 and 2016. Curves represent relationships between squared DOY and
 fitted point estimates of woodborer response (±95% confidence interval) obtained from linear mixed effects models that included fixed effects of
 DOY and an interaction between squared DOY and fire age (Tables 7, 9, and 10). BUPR = all buprestids, MECO = Melanophila consputa, CERA = all
 cerambycids, MONO = Monochamus species. Effects of squared DOY were not supported for CERA. Data from 12 surveys (Table 2) are
 represented here by only 10 point estimates in each panel because some fires shared the same ignition date (DOY = 210 for Bald and Frog fires,
 and DOY = 204 for 2015 and 2016 samples from the Reading Fire)

more common in particular quadrats where bark beetles                              The design of post-fire forest management strategies
were absent, suggesting that the local retention of wood-                        often involves balancing multiple economic and ecological
borers might be enhanced by prioritizing retention of                            objectives with clear links to woodborer dynamics. Taken
trees less heavily infested by bark beetles. Our observa-                        together, our results suggest a dynamic process controlling
tions that woodborer larvae were more abundant in                                local initiation and accumulation of woodborer activity
smaller pine snags with more southerly exposure, that                            that likely leads to temporal trends in the faunal commu-
Xylotrechus Chevrolat 1860 adults were more common                               nities supported by woodborer larvae and adults as prey
where the dominant host tree taxon was true fir, and                             and agents of tree decomposition. Beginning with the en-
that Monochamus species were more common where                                   vironment inhabited by larvae, our finding of higher larval
burn severity was low to moderate, can further inform                            activity on smaller trees and southern bark aspects sug-
design of snag retention patches that might effectively                          gests that there are microclimatic effects on larval devel-
promote successional processes and provide prey for                              opment. Smaller-diameter trees have thinner bark and
wildlife species like the black-backed woodpecker (Siegel                        lower thermal mass of sap and heartwood, as well as lower
et al. 2018; Tarbill et al. 2018; Stillman et al. 2019).                         sapwood volume (water holding capacity), leading to more
Ray et al. Fire Ecology       (2019) 15:21                                                                                         Page 14 of 20

Table 9 Fixed effects and associated hypotheses (HA from Table 5) in top models of adult buprestid activity across 11 burned sites
sampled in the greater Sierra Nevada region of California, USA, during the summers of 2015 and 2016. QAICc = quasi-Akaike’s
information criterion, corrected for small sample size; DOY = day of year; Neg = negative; Pos = positive; BA = basal area
Response                             Model rank              Predictor                           Effecta     ΔQAICc        ΔNull         HA
Adult buprestid activity             1                       Ignition date (DOY)                 Negns          0.00       11.96         P
                                                                                                       ***
                                                             DOY × DOY                           Neg                                     P
                                                             Fire age                            Neg***                                  A
                                                                                                    ***
                                                             DOY × DOY × Fire age                Pos                                     P, A
                                     2                       Snag BA                             Pos**          6.17        5.79         M, S
                                                                                                       **
                                                             Fire age                            Neg                                     A
                                                             Snag BA x Fire age                  Posns                                   M, S, A
                                                                                                    ***
                                     3                       Snag BA                             Pos            6.32        5.64         M, S
                                     4                       Char height                         Pos**          7.57        4.39         S
                                                                                                    **
                                     5                       Char height                         Pos            7.66        4.30         S
                                                             Fire age                            Neg**                                   A
                                                             Char height × Fire age              Negns                                   S, A
Adult Cypriacis aurulenta            1                       Host tree taxon = pine              Pos**          0.00        0.39         H
activityb
Adult                                1                       Fire age                            Neg***         0.00       20.19         A
Melanophila consputa                                                                                ns
                                                             Char height                         Pos                                     S
activity
                                                             Live tree BA                        Neg**                                   M, S
                                                                                                       ***
                                                             Ignition date                       Neg                                     P
                                     2                       Fire age                            Neg***         2.33       17.86         A
                                                                                                       ***
                                                             Burn severity = low                 Neg                                     S
                                                             Burn severity = moderate            Neg***                                  S
                                                                                                       *
                                                             Ignition date (DOY)                 Neg                                     P
                                                             DOY × DOY                           Neg*                                    P
                                                                                                       ***
                                     3                       Fire age                            Neg            3.84       16.35         A
                                                             Char height                         Pos***                                  S
                                                             Ignition date (DOY)                 Neg*                                    P
                                                             DOY × DOY                           Neg*                                    P
                                                                                                       ***
                                     4                       Fire age                            Neg            4.46       15.73         A
                                                             Burn severity = low                 Neg***                                  S
                                                             Burn severity = moderate            Neg**                                   S
                                     5                       Live tree BA                        Neg***         7.55       12.64         M, S
a
 ns (P > 0.05), * (P < 0.05), ** (P < 0.01), *** (P < 0.001)
b
 Only one model of adult Cypriacis aurulenta activity was supported relative to the null model

rapid desiccation of phloem tissue (Six et al. 2002; Hayes                         especially cerambycid beetles. Thatcher (1961) reported
et al. 2008). Southern bole aspect would intensify these                           that drought conditions can enable a larger number of
microclimatic conditions, likely creating a more favorable                         cerambycid larvae to survive in systems in which adults
environment for rapid larval development. An inverse re-                           attempt to attack living trees. Subcortical and sapwood
lationship between tree size and larval woodborer activity                         temperatures in trees and logs exposed to sunlight can be
was also noted by Powell (2000) in the northern Rocky                              5 to 30 °C greater than shaded portions, and these warmer
Mountains. Hanks (1999) suggested that phloem-boring                               temperatures can decrease the larval development time of
larvae might be especially vulnerable to moisture condi-                           phloem-feeding woodborers by 1 to 2 yr (Graham 1925,
tions because they are embedded in the tissues of their                            Savely 1939, Hosking 1977; reviewed in Kariyanna et al.
host plant, and sensitivity to bark moisture could account                         2017). Alternatively, these patterns could be related to
for the association between drought stress and host sus-                           adult female selection of oviposition locations, although
ceptibility that is typical for many phloem-boring insects,                        we found no evidence of such selectivity in the literature.
Ray et al. Fire Ecology (2019) 15:21 Page 15 of 20
Table 10 Fixed effects and associated hypotheses (HA from Table 5) in top models of adult cerambycid activity across 11 burned sites
sampled in the greater Sierra Nevada region of California, USA, during the summers of 2015 and 2016. QAICc = quasi-Akaike’s
information criterion, corrected for small sample size; DOY = day of year; Neg = negative; Pos = positive; BA = basal area
Response Model rank Predictor Effecta ΔQAICc ΔNull HA
Adult cerambycid activity 1 Null 0.00 0.00
Adult 1 Fire age Neg** 0.00 4.66 A
Xylotrechus longitarsus activity
Elevation Pos*** G
ns
Ignition date Neg P
2 Elevation Pos*** 0.02 4.64 G
3 Host tree taxon = fir Pos** 0.76 3.90 H
4 Elevation Pos*** 2.04 2.62 G
2 ns
Elevation Pos G
5 Snag BA Pos*** 2.68 1.98 M, S
Adult Monochamus species activity 1 Fire age Neg* 0.00 9.06 A
Burn severity = low Pos** S
***
Burn severity = moderate Pos S
2 Burn severity = low Pos** 1.35 7.71 S
Burn severity = moderate Pos*** S
3 Ignition date (DOY) Negns 1.56 7.50 P
DOY × DOY Negns P
Fire age Neg*** A
***
DOY × DOY × Fire age Pos P, A
4 Needles retained Pos*** 2.64 6.42 A
5 Fire age Neg* 3.16 5.90 A
Burn severity = low Pos** S
***
Burn severity = moderate Pos S
Ignition date (DOY) Negns P
ns
DOY × DOY Neg P
a
ns (P > 0.05), * (P < 0.05), **
(P < 0.01), ***
(P < 0.001)
Table 11 Fixed effects and associated hypotheses (HA from Table 5) in top models of adult buprestid or cerambycid activity across five bark
beetle outbreak sites sampled in the greater Sierra Nevada region of California, USA, during the summer of 2016. QAICc = quasi-Akaike’s
information criterion, corrected for small sample size; BA = basal area; Neg = negative; Pos = positive; DBH = diameter at breast height
Response Model rank Predictor (fixed effects) Effecta ΔQAICc ΔNull HA
***
Adult buprestid activity 1 Live tree BA Neg 0.00 25.85 M, S
2 Bark beetle activity Pos** 20.97 4.88 C
**
3 Elevation Neg 21.20 4.65 G
4 Longitude Neg** 21.97 3.88 G
**
5 Needles retained Pos 22.36 3.49 A
Adult cerambycid activity 1 Host tree taxon = cedar Neg** 0.00 4.02 H
2 Broken-top tree = true Neg** 1.00 3.02 A
3 DBH Neg** 1.38 2.64 G
*
4 Host tree taxon = fir Pos 3.46 0.56 H
5 Null 4.02 0.00
a
ns (P > 0.05), * (P < 0.05), **
(P < 0.01), ***
(P < 0.001)Ray et al. Fire Ecology (2019) 15:21 Page 16 of 20
Table 12 Fixed effects of burned site on larval and adult especially those with foliage completely scorched or
woodborer activity across 11 burned sites sampled in the greater consumed, the phloem resource in fire-killed trees might
Sierra Nevada region of California, USA, during the summers often be more available for woodboring beetle
of 2015 and 2016. Neg = negative; Pos = positive colonization (Parker et al. 2006). In contrast, competi-
Burned site Fire age (yr) Fixed effect on activitya tion with secondary bark beetles, such as Ips De Geer
(fire name)
Larval model Adult model 1775 spp., in fire-killed trees may occur in the upper
Eiler 1 ns Pos** boles and limbs of larger trees and all portions of smaller
Frog 1 ns ns trees. This is especially true for secondary bark beetles
King 1 Neg*** Neg**
attacking thicker-barked tree species such as those sam-
pled in this study. However, Costello (2013) found that
Washington 1 Neg* ns
no bark beetles emerged from fire-killed tree bolts, even
Bald 2 ns Pos* though outbreaks of the mountain pine beetle (Dendroc-
Rim 2 Neg*** Neg* tonus ponderosae Hopkins 1902) were abundant near
**
Reading (2015) 3 Pos ns the fires in that study.
Reading (2016) 4 ns ns Costello (2013) also found significantly more wood-
Chips 4 ns ns
borers emerging from fire-killed trees than from trees
killed by bark beetles, in contrast with our finding of simi-
Sugarloaf 6 ns ns
lar woodborer activity in burned and BBO stands. This
Moonlight 8 Neg* Neg* contrast could reflect a difference in the timing of
Wheeler 8 ns Neg*** post-fire monitoring between their study of fires 1 to 2 yr
a * ** ***
ns (P > 0.05), (P < 0.05), (P < 0.01), (P < 0.001) old and our study of fires 1 to 8 yr old. Furthermore, bark
beetle activity was common in our burned sites, occurring
in over 30% of bark samples. Some snags in older burned
The inverse relationship between bark beetle and lar- sites might have been killed by bark beetles attacking
val woodborer activity that we observed was likely due fire-stressed trees in the years following a burn (Davis et
to competition for phloem resources or other factors af- al. 2012), reducing the distinction between burned and
fecting adult or larval microhabitat partitioning among BBO sites as a food resource for woodboring beetles. Po-
beetle species. Because woodboring beetles typically tential similarities in post-disturbance ecology of burned
colonize dead and dying trees, such as those killed or and BBO sites warrant further investigation.
weakened by bark beetles, the nutrient-rich phloem re- Fire age also helped explain the pattern of adult cap-
source can be greatly reduced by bark beetle activity tures. For all but one taxon modeled in burned sites,
prior to colonization by woodboring beetles, limiting its adult capture numbers declined with fire age, as ex-
availability for larval woodborer development (Coulson pected if older fires were less attractive to dispersing
et al. 1979; Powell 2000). Thus, variation in the availabil- adults or less productive as source habitats for these spe-
ity of phloem for woodboring beetle larvae could depend cies. Data from buprestids (especially M. consputa) and
on the timing of bark beetle attack versus woodborer cerambycids (Monochamus species) also supported a
colonization. For example, the western pine beetle positive interaction between fire age and squared igni-
(Dendroctonus brevicomis Erichson 1836) produces more tion date. Although these species were more common at
than one generation per year (Miller and Keen 1960), burned sites with intermediate ignition dates, those fires
which might allow these bark beetles to attack trees out- did not appear to act as long-term sources of these spe-
side the peak flight period for woodboring beetles. If cies in the landscape. This dynamic process should lead
bark beetles attack trees in the weeks or months before to temporal trends in the faunal communities wood-
woodborer dispersal, the resource might be depleted be- borers support. Indeed, black-backed woodpecker abun-
fore woodborer eggs hatch. If bark beetles attack trees dance in burned forests in California generally peaks
after woodborer dispersal, changes in the resource dur- within five years after fire, followed by sharp declines
ing the ensuing year might combine with resource de- (Tingley et al. 2018).
pletion to make trees unattractive or unsuitable for Our results also suggest that there are competing influ-
some woodboring beetles. Alternatively, tree size can ences of disturbance age. Adult woodborers might cue on
play a role in competition with bark beetles such as the current signs of a snag-producing disturbance, but signs
fir engraver (Scolytus ventralis LeConte 1868), which of larval activity accumulate over time, so we might expect
tends to attack higher on the bole of larger-diameter stronger or opposing effects of disturbance age on adult
trees, leaving the lower portions of the bole available for captures when compared with larval activity. In fact, we
woodboring beetles (Ferrell and Hall 1975). In addition, found a positive effect of fire age on the combined activity
because primary bark beetles avoid fire-killed trees, of larval woodborer species, but negative effects of fire ageYou can also read