Expected Warning Times from the ShakeAlert Earthquake Early Warning System for Earthquakes in the Pacific Northwest - Open-File Report 2021-1026
←
→
Page content transcription
If your browser does not render page correctly, please read the page content below
Expected Warning Times from the ShakeAlert®
Earthquake Early Warning System for Earthquakes
in the Pacific Northwest

Open-File Report 2021–1026

U.S. Department of the Interior
U.S. Geological Survey

Cover. Photograph of a smartphone that has received a ShakeAlert Message. Photograph by Jenda Johnson, Incorporated Research
Institutions for Seismology, used with permission. The seismogram is from downtown Seattle (Pacific Northwest Seismic Network station TKCO)
during the 2001 Nisqually earthquake. It is 40 seconds long and begins at the earthquake origin time. The peak shaking, instrumental Modified
Mercalli Intensity of about 7, occurs at about 26 seconds after origin time. Calculations in this study show that the first ShakeAlert Message would
be published about 11–12 seconds after origin time, which is just before the first seismic waves arrive at this location.
Expected Warning Times from the ShakeAlert®
Earthquake Early Warning System for Earthquakes
in the Pacific Northwest
By Jeffrey J. McGuire, Deborah E. Smith, Arthur D. Frankel, Erin A. Wirth, Sara K. McBride, and
Robert M. de Groot

Open-File Report 2021–1026

U.S. Department of the Interior
U.S. Geological Survey
U.S. Geological Survey, Reston, Virginia: 2021

For more information on the USGS—the Federal source for science about the Earth, its natural and living resources, natural
hazards, and the environment—visit https://www.usgs.gov or call 1–888–ASK–USGS (1–888–275–8747).
For an overview of USGS information products, including maps, imagery, and publications,
visit https://store.usgs.gov.

Any use of trade, firm, or product names is for descriptive purposes only and does not imply endorsement by the
U.S. Government.

Although this information product, for the most part, is in the public domain, it also may contain copyrighted materials
as noted in the text. Permission to reproduce copyrighted items must be secured from the copyright owner.

Suggested citation:
McGuire, J.J., Smith, D.E., Frankel, A.D., Wirth, E.A., McBride, S.K., and de Groot, R.M., 2021, Expected warning
times from the ShakeAlert earthquake early warning system for earthquakes in the Pacific Northwest: U.S. Geological
Survey Open-File Report 2021–1026, 37 p., https://doi.org/10.3133/ofr20211026.

ISSN 2331-1258 (online)
iii

Acknowledgments
      Thanks to Julian Bunn (California Institute of Technology), Andrew Good (California
Institute of Technology), and Minh Huynh (USGS) for extensive efforts to program the warning
time calculations into the ShakeAlert system testing-processing stream. We thank Steve
Hickman (USGS), Joan Gomberg (USGS), Paul Bodin (University of Washington), Jen Andrews
(California Institute of Technology), and Doug Toomey (University of Oregon) for helpful
reviews. We thank Maren Böse (ETH Zurich) for providing the extended FinDer template set
used in the results presented in figures 12–14.

Contents
Acknowledgments.........................................................................................................................................iii
Abstract............................................................................................................................................................1
The ShakeAlert Earthquake Early Warning System..................................................................................1
Earthquake Hazards in the Pacific Northwest...........................................................................................4
Hazard Deaggregation...................................................................................................................................5
Definition of Warning Times..........................................................................................................................7
Warning Times for Shallow Crustal Events................................................................................................8
Warning Times for Deep Instraslab Earthquakes....................................................................................10
Warning Times for Offshore M  7–9 Megathrust Earthquakes...............................................................13
     The Current ShakeAlert Production System...................................................................................14
     The Future ShakeAlert Production System.....................................................................................17
Implications for EEW Users in the Pacific Northwest............................................................................21
     Effects on Protective Actions and the ShakeAlert Warning Message.......................................23
Conclusions...................................................................................................................................................24
References Cited..........................................................................................................................................25
Appendix 1.....................................................................................................................................................29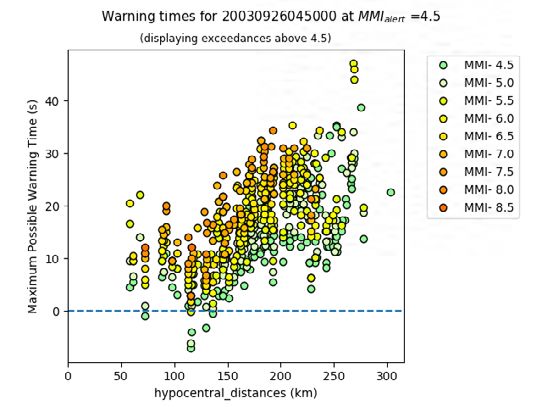
iv
Figures
1. Three-dimensional schematic diagram showing the types of earthquakes in the Pacific
Northwest........................................................................................................................................2
2. Maps and plot showing the variability in the time to alert for the real-time production
ShakeAlert system for magnitude 3.5 or greater earthquakes..............................................3
3. Plots showing the probability of generating a ShakeAlert Message as a function of the
closest distance to the fault..........................................................................................................6
4. Plots showing the performance of the real-time ShakeAlert system during the 2019
magnitudes 6.4 and 7.1 Ridgecrest earthquakes......................................................................9
5. Plots showing the empirical cumulative distribution functions of the warning times for the
seismic stations that observed the 2019 magnitudes 6.4 and 7.1 Ridgecrest earthquakes......10
6. Maps of peak shaking and warning times from ShakeAlert for the 2001 Nisqually
earthquake in Washington.........................................................................................................11
7. Plots showing warning times for the 2001 Nisqually earthquake in Washington.............12
8. Maps of peak shaking and warning times from ShakeAlert for the 2003 Tokachi-Oki
earthquake offshore Hokkaido, Japan.....................................................................................14
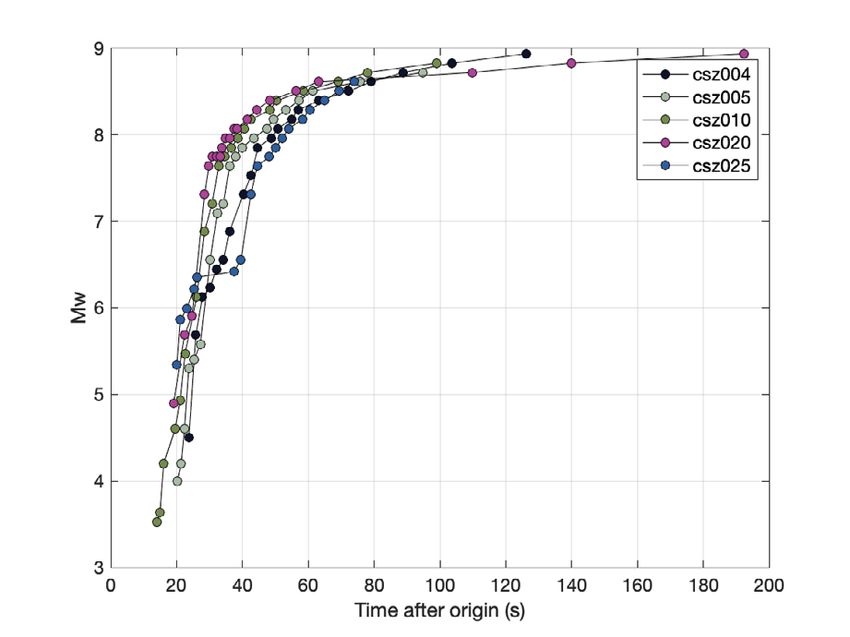
9. Ensemble ShakeMap for 30 magnitude 9 megathrust rupture scenarios on the
Cascadia subduction zone.........................................................................................................15
10. Maps of the western Cascadia region showing the time between the origin of the
earthquake and when locations of ShakeAlert seismic stations reached instrumental
Modified Mercalli Intensity level 4.5 in five magnitude 9 Cascadia earthquake scenarios.....16
11. Maps of the western Cascadia region showing warning times for the simulated csz025
earthquake scenario.....................................................................................................................17
12. Maps of the western Cascadia region showing warning times for five magnitude 9
earthquake scenarios with an alert threshold of 2.5.............................................................18
13. Maps of the western Cascadia region showing warning times for five magnitude 9
earthquake scenarios with an alert threshold of 3.5.............................................................19
14. Maps of the western Cascadia region showing warning times for five magnitude 9
earthquake scenarios with an alert threshold of 4.5.............................................................20
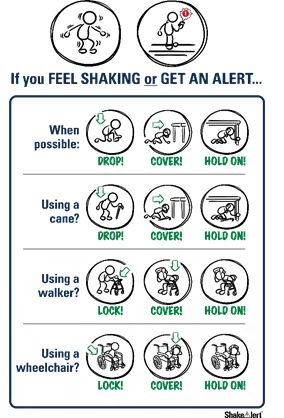
15. Schematic cartoon showing drop, cover, and hold on actions...........................................24
Tables
1. Criteria used by current delivery mechanisms to determine which users will receive
alerts on their cell phones............................................................................................................4
2. Probability of exceeding peak ground acceleration of 0.045g at the indicated return
time for three earthquake types..................................................................................................5
3. Probability of exceeding peak ground acceleration of 0.013g at the indicated return
time for three earthquake types..................................................................................................5
4. Probability of exceeding peak ground acceleration of 0.003g at the indicated return
time for three earthquake types..................................................................................................5
5. Alert history for the 2001 magnitude 6.8 Nisqually and 2019 magnitude 7.1 Anchorage
earthquakes from offline runs of the ShakeAlert production system in summer 2020....11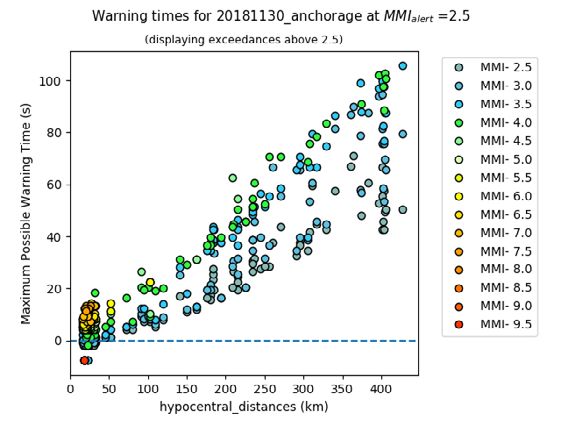
v

Abbreviations
EEW			    earthquake early warning
FEMA			   Federal Emergency Management Agency
g			      gravitational acceleration
IPAWS		   Integrated Public Alert and Warning System
JCCEO		   Joint Committee for Communication, Education, and Outreach
km			     kilometer
M			      magnitude
MMI			    instrumental Modified Mercalli Intensity
NSHM			   National Seismic Hazard Maps
PGA			    peak ground acceleration
USGS			   U.S. Geological Survey
WEA			    Wireless Emergency Alert
Expected Warning Times from the ShakeAlert®
Earthquake Early Warning System for Earthquakes
in the Pacific Northwest
By Jeffrey J. McGuire, Deborah E. Smith, Arthur D. Frankel, Erin A. Wirth, Sara K. McBride, and Robert M. de Groot

Abstract                                                           times of 50–80 seconds possible only for users located at
                                                                   considerable distance from the epicenter. ShakeAlert thus
      The ShakeAlert® earthquake early warning system              requires short, readily understood alerts stating that earthquake
has been live since October 2019 for the testing of public         shaking is imminent and suggesting protective actions users
alerting to mobile devices in California and will soon begin       should take. Extensive education and outreach efforts that
testing this modality in Oregon and Washington. The Pacific        emphasize the need to take actions quickly will be required for
Northwest presents new challenges and opportunities for            ShakeAlert to successfully reduce injuries and losses.
ShakeAlert owing to the different types of earthquakes that
occur in the Cascadia subduction zone. Many locations in the
Pacific Northwest are expected to experience shaking from
shallow crustal earthquakes (similar to those in California),
                                                                   The ShakeAlert Earthquake Early
earthquakes that occur deep within the subducted slab, and         Warning System
large megathrust earthquakes that occur primarily offshore.
The different geometries and maximum magnitudes associated               Earthquake early warning (EEW) systems, first developed
with these types of earthquakes lead to a range of warning         in Mexico and Japan, seek to detect the initial seismic waves
times that are possible between when the initial ShakeAlert        at the beginning of an earthquake and notify users that shaking
Message is issued and when a user experiences strong shaking.      is imminent at their location (see Allen and Melgar, 2019, for a
After an earthquake begins, the strategy of the ShakeAlert         review). The ShakeAlert EEW system has been live for the testing
system for public alerting is to warn people who are located       of public alerting to wireless devices in California since fall of
close enough to the fault that the system estimates they will      2019 and similar testing will begin in Oregon and Washington in
experience at least weak to moderate shaking. By alerting the      2021. Alert delivery to devices that trigger automated actions has
public at these low levels of expected shaking, it is possible     been underway in California, Oregon, and Washington since 2018.
to provide sufficient warning times for some users to take         The system uses a network of more than a thousand seismometers
protective actions before strong shaking begins. In this study,    throughout the West Coast to detect the initial seismic waves from
we present an analysis of past ShakeAlert Messages as well         an earthquake, estimate its magnitude and peak shaking, and issue
as simulations of historical earthquakes and potential future      a ShakeAlert Message as rapidly as possible (Given and others,
Cascadia earthquakes to quantify the range of warning times        2014, 2018; Hartog and others, 2016; Kohler and others, 2018;
that users who experience strong or worse shaking are likely       Chung and others, 2020). More than 60 ShakeAlert technical
to receive. Additional applications for ShakeAlert involve         partners use ShakeAlert Messages issued by the U.S. Geological
initiation of automatic protective actions prior to the onset of   Survey (USGS) to develop and deliver alerts to end users. A key
shaking, such as slowing trains, shutting water supplies, and      need in ensuring the effectiveness of EEW in promoting public
opening firehouse doors, which are beyond the scope of this        safety is understanding how much warning time will be available
paper. Users in the Pacific Northwest should expect that the       and how that varies with different alerting criteria, tectonic
majority of alerts they receive will be from shallow crustal       regimes, and alert delivery mechanisms (Minson and others,
and intraslab earthquakes. In these cases, users will only have    2018; Wald, 2020). All of these factors contribute to determining
a few seconds of warning before strong shaking begins. This        the amount of warning an individual at a particular location will
remains true even during infrequent, offshore great (magnitude     receive from a particular earthquake, which can vary significantly
≥8) megathrust earthquakes, where warning times will               between users. Moreover, educating end users ahead of time
generally range from seconds to tens of seconds, depending         about the range of possible warning times will be key for ensuring
on the user’s location and the intensity of predicted shaking      that appropriate protective and (or) automated actions are taken
that a user chooses to be alerted for, with the longest warning    (McBride and others, 2020).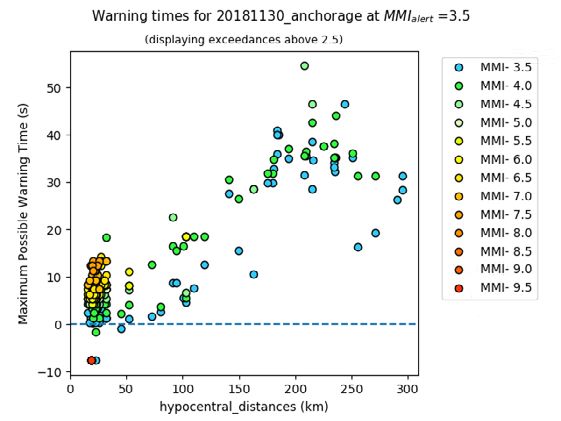
2   Expected Warning Times from the ShakeAlert Earthquake Early Warning System

      For every earthquake, there is a zone near the epicenter                    there is a higher potential for long warning times than there is for
where there is no warning time before shaking is felt because                     smaller earthquakes. The goal of this study is to help ShakeAlert
it takes time, often just seconds, for the ShakeAlert system                      technical providers, emergency managers, end users, and others to
to detect the shaking and issue the first ShakeAlert Message.                     understand the range of possible warning times based on the types
Moreover, individual end users will receive different amounts                     of earthquake sources that occur in the Pacific Northwest to inform
of warning time for different earthquakes that they are likely to                 the most effective protective actions.
experience. In the Pacific Northwest, the Cascadia subduction                           Given these complexities and based on experiences during
zone produces three primary classes of earthquakes: shallow                       past earthquakes, EEW messaging strategies must be thoughtfully
crustal, deep intraslab, and offshore plate boundary megathrust                   constructed to reduce injuries and consider human behavior,
ruptures (fig. 1). Each of these presents a different scenario for                injury patterns, and message interpretation in order to spur
EEW because of the timing, intensity, and spatial extent of the                   immediate protective action. Earthquake-related injuries most
shaking that they produce. One key feature of earthquakes is that                 frequently occur when people are attempting to move during and
although they start at a point, the rupture takes time to spread                  immediately after shaking (Peek-Asa and others, 2003; Johnston
out over the fault. Large magnitude 8–9 earthquakes can rupture                   and others, 2014; McBride and others, 2019; Horspool and others,
hundreds of kilometers along a major fault and this takes tens of                 2020). In the Pacific Northwest, although severe injuries were
seconds to minutes to occur. Thus, for the largest of earthquakes,                reported during the 2001 Nisqually, Washington, earthquake

                                                              Prince Rupert

                                                                                                                          North
                                                                                                                         American
                                                                                                                          Plate

                                                         CA                                                                CANADA
                                                              SC
                                                                   AD
                                                                        IA
                                                                             SU
                                                                                  BD
                                                                                       UC
                                                                                            TI                                     Vancouver
                                                                                                 ON
                                                                                                                    Victoria
                                                                                                      ZO
                                                                                                           N
                                                                                                                         Seattle
                                                                                                           E

                     Pacific                              Juan de
                                                                                                                          Fault           Seattle
                      Plate                              Fuca Plate
                                                                                                               Shallow crustal
                                                                                                                earthquakes                    WASHINGTON
                                                                                                                               Portland          OREGON

                                                                         Plate interface
                                                                          earthquakes

                                                                                                                                           Intraslab
                                                                                                                                          earthquakes
                      Mantle upwelling

        Figure 1. Three-dimensional schematic diagram showing the types of earthquakes in the Pacific Northwest: shallow crustal
        earthquakes, deep intraslab earthquakes, and offshore plate interface (megathrust) earthquakes. The oceanic Juan de Fuca Plate
        (shown in gray) subducts beneath the North American Plate. From Given and others (2018), reproduced without modification.
The ShakeAlert Earthquake Early Warning System 3
(1 death, 400 injuries), there was no evidence that severe injuries Once the ShakeAlert Messages are issued by the USGS,
occurred from collapsed structures. Falls were the main reason alerts are delivered to EEW end users by ShakeAlert technical
for reported injuries (Kano, 2005) and hospitalizations in the partners via a variety of mechanisms that fall into three broad
Nisqually earthquake, and were most commonly associated with categories. Firstly, machine-to-machine delivery via the internet
exiting from a building; these findings are consistent with other is generally the fastest and can be used to initiate pre-recorded
earthquake injury analyses (Peek-Asa and others, 2003, p. 462, messages on loud speaker systems, slow trains, close valves, or
464). Reports from the Nisqually earthquake indicate that there alert cell phones connected to Wi-Fi. Secondly, users can receive
were also head injuries and crushing caused by falling bricks after alerts powered by ShakeAlert on their cell phone either by
people exited a building during the earthquake (staff of the Pacific downloading an application (commonly referred to as an app) or
Northwest Seismic Network, 2001). To limit confusion and reduce via the Android operating system. In California, QuakeAlertUSA
the potential for such injuries, short directive messaging based on (available from Early Warning Labs), MyShake (from University
the range of likely warning times, combined with prior education of California Berkeley), and the City of Los Angeles (app no
and training on actions people should take after receiving an alert, longer available) have partnered with the USGS to test the delivery
is critical to developing appropriate warning message strategies. of alerts through cell phone apps. Thirdly, for potentially damaging
To produce a ShakeAlert Message, the system first detects earthquakes, Wireless Emergency Alerts (WEA) delivered by the
the earthquake, estimates its location and magnitude, computes Integrated Public Alert and Warning System (IPAWS), operated
the area that is expected to experience different intensities of by the Federal Emergency Management Agency (FEMA), will
shaking, and then issues ShakeAlert Messages (Given and others, deliver alerts via cell broadcast to all cell phones in the affected
2018; Chung and others, 2020; Kohler and others, 2020). The area. Each of these mechanisms uses different criteria, some of
time between when the earthquake starts and when the first which the user can select, for deciding when a particular user
ShakeAlert Message is issued ranges from about 4 to 20 seconds, should be alerted. They also take different amounts of time to
depending on the particular type of fault, the depth of the deliver the alert to a particular device and the delivery times
earthquake hypocenter, and the seismic station density near its depend on whether the device is connected to Wi-Fi or to the cell-
epicenter (fig. 2). The ShakeAlert sensor distribution is densest in phone carrier’s broadcast signal. These varying alert delivery times
urban areas and least dense offshore, resulting in a range of initial for the different mechanisms are still being tested and improved.
alerting times of 4–20 seconds. Of the three earthquake types, the They can vary from as little as less than 1 second for the fastest
time until the first ShakeAlert Message is issued can be the longest machine-to-machine and app alerts via Wi-Fi, to several tens of
for offshore earthquakes in the Cascadia subduction zone because seconds or no alert for WEA, which in some cases is the slowest
few seismic stations are located offshore (fig. 2). delivery pathway.
125˚ 120˚ 115˚ 125˚ 120˚
A B C 60
CALIF. NEVADA
50
40˚
40
WASHINGTON
Alerts
30
45˚ 20
OREGON
35˚
10
0
0 4 8 12 16 20
Time after earthquake begins
until alert is issued, in seconds
3 6 9 12 15 18
Time after earthquake begins
until alert is issued, in seconds
Figure 2. Maps and plot showing the variability in the time to alert for the real-time production ShakeAlert system from January 1,
2019, to October 31, 2020, for magnitude 3.5 or greater earthquakes (locations marked by triangles). A, Map of California; B, map of
Oregon and Washington; C, histogram of alert times. The time until the first ShakeAlert Message is issued is generally longer for offshore
earthquakes than onshore earthquakes. These times include latencies from the data telemetry delivery of the seismic data to the
ShakeAlert processing centers and from all of the ShakeAlert software computations necessary to produce ShakeAlert Messages.4 Expected Warning Times from the ShakeAlert Earthquake Early Warning System
Whether a particular user will receive an alert via a specific earthquake and user’s location, the initial magnitude estimate, and
delivery mechanism is currently determined by a combination the choice of delivery mechanism.
of the real-time estimates of earthquake magnitude (M) and The time after a ShakeAlert Message is issued by the USGS
the shaking intensity that will be experienced at the user’s until the time when a technical partner delivers an alert to an
location. ShakeAlert provides the estimated shaking intensity individual user by any mechanism is variable. The fastest alerts
using the Modified Mercalli Intensity scale (MMI) predicted are via systems connected to the internet (for example, cell phones
by a ground motion to intensity conversion equation (Worden on Wi-Fi or public address systems), which can be delivered in
and others, 2012) and a ground motion prediction equation less than 1 second in some cases. Alerts that arrive via cellular
(Chiou and Youngs, 2008; Thakoor and others, 2019). The delivery are commonly in the range of 1 to 10 seconds, but the
combinations of magnitude and intensity that are used as scaling to large numbers of users is still being tested by various
criteria for issuing an alert to a particular user via the different apps and Android. The WEA system can be as fast as 4 seconds
delivery mechanisms (as of spring 2021) are given in table 1. based on recent tests, but many users receive the alert later than
The ShakeAlert system produces a contour product, which 10 seconds or not at all (McBride, S.K., USGS, written commun.,
contains polygons that approximate the area where the expected 2020). Individual alerts may be faster or slower than these times,
median intensity ground motion corresponds to specific levels and alerts may become faster in the future. For the purposes of
of MMI (Given and others, 2018; Thakoor and others, 2019). this study, we report maximum possible warning times, which do
The delivery mechanisms then determine if a particular user is not include the time required for the ShakeAlert technical partner
within its specified alert polygon before issuing the user an alert. to deliver the alert to end users after it is received from the USGS
Currently, the shaking intensity values used by different delivery because we do not yet have enough information on alert delivery
mechanisms range from weak (MMI 3) to moderate (MMI 5) times via any mechanism to evaluate them in a probabilistic way.
shaking. The strategy of the ShakeAlert system is to issue alerts
for weak to moderate shaking to maximize warning times for the
regions that will eventually experience strong or worse shaking.
This strategy means that many users who receive alerts will not
Earthquake Hazards in the Pacific
experience strong shaking. Moreover, the majority of alerts will Northwest
be for earthquakes in the M4–5 range, given the current alerting
criteria. In this study, we focus on the warning times for users The Pacific Northwest is susceptible to three main types of
who will experience strong (MMI 6) or worse shaking from earthquake sources: shallow crustal earthquakes, deep intraslab
large (about M6.5 or greater) earthquakes. earthquakes, and large megathrust earthquakes in the Cascadia
For large earthquakes, alerts are sent to an area that expands subduction zone (fig. 1). Large deep intraslab earthquakes in the
over time as the system’s estimate of the earthquake magnitude subducting Juan de Fuca Plate occur approximately every few
and rupture length grow (Chung and others, 2020). The first decades, and tend to occur beneath the Puget Sound region of
ShakeAlert Messages issued are typically based on only the first Washington State at 40–70 km depths (Bostock and others, 2019).
few seconds or less of data and tend to be small (for example, The most recent deep earthquakes that inflicted significant damage
about M4–6) because the rupture has not had time to grow into a include the 2001 M6.8 Nisqually, 1965 M6.5 Puget Sound, and
large earthquake. For reference, in the Pacific Northwest, a first 1949 M6.8 Olympia earthquakes. Deep earthquakes appear to be
alert for a M5.5 earthquake would go out to radii of about 200, significantly less common in the subducting Juan de Fuca slab
75, and 20 kilometers (km) for delivery mechanisms that alert for beneath Oregon (Bostock and others, 2019). Crustal earthquakes
MMI 2.5, 3.5, and 4.5, respectively. As the magnitude estimates tend to have longer recurrence times in the Pacific Northwest,
grow to M6.5 or 7.0, these distances increase to approximately 450 but they are potentially more damaging than deep intraslab
to 530, 225 to 300, and 80 to 120 km, respectively. Thus, whether earthquakes because of their shallow depths and proximity to
the first ShakeAlert Message issued for an earthquake covers a population centers. Examples of large crustal earthquakes in the
particular region will be highly variable depending on the specific Pacific Northwest include the 1872 M6.5–7 Entiat earthquake
Table 1. Criteria used by current (as of spring 2021) delivery mechanisms to determine which users will receive alerts on their cell phones.
[Peak ground acceleration (PGA) levels are the estimated median shaking level at the polygon boundary, and individual users located inside the polygon may experience
ground motion higher or lower than that value. App, application; cm/s2, centimeter per square second; g, gravitational acceleration; GMICE, ground motion to intensity
conversion equation; GMPE, ground motion prediction equation; IPAWS, Integrated Public Alert and Warning System; MMI, instrumental Modified Mercalli Intensity;
WEA, Wireless Emergency Alerts]
Minimum Contour product Median MMI calculated PGA level
Delivery mechanism PGA level (cm/s2)
magnitude polygon from GMPE and GMICE (g)
IPAWS WEA system 5.0 MMI 4 3.5 12.8 0.013g
Android “be aware” alerts 4.5 MMI 3 2.5 2.9 0.003g
Android “take-action” alerts 4.5 MMI 5 4.5 44.5 0.045g
MyShake app 4.5 MMI 3 2.5 2.9 0.003g
QuakeAlertUSA app 4.5 MMI 3, 4, 5 2.5, 3.5, 4.5, user selectable 2.9, 12.8, 44.5 0.003g, 0.013g, 0.045g
City of Los Angeles app 4.5 MMI 3 2.5 2.9 0.003gHazard Deaggregation 5
(Brocher and others, 2017) and the approximately M7 Seattle crustal earthquakes into those associated and not associated
Fault earthquake in A.D. 900–930 that has been inferred from with specific faults in the NSHM. Since a ShakeAlert Message
geologic evidence (Nelson and others, 2003). is issued based on the median ground motion expected for the
In addition to shallow crustal and deep intraslab events, detected earthquake at a user’s location (using the appropriate
the Cascadia subduction zone has a history of large M8–9 ground motion prediction equation, earthquake magnitude, and
earthquakes on the megathrust fault offshore, which has been distance from the ruptured fault), the hazard calculation in this
inferred from geologic evidence for shaking, subsidence, and analysis does not include extreme values of ground motion caused
tsunamis (Atwater and others, 2005), as well as by offshore by effects such as site amplification or rupture directivity. All
turbidite records (Goldfinger and others, 2012). The last known calculations in tables 2–4 correspond to a minimum magnitude of
Cascadia megathrust earthquake occurred in A.D. 1700, and full 5.0 set by the NSHM.
margin ruptures on the Cascadia subduction zone are estimated As an example, end users who live in Seattle, Portland, or
to occur approximately every 500 years (Goldfinger and others, Eureka and use a cell phone app powered by ShakeAlert set to
2012). Based on modeling tsunami observations in Japan, the alert using the MMI 3 contour product should expect to receive an
A.D. 1700 earthquake had an estimated magnitude of 8.7–9.2 alert once every 3.5, 7, or 2 years, respectively (table 4). However,
(Satake and others, 2003). Paleoseismic evidence suggests that for the Android take-action alerts, which use the MMI 5 contour
southern Cascadia may also experience more frequent partial product, users in these same locations would expect to receive this
ruptures (for example, approximately M8) of the Cascadia type of alert once every 24, 91, and 14 years, respectively (table 2).
megathrust zone (Nelson and others, 2006), but evidence for
smaller magnitude partial ruptures in northern Cascadia are less Table 2. Probability of exceeding peak ground acceleration (PGA) of
well constrained (Frankel and others, 2019). 0.045g at the indicated return time for three earthquake types.
[PGA of 0.045g corresponds to the Modified Mercalli Intensity (MMI) 5
contour product. g, gravitational acceleration; %, percent; yr, year]
Hazard Deaggregation Location
Return Megathrust Deep intraslab Shallow crustal
time (yr) earthquake (%) earthquake (%) earthquake (%)
The USGS National Seismic Hazard Maps (NSHM; Seattle 24 6 54 40
Petersen and others, 2014, 2019) provide estimates for the Tacoma 25 6 55 39
contribution of different types of earthquakes to the total seismic Portland 91 26 15 59
hazard in locations throughout the Pacific Northwest. Whereas Newport 117 39 12 48
seismic hazard is high throughout the region, the underlying Eureka 14 4 4 92
contributions from different types of earthquakes at a particular
location vary. The USGS provides the ability to deaggregate Table 3. Probability of exceeding peak ground acceleration (PGA)
the hazard portrayed in the NSHM by shaking level and source of 0.013g at the indicated return time for three earthquake types.
type, and we have utilized this capability to illustrate the types
[PGA of 0.013g corresponds to the Modified Mercalli Intensity (MMI) 4 contour
of earthquakes likely to cause a ShakeAlert Message to be product. g, gravitational acceleration; %, percent; yr, year]
issued for a number of locations throughout the region.
Return Megathrust Deep intraslab Shallow crustal
To determine what types of earthquakes are likely to Location
time (yr) earthquake (%) earthquake (%) earthquake (%)
cause alerts to be delivered to a specific location, we have
Seattle 8 2 49 49
deaggregated the hazard according to the probability of
Tacoma 8 2 49 48
exceeding different levels of peak ground acceleration (PGA)
Portland 25 8 25 67
that correspond to the different alerting criteria in table 1.
Newport 50 17 13 69
Specifically, the ShakeAlert contour product polygons in the
Eureka 4 1 5 93
Pacific Northwest are calculated using the ground motion
prediction equation from Chiou and Youngs (2008) and the
Table 4. Probability of exceeding peak ground acceleration (PGA)
ground motion to intensity conversion equation from Worden
of 0.003g at the indicated return time for three earthquake types.
and others (2012). As currently defined in the ShakeAlert
system (Chung and others, 2020), the MMI 3, 4, and 5 contour [PGA of 0.003g corresponds to the Modified Mercalli Intensity (MMI) 3
products, correspond to PGA levels of 0.003g, 0.013g, and contour product. g, gravitational acceleration; %, percent; yr, year]
0.045g, respectively, where g is gravitational acceleration. Return Megathrust Deep intraslab Shallow crustal
Location
Tables 2–4 give the return time of each expected level of time (yr) earthquake (%) earthquake (%) earthquake (%)
shaking in Seattle, Wash.; Tacoma, Wash.; Portland, Oreg.; Seattle 3.5 1 35 64
Newport, Oreg.; and Eureka, Calif. Return time is defined Tacoma 4 1 37 62
such that there is a 63 percent (about 2 out of 3) chance of Portland 7 2 30 68
this shaking level occurring during one return time. For each Newport 12 4 11 84
level of shaking and location, the hazard is deaggregated into Eureka (0.005g 2 1 4 95
earthquake sources on the subducted plate interface (megathrust thresholda)
earthquakes), deep within the slab, and in the shallow crust. a
The 0.005g threshold for Eureka corresponds to the shortest recurrence time
Tables 1.1–1.3 in appendix 1 show a breakdown of the shallow modeled by the National Seismic Hazard Map.6 Expected Warning Times from the ShakeAlert Earthquake Early Warning System
Table 2 also shows that these take-action alerts will be prompted an earthquake is highly variable, for smaller magnitude
by predominately deep intraslab and shallow crustal earthquakes earthquakes, the zone of strong shaking is generally smaller
in Seattle (94 percent) and Portland (74 percent), but for locations and closer to the epicenter than it is for larger events. Thus, it
near the coast, such as Newport, the contribution from offshore is inherently harder to provide long warning times for strong
megathrust earthquakes (39 percent) will be significantly larger. shaking in M5 earthquakes than it is in M8 earthquakes (Meier
The distribution of earthquake magnitudes that will and others, 2020). Figure 3 shows the deaggregation of the
prompt the USGS to issue a ShakeAlert Message has a strong sources contributing to MMI 5 alerts in table 2 for each of the
influence on the amount of warning time that is possible. five cities as a function of magnitude and closest distance to the
Although the strength of shaking at a given distance from fault. Note these are not epicentral distances and hence cannot
30 35
A. Seattle B. Tacoma
M 8+ M 8+
25
M 7.0–7.9 30 M 7.0–7.9
M 6.0–6.9 M 6.0–6.9
M 5.0–5.9 M 5.0–5.9
Probability, in percent
25
20
20
15
15
10
10
5
5
0 0
0 50 100 150 200 250 300 0 50 100 150 200 250 300
Distance to fault, in kilometers Distance to fault, in kilometers
50 40
C. Newport D. Eureka
45 M 8+ M 8+
M 7.0–7.9 35 M 7.0–7.9
40 M 6.0–6.9 M 6.0–6.9
M 5.0–5.9 M 5.0–5.9
30
Probability, in percent
35
30 25
25 20
20
15
15
10
10
5
5
0 0
0 50 100 150 200 250 300 0 50 100 150 200 250 300
Distance to fault, in kilometers Distance to fault, in kilometers
30
E. Portland M 8+
M 7.0–7.9 Figure 3. Plots showing the probability of generating
25 M 6.0–6.9
M 5.0–5.9 a ShakeAlert Message as a function of the closest
Probability, in percent
distance to the fault that ruptured during the earthquake
20
for the hazard deaggregation calculations in table 2 for
Seattle (A), Tacoma (B), Newport (C), Eureka (D), and
15 Portland (E). The deaggregation calculations are for a
Modified Mercalli Intensity 5 contour product. Note the
10 distance is the distance tabulated in the National Seismic
Hazard Maps, which is the distance to the closest point
5 on the fault (Rrup), not the distance to the epicenter. Colors
show the contribution of different magnitude ranges to
0 the probabilities. M, magnitude.
0 50 100 150 200 250 300
Distance to fault, in kilometersDefinition of Warning Times 7
be simply mapped to expected warning times. In particular, intensity. The time a user is alerted (talert) is given by equation 1,
for great megathrust earthquakes we do not know where the where t is time.
next M8+ earthquake will nucleate (see the following sections
for discussions of warning times in this type of earthquake). It talert t
MMI pred
t
MMI alert
. (1)
should be noted that ground-motion intensity depends on the
distance to the closest part of the fault that ruptured during the Whether or not a site should be alerted depends on if the
earthquake, not the distance to where the earthquake starts—its peak observed ground motion, MMIobs, exceeds MMIalert. Sending
hypocenter (the epicenter is the projection of the hypocenter an alert to a site with MMIobs < MMIalert is considered a false alert
onto the Earth’s surface). (false positive). Failing to alert a site with MMIobs ≥ MMIalert is
Of particular importance in figure 3 is that, for all considered a missed alert (false negative). Sending an alert to
locations, the majority of alerts will be from moderate M5.0–7.0 a site with MMIobs ≥ MMIalert is considered a correct alert if the
earthquakes occurring within about 100 km. Some delivery alert was created while there was still time to take action (true
mechanisms will be even more dominated by alerts for smaller positive). We define the last point in time at which an alert is still
earthquakes than what is shown in tables 2–4 because they actionable (tlast) as
use the lower M4.5 magnitude threshold (table 1). Similar
calculations for the MMI 4 contour product alerting are shown in
tlast t
MMI obs
t
MMI tw
. (2)
figure 1.1 in appendix 1. In all five locations, the majority of alerts
that an end user will receive will be from earthquakes smaller
That is, tlast occurs when the observed ground motion exceeds a
than M7.0. In such cases, we expect warning times before strong
ground motion threshold, MMItw, where MMItw ≥ MMIalert. Once
shaking to be short, on the order of 10 seconds or less. Warnings
shaking is stronger than MMItw, an incoming alert is considered
from large M8.0 or greater megathrust earthquakes will be a small
not useful because ground shaking has become too strong for a
fraction of the alerts received in all locations, but offer the greatest
person to take effective protective action (such as drop, cover, and
potential for a longer warning time.
hold on) and is considered a missed alert. Warning times (tw) can
then be measured as
Definition of Warning Times tw = tlast − talert. (3)
Two choices of ground motion levels are required to specify The different delivery mechanisms in table 1 use a variety
the warning time at a particular location. In this study, we use of values for MMIalert and, as a result, a particular location will
MMI for instrumental intensity, which is computed from observed have different warning times depending on the alert distribution
peak ground acceleration and peak ground velocity (Worden and mechanism. Similarly, the proper value to use for MMItw is not
others, 2012), rather than for macroscopic intensity, which is clear. Given that MMI 4 is felt indoors by many, it is still possible
defined through observed non-instrumental effects of shaking (for to take protective actions at that level. For this analysis, we set
example, damage to structures, as reported on the USGS Did You MMItw to 4.5 to represent the onset of moderate shaking where
Feel It? web page, available at https://earthquake.usgs.gov/data/ people report having difficulties standing (Stover and Coffman,
dyfi). We measure the warning time by comparing the temporal 1993; Dewey and others, 1995). Given the variety of values
evolution of the observed and the predicted ground motions at that can be relevant for MMItw (accounting for variations in the
sites where seismic stations are located, following the methods of appropriate protective action, which depend on whether someone
Chung and others (2020). At each site, both the observed and the is inside a building, driving a car, has limited mobility, and so
predicted ground motions evolve over time. The predicted ground on) and for MMIalert, we show alternate versions of most figures
motions are updated repeatedly during the earthquake as the in appendix 1 to allow the reader to see the effect of different
ShakeAlert system records more data and updates its earthquake chosen values. We note that damage is minimal in well designed
magnitude and location estimates. Moreover, large earthquakes infrastructure for shaking below MMI 8, and as a result, a higher
can take tens of seconds or more to rupture along a long fault and value of MMItw may be appropriate for automated machine-to-
ShakeAlert attempts to track this growth, causing the predicted machine actions in these cases, which would correspond to longer
ground motions to update over seconds to tens of seconds or even actionable warning times in many cases.
minutes in a great earthquake. We assume that each site would be Here we present a combination of results from the real-
alerted as soon as the prediction, MMIpred(t), for that site exceeds time ShakeAlert system in California as well as offline runs of
an alerting threshold MMIalert. One difference from the calculations the ShakeAlert software on historical or synthetic earthquakes.
of Chung and others (2020) is that they used the ShakeAlert map The real-time system performance includes the latency for data
product, a regular grid of predicted ground motions, whereas the transmission from seismic stations to ShakeAlert servers, which is
calculations in this study use the ShakeAlert contour product, typically 0–2 seconds but can be larger during some earthquakes
which is used by all of the alerting mechanisms in table 1. The (Chung and others, 2020). For the purposes of this study, we
difference between the two is generally minimal and include report maximum possible warning times that do not include the
different assumptions about local site effects on expected shaking time to deliver the alert via a particular mechanism once the8 Expected Warning Times from the ShakeAlert Earthquake Early Warning System
USGS ShakeAlert Message is received by the alert distribution training purposes or in anticipation that the earthquake may grow
partner. This delivery time can range from less than a second to become larger (Minson and others, 2018).
(for internet connections or cell phones connected to Wi-Fi) to The ShakeAlert system consists of a series of algorithms that
not receiving the alert at all (in some cases). We do not yet have estimate an earthquake’s location, magnitude, rupture length, and
enough information on alert delivery times via any mechanism expected shaking. During a large earthquake, the size and fault
to evaluate them in a probabilistic way. Values of 1 second for location estimates will evolve as the earthquake grows and the
alerts delivered via the internet or to cell phone apps and Android system receives more data about the shaking. Typically, the current
phones via Wi-Fi, 4 seconds for alerts delivered to cell phone ShakeAlert system starts when the EPIC point-source algorithm
apps or Android phones via cellular connections, and 8 seconds (Chung and others, 2019) detects the earthquake and produces
for WEA are within the range of latencies reported to ShakeAlert an initial estimate of the magnitude and epicenter. The FinDer
by various partners during testing in 2019 and 2020 and our own algorithm then starts to produce an estimate of fault length and
WEA tests (McGuire and others, 2019; McBride, S.K., USGS, a corresponding magnitude, which is continually updated until
written commun., 2020). However, individual alerts may be faster the earthquake rupture stops. These parameters are combined by
or slower than these values. the solution aggregator algorithm, and the result is used by the
Particularly for shallow crustal and offshore megathrust EqInfo2GM algorithm to produce estimates of expected peak
earthquakes, many sites experience their strongest shaking during shaking, which is published by the decision module (see fig. 6
passage of the seismic surface waves and, thus, approaches that of Given and others, 2018). The system is further described by
assume the peak shaking occurs at the time of the S-wave arrival Kohler and others (2018) and Chung and others (2020). The
from the hypocenter are oversimplified. All of the warning times warning times described below result from running the full
discussed in the following three sections have been calculated system (as of fall 2020) through to the predicted ground motion
from actual MMI exceedance times from either recorded historical calculation; they result from a combination of these algorithms.
earthquakes or numerical simulations of large earthquakes on Shallow crustal earthquakes of moderate size are a difficult
the Cascadia megathrust. We use synthetic earthquakes for the case for EEW to provide long warning times (Minson and others,
megathrust events because there are no recorded great earthquakes 2018; Meier and others, 2020; Wald, 2020). Tables 2–4 and figure
in the Cascadia region. We compare these to results from well- 3 show that approximately 40–70 percent of the alerts received
recorded events in Japan that have previously been studied for in Portland and Seattle will likely come from nearby crustal
EEW by others. earthquakes of M4.5–7. The ShakeAlert system recently issued
ShakeAlert Messages for the 2019 M6.4 and M7.1 Ridgecrest
earthquakes, and these events offer useful insights into the warning
Warning Times for Shallow Crustal times possible in the Pacific Northwest for crustal earthquakes.
The distance that strong shaking (MMI 6) is typically felt from a
Events M7.1 earthquake is large (about 100–150 km; for example, see fig.
4B) compared to a M5.0 earthquake (about 10 km). Figures 4 and
Tables 2–4 show that more than 40 percent of alerts received 5 show the warning times as a function of the eventual shaking
will be from shallow crustal earthquakes for most combinations level that end users with a cell phone app set to alert for MMI 3
of delivery mechanism and location in the Pacific Northwest. shaking (corresponding to a median MMIalert of 2.5; see table 1)
ShakeAlert is developing a solid understanding of warning times would have received if cell phone apps had been delivering alerts
for these types of onshore earthquake sources from data collected at this level during the Ridgecrest earthquakes (Chung and others,
on frequent moderate and occasional large magnitude events in 2020). The warning time for all possible values of MMItw at a
California (for example, Chung and others, 2020). As the seismic particular location are shown in figure 4 as a vertical column of
network in the Pacific Northwest is built out over the coming symbols at a given distance. Even within 50 km of the epicenter, it
years to match the ShakeAlert implementation plan (Hartog and can take 10 seconds or more for the shaking at a particular location
others, 2016; Given and others, 2018), we expect the capabilities to increase from when it is first felt until it reaches its highest
of the system in Oregon and Washington to approximately intensity. In contrast, figure 5 (as well as figs. 6, 7B,D,F, 8, and
resemble those in many parts of California for shallow crustal 11–14) assumes that when shaking reaches MMItw = 4.5 an alert
events. Warning times for strong, or worse, shaking (MMI 6 becomes no longer useful because the shaking is already strong
or greater) in shallow crustal earthquakes are inherently short enough that it is too difficult to take a protective action. Although
because for all but the largest earthquakes, this level of shaking MMItw = 4.5 may be a relevant value for drop, cover, and hold on
is concentrated relatively close to the epicenter (Wald, 2020). actions, we note that some automated actions in industrial settings
Even for large propagating ruptures, it is inherently difficult to could likely still continue at higher levels of shaking and as a result
achieve long warning times for high-intensity shaking because have somewhat longer actionable warning times (as is seen in the
such shaking requires knowing the current length of the rupture location with the strongest shaking [MMI 8.5] in fig. 4).
and is only expected within a few tens of kilometers of the fault. For regions that experienced potentially damaging shaking
Thus, to get long warning times for large crustal earthquakes (on in the M7.1 earthquake (MMI 6; yellow curves in fig. 5B), 25
the order of tens of seconds), users must be willing to take action percent of sites would have received warning times of more
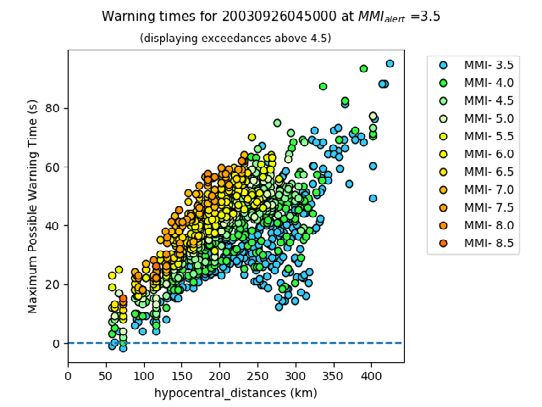
at non-damaging levels of shaking (for example, MMI 3–4) for than 20 seconds, 25 percent would have received warningWarning Times for Shallow Crustal Events 9
80
MMI = 2.5
MMI = 3.5
70 MMI = 4.5
MMI = 5.5
MMI = 6.5
60 MMI = 7.5
Maximum possible warning time, in seconds
MMI = 8.5
FN
50
40
30 Figure 4. Plots showing the performance
of the real-time ShakeAlert system during
the 2019 magnitudes 6.4 (left) and 7.1
20 (right) Ridgecrest earthquakes. The time
at which different instrumental Modified
Mercalli Intensity (MMI) threshold levels
10
are exceeded by the observed ground
motion at each seismic station relative to
0
the time when the site is alerted (talert) for
an alert threshold (MMIalert) of 2.5 is plotted
versus distance from the hypocenter. Each
-10 station has a symbol plotted for each MMI
0 50 100 150 200 250 300 level that it exceeded. The highest MMI
Hypocentral distance, in kilometers threshold for which there is a warning
time measurement shows the approximate
80
peak ground-motion level for each site.
MMI = 2.5 False negatives (FN)—sites for which an
MMI = 3.5 alert should have been generated but was
70 MMI = 4.5
not—are also shown. Warning times in
MMI = 5.5
MMI = 6.5
this figure do not include delivery times
60 MMI = 7.5 for the different delivery mechanisms and
Maximum possible warning time, in seconds
MMI = 8.5 are therefore maximum values. However,
FN they do include all data transmission and
50 computational latencies in the real-time
system during July 2019. Sites for which
peak observed intensities are less than 2.5
40
are not shown. Modified from Chung and
others (2020).
30
20
10
0
-10
0 50 100 150 200 250 300
Hypocentral distance, in kilometers
g410 Expected Warning Times from the ShakeAlert Earthquake Early Warning System
1 n = 156
1 n = 129
10 n = 110 10 n = 175
n = 18 n = 33
9 n= 7 9 n = 11
n= 1 n= 3
0.75 8 n= 0 0.75 8 n= 3
n= 0 n= 1
Empirical CDF
Empirical CDF
7 7
6 6
MMI
MMI
0.5 0.5
5 5
4 4
0.25 3 0.25 3
2 2
1 1
0 0
80 40 20 10 5 1 80 40 20 10 5 1
Warning time, in seconds Warning time, in seconds
Figure 5. Plots showing the empirical cumulative distribution functions (CDF) of the warning times for the seismic stations that
observed the 2019 magnitudes 6.4 (left) and 7.1 (right) Ridgecrest earthquakes (these are a subset of the warning times shown
in fig. 4). Stations do not have a uniform spatial sampling. These plots use an alerting threshold (MMIalert) of 2.5 and observed
ground-motion threshold (MMItw) of 4.5; see Chung and others (2020) for other combinations of MMIalert and MMItw. The number
(n) of alerts for each instrumental Modified Mercalli Intensity (MMI) level is shown. Modified from Chung and others (2020).
times of 5–20 seconds, and 50 percent would have received
warning times of 5 seconds or less (with many of these sites
Warning Times for Deep Instraslab
receiving no advance warning at all). Moreover, the regions Earthquakes
that experienced the strongest shaking close to the fault (MMI
7–9) received no warning before they experienced shaking, but Tables 2–4 indicate that deep intraslab earthquakes
could have received as much as about 10 seconds of warning will make up approximately 30–55 percent of the alerts
before peak shaking (Chung and others, 2020). Warning times for the Seattle, Tacoma, and Portland metropolitan areas.
of 20–40 seconds were possible in this event primarily for sites These types of earthquakes, similar to the 2001 M6.8
that experienced light to moderate shaking (MMI 3–5; blue Nisqually earthquake near Olympia, Wash., are also quite
curves in fig. 5B). Note that for the M6.4 Ridgecrest earthquake, challenging for ShakeAlert. Because of their large depth,
the zone that experienced MMI 6 shaking was limited to within typically about 50 km beneath Seattle and the surrounding
about 50 km of the epicenter (fig. 4A) and warning times longer region, the P-wave reaches the surface over a wide area
than 5 seconds were not possible even with alerting at the MMI nearly simultaneously, followed a few seconds later by the
3 contour product level (fig. 5A). Warning times are significantly S-wave. Moreover, because of their depth, the strongest
longer for the M7.1 earthquake than the M6.4 earthquake for shaking typically arrives with the S-wave, rather than surface
regions that experienced MMI 6 or greater shaking. waves, meaning that the warning time is mostly dictated by
About 40–95 percent of the alerts at various locations in the short separation between the P- and S-waves. In these
the Pacific Northwest are expected to be issued for shallow cases, ShakeAlert actually may have less time to issue
crustal earthquakes with various alerting thresholds (tables 2–4). ShakeAlert Messages effectively than in a shallow crustal
Many of these alerts will be for M4.5–6.5 earthquakes where event of comparable magnitude. For instance, in the M7.1
warning times from strong (MMI 6) or larger shaking are Ridgecrest mainshock, there was about 19 seconds between
expected to be short (less than 10 seconds; for example, see when the first P-wave was detected on the surface and when
fig. 5A). Less frequent M7 or greater shallow crustal earthquakes the strongest shaking was recorded by seismometers (Chung
are potential contributors to alerts in all regions of Cascadia, and others, 2020). In contrast, for the 2019 M7.1 Anchorage,
and in these earthquakes, actionable warning times for sites Alaska, intraslab earthquake, the difference is about 16
that
fig5experience strong shaking (or worse) are possible (Chung seconds. In general, we expect warning times for strong
and others, 2020) (figs. 4B and 5B). However, as illustrated shaking from deep intraslab earthquakes to be comparable to
in figure 5B, these warning times will be short, usually less those for shallow crustal events.
than 10 seconds for MMI 6 or greater shaking, with warning The ShakeAlert testing effort has analyzed performance
times as long as several tens of seconds possible only for felt using data from two well-recorded, large, intraslab earthquakes:
but non-damaging shaking (that is, MMI 3–4). End users the 2001 M6.8 Nisqually and 2019 M7.1 Anchorage earthquakes.
should take immediate protective actions when receiving alerts In these earthquakes, P-wave shaking was first detected on the
from shallow crustal earthquakes regardless of their alerting surface about 7–9 seconds after the rupture began. Table 5 gives
thresholds, in anticipation that the earthquake could grow to the evolution of the magnitude estimates for the current version
become damaging (Porter and Jones, 2018). of the ShakeAlert system for the Nisqually and AnchorageWarning Times for Deep Instraslab Earthquakes 11
earthquakes. In both earthquakes, by about 11–13 seconds after Table 5. Alert history for the 2001 magnitude 6.8 Nisqually and
each event begins, the magnitude estimates reach about M6.0 and 2019 magnitude 7.1 Anchorage earthquakes from offline runs of
ShakeAlert Messages would be used to issue alerts to locations the ShakeAlert production system in summer 2020.
within a few hundred kilometers radius for delivery mechanisms
that use MMIalert = 2.5 (table 1). However, for higher values of [New alerts were issued in response to evolving estimates of earthquake mag-
MMIalert, the initial ShakeAlert Messages would cover a much nitudes at the elapsed times indicated (relative to the time the rupture began).
M, magnitude; s, second]
smaller region. Figure 6 shows the distribution of shaking and
the maximum possible warning times for different values of Alert Nisqually Anchorage
MMIalert in the Nisqually earthquake. Owing to the time it takes 1 11 s, M6.1 8.5 s, M5.2
for the ShakeAlert magnitude estimate to reach near peak values, 2 12 s, M5.9 11 s, M5.1
the amount of warning time depends strongly on the choice 3 13 s, M6.4 12 s, M5.4
of MMIalert. The warning times in figures 6B and 6C do not 4 13 s, M6.4 12 s, M5.8
include data transmission times from seismic stations or alert 5 17 s, M6.7 13 s, M6.0
dissemination times. Thus, the maximum possible warning time 6 20 s, M6.8 14 s, M6.1
for EEW users in the MMI 6 and stronger shaking regions would 7 27 s, M6.9 15 s, M6.3
be about 15 seconds for MMIalert of 2.5 and 3.5, and 50 percent of 8 17 s, M6.4
users would receive 10 seconds or less of warning (fig. 7B,D). For 9 20 s, M6.6
MMIalert of 4.5 this drops to a maximum warning time of about 7 10 23 s, M6.7
seconds, and 50 percent of users would receive 5 seconds or less 11 29 s, M6.9
of warning (fig. 7F). 12 52 s, M7.1
124˚ 122˚ 124˚ 122˚ 124˚ 122˚
WASHINGTON WASHINGTON WASHINGTON
48˚
Seattle
Tacoma
46˚
Portland
A OREGON B MMI 3 alerts OREGON C MMI 5 alerts OREGON
0 2 4 6 8 10 0 10 20 30
MMI Warning time, in seconds
Figure 6. Maps of peak shaking and warning times from ShakeAlert for the 2001 Nisqually earthquake in Washington
(assuming a ground-motion threshold [MMItw] of 4.5). A, U.S. Geological Survey ShakeMap showing contours of instrumental
Modified Mercalli Intensity (MMI) values. B, Map showing warning times for an alert threshold (MMIalert) of 2.5. C, Map
showing warning times for an MMIalert of 4.5. Diamond symbols mark seismic stations operational at the time and the gray
star shows the epicenter.You can also read