Study of Travel times in public transport on selected nodes in Sweden, Finland, Estonia and Latvia
←
→
Page content transcription
If your browser does not render page correctly, please read the page content below
Study of Travel times in public transport
on selected nodes in Sweden, Finland,
Estonia and Latvia

Author: Kassaw Bediru Seid, Albin Dahl, Daniel Knutsen, Sophie Persson, Fredrik
Widegren , WSP

Published: June, 2021

 Figure 1: Travel times in Public Transportation
Study of Travel times in public transport on selected nodes in Sweden, Finland,
Estonia and Latvia

By Kassaw Bediru Seid, Albin Dahl, Daniel Knutsen, Sophie Persson, Fredrik Widegren ,
WSP

Copyright:      Reproduction of this publication in whole or in part must include the
customary bibliographic citation, including author attribution, report title, etc.

Published by:

The contents of this publication are the sole responsibility of BALTIC LOOP partnership
and
do not necessarily reflect the opinion of the European Union.
Study of Travel times in public transport on                                                                                                      06/2021
selected nodes in Sweden, Finland, Estonia
and Latvia

Contents
Introduction ................................................................................................................................................7
        Studied notes ....................................................................................................................................7
        Obstacles in the investigation.....................................................................................................8
        Conclusions in brief ........................................................................................................................8
Train planning process and Traffic management systems in Sweden, Finland, Estonia
and Latvia ................................................................................................................................................. 10
   Sweden .................................................................................................................................................. 10
        The Swedish Transport Administration's allocation process ........................................ 10
        Timetable construction............................................................................................................... 11
        Running times ................................................................................................................................ 12
        The node extension ..................................................................................................................... 13
        The size of the supplements..................................................................................................... 14
        Increased redundancy in the timetables .............................................................................. 15
        Guidelines for tightness between trains............................................................................... 16
        Traffic management system in Sweden ............................................................................... 17
        Automatic ........................................................................................................................................ 17
   Finland ................................................................................................................................................... 18
        The Finnish railway market in change process .................................................................. 18
        Infrastructure capacity and train planning .......................................................................... 19
        Allocation of infrastructure capacity...................................................................................... 20

                                                                              1e

                                                                                                                     www.balticloop.eu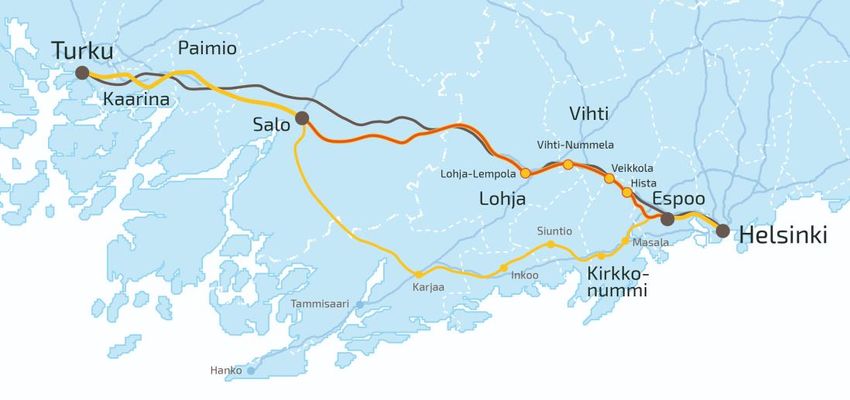
Study of Travel times in public transport on                                                                                                        06/2021
selected nodes in Sweden, Finland, Estonia
and Latvia

       Current planning guidelines and practices ......................................................................... 20
   Estonia ................................................................................................................................................... 22
       Traffic Management System ..................................................................................................... 22
       Train Planning Process................................................................................................................ 23
   Latvia ...................................................................................................................................................... 24
       Traffic Management System ..................................................................................................... 24
       Train Planning Process................................................................................................................ 25
Data-driven and automated methods in operation ................................................................. 28
   Driver Advisory Systems ................................................................................................................. 28
       Transrail (CATO) ............................................................................................................................ 32
       Tydal systems ................................................................................................................................. 34
       Cubris - GreenSpeed ................................................................................................................... 36
       Additional DAS-systems in Europe ........................................................................................ 37
   Support in the train planning process ....................................................................................... 38
Travel Time Analysis ............................................................................................................................. 40
       Project Objectives ......................................................................................................................... 40
       Approach ......................................................................................................................................... 40
       Delimitations .................................................................................................................................. 41
   Nodes in Sweden and Norway ..................................................................................................... 41
       Primary node: Oslo-Örebro-Stockholm ............................................................................... 41
       Analysis of the node Oslo – Örebro – Stockholm ............................................................ 47

                                                                               2e

                                                                                                                      www.balticloop.eu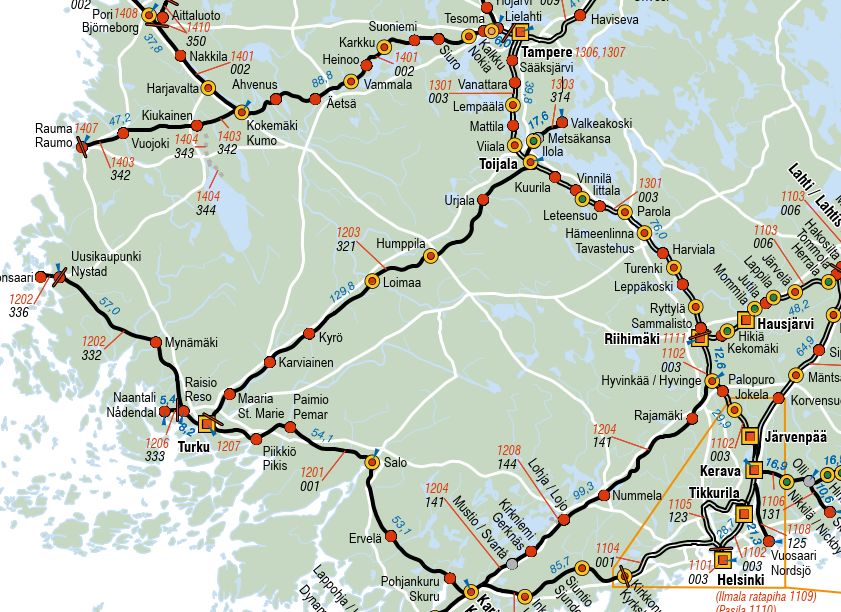
Study of Travel times in public transport on                                                                                                 06/2021
selected nodes in Sweden, Finland, Estonia
and Latvia

        Secondary Node: Kopparberg - Lindesberg - Örebro .................................................... 50
        Analysis of the node Kopparberg - Lindesberg - Örebro .............................................. 51
        Secondary node: Katrineholm - Eskilstuna - Västerås .................................................... 53
        Analysis of the node Katrineholm – Eskilstuna – Flen ..................................................... 55
        Tertiary node: Örebro – Askersund ........................................................................................ 57
        Tertiary node: Örebro – Hällefors ........................................................................................... 58
   Nodes in Finland ................................................................................................................................ 58
        Primary nod: Helsinki – Tampere ............................................................................................ 58
        Analysis of the node Helsinki – Tampere............................................................................. 63
        Secondary nod: Helsinki – Salo – Turku ............................................................................... 64
        Tertiary node: Turku – Pori ........................................................................................................ 66
   Nodes in Estonia ................................................................................................................................ 67
        Primary Node: Tallinn-Narva .................................................................................................... 67
        Analysis of the node Tallinn - Narva ..................................................................................... 69
   Nodes in Latvia ................................................................................................................................... 70
        Primary Node: Tukums-Tornakalns/Riga ............................................................................. 71
        Analysis of the node Tukums – Tornkalns/Riga ................................................................ 76
        Secondary Node: Riga-Cesis .................................................................................................... 79
        Tertiary Node: Cesis-Smiltene.................................................................................................. 83
Conclusions.............................................................................................................................................. 86
   Redundancy in the timetables ...................................................................................................... 86

                                                                            3e

                                                                                                                 www.balticloop.eu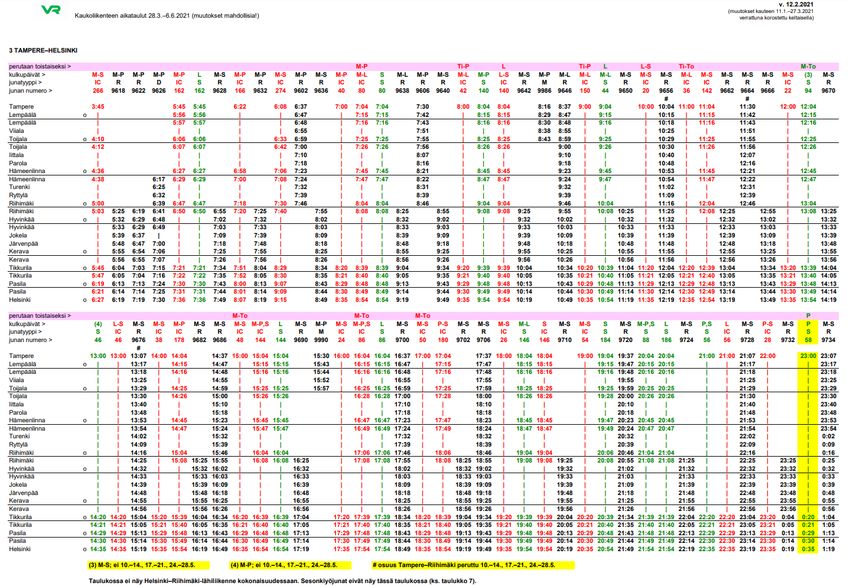
Study of Travel times in public transport on                                                                                                      06/2021
selected nodes in Sweden, Finland, Estonia
and Latvia

   Possible time savings with driver advisory systems .............................................................. 87
   Possible time savings with simulations ..................................................................................... 89
   Shorter travel times through daily timetables ........................................................................ 89
   Shorter travel times through priorities ...................................................................................... 90
   Travel times and delays - a trade-off ......................................................................................... 91
References ................................................................................................................................................ 92

Table of Figures

 Figure 1: Travel times in Public Transportation ............................................................................2
Figure 2 The Swedish Transport Administration's process description of the allocation
process. ..................................................................................................................................................... 11
Figure 3 Map of the Estonian railway network with blue lines indicating lines owned
and managed by Estonian Railways (Eesti Raudtee) and green indicating the lines of
Edelaraudtee (Southern Railways). .................................................................................................. 22
Figure 4 Infrastructure equipment of railways in Latvia. ......................................................... 25
Figure 5 The railway capacity allocation scheme of Latvia. .................................................... 26
Figure 6 General overview of lifecycle railway planning process ......................................... 40
Figure 7 Schematic map of Mälarbanan between Örebro and Västerås. ......................... 42
Figure 8 Speed diagram Västerås - Örebro, ................................................................................ 43
Figure 9 Speed diagram, between Karlstad and Kristinehamn (Railsys)............................ 44
Figure 10 Speed diagram Karlstad - Kil ......................................................................................... 45
Figure 11 Daily graph, between Kolbäck and Västerås, 16: 00-18: 00 2021-10-13 ....... 47
Figure 12 Speed profile for STAX E, Frövi - Hallsberg. Railsys .............................................. 48

                                                                              4e

                                                                                                                     www.balticloop.eu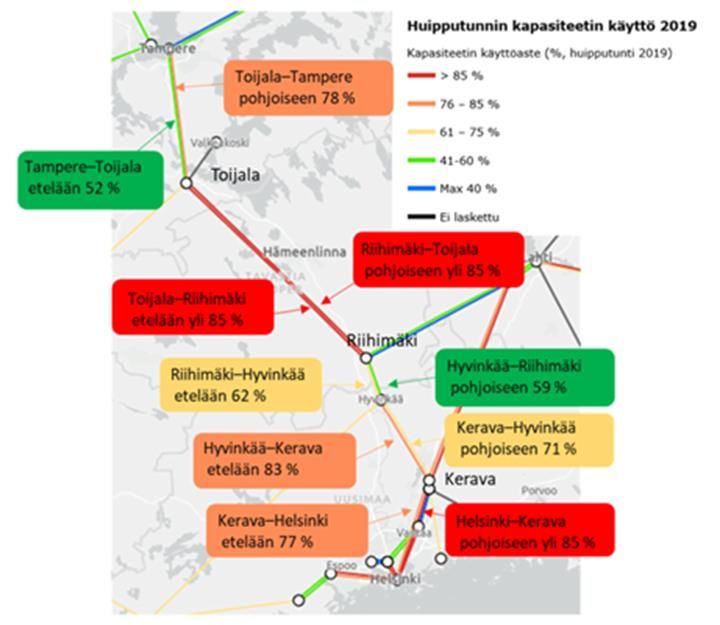
Study of Travel times in public transport on 06/2021
selected nodes in Sweden, Finland, Estonia
and Latvia
Figure 13 Theoretical capacity utilization 2021, Kristinehamn - Kil, (WSP, 2021) .......... 49
Figure 14 Daily graph, between Kristinehamn and Kil, 16: 00-18: 00, 2021-10-13 ....... 50
Figure 15 Daily graph 212013 22, Kopparberg-Frövi ............................................................... 52
Figure 16 Daily graph 212013 14, Frövi -Örebro ....................................................................... 52
Figure 17 The theoretical capacity utilization for the section Kopparberg - Lindesberg
- Örebro, today ....................................................................................................................................... 53
Figure 18 Daily graph, date 211013 at 16: 00-20: 00 ............................................................... 56
Figure 19 The theoretical capacity utilization for the section Katrineholm - Eskilstuna -
Västerås ..................................................................................................................................................... 56
Figure 20 Railway network in South West of Finland. .............................................................. 59
Figure 21 Capacity utilization for southbound and northbound trains during rush hour
on the Helsinki - Tampere route, 2019 .......................................................................................... 62
Figure 22 Timetable for the route Tampere – Helsinki (VR, 2020) ...................................... 63
Figure 23 New line for high-speed railway (Väylävirasto, 2020) .......................................... 64
Figure 24: Map of Estonian Railway network with blue lines indicating lines owned and
managed by Estonian Railways (Eesti Raudtee) and green indicating the lines of
Edelaraudtee (Southern Railways) ................................................................................................... 67
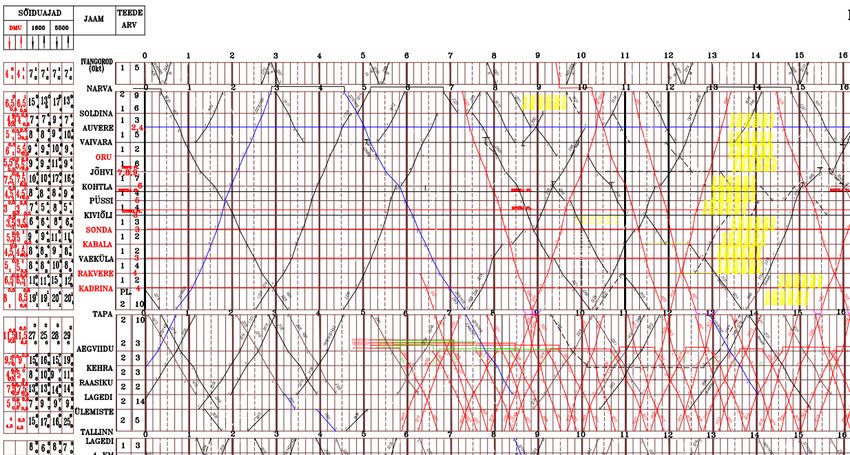
Figure 25: Graphical timetable between 0:00-13:00 Narva-Tapa (single-track), Tapa-
Tallinn (double-track), (Source: Estonian Railways) ................................................................... 68
Figure 26: Latvia Railway network with zonal tariffs. Riga-Cesis and Tukums 2-
Tornakalns/Riga are shown in green and blue lines respectively ........................................ 71
Figure 27: Equipment of Latvia Railway Sections. Marked in blue rectangle is Tukums 2
-Tornakalns-Riga. Green lines indicate electrification .............................................................. 73
Figure 28: Train throughput capacity of Tukums 2 - Tornakalms, ....................................... 76
Figure 29: Train throughput capacity of Riga-Cesis-Valga ..................................................... 83
Figure 30 Daily graph Kristinehamn - Kil ...................................................................................... 89
5e
www.balticloop.eu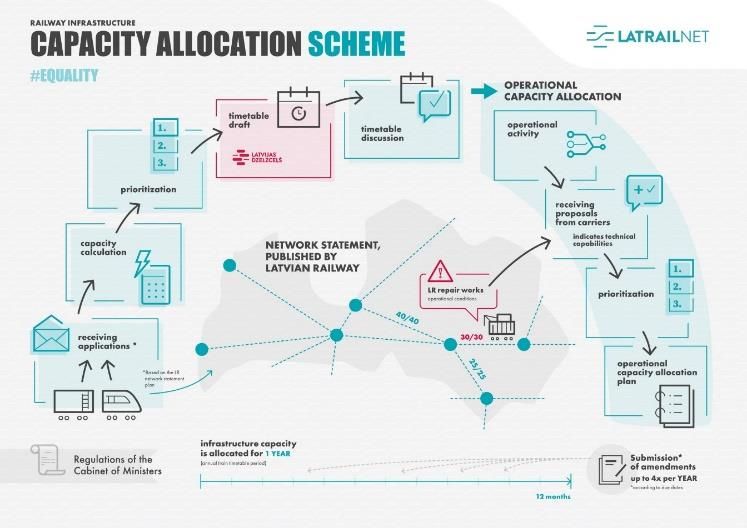
Study of Travel times in public transport on                                                                                                    06/2021
selected nodes in Sweden, Finland, Estonia
and Latvia

Table 1 Addition Running times in Sweden ................................................................................. 13
Table 2 Nodes in Sweden ................................................................................................................... 14
Table 3 Size of Node Supplement ................................................................................................... 14
Table 4 Distance between trains ...................................................................................................... 16
Table 5 Examples on different systems in Sweden that DAS-systems collects real-time
data from. ................................................................................................................................................. 30
Table 6 Several DAS-systems that are available on the market ........................................... 31
Table 7 Glossary of abbreviations for various technical systems in Sweden. .................. 31
Table 8 Improved performance factors that CATO is offering. ............................................. 32
Table 9 Summary of Tydal Systems products. ............................................................................ 36
Table 10 Additional suppliers and their products for automated systems in Europe. . 38
Table 11 Stations (with stop in the time table) along the line Helsinki – Tampere ....... 60
Table 12 Speed limitations on the line Tampere – Helsinki. (Railway Network Statement
2022, 2020) .............................................................................................................................................. 61
Table 13 Travel times for Helsinki-Tampere (Väylävirasto, 2020) ........................................ 61
Table 14 Travel times Helsinki-Salo-Turku (Väylävirasto, 2020) ........................................... 65
Table 15 Speed limitations on the route Tampere – Pori (Railway Network Statement
2022, 2020) .............................................................................................................................................. 66
Table 16 Railway traffic Tukums-Riga. Our observations from peak-hour timetable data
is given in brackets.                         (Source: JSC “Pasažieru vilciens” and ATD data via (AC
Konsultācijas, Ltd, 2021) complemented by WSP) .................................................................... 75
Table 17 Passenger train arrival schedule Riga-Valga, December 2019 ........................... 81
Table 18 Railway traffic Riga-Cesis, timetable data shown in brackets ............................. 82
Table 19: Intercity buses schedule Cesis-Smiltene .................................................................... 84

                                                                             6e

                                                                                                                   www.balticloop.eu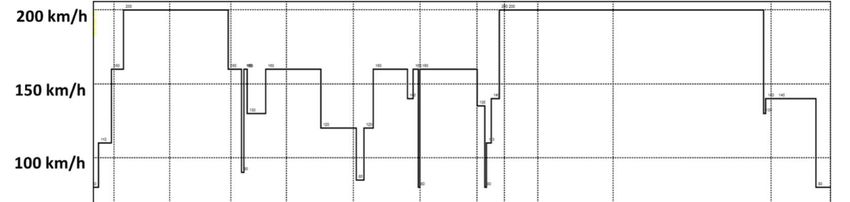
Study of Travel times in public transport on 06/2021
selected nodes in Sweden, Finland, Estonia
and Latvia
Introduction
Region Örebro is a partner in the EU-funded Baltic Loop project, which consists of
regions along the corridor The Northern Growth Zone (Örebro – Stockholm – Helsinki
/ Riga / Tallinn – St. Petersburg). The purpose of the project is to identify bottlenecks
in the transport system and develop solutions to minimize travel and freight times for
passengers and goods, and contribute to reducing emissions.
During the spring of 2021, WSP, on behalf of Region Örebro, mapped and analyzed
various digital and automated working methods that could contribute to shorter travel
times in public transport. A number of different nodes, both along the railway and with
other public transport, in Sweden, Finland, Estonia and Latvia have been analyzed from
a travel time perspective. Current train planning processes and railway operations in
the four countries have been analyzed to get an idea of how much extra time is applied
in timetable construction, and whether this time could be removed by applying one or
several of the digital and automated working methods that have been mapped.
Studied nodes
In the study, the following nodes have been studied
Primary nodes:
Oslo - Örebro - Stockholm (Sweden)
Helsinki - Salo – Turku (Finland)
Tallinn - Narva (Estonia)
Tukums - Riga (Latvia)
Secondary nodes:
Kopparberg - Lindesberg - Örebro (Sweden)
7e
www.balticloop.euStudy of Travel times in public transport on 06/2021
selected nodes in Sweden, Finland, Estonia
and Latvia
Katrineholm - Eskilstuna - Västerås (Sweden)
Helsinki - Tampere (Finland)
Riga – Cesis (Latvia)
Tertiary nodes:
Örebro – Askersund (Sweden)
Örebro – Hällefors (Sweden)
Turku – Pori (Finland)
Cesis – Smiltene (Latvia)
Obstacles in the investigation
In the data collection, we have encountered some difficulties in obtaining sufficient
information regarding traffic in Estonia and Latvia, as these countries do not provide
as much open information as Sweden and Finland.
We have also encountered some difficulties in finding information about traffic
management systems, as these have in recent years been given a higher protection
rating.
Conclusions in brief
The report's conclusions are briefly described here. Detailed conclusions can be found
in the chapter Conclusions
Both Sweden and Finland have regulations regarding extra redundancy in
timetable construction. The supplement for redundancy is calculated differently,
and is therefore difficult to compare, but based on the primary nodes in Sweden
8e
www.balticloop.euStudy of Travel times in public transport on 06/2021
selected nodes in Sweden, Finland, Estonia
and Latvia
and Finland, we have been able to conclude that Finland has more redundancy
than Sweden per travel minute.
There are a number of driver support systems on the market that could reduce
travel time in public transport, as traffic can be planned more frequently through
more detailed driving information for train drivers.
In the case of timetable construction, a simulator could possibly be used to find
efficiency possibilities in travel time.
It would also be possible to reduce travel time through a number of measures
that do not require digital aids - however, these measures come with certain
consequences that need to be taken into account - see Conclusions.
The purpose of most of the redundancy in the timetable is to compensate for
quality deficiencies in the railway system. By reducing margins without investing
in the railway system, there is a risk of increased disturbance sensitivity.
9e
www.balticloop.euStudy of Travel times in public transport on 06/2021
selected nodes in Sweden, Finland, Estonia
and Latvia
Train planning process and Traffic management systems in Sweden,
Finland, Estonia and Latvia
This section describes the train planning process and traffic management systems in
the four countries Sweden, Finland, Estonia and Latvia. The train planning process
describes, among other things, allocation of capacity, prioritization rules, guidelines
regarding timetable construction and practice in timetable construction. Current traffic
management systems describe how the technical systems for traffic management work
and may affect capacity.
As Sweden and Finland provide more open data than Estonia and Latvia, the
descriptions of Sweden's and Finland's railway network are more detailed than the
descriptions of Estonia's and Latvia's railway network.
Sweden
The Swedish Transport Administration's allocation process
Allocation of capacity on the state tracks in Sweden is made by the Swedish Transport
Administration. At the beginning of each year, the railway companies apply for their
desired capacity in the coming timetable. The Swedish Transport Administration's
traffic planner combines the various wishes and creates a draft timetable based on the
railway companies' wishes, in combination with current guidelines.
In the event of conflicts in the timetable making, the railway companies are urged to
coordinate a solution together. If the railway companies themselves cannot agree on a
solution, a new attempt is made for consultation together with the Swedish Transport
Administration. If the timetable conflict still cannot be resolved, the Swedish Transport
Administration declares the line congested. This gives the Swedish Transport
10e
www.balticloop.euStudy of Travel times in public transport on 06/2021
selected nodes in Sweden, Finland, Estonia
and Latvia
Administration the opportunity to prioritize the transport that has the greatest societal
benefit.
The train schedule will be determined at the end of September, and in December the
new timetable will come into force (Swedish Transport Administration, 2021c).
Figure 2 The Swedish Transport Administration's process description of the allocation process.
Timetable construction
When the Swedish Transport Administration's traffic planners construct timetables,
they have a number of different aspects to take into account. The running time is
calculated to determine the time the train needs from its departure station to its final
11e
www.balticloop.euStudy of Travel times in public transport on 06/2021
selected nodes in Sweden, Finland, Estonia
and Latvia
station. When planning, traffic planners also take other trains on the line into account
by ensuring that the train schedule follows the Swedish Transport Administration's
guidelines for tightness between trains (Swedish Transport Administration, 2020a).
Running times
When calculating the running time, the traffic planner takes into account the aspects
in the table below.
Addition Description
Base time Running time calculated on the train and track
performance.
Track work supplement A supplement that allows extra running time due to
speed reduction that is not calculated in the basic
running time.
Congestion surcharge A congestion supplement provides extra running time
as other traffic activities prevent the train from being
driven according to the train's performance.
Node extension A node addition provides increased redundancy in the
timetable so that a train can keep its timetable even if
the train is run on a different track than planned (for
example, right-hand tracks or deviating main tracks).
Retardation supplement A supplement of 90 seconds will be added for freight
trains at the starting point, at the change of driver and
after a break for uncoupling and coupling of wagons.
Supplement for deviating Trains that are planned on deviating main tracks are
main tracks provided with a time supplement that compensates for
this.
12e
www.balticloop.euStudy of Travel times in public transport on 06/2021
selected nodes in Sweden, Finland, Estonia
and Latvia
Rounding When constructing a timetable, the time is given in
minutes and seconds. The Swedish Transport
Administration's traffic planning system Trainplan
rounds the time down to a full minute in the published
timetable.
Table 1 Addition Running times in Sweden
(Swedish Transport Administration, 2020a)
The node extension
The purpose of the node addition is to create increased redundancy in the timetable
and give the trains an increased opportunity to run in a minor delay, and thus not risk
losing their timetable channel. Along several different tracks, a number of operating
locations have been designated as nodes. This means that trains running between
these nodes receive an addition to the timetable. The nodes are described in Table 2
below (Swedish Transport Administration, 2015)
Path Nodes
Western main line Stockholm, Hallsberg, Gothenburg
Southern main line Stockholm, Mjölby, Alvesta, Malmö*
East coastline Mora, Borlänge, Sala, Stockholm
Svealandsbanan Stockholm, (Hallsberg)
Mälarbanan Stockholm, (Hallsberg)
West coastline Gothenburg, Förslöv / Markaryd, Malmö
Coast to coastline Gothenburg, Alvesta, Kalmar
Skånebanan/Blekinge kustbana Helsingborg, Hässleholm, Karlskrona
Värmlandsbanan Charlottenberg, Karlstad, Hallsberg
Norway / Vänernbanan Kornsjö, Gothenburg
13e
www.balticloop.euStudy of Travel times in public transport on 06/2021
selected nodes in Sweden, Finland, Estonia
and Latvia
Mittbanan Sundsvall, Ånge, Östersund, Storlien
North main line Gävle/Storvik, Ånge
The main line through upper Norrland Ånge, Vännäs, Boden
Malmbanan Boden, Gällivare, Riksgränsen
Botniabanan Sundsvall, Örnsköldsvik, Umeå
Other courses Departure and destination
Table 2 Nodes in Sweden
* Deviations occur for passenger traffic that passes more than two nodes.
The size of the supplements
Traveling trains
Vehicles with a maximum permitted 4 minutes between 2 nodes
speed of more than 180 km / h
Vehicles with a maximum permitted 3 minutes between 2 nodes
speed below 180 km / h
Trains shorter distance than one node 2 minutes
Arlanda express 1 minute between departure and final
station
Freight trains
Freight trains 2 minutes between 2 nodes
Freight trains shorter distance than 1 minute
one node
Table 3 Size of Node Supplement
(Swedish Transport Administration, 2015)
14e
www.balticloop.euStudy of Travel times in public transport on 06/2021
selected nodes in Sweden, Finland, Estonia
and Latvia
Increased redundancy in the timetables
In recent years, the Swedish Transport Administration has carried out analyzes of
redundancy on various tracks with timekeeping problems.
In 2019, an analysis of punctuality on the West main line was carried out, as traffic on
the line has suffered from punctuality problems for several years. During the analysis,
a number of critical points were identified where the trains risk ending up in the
wrong order, and thus risk ending up so far outside their channel that they do not
have the opportunity to recover before the final station. Critical points arise, for
example, where trains turn, for example in Gnesta where the commuter train crosses
the tracks on the main line when the train turns, and places where trains enter the
main line from connecting lines.
In connection with this analysis, new construction rules for timetables have been
introduced on the western main line. The new design rules mean, among other
things, that the node extensions are moved to the critical points along the main line,
and that the headway time1 is extended at critical points. This means that the trains
are spread out more during the day, as they can no longer run as tightly.
Theoretically, the new construction rules should not mean longer running times for
the trains, but in practice the running times can still be longer as the new
construction rules more clearly regulate breaks that in practice take longer than
planned (Swedish Transport Administration, 2019).
In 2016, new construction rules were introduced on Värmlandsbanan. It was then
decided that the timetables at, for example, train meetings must reflect the time
required in reality. The result of the new construction rules was that punctuality on
1
Tightness between trains
15e
www.balticloop.euStudy of Travel times in public transport on 06/2021
selected nodes in Sweden, Finland, Estonia
and Latvia
Värmlandsbanan increased for all train types between the timetable year 2016 and
2017 (Swedish Transport Administration, 2017).
Guidelines for tightness between trains
Guidelines for the minimum time between trains are calculated by the Swedish
Transport Administration with a headway analysis in the simulation tool Railsys.
Quality time is added for disturbances according to normal train operation, and
additional quality time may be relevant at critical nodes where crossing train paths
occur frequently.
The guidelines ensure that the time distance between two trains is long enough so
that the trains behind do not have to start braking before signals stop (Swedish
Transport Administration, 2020a).
Path Minimum distance between trains
Stockholm Central – Stockholm S 2 minutes
Stockholm S – Flemingsberg 3 minutes
(ytterspår)
Flemingsberg – Järna 3 minutes
Järna – Flen 4 minutes*
Flen – Hallsberg 4 minutes
Hallsberg – Laxå 3 minutes
Path Minimum distance when passing
Järna - Gothenburg 4 minutes
Table 4 Distance between trains
* At least 5 minutes after freight train
16e
www.balticloop.euStudy of Travel times in public transport on 06/2021
selected nodes in Sweden, Finland, Estonia
and Latvia
Traffic management system in Sweden
Until the summer of 2020, the traffic management system EBICOS TMS from
Bombardier was used at a number of operating locations along the Western Main
Line. Today, only the EBICOS 900 traffic management system is used on the state
railway network. In recent years, the traffic management system has received a higher
protection rating.
The sections Charlottenberg – Stockholm, Kopparberg – Lindesberg – Örebro, and
Katrineholm – Eskilstuna – Västerås are also remotely monitored in system H, which
means that the trains short-circuit the tracks as they pass and that their positions can
be followed by a train dispatcher on a traffic screen.
In connection with the introduction of NTL (National Train Management System),
there are intentions to switch to Alstom's traffic management system ICONIS.
Automatic
Integrated in the traffic management system EBICOS 900 is the TLS function, which
partially automates traffic management. In TLS, the trains 'routes are programmed
using the trains' train numbers. When a train number approaches a signal, TLS can
detect which train is coming and prepare the train path. This means that when the
trains run according to schedule, TLS can ensure that the train always has driving
signals far enough to not receive restrictive driving instructions in ATC2, but without
the train path becoming so long that other trains can be hindered. When the trains
depart from the timetable, however, this may mean that the TLS releases the trains in
2
Automatic Train Control
17e
www.balticloop.euStudy of Travel times in public transport on 06/2021
selected nodes in Sweden, Finland, Estonia
and Latvia
the wrong order, and therefore it is required that the Traffic Manager constantly
monitors the TLS and ensures that all trains run according to the timetable.
Finland
The Finnish railway market in change process
Train traffic in Finland is mainly operated by the state-owned VR Group. At the moment
VR’s passenger services is the only operator that offers public transport services in
long-distance and commuter traffic on rail. VR Transpoint is a logistics provider both
on rail and road and VR FleetCare offers rail fleet maintenance and lifecycle services.
Rail traffic has for long been based on the monopoly position of one operator, VR
Group, and therefore the planning and coordination and prioritization of capacity have
been carried out mainly on the basis of the operator's internal planning principles. In
recent years, the situation has partly changed, as company called Fenniarail has also
started to engage in freight transport and HSL has started to seek capacity for its own
traffic and take on a more controlling role in its planning in the Helsinki metropolitan
area. In addition to VR Group and Fenniarail, also Ratarahti Ltd and Aurorarail Ltd
operate with shift work at the railway yards. Operail Finland got licence and safety
certificate in June 2020 to act as an operator.
The Finnish railway market is currently changing. A concession agreement between the
Ministry of Transport and Communications and VR is valid in domestic passenger traffic
until 2024. Based on the agreement VR has the exclusive right to domestic passenger
traffic outside the HSL area3 on those line sections in which VR currently operates. In
future all railway companies with acceptable qualification to get infrastructure capacity
3
Helsinki-area Traffic
18e
www.balticloop.euStudy of Travel times in public transport on 06/2021
selected nodes in Sweden, Finland, Estonia
and Latvia
will be secured to have equal access to get the capacity for operating domestic
passenger traffic and for the use of railway network.
Later, due to the deregulation, there can be more operators on the network and their
needs for the use of track capacity may be in conflict with each other. The operating
environment of several railway undertakings requires new integrated working methods
for the planning and management of track capacity in order to ensure the quality of
traffic and a level playing field.
At present, there are few guidelines for rail traffic planning and the guidelines in use
are general. In practice the applicants for the track capacity have mostly determined
the planning principles they use and decided for themselves how they fit the trains of
their own traffic into a coherent whole when scheduling (Väylävirasto, 2020c).
Infrastructure capacity and train planning
The timetables are intended to be planned for the passenger transport as a one whole
so that different routes can form a working network of interchanges. The planning rules
are based mainly in the Railway Instructions for requesting infrastructure capacity but
in practice the expertise and the views of the planners have had a strong role in making
planning solutions.
Timetable planning of the freight transport has been based on the customers’
transportation needs and therefore the market situation of industry and trading and
changes of demand have largely affected to the timetable planning. The customer
needs of the freight transport are estimated to come in a shorter period of time in the
future and therefore the process of requesting the infrastructure capacity should be
developed to become more flexible (Väylävirasto, 2020b).
19e
www.balticloop.euStudy of Travel times in public transport on 06/2021
selected nodes in Sweden, Finland, Estonia
and Latvia
Allocation of infrastructure capacity
In Finland the Transport Infrastructure Agency Väylävirasto allocates infrastructure
capacity to operators operating on the state rail network. Transport Infrastructure
Agency publishes the Network Statement of Finland’s state-owned railway network for
each timetable period for applicants requesting for infrastructure capacity.
The requests for infrastructure capacity must be applied yearly latest eight months
ahead of the beginning of new timetable period. New infrastructure capacity or
changes in the capacity for the regular train services can be requested also during the
timetable period but the changes must not affect any changes to the infrastructure
capacity already allocated to other capacity applicants. The need of request for the ad
hoc capacity is important specially for the freight traffic.
The infrastructure of the rail network defines the constraints for the capacity that can
be applied. The infrastructure capacity in Finland is restricted by the mainly single-track
rail network. On the single-track network the meetings of the trains must be located in
the railway yards or in the meeting points.
In the allocation of infrastructure capacity takes into account, in particular, the needs
of passenger and freight traffic and track maintenance, as well as the efficient use of
the track network. In principle, all requests of infrastructure capacity will be met. In case
the allocation of infrastructure capacity can not be made in a way that meets the needs
of all applicants must the infrastructure manager announce certain part of the train
path congested (Väylävirasto, 2020b).
Current planning guidelines and practices
In Finland, the timetable planning guidelines are based both on the operators' own
guidelines and the instructions for requesting infrastructure capacity. The applicants of
infrastructure capacity have to use feature data of the railway network for the basis of
20e
www.balticloop.euStudy of Travel times in public transport on 06/2021
selected nodes in Sweden, Finland, Estonia
and Latvia
their timetable planning. The data is available for the applicants in track information
extranet websites.
The things to be taken into account according to the instructions for requesting
infrastructure capacity are:
Leeway, the extra time to be added to driving time and the distances between
the trains must be considered according to the instructions.
o In the current situation, it is recommended to use a 10 percent margin
for driving time planning, which means that the timetable is at least ten
percent slower compared to the theoretical maximum speed. For the
freight trains it is recommended to use even larger clearance.
Commuter tracks can use smaller margins, for example five percent
leeway to make the use of capacity more efficient.
o When the section blocking system is frequent, the trains can have four-
minute margins and the commuter trains even three-minute margins.
o The importance of careful planning of train encounters and passing
faster trains is emphasized in the design guide. The amounts of
required minutes for arriving early enough, waiting and departing are
given very strict.
The instructions of using the tracks in the traffic operating points
o The use of tracks is planned in connection with the change times of the
timetable period.
o The planning of the process of track using is under update to meet the
needs of the multi-operator environment.
The rolling stock used may also have features that affect timetable planning.
Although the majority of issues related to timetable planning are described in the
network statement or in the track data extranet, many details related to infrastructure
utilization are known only to experienced planners. This which means that all planners
have no access to the tacit information (Väylävirasto, 2020b).
21e
www.balticloop.euStudy of Travel times in public transport on 06/2021
selected nodes in Sweden, Finland, Estonia
and Latvia
Estonia
Traffic Management System
The Estonian railway network is a mostly single-rail network managed by two state-
owned companies. The railways from Tallinn directly to the south all the way to Pärnu
and Viljandi are manged by Edelaraudtee (eng. Southern railways), while the rest of
the network is managed by Estonian Railways (Eesti Raudtee). The only double-track
section in the country is an East-West line from the western suburbs of Tallin to Tapa,
where the lines to St. Petersburg and Tartu/Latvia diverge.
Figure 3 Map of the Estonian railway network with blue lines indicating lines owned and managed by Estonian Railways
(Eesti Raudtee) and green indicating the lines of Edelaraudtee (Southern Railways).
22e
www.balticloop.euStudy of Travel times in public transport on 06/2021
selected nodes in Sweden, Finland, Estonia
and Latvia
The management of train traffic on the infrastructure of Estonian Railways occurs
through train dispatchers, which are organized for four areas:
Tallin-Tapa,
Tapa-Narva,
Tapa-Koidula and
Tartu-Valka & Tallin-Paldiski.
The signaling system used by Estonian Railways is automatic for most of the network,
including Tallin-Narva. Some tracks use a semi-automatic signaling system. The train
control system in Estonia resembles other countries formerly under soviet rule, which
is ALSN. Most of the technical traffic management systems of Estonian railways are
vastly outdated (dating from sixties, seventies and eighties), and require renewal in
the near future (Eesti Raudtee, 2020).
Train Planning Process
Railway capacity on the Estonian railway network is allocated by the infrastructure
managers: Estonian Railways and Edelaraudtee. The following description is based
only on the planning process of Estonian Railways. The timetable is planned yearly,
and the first deadline for applicants to apply for railway capacity is 9 months before
the next timetable period. The timetables change every December. The draft decision
of capacity allocation is made 7 months before the implementation of the next
timetable.
If the train planning process cannot yield timetables which would be possible to fulfill
and meet the requests of the applicants, Estonian Railways will organize a
coordination process to develop the requests of the applicants so that all train paths
could be provided. If the process cannot produce results that satisfy all applicants,
Estonian Railways will declare the rail line in question congested and continue to
prioritize traffic according to a set of priorities. If there are still conflicts after the
priorities have been sorted, the remaining train paths will be settled with an auction
23e
www.balticloop.euStudy of Travel times in public transport on 06/2021
selected nodes in Sweden, Finland, Estonia
and Latvia
among the applicants. The capacity will be given to the applicant with the highest
bid.
The planning process of Estonian Railways is subject to the Railways Act of Estonia,
which sets out the priorities Estonian Railways must follow. According to the law,
priority is given to passenger trains with a direct international connection. The
secondary priority is then given to domestic passenger trains.
Estonian Railways coordinated their timetable planning process with their
counterparts in Latvia and Russia, to ensure that train paths continue through the
borders of countries (Eesti Raudtee, 2020).
Latvia
Traffic Management System
The railways of Latvia are mostly managed by an interlocking system and automatic
locking system with dispatcher centralization. In Latvia there are two centralized
traffic control centers in Riga and Daugavpils. A handful of rail sections around the
capital region are equipped with an automatic locking system, as well as some
sections with a semi-automatic locking system. The train control system used in
Latvia is ALSN (Continuous Automatic Train Signaling), which is used widely on the
main lines of the ex-Soviet states.
Only a minor portion of the infrastructure is electrified. The maximum permitted
speed for passenger trains is 120 km/h and up to 90 km/h for freight trains. These
speed limits are based on the limitations of the traffic control systems (Latvijas
dzelzceļš, 2020).
24e
www.balticloop.euStudy of Travel times in public transport on 06/2021
selected nodes in Sweden, Finland, Estonia
and Latvia
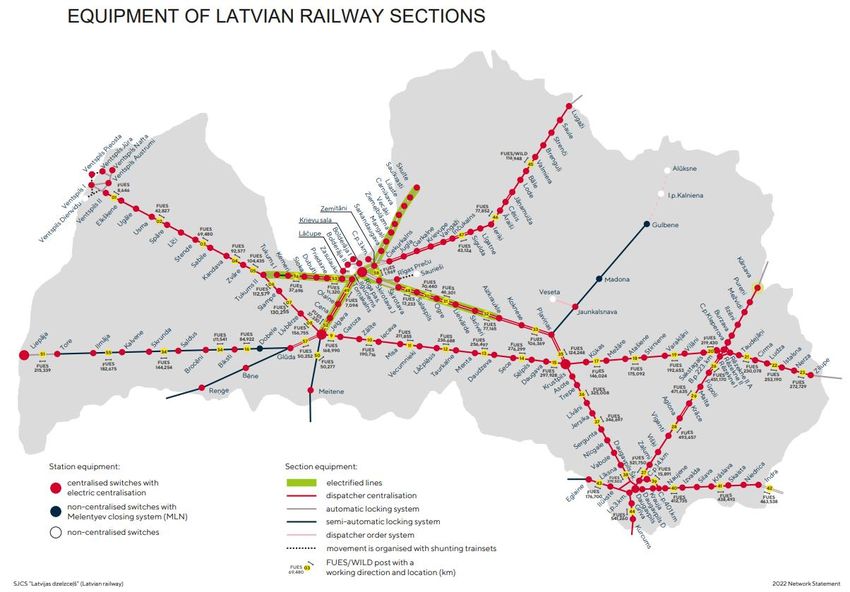
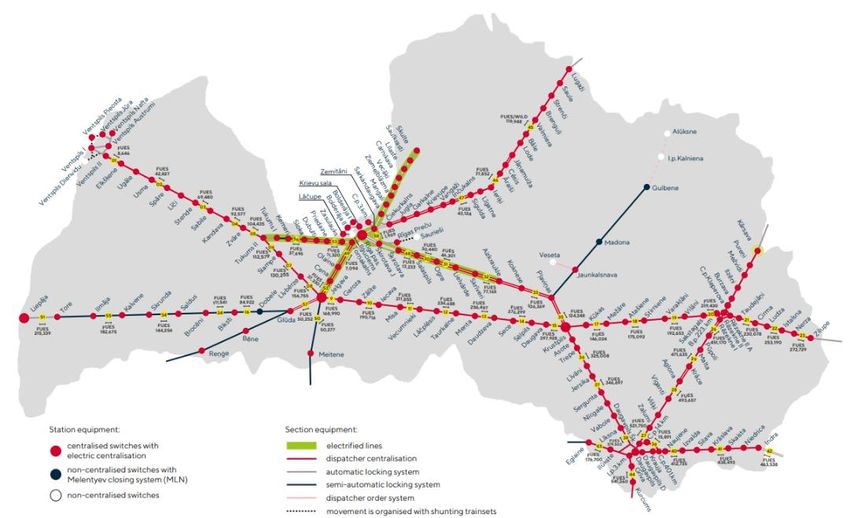
Figure 4 Infrastructure equipment of railways in Latvia.
Train Planning Process
Capacity of public railways in Latvia is allocated by LatRailNet (LRN), which is a
subsidiary of the state-owned company Latvian Railways (Latvijas dzelzceļš, LDz). LDz
is the manager of public railway infrastructure in Latvia, and the subsidiary LRN
assumes many of these tasks: decision making on capacity allocation and train path
assignment, including both the determination and assessment of accessibility and the
allocation of individual train paths and decision-making on infrastructure charging,
including the determination and collection of the charges.
LRN allocated railway capacity with a yearly timetable starting from the second
Sunday of December. The timetable is build based on the requests of different
operators during the previous year. The initial applications of different carries are to
be submitted to LRN by May 15th of each year, after which LRN makes the decision
on infrastructure capacity allocation and approves the infrastructure capacity
allocation plan for the next capacity allocation period by July 15th. LRN produces a
draft schedule by October 15th. During the scheduling applicants can modify their
25e
www.balticloop.euStudy of Travel times in public transport on 06/2021
selected nodes in Sweden, Finland, Estonia
and Latvia
applications or submit late ones, but they can only be fulfilled to the extent that they
do not burden other applications.
Figure 5 The railway capacity allocation scheme of Latvia.
In the timetable planning process LRN aims to allow all capacity applications by
resolving conflicts with coordinating the applications to not interfere with one another.
If this is not possible and infrastructure capacity is exceeded, LRN offer applicants
different train paths or ask the applicants to modify their applications accordingly. If
applicants do not agree to modify their infrastructure capacity applications, then the
dispute settlement procedure can be applied. In this case, the relevant part of railway
infrastructure is declared congested.
The planning process of LRN is subject to the Railway Act of Latvia, which sets out the
priorities LRN must follow. According to the law, priority shall be given to
those railway transport services which are provided on the basis of a state or
local government railway transport contract,
railway transport supporting foreign or national armed forces,
26e
www.balticloop.euStudy of Travel times in public transport on 06/2021
selected nodes in Sweden, Finland, Estonia
and Latvia
services which are provided in full or in part, using the state public railway
infrastructure intended or built for special purposes (high-speed, freight and
similar transport).
(LatRailNet, 2020)
27e
www.balticloop.euStudy of Travel times in public transport on 06/2021
selected nodes in Sweden, Finland, Estonia
and Latvia
Data-driven and automated methods in operation
Driver Advisory Systems
There are today several developed Driver Advisory Systems (DAS) on the railway
market, where several of them have been put into operation to various levels, both in
Sweden and internationally. A DAS-system’s main task, in a broader sense, is to
optimize the driving by giving the driver advice on optimal speed and acceleration at
any given time during operation. By optimizing these, the system can give positive
effects regarding, for example:
- Reduced energy consumption
- Increased efficiency
- Reduced maintenance / wear
- Increased comfort
- Strengthened train guidance / capacity
- Increased flexibility (as real-time traffic planning takes place)
There are three different variants of DAS:
1) Standalone Driver Advisory System (S-DAS)
2) Connected Driver Advisory System (C-DAS)
3) Automatic Train Operation (ATO)
The most basic level is Standalone Driver Advisory System (S-DAS) as it does not have
or only have one-way communication with e.g. a traffic management system. With the
more advanced D-DAS, the traffic management is instead connected to the driver in a
transponder system, which can be compared to that used for aviation traffic
information systems (Swedish Transport Administration, 2020c). As C-DAS
continuously communicates with the traffic management system, different
28e
www.balticloop.euStudy of Travel times in public transport on 06/2021
selected nodes in Sweden, Finland, Estonia
and Latvia
recommendations are given to the driver depending on other traffic in the system. In
reality, this means that the long-distance train dispatcher exchanges his paper graph4
for a digital graph in the STEG system (in Sweden), where the traffic is planned as usual,
but the decisions made by the train dispatcher are sent digitally to the driver’s screen.
In this way, the information between the train dispatcher and the driver becomes
immediately available to those who need it, e.g. if train meetings are added, cancelled
or rescheduled at the same time as the driver will have recommended speeds to relate
to in order for traffic to flow smoothly, punctually and according to the timetable re-
designed in real time.
The last step, ATO, is a system for automatic running of trains, but from a driver support
system perspective, the difference between ATO and C-DAS can be very small. Driver
support systems should not be confused with supplementary safety systems and do
not have a dependency on them as systems such as Automatic Train Control (ATC),
Automatic Train Protection (ATP) and ERTMS handle these.
Driver support systems can have different levels of integration in the vehicles, where
above all either the app in smart phones / tablets, screen in the driver's desk or
communication with the TCMS system or stand-alone are the most common. All DAS
systems use their own servers in one way or another and rely on data from different
data sources. Table 5 illustrates examples of such sources.
4
Graph - A graphical timetable used by traffic managers when planning. Available in paper format or
digitally.
29e
www.balticloop.euStudy of Travel times in public transport on 06/2021
selected nodes in Sweden, Finland, Estonia
and Latvia
Data source Description
Ban Information System Database that contains information about the
(BIS) infrastructure, objects (such as number of switches,
bridges, platforms, etc.) as well as information about
slopes, speeds, etc.
Körorder Contains information for the train driver with orders for
the specific train, e.g. temporary speed reductions,
changes to the track that are not entered in the line
book, etc.
Linjeböcker Contains a description of the infrastructure from a
traffic safety perspective for primarily passengers.
Tågpositioneringsssystem Collects train passages and planned carriageways from
(TPOS) traffic management systems and provides the
information to other systems.
UTIN Collects and provides railway-related information from
various data sources within the Swedish Transport
Administration and provides this as XML files.
Table 5 Examples on different systems in Sweden that DAS-systems collects real-time data from.
In Table 6, several DAS-systems that are available on the market is presented.
System Supplier Installation
CATO Transrail Tågkompaniet (2017 – )
Arlanda Express (2015-2016)
Malmbanan (2012 – 2016)
Helsinki metro (2018 - )
30e
www.balticloop.euStudy of Travel times in public transport on 06/2021
selected nodes in Sweden, Finland, Estonia
and Latvia
System, App and Tydal Systems Hagalunds bangård, SJ AB, Hector
Webb Rail, Arlanda Express
Cubris Cubris DSB (Danmark), Öresundståg,
Greenspeed Krösatågen (nord och syd), Kustpilen
(2015 - )
Table 6 Several DAS-systems that are available on the market
Below is a more detailed description of each system as well as a glossary of
abbreviations that will appear continuously in the text, see Table 7 below.
Förkortning System
DAS Driver Advisory System
S-DAS Standalone Driver Advisory System
C-DAS Connected Driver Advisory System
ATO Automatic Train Operation
ATC Automatic Train Control
ATP Automatic Train Protection
BIS Ban Informations System
TPOS Train Positioning System
ICC Intelligent Cruise Control
COB Cato Onboard
CTS Cato Trackside
CATO Computer Aided Train Operation
BIS Ban Information System
Table 7 Glossary of abbreviations for various technical systems in Sweden.
31e
www.balticloop.euStudy of Travel times in public transport on 06/2021
selected nodes in Sweden, Finland, Estonia
and Latvia
Transrail (CATO)
Computer Aided Train Operation, Cato, is a system developed by Transrail (originally
together with Uppsala University and Banverket / Trafikverket) with the aim of meeting
the demand for improved and more coordinated traffic control through driver support
systems in trains. This is achieved through a central traffic control that adjusts the flow
of the trains so that they follow a certain timekeeping and at the same time run more
energy efficiently.
The system was introduced in 2014 and today covers functions such as C-DAS,
Intelligent Cruise Control (ICC) and ATO. In 2018, Cato was the only C-DAS system on
the Swedish market. The system offers improved performance linked to a set of factors,
see Table 8 below.
Factor Description
Punctuality Trains on time at second level throughout the journey
Increased traffic Small impact in the event of disruptions in the daily operations,
capacity high and stable resource ultilization
Environment Reduced energy consumption and emissions
Customer Good time management, improved information about the
satisfaction traffic, and increased awareness for the staff
Economy Lower costs and increased revenues
Table 8 Improved performance factors that CATO is offering.
The Cato system consists of several different subsystems and functions but is based on
a computer in the vehicle that communicates with a monitor, either fixed or loose
(reading tablet). It is based on a mathematical model (a “Digital Twin”) that includes
the train, the infrastructure (incl. Signal system), the timetable (preferably the real-time
traffic plan) and the movements of other trains. The system then uses this data to make
32e
www.balticloop.euYou can also read