Scotiabank Mining Conference - December 1, 2020
←
→
Page content transcription
If your browser does not render page correctly, please read the page content below
Scotiabank Mining Conference
                  December 1, 2020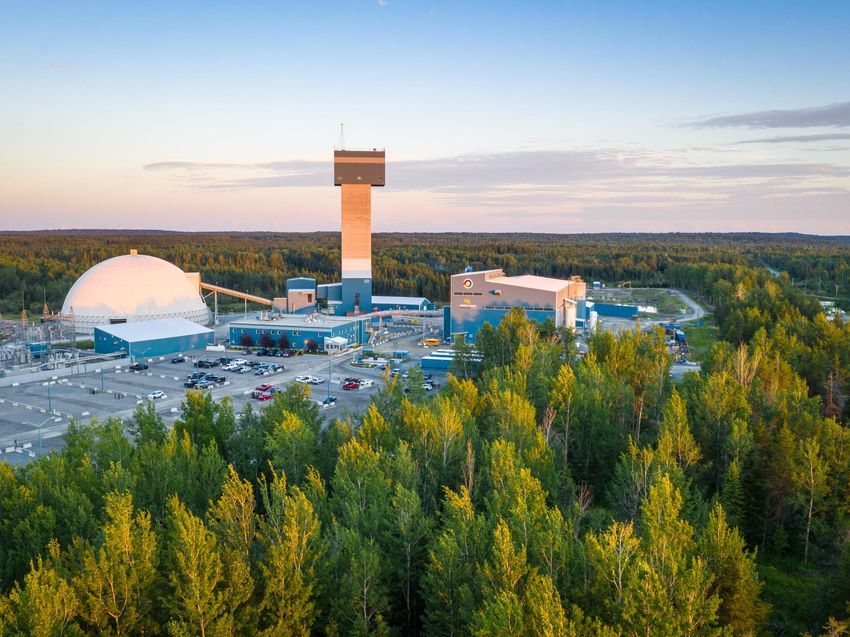
Forward Looking Statements
The information in this presentation has been prepared as at November 30, 2020. Certain statements contained in this presentation constitute "forward-looking statements" within the meaning of the United States
Private Securities Litigation Reform Act of 1995 and "forward-looking information" under the provisions of Canadian provincial securities laws and are referred to herein as "forward-looking statements". When used in
this presentation, the words "anticipate", "could", "estimate", "expect", "forecast", "future", "plan", "possible", "potential", "will" and similar expressions are intended to identify forward-looking statements. Such
statements include, without limitation: statements regarding the Company's plans to ramp-up and optimize operations following temporary suspensions of operations related to the COVID-19 pandemic, including the
timing thereof and impacts on anticipated gold production and costs; statements regarding the impact of the COVID-19 pandemic and measures taken to reduce the spread of COVID-19 on the Company’s
operations, including its employees and overall business; the Company's forward-looking production guidance, including estimated ore grades, recovery rates, project timelines, drilling results, metal production, life of
mine estimates, total cash costs per ounce, all-in sustaining costs per ounce, minesite costs per tonne, other expenses, cash flows and free cash flow; the estimated timing and conclusions of technical studies and
evaluations; the methods by which ore will be extracted or processed; statements concerning the Company's expansion plans at Kittila, Meliadine Phase 2 and the Amaruq underground project and the Company's
ramp-up of operations at Meliadine and Amaruq, including the timing, funding, completion and commissioning thereof; statements concerning other expansion projects, recovery rates, mill throughput, optimization
and projected exploration, including costs and other estimates upon which such projections are based; statements regarding timing and amounts of capital expenditures, other expenditures and other cash needs, and
expectations as to the funding thereof; estimates of future mineral reserves, mineral resources, mineral production and sales; the projected development of certain ore deposits, including estimates of exploration,
development and production and other capital costs and estimates of the timing of such exploration, development and production or decisions with respect to such exploration, development and production; estimates
of mineral reserves and mineral resources and the effect of drill results on future mineral reserves and mineral resources; statements regarding the Company's ability to obtain the necessary permits and
authorizations in connection with its proposed or current exploration, development and mining operations and the anticipated timing thereof; statements regarding anticipated future exploration; the anticipated timing
of events with respect to the Company's mine sites; statements regarding the sufficiency of the Company's cash resources; and statements regarding anticipated trends with respect to the Company's operations,
exploration and the funding thereof. Such statements reflect the Company's views as at the date of this presentation and are subject to certain risks, uncertainties and assumptions, and undue reliance should not be
placed on such statements. Forward-looking statements are necessarily based upon a number of factors and assumptions that, while considered reasonable by Agnico Eagle as of the date of such statements, are
inherently subject to significant business, economic and competitive uncertainties and contingencies. The material factors and assumptions used in the preparation of the forward looking statements contained herein,
which may prove to be incorrect, include, but are not limited to, the assumptions set forth herein and in management's discussion and analysis ("MD&A") and the Company's Annual Information Form ("AIF") for the
year ended December 31, 2019 filed with Canadian securities regulators and that are included in its Annual Report on Form 40-F for the year ended December 31, 2019 ("Form 40-F") filed with the U.S. Securities
and Exchange Commission (the "SEC") as well as: that governments, the Company or others do not take additional measures in response to the COVID-19 pandemic or otherwise that, individually or in the
aggregate, materially affect the Company’s ability to operate its business; that cautionary measures taken in connection with the COVID-19 pandemic do not affect productivity; that measures taken relating to, or
other effects of, the COVID-19 pandemic do not affect the Company's ability to obtain necessary supplies and deliver them to its mine sites; that there are no significant disruptions affecting operations; that
production, permitting, development, expansion and the ramp up of operations at each of Agnico Eagle's properties proceeds on a basis consistent with current expectations and plans; that the relevant metal prices,
foreign exchange rates and prices for key mining and construction supplies will be consistent with Agnico Eagle's expectations; that Agnico Eagle's current estimates of mineral reserves, mineral resources, mineral
grades and metal recovery are accurate; that there are no material delays in the timing for completion of ongoing growth projects; that seismic activity at the Company's operations at the LaRonde Complex and other
properties is as expected by the Company; that the Company's current plans to optimize production are successful; and that there are no material variations in the current tax and regulatory environment. Many
factors, known and unknown, could cause the actual results to be materially different from those expressed or implied by such forward looking statements. Such risks include, but are not limited to: the extent and
manner to which COVID-19, and measures taken by governments, the Company or others to attempt to reduce the spread of COVID-19, may affect the Company, whether directly or through effects on employee
health, workforce productivity and availability (including the ability to transport personnel to the Meadowbank Complex and Meliadine mine which operate as fly-in/fly-out camps), travel restrictions, contractor
availability, supply availability, ability to sell or deliver gold dore bars or concentrate, availability of insurance and the cost thereof, the ability to procure inputs required for the Company's operations and projects or
other aspects of the Company's business; uncertainties with respect to the effect on the global economy associated with the COVID-19 pandemic and measures taken to reduce the spread of COVID-19, any of which
could negatively affect financial markets, including the trading price of the Company's shares and the price of gold, and could adversely affect the Company's ability to raise capital; the volatility of prices of gold and
other metals; uncertainty of mineral reserves, mineral resources, mineral grades and mineral recovery estimates; uncertainty of future production, project development, capital expenditures and other costs; foreign
exchange rate fluctuations; financing of additional capital requirements; cost of exploration and development programs; seismic activity at the Company's operations, including the LaRonde Complex; mining risks;
community protests, including by First Nations groups; risks associated with foreign operations; governmental and environmental regulation; the volatility of the Company's stock price; and risks associated with the
Company's currency, fuel and by-product metal derivative strategies. For a more detailed discussion of such risks and other factors that may affect the Company's ability to achieve the expectations set forth in the
forward-looking statements contained in this presentation, see the AIF and MD&A filed on SEDAR at www.sedar.com and included in the Form 40-F filed on EDGAR at www.sec.gov, as well as the Company's other
filings with the Canadian securities regulators and the SEC. Other than as required by law, the Company does not intend, and does not assume any obligation, to update these forward-looking statements.
Currency
All amounts in this presentation are expressed in U.S. dollars except as otherwise noted.
Further Information
For further details on Agnico Eagle’s third quarter 2020 results, please see the Company's news release dated October 28, 2020.
Front Cover
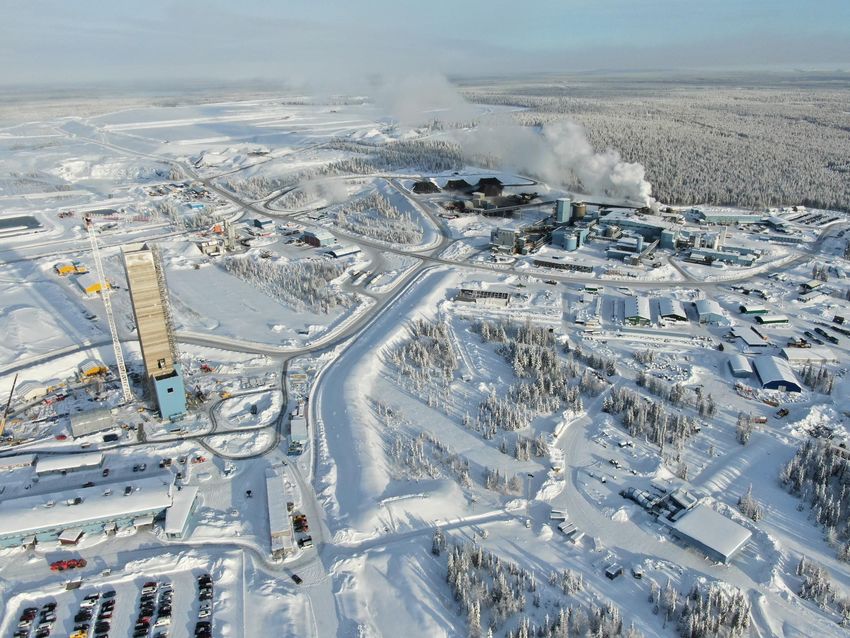
Agnico Eagle’s Kittila mine located in northern Finland, taken in April 2020.
Scotiabank Mining Conference 2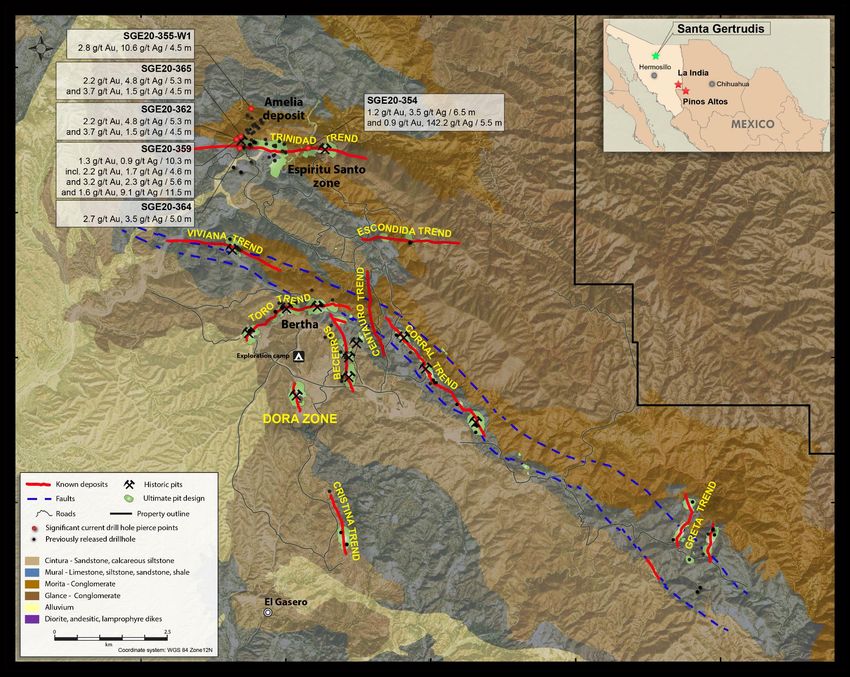
Notes to Investors
Note Regarding the Use of Non-GAAP Financial Measures
This presentation discloses certain measures, including "total cash costs per ounce", "all-in sustaining costs per ounce“, "minesite costs per tonne“, "operating margin" and “free cash-flow” that are
not standardized measures under IFRS. These measures may not be comparable to similar measures reported by other gold mining companies. For a reconciliation of these measures to the most
directly comparable financial information reported in the consolidated financial statements prepared in accordance with IFRS and for an explanation of how management uses these measures, see
"Non-GAAP Financial Performance Measures" in the MD&A filed on SEDAR at www.sedar.com and included in the Form 6-K filed on EDGAR at www.sec.gov, as well as the Company's other filings
with the Canadian securities regulators and the SEC.
The total cash costs per ounce of gold produced is reported on both a by-product basis (deducting by-product metal revenues from production costs) and co-product basis (without deducting by-
product metal revenues). Unless otherwise specified total cash costs per ounce of gold produced is reported on a by-product basis in this presentation. The total cash costs per ounce of gold
produced on a by-product basis is calculated by adjusting production costs as recorded in the consolidated statements of income (loss) for by-product revenues, inventory production costs, smelting,
refining and marketing charges and other adjustments, and then dividing by the number of ounces of gold produced. The total cash costs per ounce of gold produced on a co-product basis is
calculated in the same manner as the total cash costs per ounce of gold produced on a by-product basis except that no adjustment is made for by-product metal revenues. Accordingly, the
calculation of total cash costs per ounce of gold produced on a co-product basis does not reflect a reduction in production costs or smelting, refining and marketing charges associated with the
production and sale of by-product metals. The total cash costs per ounce of gold produced is intended to provide information about the cash-generating capabilities of the Company's mining
operations. Management also uses this measure to monitor the performance of the Company's mining operations. As market prices for gold are quoted on a per ounce basis, using the total cash
costs per ounce of gold produced on a by-product basis measure allows management to assess a mine's cash-generating capabilities at various gold prices.
All-in sustaining costs per ounce ("AISC") is used to show the full cost of gold production from current operations. The Company calculates all-in sustaining costs per ounce of gold produced on a
by-product basis as the aggregate of total cash costs on a by-product basis, sustaining capital expenditures (including capitalized exploration), general and administrative expenses (including stock
options), lease payments related to sustaining assets and reclamation expenses, and then dividing by the number of ounces of gold produced. The all-in sustaining costs per ounce of gold produced
on a co-product basis is calculated in the same manner as the all-in sustaining costs per ounce of gold produced on a by-product basis, except that the total cash costs per ounce on a co-product
basis are used, meaning no adjustment is made for by-product metal revenues. Management is aware that these per ounce measures of performance can be affected by fluctuations in foreign
exchange rates and, in the case of total cash costs per ounce of gold produced on a by-product basis, by-product metal prices. Management compensates for these inherent limitations by using
these measures in conjunction with minesite costs per tonne (discussed below) as well as other data prepared in accordance with IFRS. The World Gold Council ("WGC") is a non-regulatory market
development organization for the gold industry. Although the WGC is not a mining industry regulatory organization, it has worked closely with its member companies to develop relevant non-GAAP
measures. The Company follows the guidance on all-in sustaining costs released by the WGC in November 2018. Adoption of the all-in sustaining costs metric is voluntary and, notwithstanding the
Company's adoption of the WGC's guidance, all-in sustaining costs per ounce of gold produced reported by the Company may not be comparable to data reported by other gold mining companies.
The Company believes that this measure provides helpful information about operating performance. However, this non-GAAP measure should be considered together with other data prepared in
accordance with IFRS as it is not necessarily indicative of operating costs or cash flow measures prepared in accordance with IFRS.
Minesite costs per tonne are calculated by adjusting production costs as recorded in the consolidated statements of income (loss) for inventory production costs and other adjustments, and then
dividing by tonnes of ore processed. As the total cash costs per ounce of gold produced can be affected by fluctuations in by product metal prices and foreign exchange rates, management believes
that minesite costs per tonne provide additional information regarding the performance of mining operations, eliminating the impact of varying production levels. Management also uses this measure
to determine the economic viability of mining blocks. As each mining block is evaluated based on the net realizable value of each tonne mined, in order to be economically viable the estimated
revenue on a per tonne basis must be in excess of the minesite costs per tonne. Management is aware that this per tonne measure of performance can be impacted by fluctuations in processing
levels and compensates for this inherent limitation by using this measure in conjunction with production costs prepared in accordance with IFRS.
Operating margin is not a recognized measure under IFRS and this data may not be comparable to data presented by other gold producers. This measure is calculated by excluding the following
from net income as recorded in the condensed interim consolidated financial statements: Income and mining taxes expense; Other expenses (income); Foreign currency translation loss (gain); Gain
(loss) on derivative financial instruments; Finance costs; General and administrative expenses; Amortization of property, plant and mine development; Exploration and corporate development
expenses; and Impairment losses (reversals). The Company believes that operating margin is a useful measure that represents the operating performance of its mines associated with the ongoing
production and sale of gold and by-product metals. Management uses this measure internally to plan and forecast future operating results. This measure is intended to provide investors with
additional information about the Company’s underlying operating results and should be evaluated in conjunction with other data prepared in accordance with IFRS.
Free cash flow is calculated by deducting additions to property, plant and mine development from cash provided by operating activities including changes in non-cash working capital balances.
Management uses free cash flow to assess the availability of cash, after funding operations and capital expenditures, to operate the business without additional borrowing or drawing down on the
Company's existing cash balance.
Note Regarding Production Guidance
The gold production guidance is based on the Company's mineral reserves but includes contingencies and assumes metal prices and foreign exchange rates that are different from those used in the
mineral reserve estimates. These factors and others mean that the gold production guidance presented in this presentation does not reconcile exactly with the production models used to support
these mineral reserves.
                                                                                                                                                                  Scotiabank Mining Conference            3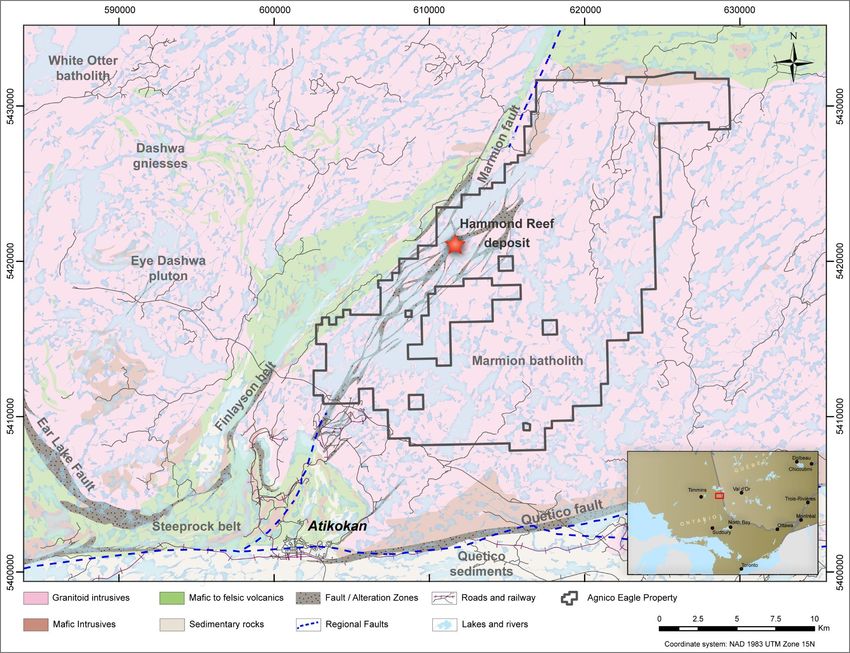
Gold Price Outlook – Trend is Positive
Gold Started a New Bull Market in 2016

                                                   Bull   $2063   Bullish factors for gold:
         Bear                        Bull   Bear
2000
                                                                     1. The normalization of monetary
                                                          $1897
                                                                        policy has failed
                                                                     2. Central Bank policies expected to
                                                                        remain aggressively stimulative
1500                                                                 3. The US Fed is targeting higher
                                                                        inflation; other central banks are
                                                                        expected to follow suit
                                                                     4. Global debt crisis is building,
                                                          $1049         limiting Central Banks ability to
1000
                                                                        combat inflation in the future
                                                                     5. Higher inflation combined with low
                                                                        interest rates should keep real rates
                                                                        negative for a longer time
 500                                                                 6. Geopolitical concerns are not going
                                                                        away
                                                          $255
                                                                     7. Global mine supply will likely begin
                                                                        to contract
    0

Source: Murenbeeld & Co., Agnico Eagle

                                                                                     Scotiabank Mining Conference   4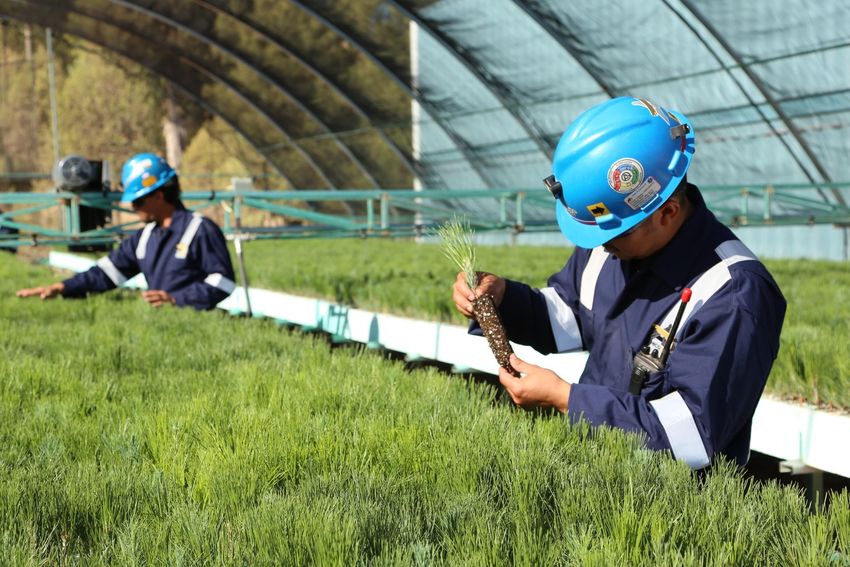
Building A Long Term, Sustainable, Self Funding Business

       Solid Operating Performance                    Growing at a Steady, Measured Pace
 ➢ Exceeded production guidance for eight             ➢ 24% production growth forecast from 2020 to
   consecutive years                                    2022 supported by quality mineral reserve
 ➢ Near record gold production and record cash flow   ➢ A growing exploration story at existing assets
   in Q3 2020                                         ➢ Opportunities to secure the project pipeline post
 ➢ New operational records were established at          2027 and add value from longer term projects
   several of the Company's mines in Q3 2020

          Strong Financial Position                               Consistent Strategy
 ➢ $1.5B of available liquidity (Sept. 30, 2020)      ➢ Strategy is to grow production per share by
 ➢ 75% increase in dividend to $0.35/sh per quarter     focusing on geological potential
   or $1.40/sh per year in Q3 2020                    ➢ Operating in low-political risk, pro-mining
 ➢ A cash dividend has been declared every year         jurisdictions and building a competitive advantage
   since 1983                                         ➢ Recognized for our leading industry practices in
                                                        ESG by independent research agencies

                                                                                      Scotiabank Mining Conference   5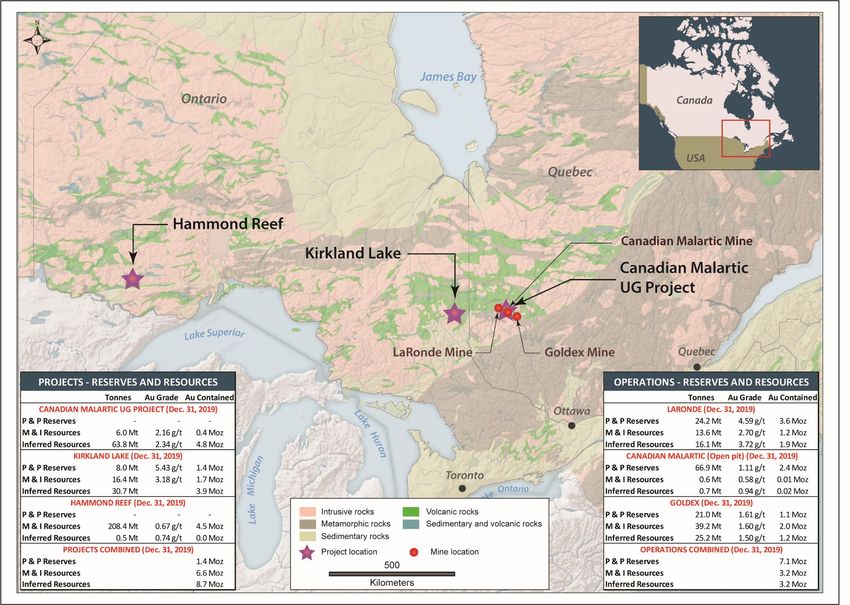
Gold Production Forecast to Increase by 24% from 2020 to 2022
Key Pipeline Projects Expected to Drive Future Production Growth

                                                            Key Near-Term Pipeline Projects (2020-2023)
                                                            •   Kittila expansion (under construction)
                                                            •   Meliadine Phase 2 expansion
                                2.50                        •   Amaruq U/G                                                                                   $1,000
                                                            •   Odyssey, East Malartic & East Gouldie U/G
                                                                                                                                                             $950
                                                                                                                                        2.10
                                                                                                                                2.05
                                                                                                                                                             $900
                                2.00
                                                                                                               1.78
                                                                                                                                                             $850
                                                                1.67       1.66          1.71
                                                                                                    1.63
                                                                                                                        1.70*
    Gold Ounces (in Millions)

                                                                                                                                                             $800
                                1.50                 1.43

                                                                                                                                                                      Cash Costs
                                                                                                                                                             $750

                                              1.10
                                       1.04                                                                                                                  $700
                                1.00
                                                                                                                                                             $650

                                                                                                                                                             $600

                                0.50
                                                                                                                                                             $550

                                                                                                                                                             $500

                                0.00                                                                                                                         $450
                                       2012   2013   2014       2015       2016          2017       2018       2019     2020E   2021E   2022E   2023E and
                                                                                                                                                 onwards

                                                                                     Production            Cash Costs
*Mid-point of new 2020 Guidance issued to reflect impact of COVID-19 pandemic on AEM’s operations                                           Scotiabank Mining Conference           6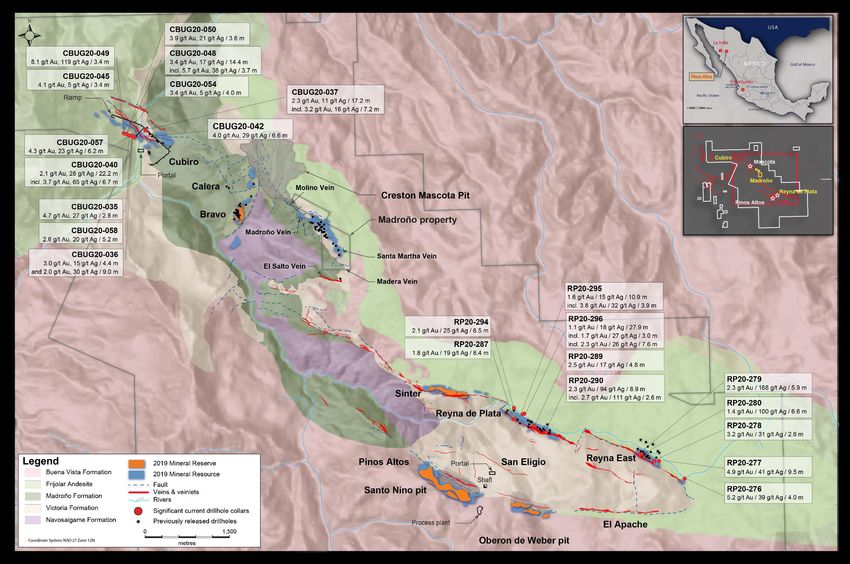
Focused on Growing Value on a per Share Basis
Consistent Strategy that Works
➢ Grow per share gold production at a measured and sustainable rate

➢ Production per 1000 shares Compound Annual ➢ NAV per Share CAGR from 2005 to 2020 of 11%
  Growth Rate (“CAGR”) from 2005 to 2022 of 7%  vs an average of 3% for North American Peers
  vs an average of -5% for North American Peers

                                                                                                NAVPS CAGR
                          Production Per 1000 Shares   15%                          (January 1, 2005 – November 6, 2020)
  10.0

    9.0
                                                                  11%
    8.0

    7.0                                                10%

    6.0

    5.0
                                                                               5%
    4.0                                                  5%                                 4%           4%
    3.0                                                                                                              3%       3%

    2.0
                                                                                                                                         1%
    1.0
                                                         0%
     -

Source: Company reports                                Source: Scotia bank Global Banking and Markets, Bloomberg
                                                       * Peers Average includes Barrick, Newmont, Kinross, Yamana, IAMGOLD

                                                                                                                Scotiabank Mining Conference   7
Low Jurisdictional Risk, Low Complexity

                                                                                   INCREASED JURISDICTION MINING-RELEVANT RISK

                                                                                                                                                                                                                 14

                                                                                                                                               Barrick                                                           12
INCREASED BUSINESS COMPLEXITY

                                                                                                                                                                                                                 10

                                                                                                                                                                                                                      Number of Operating Countries
                                                                                                                    Newmont

                                                                                                                                                                                                                 8

                                                                                                                                                         Kinross
                                                                                                                                                                                                                 6

                                                    Agnico Eagle
                                                                                                   Yamana                                                          Newcrest               IAMGOLD                4

                                                                                                                                   Eldorado Gold                        Centerra Gold

                                                                                                                                                                                                                 2

                                                               Kirkland Lake

                                                                                                                                                                                                                 0
                                   80                             75                            70                            65                         60                       55                        50
                                   Bubble size represents 2021 gold production guidance                    Jurisdiction Mining-Relevant Risk

                                Source: World Risk Report 2019, Mining Journal; Agnico Eagle; Companies’ websites

                                                                                                                                                                                        Scotiabank Mining Conference                                  8
Financial Position
Strong Financial Flexibility; Bank Credit Facility Fully Repaid
                                                                                                          ➢ In July 2020, the Company repaid
                                 Strong Available Liquidity - $1.5B*                                        $250M which was drawn on the
                                                                                                            Company’s unsecured revolving
                                                                                                            bank credit facility
                                                                            $322 M
                                                                                                          ➢ As of September 30, 2020, the
                                                                                                            Company had strong liquidity with
                                 $1,200 M                                                                   $322M in cash and cash equivalents
                                                                                                            and    $1.2B   (excluding  $300M
                                                                                                            accordion) in undrawn credit lines
                        Cash and cash equivalents                   Undrawn credit facilities               available
  *As at September 30, 2020, excluding $300M accordion                                                    ➢ Low share count of 244M fully diluted
                                                                                                            shares after 62 years of operating
                                                Debt Maturities**                                           history
        $300                                                                                              ➢ Debt Ratings
                                                                                                   $250
        $250                $225
                                                         $200                                                  Agency             Rating
        $200
                                                                           $150 $155
        $150
                                                                                            $110
                                                                                                               Fitch              BBB (Stable)
                                     $100 $100 $90              $100 $95
        $100
                                                                                                               DBRS               BBB (Stable)
          $50
                     $0                                                                $0
            $-
                   2021 2022 2023 2024 2025 2026 2027 2028 2029 2030 2031 2032 2033
  **As at September 30, 2020, in million $

                                                                                                                             Scotiabank Mining Conference   9
Agnico Eagle’s Growing Business Positioned
to Generate Rising Free Cash Flow

  $3,000,000

  $2,800,000                   Potential uses of rising cash flow:
  $2,600,000                   • Funding internal pipeline projects
                                                                                                                                                                         ~$420M
  $2,400,000
                               • Reduce net debt
                               • Increase dividends
  $2,200,000
                               • Increase exploration spending
  $2,000,000

  $1,800,000

  $1,600,000

  $1,400,000

  $1,200,000

  $1,000,000

    $800,000                                                                                                                                   Potential Total Capex

    $600,000

    $400,000

    $200,000

           $-
                         2014                  2015                 2016               2017            2018            2019     2020E **         2021E           2022E

                        Sustaining Capex                  Growth Capex                Mine Operating Margin (Au $1800/oz)*    Mine Operating Margin (Au $2000/oz)*

* Mine Operating Margin = ounces x (gold price – total cash costs per ounce).
** 2020 Guidance issued in July 2020 to reflect impact of COVID-19 pandemic on AEM’s operations

                                                                                                                                              Scotiabank Mining Conference   10
Significant Margin Expansion Expected With Rising Gold Prices
Agnico Eagle – Strong Free Cash-Flow Margins Compared to Peers
FCF Margins* (2021E) Sensitivity to Gold Price
45%
40% $1,500 $1,750 $2,000
35%
30%
25%
20%
15%
10%
5%
0%
Kirkland Lake Agnico Eagle Kinross Gold Yamana Gold Newmont Barrick Gold Peers Average**
Gold
Source: Scotiabank GBM estimates.
* FCF = attributable CFO (after interest) less attributable capex. FCF margin = FCF per oz divided by the gold price.
**Peers Average include Agnico Eagle, Anglo Gold Ashanti, Barrick Gold, Gold Fields, Kinross Gold, Kirkland Lake Gold, Newmont, Alamos Gold, B2Gold, Centerra Gold, Eldorado Gold, Endeavour Mining,
IAMGOLD, Yamana Gold
Scotiabank Mining Conference 11Agnico Eagle’s Long History of Returning Value to Shareholders
Dividend Increased by 75% in Q3 2020 to an annualized rate $1.40/share
$300,000 $2,500
~$1.3B in cumulative dividends
$250,000 over the last 38 years*
$2,000
$200,000
$1,500
(In Thousands)
US$ per ounce
$150,000
$1,000
$100,000
$500
$50,000
$- $-
2009 2010 2011 2012 2013 2014 2015 2016 2017 2018 2019 2020**
Total Annual Dividend Q1 2020 Q2 2020 Q3 2020 E.Q4 2020 Average Gold Price
*As at October 28; 2020, Q3 Dividend Record date is November 25, 2020; Payment Date is December 15, 2020; Scotiabank Mining Conference 12
**Q4 dividend assumes consistent payment as per Q3, Q4 dividend has not yet been declared or approvedFocused on Continuous Improvement in ESG
Recognized for our leading industry practices
Environment
in ESG by independent research agencies
W e focus on limiting our environmental impacts by: Bloomberg Thomson
Credit Suisse MSCI
• using natural resources efficiently Company Sustainalytics Reuters ESG
ESG Rank Rating
ESG Rank Rank
• preventing or limiting emissions
• reducing waste Agnico Eagle 1 4 2 AA
W e identify, analyze and manage our environmental Yamana 2 2 2 BBB
risks
Alamos Gold 3 3
Social Newmont 4 1 1 A
Kirkland Lake 5 6 BB
W e act in a socially responsible manner and contribute
to the communities in which we operate Kinross 6 3 2 BBB
W e are committed to working with our employees and
other stakeholders to create growth and prosperity Eldorado Gold 7 3
W e work in a transparent manner with local stakeholders Centerra Gold 8 4
W e have established a committee to provide us with Endeavour
feedback on our corporate social responsibility efforts 9 4
Mining
IAMGOLD 10
Governance
Barrick 11 5 3 BBB
W e act in an ethically responsible manner and uphold
our core values using our: New Gold 12 6
• Code of Business Conduct
• Ethics & anti-corruption, anti-bribery policy
• Our supplier code of conduct
• Our SD policy Winner of the 2020 Towards Sustainable Mining®
• Our Indigenous Peoples Engagement Policy (TSM) Environmental Excellence Award from the
• Our Diversity and Inclusion Policy Mining Association of Canada
Source: Credit Suisse ESG Report, Bloomberg, Thompson Reuters, MSCI website Scotiabank Mining Conference 13Focused on Continuous Improvement in ESG
Environment Social Governance
GLOBAL AVERAGE GHG LOST-TIME ACCIDENTS FREQUENCY*
EMISSION INTENSITY* (per 1,000,000 person hours worked)
(tonnes of CO2 eq. per ounce of gold) OVERSIGHT
8.0 • HSE/SD Committee of the Board
3.0
6.0 • Stakeholder Advisory Committee
2.0
4.0 • Integrated Management System
1.0 2.0 • Towards Sustainable Mining (TSM)
0.0 0.0 • International Cyanide Management
2015 2016 2017 2018 2019 2015 2016 2017 2018 2019 Code
AEM Peers Average
AEM Peers Average • Global Reporting Initiative
FRESH WATER INTENSITY* DIVERSITY AND INCLUSION
(kl of water withdrawn per ounce of gold)
18%
40
Female Employees
16% AEM
30 NEM
14%
20
AGI EXTERNAL VERIFICATION
12% KL
10 10%
CG
GOLD
KGC
• TSM audit (every 3 years)
0
8% EDV AUY • International Cyanide Management
2015 2016 2017 2018 2019 6% Code (every 3 years)
0% 10% 20% 30% 40% 50%
AEM Peers Average Women in Board • Voluntary Principles on Security and
Human Rights (every 3 years)
TOTAL MINE WASTE AND TAILINGS* ECONOMIC CONTRIBUTIONS IN 2019 • Conflict-Free Gold (Annually)
(tonnes of waste and tailings per ounce of gold)
• Tailings Management (Annually)
150
$1.47B $7.4M
100 Payments to suppliers Community Investments
50
0
2015 2016 2017 2018 2019
$59M $637M
Payments to governments Wages and benefits
for income and mining
AEM Peers Average
taxes
*Source: Metals Focus – Gold Peer Group Environmental, Social and Governance Analysis: 2014 to 2019; Credit Suisse ESG Report Scotiabank Mining Conference 14Superior Share Performance Since 1998
Agnico Eagle Has Consistently Outperformed Gold and Gold Equities
10000%
AEM US Equity Gold Spot S&P 500 Index XAU Index
AEM US Equity
CAGR
1000%
13.02%
Gold Spot CAGR
8.60%
100%
S&P 500 Index CAGR
5.45%
XAU Index CAGR
10%
3.53%
Source: Bloomberg – August 3, 1998 to November 27, 2020
Scotiabank Mining Conference 15Summary: Quality Business – Growing Production and Free Cash-Flow
➢ 24% production growth forecast from 2020 to 2022 drives increasing free cash-flow
➢ Established a competitive advantage in low-geopolitical risk, pro-mining jurisdictions
➢ Industry leading ESG performance
➢ 38 years of consecutive dividends
➢ Ongoing exploration success, with focus on pipeline projects and near mine opportunities:
• Canadian Malartic Underground
• Kittila
• LaRonde
• Kirkland Lake
• Pinos Altos
➢ Strategy drives consistent share price outperformance
Scotiabank Mining Conference 16Click to edit Master title style
Appendix
Scotiabank Mining ConferenceDiversified Operations
Robust Production in Premier Mining Jurisdictions in North America and Europe
Meliadine, Canada Kittila, Finland
Development (100%) Producing (100%)
Northern Business Northern Business
Meadowbank Complex, Canada
Producing and Development (100%) Production (Koz) 238.4 Production (Koz) 186.1
Northern Business P&P (Moz) 4.1 P&P (Moz) 4.1
Production (Koz) 193.5 M&I (Moz) 2.8 M&I (Moz) 1.5
P&P (Moz) 3.3
LaRonde Complex, Canada M&I (Moz) 1.2
Producing (100%)
Northern Business Finland
Production (Koz) 403.0
P&P (Moz)1 3.6
M&I (Moz) 1.1
Goldex, Canada
Producing (100%)
Northern Business
Production (Koz) 140.9
La India, Mexico P&P (Moz) 1.1
Producing (100%) M&I (Moz) 2.0
Southern Business
Production (Koz) 82.2
P&P (Moz) 0.5 Total2
M&I (Moz) 0.2 Production (Koz) 1,782.2 Canadian Malartic, Canada
P&P (Moz) 22.0 Producing (50%)
M&I (Moz) 17.4 Northern Business
Production (Koz) 334.6
Pinos Altos, Mexico P&P (Moz) 2.4
Producing (100%) M&I (Moz) 0.4
Southern Business
Production (Koz) 155.1
P&P (Moz) 1.0
M&I (Moz) 1.1
Creston Mascota, Mexico
Producing (100%)
Southern Business
Producing Mine Production (Koz) 48.4
P&P (Moz) 0.06
M&I (Moz) 0.02
Source: Company filings.
Note: Production is for fiscal year 2019; Mineral Reserves and Mineral Resources as of December 31, 2019.
1. LaRonde Complex Production and mineral reserves and mineral resources are inclusive of LaRonde Zone 5.
Scotiabank Mining Conference 18
2. Totals are indicative of total producing, developing and exploration assets.Third Quarter 2020 Highlights
➢ Gold production returns to near-record levels seen Q4 2019 – Payable gold production in Q3
2020 was 492,6931 ounces at production costs per ounce of $865, total cash costs per ounce of
$764 and AISC of $1,016
➢ Production and cost guidance maintained for 2020; no change to longer-term production
guidance – Expected gold production in 2020 is unchanged at 1.68 to 1.732 million ounces, while
expected total cash costs per ounce and AISC per ounce continue to be forecast in the range of
$740 to $790 and $1,025 to $1,075, respectively. Gold production guidance for 2021 and 2022
remains unchanged with a mid-point of 2.05 million and 2.10 million ounces, respectively
➢ Slight increase to 2020 capital expenditures reflect accelerated development spending –
Capital expenditures in 2020 are expected to be ~$720 to $740 million (versus previous guidance
of $690 million). The increased capital spending primarily relates to accelerated programs at Kittila
(mill, water and tailings management) and Amaruq (restart of underground development and
accelerated waste stripping), and the advanced procurement of pipe for the waterline at Meliadine
➢ Strong quarterly free cash flow drives 75% increase in dividend – On the back of record
quarterly results, a quarterly dividend of $0.35 per share has been declared. The previous
quarterly dividend was $0.20 per share
1.Including pre-commercial production of 13,305 oz from the Barnat deposit and 1,982 oz from the Tiriganiaq open pit deposit at Meliadine Scotiabank Mining Conference 19
2.Including pre-commercial production from the Barnat deposit at Canadian Malartic, the Tiriganiaq open pit deposit at Meliadine and the IVR deposit at MeadowbankCOVID-19 Update
➢ Operations have rebounded strongly post Q2 2020 COVID-19 interruptions
➢ To-date, the Company has seen limited impact on operational productivity as a result of
COVID-19, and it is continuing to strengthen and enhance COVID-19 protocols
➢ In Q3 2020, new operational records were established at several of the Company's mines.
Record monthly tonnage milled in August at Canadian Malartic, and daily record tonnage
milled at Goldex in September. Record monthly gold production at LZ5 in August, and record
quarterly gold production at Meliadine. Meadowbank has showed consistent operating
performance since July, and Kittila continued to have strong underground production in the
quarter and the mill expansion is progressing ahead of schedule
➢ COVID-19 financial impact
➢ COVID-19 protocols (not including compensation paid to Nunavut-based employees) added
$2.8 million (approximately $6 per ounce) to the Company's operating in Q3 2020
➢ The Nunavut-based workforce remained at home due to current COVID-19 health guidelines
issued by the Government of Nunavut and the Company continued to pay for 75% of the base
salaries for these employees (a total of $3.7 million pre-tax, $2.2 million net of tax, included in
Other Expenses) in Q3 2020
Scotiabank Mining Conference 20Operating Results
Gold production returns to near-record levels seen in the fourth quarter of 2019
Q3 2020 Q3 YTD 2020
Production* Total Cash Costs*** Operating Margin Production** Total Cash Costs***
(Gold oz) ($/oz) ($000’s) (Gold oz) ($/oz)
Northern Business
LaRonde Complex 100,180 $476 $165,886 244,184 $552
Goldex 31,008 $702 $36,350 88,033 $653
Canadian Malartic (50%) 76,398 $772 $76,673 197,946 $756
Kittila 53,149 $813 $62,807 163,069 $776
Meadowbank 74,921 $1,260 $46,032 140,679 $1,511
Meliadine 96,757 $695 $109,313 226,107 $822
432,413 $771 $497,061 1,060,018 $819
Southern Business
Pinos Altos 30,937 $677 $37,063 78,127 $740
Creston Mascota 6,567 $771 $9,279 34,397 $565
La India 22,776 $740 $24,406 62,581 $779
60,280 $711 $70,748 175,105 $720
Total 492,693 $764 $567,809 1,235,123 $805
*Gold production includes 13,305 and 1,982 of pre-commercial production ounces from Barnat deposit at Canadian Malartic and Triganiaq deposit at Meliadine for the three months ended September 30, 2020
**Gold production includes 18,930 and 1,982 of pre-commercial production ounces from Barnat deposit at Canadian Malartic and Triganiaq deposit at Meliadine for the nine months ended September 30, 2020
***Excludes pre-commercial production gold ounces
Q3 2020 Revenue by Metal Q3 2020 Total Operating Margin – $567.8M
LaRonde Complex, 29%
Creston Mascota, 2%
Base Metals
1% Gold
La India, 4%
97% Goldex, 6%
Silver Pinos Altos, 7% Meliadine, 19%
2%
Meadowbank, 8%
Canadian Malartic (50%), 14%
Kittila, 11%
Scotiabank Mining Conference 21Financial Highlights
Strong Financial Results
Q3 2020 Q3 2019 Q3 YTD 2020 Q3 YTD 2019
Realized Gold Price ($/oz) $1,911 $1,480 $1,753 $1,374
Revenues (millions) $981 $683 $2,210 $1,742
Net Income (millions) $223 $77 $306 $141
Net Income per share (basic) $0.92 $0.32 $1.27 $0.60
Cash provided by operating activities* (millions) $463 $349 $789 $624
Operating Cash flow per share* (basic) $1.91 $1.47 $3.27 $2.64
* After changes in non-cash components of working capital
Scotiabank Mining Conference 22Northern
Click to edit Master title style Business
Scotiabank Mining ConferenceAbitibi Region
Production Q3 YTD 2020 Highlights
Production and
Costs
LaRonde Complex
• The LaRonde Complex operations were suspended from March 23, 2020 to April 17,2020 due to the COVID-19 pandemic. Mining
244,184 ozs activities resumed on April 17, while the LaRonde mill circuit restarted on April 29 and the LZ5 mill circuit on May 2
at a production cost of • Mining activities in the West mine area progressed ahead of schedule, contributing approximately 12% of the tonnage mined at the
$658/oz and total LaRonde Complex in Q3 2020
cash costs of $552/oz • Automation strategy supports gains in productivity in the West mine area. YTD, 54% of tonnes mucked relied on automated scoops
Proven & probable • At LZ5, the production rate increased to 3,000 tpd from productivity gains from automation and it is expected to be sustained in Q4 2020
gold reserves: • Mining activities at LZ5 have been extended to 480 metres starting in 2020. The Company is also evaluating the potential to develop
LaRonde 2.9Moz deeper portions of LZ5 (480 metres to 700 metres)
LZ5 0.7Moz
• Exploration drilling in LaRonde 3's East mine area confirms and expands new high grade 20N Zinc South Zone by approximately 200
metres to the east
Canadian Malartic (50%)
• Winner of the prestigious F.J. O'Connell Trophy from the Quebec Mining Association for excellence in health and safety performance in
179,016 ozs* the "surface, transportation and primary metal processing operations" category for 2019
at a production cost of • Canadian Malarctic operations were suspended from March 23, 2020 to April 17, 2020 due to the COVID-19 pandemic
$769/oz and total
• Mining activities at the Barnat deposit progressed ahead of plan and commercial production was declared on September 30, 2020
cash costs of $756/oz
• At the mill, two planned shutdowns were completed in Q3 2020. Despite the shutdowns, the daily throughput was significantly higher
Proven & probable compared to the prior-year period, and record monthly tonnage (2.0M tonnes) was milled in August
gold reserves: 2.4Moz • The Odyssey project exploration ramp portal was started in August 2020. The ramp development is expected to continue for ~ 2 years
• Expanded drill program at East Gouldie Zone extends known mineralization and infills high grade core. The Partnership will prepare a
new mineral resource update for year-end 2020 and a PEA on the Odyssey project in early 2021
Goldex
• Winner of the prestigious F.J. O'Connell trophy from the Quebec Mining Association for excellence in health and safety performance in
88,033 ozs the category of “underground operations with over 400,000 hours worked” for 2019
at a production cost of • Goldex operations were suspended from March 23, 2020 to April 17, 2020 due to the COVID-19 pandemic. Mining activities resumed on
$659/oz and total April 17, while milling activities restarted on April 24, 2020
cash costs of $653/oz • The underground Rail-Veyor maintenance facility was completed in Q2 2020. This facility is expected to have a positive impact on future
Rail-Veyor productivity and increase production from the lower mine to over 7,000 tpd
Proven & probable
• Challenges early in Q3 2020 impacted the mining sequence and resulted in lower mill head grades than forecasted
gold reserves: 1.1Moz
• The mill performed well in August and September (highest daily average mill throughput in September at 8,373 tpd since restart of the
operation in 2013). With the strong mill performance and the return of higher grade stopes into the mining schedule, the Company
expects strong performance at Goldex in Q4 2020
* Includes pre-commercial production of 18,930 ozs at the Barnat deposit Scotiabank Mining Conference 24
See AEM February 13, 2020 press release and appendix for detailed breakdown of mineral reserves and mineral resources.Finland
Production Q3 YTD 2020 Highlights
Production and
Costs
Kittila
• The site operated continuously through the COVID-19 pandemic, it established a new quarterly ore production record in Q2 2020 and
163,069 ozs delivered a strong performance in Q3 2020 exceeding forecasted ore tonnage and gold ounces
at a production cost of • The permit allowing for processing of 2.0 million tonnes per annum was granted in May 2020
$812/oz and total cash • Completion of the mill expansion tie-in from September 22, 2020 to October 22, 2020. The commissioning of the expanded mill is
costs of $776/oz ongoing. With the underground mine ready to support a production profile of 2.0 million tonnes per annum, Kittila production flexibility
has significantly improved for Q4 2020 and for 2021
Proven & probable gold
• Shaft sinking is progressing at a lower rate than forecasted due to COVID-19 travel restrictions. Shaft commissioning is now expected
reserves: 4.1Moz to be completed in H1 2022. With the delay in construction, combined with higher than expected costs, the Kittila expansion project is
now forecasted to cost between 190 to 200 million euros
Nunavut • Drilling has extended the Main and Sisar Zone by up to 500 metres to the south with intercepts such as 5.3 g/t gold over 3.9 metres
This drilling further enhances the potential of the Sisar Zone to be developed into a new mining horizon
Production Q3 YTD 2020 Highlights
Production and
Costs
Meadowbank
• In H1 2020, following the declaration of a public health emergency in Nunavut, the Company reduced mining activities and suspended
140,679 ozs milling activities and focused on reducing the maintenance backlog, and on increasing the overall ‘mining footprint’ of the Amaruq pit
at a production cost of • Mining and milling activities ramped up in June 2020, and since then open pit production has shown consistent performance with an
$1,494/oz and total cash average of approximately 3.3 million tonnes mined per month
costs of $1,511/oz • LHT performance improved significantly in the last three weeks of September, with haulage averaging over 11,000 tpd. Three new LHT
received in Q3 2020, bringing the total fleet of LHT's to 26
Proven & probable gold
• In June 2020, permits were approved for mining of the IVR open pit and Amaruq underground deposits. In Q3 2020, the IVR pit
reserves: 3.3Moz development was accelerated and the underground ramp development at Amaruq was restarted. A production decision for Amaruq U/G
is expected to be made in 2021
Meliadine
• On March 19, 2020, the Company reduced mining activities due to the declaration of a public health emergency in Nunavut. During this
224,125 ozs period, the site successfully focused on increased backfilling of stopes, equipment maintenance and water management.
at a production cost of • In Q3 2020, Meliadine had strong operating performance, delivering record quarterly production despite shutdowns related to mill
$814/oz and total cash maintenance and upgrade activities. Mining of the first two stopes in the higher-grade RP3 horizon were completed as planned without
costs of $822/oz any increase to the ground water inflows. This new horizon is expected to provide additional mining flexibility in Q4 2020
• In Q3 2020, the mill maintained average daily throughput of 4,150 tonnes despite several planned shutdowns. Major work included
Proven & probable gold replacement of the apron feeder, filter press upgrades and modifications to the Grizzly feeder
reserves: 4.1Moz
• At the Tiriganiaq open pit, overburden stripping has been accelerated with a contractor to provide additional mining flexibility for both
tonnes and grade in 2021
See AEM February 13, 2020 press release and appendix for detailed breakdown of mineral reserves and mineral resources. Scotiabank Mining Conference 25Southern
Click to edit Master title style Business
Southern Business
Scotiabank Mining ConferenceMexico Operations
Production Q3 YTD 2020 Highlights
Production and
Costs
Pinos Altos
• Pinos Altos operations were suspended from April 2nd to May 18th as mandated by the Government of Mexico; Mining operations
78,127 ozs progressively restarted on May 18th; As of June 1st Pinos Altos is operating at budgeted levels at 5,850tpd
at a production cost of • At Cerro Colorado, the reconditioning activities in the area affected by challenging ground conditions continue and are expected to be
$1,117/oz and total completed in Q4 2020. A revised mining plan has been adopted which balances a reduced tonnage from Cerro Colorado with increased
cash costs of $740/oz production from other zones
Proven & probable • At the Sinter deposit, the development of the underground mine continues, and production is expected to begin in Q4 2020 as planned,
gold reserves: 1.0Moz bringing additional flexibility to the Pinos Altos mine plan
• Drilling has extended the high-grade portion of the Cubiro structure 400 metres along strike and to an average of 175 metres in vertical
extent above the ramp. There are indications that mineralization may reopen at depth below the current ramp
Creston Mascota
• Creston Mascota operations were suspended from April 2nd until May 18tt as mandated by the Government of Mexico, although residual
34,397 ozs leaching continued through the shutdown; Creston Mascota has returned to normal operating level
at a production cost of • The Bravo pit was depleted in September 2020; The Bravo pit produced approximately 129,000 ounces of gold, compared to the original
$844/oz and total design of 66,000 ounces of gold
cash costs of $565/oz
• Closure activities will be conducted for the remainder of 2020 and in 2021
Proven & probable • The inventories in the heap leach will be depleted in Q4 2020, while minor residual leaching will continue into 2021 according to the
gold reserves: 0.1Moz progressive closure plan
La India
• For the third year in a row, the La India mine was awarded the Silver Helmet by the Mexican Chamber of Mines for excellence in health
62,581 ozs and safety performance in the category of "Open Pit Mine with up to 500 employees“
at a production cost of • La India operations were suspended from April 2nd until May 18th as mandated by the Government of Mexico, although residual leaching
$824/oz and total continued through the shutdown. Mining operations progressively restarted on May 18th; As of June 1st the site is operating at budgeted
cash costs of $779/oz levels with 18,000 tonnes placed on the heap leach per day
• Installation of the new agglomeration system was completed under budget. The system was commissioned in early July 2020 and
Proven & probable
supported the higher production rates achieved during Q3 2020
gold reserves: 0.5Moz
• The 2020 drill program at Chipriona will be expanded from 6,000 metres to 16,000 metres to infill and extend the deposit at depth. This
expanded program supports the Company's development concept that Chipriona could potentially be developed in tandem with sulphide
mineral resources beneath leachable ore elsewhere on the property in a new phase of mining operations at La India
See AEM February 13, 2020 press release and appendix for detailed breakdown of mineral reserves and mineral resources. Scotiabank Mining Conference 27Mexico Exploration and Development Projects
Exploration and Highlights
Development
El Barqueno
• Agnico Eagle acquired its 100% interest in the El Barqueno project in November 2014. The 79,746-hectare property is in the Guachinango gold-silver mining district
of Jalisco State in west-central, Mexico, approximately 150 kilometres west of the state capital of Guadalajara
• El Barqueno is estimated to contain 318,000 ounces of gold and 1.2 million ounces of silver in indicated mineral resources (8.2 million tonnes grading 1.21 g/t gold
and 4.63 g/t silver) and 325,000 ounces of gold and 4.6 million ounces of silver in inferred mineral resources (8.3 million tonnes grading 1.21 g/t gold and 17.25 g/t
silver).
Santa Gertrudis
• Agnico Eagle holds a 100% interest in the 42,000-hectare Santa Gertrudis gold property
• Three favorable geological trends with a potential strike length of 18 km have been identified with limited drilling between deposits
• Inferred mineral resources of 1.2Moz at year end 2019
• The Santa Gertrudis project appears to have potential to eventually be a similar sized operation to La India
• 25,000m of drilling planned in 2020 to expand mineral resources and test new targets. In H1 2020, 26 holes (14,282 metres) were completed with a focus on
expanding and developing new mineral resources in the Amelia deposit, the Espiritu Santo Zone and the Toro Trend. Highlights include: 2.7 g/t gold and 308 g/t silver
over 11.5 metres at Amelia, 2.7 g/t gold and 321 g/t silver over 3.3 metres at Espiritu, and 2.8 g/t over 9.5 metres at the Toro Trend.
See AEM February 13, 2020 press release and appendix for detailed breakdown of mineral reserves and mineral resources. Scotiabank Mining Conference 28Click to edit Master title style
Exploration
Scotiabank Mining ConferenceExploration Focused on Minesite Opportunities and Pipeline Projects
➢ LaRonde – Exploration drilling in the East mine area is confirming and expanding the high grade 20N
Zinc South Zone discovery, with highlights of 8.4 g/t gold, 101 g/t silver, 0.57% copper and 13.3% zinc
over 2.8 metres at 3,393 metres depth. The latest results also suggest that gold grades are increasing
with depth. The zone remains open to the east, at depth and at shallower levels
➢ Kittila – Drilling in the Sisar Zone continues to show potential to significantly expand the zone laterally
and at depth. Recent intercepts, of 7.3 g/t gold over 4.4 metres at 1,626 metres depth, further indicate
the potential for the Sisar Zone to be developed into a new mining horizon
➢ Canadian Malartic Underground – In the first nine months of 2020, 77,500 metres (100% basis) of
conversion and expansion drilling were carried out at East Gouldie, resulting in highlights such as 6.3
g/t gold over 39.3 metres at 1,472 metres depth in the deposit's core. Exploration drilling is expected to
lead to a significant increase in East Gouldie's mineral resource estimate at year-end 2020, which will
be integrated into a preliminary economic assessment (expected in early 2021)
➢ Kirkland Lake Project – The conversion drilling program at depth at Upper Beaver in Q3 2020
returned intercepts such as 11.6 g/t gold and 0.48% copper over 5.6 metres at 1,227 metres depth.
Results from the 2020 exploration program will be incorporated into an updated mineral reserve and
mineral resource estimate at year-end and an updated technical study to be completed in 2021
Scotiabank Mining Conference 30LaRonde Mine - Composite Longitudinal Section
Scotiabank Mining Conference 31Kittila Mine – Composite Longitudinal Section
Scotiabank Mining Conference 32Pinos Altos Mine – Local Geology Map
Scotiabank Mining Conference 33Pinos Altos Mine – Cubiro Composite Longitudinal Section
Scotiabank Mining Conference 34Key Projects Located Near Agnico Eagle’s Historical Camps Large Mineral Reserves and Mineral Resources and Growing See AEM February 13, 2020 press release and appendix for detailed breakdown of mineral reserves and mineral resources Scotiabank Mining Conference 35
Canadian Malartic Mine – Composite Longitudinal Section

                                                     Scotiabank Mining Conference   36
Kirkland Lake Project –
Upper Beaver Composite Longitudinal Section
Scotiabank Mining Conference 37Hammond Reef – Geological Map
Scotiabank Mining Conference 38Santa Gertrudis Project – Local Geology Map
Scotiabank Mining Conference 39Select Exploration Joint Ventures and Equity Investments* *Public Equity Investments where AEM has over 10% ownership Scotiabank Mining Conference 40 For a discussion of the risks associated with joint ventures and equity investments, please see the AIF
2019 Gold Mineral Reserve and Mineral Resources
Higher Reserve Grade and Increasing Mineral Resources
                                                                                                                                            AEM’s Global Reserves, Measured and Indicated
                              Gold Mineral Reserve Grade (g/t)                                                                               Resources and Inferred Resources (2010-2019)
                                                                                                                                       70
           2.83

                                                                                                              Ounces Gold (millions)
                                                                                                                                       60

                       2.00                                                                                                            50
                                   1.68        1.59                                                                                    40
                                                           1.29
                                                                       1.03                                                            30
                                                                                   0.70                                                20

                                                                                                                                       10

                                                                                                                                        0
                                                                         NEM
                        AUY

                                                 AVERAGE
            AEM

                                    ABX

                                                                                     KGC
                                                             KL

                                                                                                                                             2010 2011 2012 2013 2014 2015 2016 2017 2018 2019
                                                                                                                                                               As of December 31

                                                                                                                                                Reserves   M&I resources     Inferred resources

  ➢ Gold mineral reserves declined slightly in 2019, while measured and indicated and inferred mineral resources
    increased – Mineral reserves decreased by 2% to 21.6Mozs (net of 2019 production). Measured and indicated
    mineral resources and inferred mineral resources increased by 4% and 19%, respectively
  ➢ Gold reserve grade increased – Overall mineral reserve grade improved 4.8% to 2.83 g/t from 2.7 g/t, largely due to
    increases in the mineral reserve grade at mines in Nunavut. Mineral resource grades were essentially unchanged
    from the previous year
  ➢ Agnico Eagle has the highest mineral reserve grades among its North American peers

See AEM February 13, 2020 press release and appendix for detailed breakdown of mineral reserves and mineral resources.                                                      Scotiabank Mining Conference   41
Successful M&A and Exploration Strategy
Significant Value Added, Key Deposits Still Open and Positioned to Deliver More Value
Mined through 2019 (koz) Proven & Probable (koz) Measured & Indicated (koz) Inferred (koz) Cost per Oz ($)
Kittila Meadowbank Meliadine Pinos Altos La India
9,418 koz (Including Amaruq) 9,511 koz 4,990 koz
9,750 koz
1,983 koz
+236% +148% +94% +138%
+57%
5,020 koz
3,830 koz 2,100 koz
1,266 koz
2,800 koz
2005 2019 2007 2019 2010 2019 2006 2019 2011 2019
$186
$173
$121
$107
$54
$43 $40
$36 $33
$23
Purchase Discovery Purchase Discovery Purchase Discovery Purchase Discovery Purchase Discovery
See AEM February 13, 2020 press release and appendix for detailed breakdown of mineral reserves and mineral resources. Scotiabank Mining Conference 42Click to edit Master title style
ESG Initiatives
Scotiabank Mining Conference2019 ESG Performance Highlights
Environment
• Pinos Altos implemented a sustainable soil regeneration initiative using cattle (Our Cows are
Green)
• Renewed our partnership with the Research Institute on Mines and the Environment (RIME) a
unique joint research program focused on developing innovative solutions for the environmental
challenges faced throughout the entire life cycle of a mine.
Social
• In 2019, $7.4 M was spent in community investment
• 100% of our Pinos Altos and La India mine workforce from Mexico
• 16% of our employees in 2019 are female – diversity action plan ongoing to increase %
• Nunavut operations launched the Rapid Inuit Specific Education (RISE) program to support
training and development of Inuit employees
• Independent assessment of Voluntary Principles on Security and Human Rights at Pinos Altos
identified a strong positive relationship with the surrounding communities
Health and Safety
• 0.99 combined lost-time frequency and restricted work cases an improvement from 1.28 in 2018
• Zero lost-time accidents at La India
• Lapa awarded Safest Mine in Canada
• No fatal accidents in 2019, three severe accidents
• 20,384,101 hours worked, the highest in Agnico Eagle’s history
Scotiabank Mining Conference 44ESG Risk Management Approach
INTERNAL INITIATIVES
Risk Management and The foundation upon which we have built our capacity to manage the commitments
Monitoring System made in our Sustainable Development Policy.
Stakeholder Advisory We have established a SAC to provide us with feedback on our corporate social
Committee (SAC) responsibility efforts and to complement and help us make strategic links to our
existing local stakeholder engagement activities.
EXTERNAL MANAGEMENT AND DISCLOSURE INITIATIVES
Toward Sustainable Since 2010 The Mining Association of Canada’s (MAC) TSM initiative promotes best practices in
Mining (TSM) environmental protection, energy efficiency, tailing management, community
engagement, safety and transparency.
International Cyanide Since 2011 A voluntary industry program for companies that use cyanide to recover gold. It
Code focuses on the responsible and safe management of cyanide and cyanide solutions
used in gold mining, including the protection of human health and the reduction of
environmental impacts, through every stage of the mining process.
Voluntary Principles Since 2017 Agnico Eagle has formally adopted the Voluntary Principles on Security and Human
Rights (VP). Created in 2000, the VPs are standards to help extractive sector
companies balance the obligation to respect human rights while protecting the assets
and people at their operations.
Conflict-Free Gold Since 2013 Developed by the World Gold Council and based upon internationally-recognised
benchmarks, the Conflict-Free Gold Standard helps companies to provide assurance
that their gold is not contributing to conflict.
Global Reporting Since 2009 Sets out specific criteria and indicators that organizations can use to measure and
Initiative (GRI) report on their economic, environmental and social performance.
Sustainability Since 2019 SASB mission is to help businesses around the world identify, manage and report on
Accounting Standards sustainability topics that matter most to their investors.
Board
Task Force on Climate In Progress Intended to quantify financial risk due to climate change through transparent and
Related Financial consistent disclosures based on scenario analysis.
Disclosures
Scotiabank Mining Conference 45You can also read