Auckland's Low Emission Bus Roadmap - December 2018 - Auckland Transport
←
→
Page content transcription
If your browser does not render page correctly, please read the page content below
Contents >

Auckland's Low Emission
Bus Roadmap
December 2018

                Auckland Transport Low Emission Bus Roadmap 2018 | 1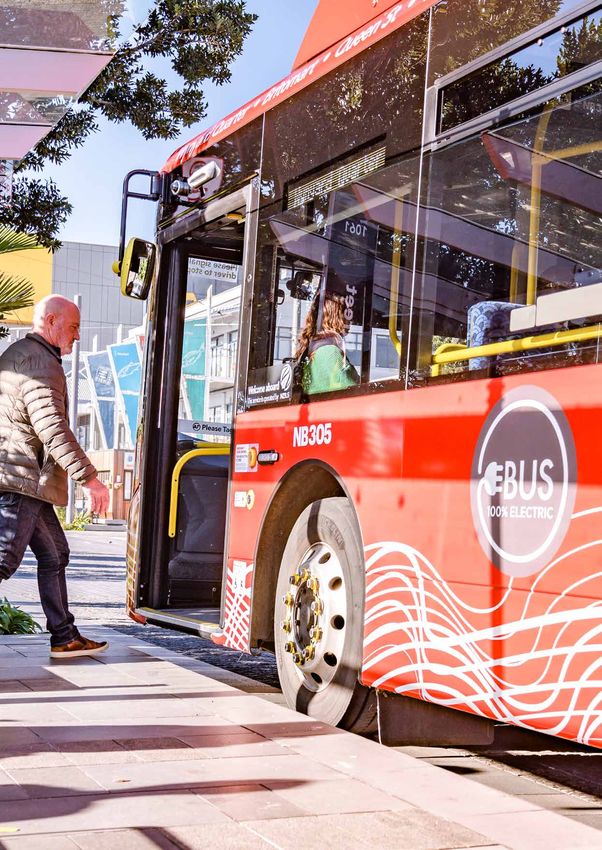
< Contents

Contents
0.1 Executive summary  .  .  .  .  .  .  .  .  .  .  .  .  .  .  .  .  .  .  .  .  .  .  .  .  .  .  .  .  .  .  .  .  .  .  .  .  .  .  .  .  .  .  .  .  .  .  .  .  .  .  .  .  .  .  .  .  .  .  .  .  .  .  .  .  .  .  .  .  .  . 4

1.0 INTRODUCTION                                                                                                                                                                                                                                               10
1.1 Recommendations .  .  .  .  .  .  .  .  .  .  .  .  .  .  .  .  .  .  .  .  .  .  .  .  .  .  .  .  .  .  .  .  .  .  .  .  .  .  .  .  .  .  .  .  .  .  .  .  .  .  .  .  .  .  .  .  .  .  .  .  .  .  .  .  .  .  .  .  .  . 11
1.2 Challenges to the 2040 goal  .  .  .  .  .  .  .  .  .  .  .  .  .  .  .  .  .  .  .  .  .  .  .  .  .  .  .  .  .  .  .  .  .  .  .  .  .  .  .  .  .  .  .  .  .  .  .  .  .  .  .  .  .  .  .  .  .  .  .  .  . 12

2.0 NATIONAL AND REGIONAL POLICY FRAMEWORKS                                                                                                                                                                                                                    14
2.1 Climate change and air quality .  .  .  .  .  .  .  .  .  .  .  .  .  .  .  .  .  .  .  .  .  .  .  .  .  .  .  .  .  .  .  .  .  .  .  .  .  .  .  .  .  .  .  .  .  .  .  .  .  .  .  .  .  .  .  .  .  .  . 15
2.2 Electric vehicle programme .  .  .  .  .  .  .  .  .  .  .  .  .  .  .  .  .  .  .  .  .  .  .  .  .  .  .  .  .  .  .  .  .  .  .  .  .  .  .  .  .  .  .  .  .  .  .  .  .  .  .  .  .  .  .  .  .  .  .  .  .  . 15
2.3 Auckland policy framework .  .  .  .  .  .  .  .  .  .  .  .  .  .  .  .  .  .  .  .  .  .  .  .  .  .  .  .  .  .  .  .  .  .  .  .  .  .  .  .  .  .  .  .  .  .  .  .  .  .  .  .  .  .  .  .  .  .  .  .  .  . 16

3.0 STRATEGIC CONTEXT                                                                                                                                                                                                                                          17
3.1 International context – uptake of battery electric buses .  .  .  .  .  .  .  .  .  .  .  .  .  .  .  .  .  .  .  .  .  .  .  .  .  .  .  .  .  .  .  .  .  .  .  . 18
3.2 Auckland context – environment and health impacts  .  .  .  .  .  .  .  .  .  .  .  .  .  .  .  .  .  .  .  .  .  .  .  .  .  .  .  .  .  .  .  .  .  .  .  .  .  . 19
3.3 Auckland context – the city’s bus fleet .  .  .  .  .  .  .  .  .  .  .  .  .  .  .  .  .  .  .  .  .  .  .  .  .  .  .  .  .  .  .  .  .  .  .  .  .  .  .  .  .  .  .  .  .  .  .  .  .  .  .  . 21

4.0 DEVELOPING THE LOW EMISSION BUS ROADMAP                                                                                                                                                                                                                    22
4.1 Assessment of options  .  .  .  .  .  .  .  .  .  .  .  .  .  .  .  .  .  .  .  .  .  .  .  .  .  .  .  .  .  .  .  .  .  .  .  .  .  .  .  .  .  .  .  .  .  .  .  .  .  .  .  .  .  .  .  .  .  .  .  .  .  .  .  .  .  . 23
4.2 Roadmap methodology  .  .  .  .  .  .  .  .  .  .  .  .  .  .  .  .  .  .  .  .  .  .  .  .  .  .  .  .  .  .  .  .  .  .  .  .  .  .  .  .  .  .  .  .  .  .  .  .  .  .  .  .  .  .  .  .  .  .  .  .  .  .  .  .  . 24

5.0 ASSESSMENT OF EARLY TRIALS AND STRATEGIC OPTIONS                                                                                                                                                                                                           25
5.1 City LINK e-bus trial early results .  .  .  .  .  .  .  .  .  .  .  .  .  .  .  .  .  .  .  .  .  .  .  .  .  .  .  .  .  .  .  .  .  .  .  .  .  .  .  .  .  .  .  .  .  .  .  .  .  .  .  .  .  .  .  .  . 26
5.2 Assessing transition and ownership options .  .  .  .  .  .  .  .  .  .  .  .  .  .  .  .  .  .  .  .  .  .  .  .  .  .  .  .  .  .  .  .  .  .  .  .  .  .  .  .  .  .  .  .  .  .  . 27

6.0 COST ASSUMPTIONS AND IMPACTS                                                                                                                                                                                                                               29
6.1 Capital costs .  .  .  .  .  .  .  .  .  .  .  .  .  .  .  .  .  .  .  .  .  .  .  .  .  .  .  .  .  .  .  .  .  .  .  .  .  .  .  .  .  .  .  .  .  .  .  .  .  .  .  .  .  .  .  .  .  .  .  .  .  .  .  .  .  .  .  .  .  .  .  .  .  .  .  . 30
6.2 Operational, maintenance and renewal costs .  .  .  .  .  .  .  .  .  .  .  .  .  .  .  .  .  .  .  .  .  .  .  .  .  .  .  .  .  .  .  .  .  .  .  .  .  .  .  .  .  .  .  .  .  . 30

7.0 FINANCING OPTIONS                                                                                                                                                                                                                                          32

8.0 NEXT STEPS                                                                                                                                                                                                                                                 34
Glossary  .  .  .  .  .  .  .  .  .  .  .  .  .  .  .  .  .  .  .  .  .  .  .  .  .  .  .  .  .  .  .  .  .  .  .  .  .  .  .  .  .  .  .  .  .  .  .  .  .  .  .  .  .  .  .  .  .  .  .  .  .  .  .  .  .  .  .  .  .  .  .  .  .  .  .  .  .  .  .  .  .  .  .  . 36
Appendices  .  .  .  .  .  .  .  .  .  .  .  .  .  .  .  .  .  .  .  .  .  .  .  .  .  .  .  .  .  .  .  .  .  .  .  .  .  .  .  .  .  .  .  .  .  .  .  .  .  .  .  .  .  .  .  .  .  .  .  .  .  .  .  .  .  .  .  .  .  .  .  .  .  .  .  .  .  .  .  .  . 37
Appendix 1: City LINK e-bus trial data  .  .  .  .  .  .  .  .  .  .  .  .  .  .  .  .  .  .  .  .  .  .  .  .  .  .  .  .  .  .  .  .  .  .  .  .  .  .  .  .  .  .  .  .  .  .  .  .  .  .  .  .  .  .  .  . 37
Appendix 2: Assessment of implementation and funding options .  .  .  .  .  .  .  .  .  .  .  .  .  .  .  .  .  .  .  .  .  .  .  .  .  .  .  .  .  .  . 40
Appendix 3: Assumptions .  .  .  .  .  .  .  .  .  .  .  .  .  .  .  .  .  .  .  .  .  .  .  .  .  .  .  .  .  .  .  .  .  .  .  .  .  .  .  .  .  .  .  .  .  .  .  .  .  .  .  .  .  .  .  .  .  .  .  .  .  .  .  .  .  .  .  . 43

2 | Auckland Transport Low Emission Bus Roadmap 2018
Contents >
About AT and our Sustainability Framework
Auckland Transport’s role as a transport provider and mobility integrator is rapidly evolving
to meet and anticipate fast-paced changes in how people in successful cities want and
need to travel. We play an active role in shaping a growing, vibrant Auckland with more
sustainable and networked modes of transport, and in integrating the diverse new ways our
customers will be more mobile.
The Auckland Transport Alignment Project a transition to a low emission bus fleet
(ATAP) aligns central and local government are identified for development by AT and
priorities for land transport. These priorities its partners.
include:
Copyright
• Encouraging mode shift from cars to public
This report is open source and may be cited
transport, walking and cycling
and shared for the purposes of furthering
• The adoption of low emission vehicles the global research and development of low
emission bus technologies.
• Meeting our wider environmental
commitments such as the Paris Agreement Contact:
and the C40 Fossil-Fuel-Free Streets Darek Koper, Manager Bus Services, AT Metro
Declaration. Service Delivery | Integrated Networks
20 Viaduct Harbour Avenue, Auckland 1010
A focus of Auckland Transport’s Sustainability
Framework is low emission transport choices, Darek.Koper@AT.govt.nz
which mitigate climate change, improve air
electric vehicles
quality and reduce the city’s reliance on fossil 0 new in t
d 2 h eA
fuels. One of the framework’s key actions is to an uc
d
develop a Low Emission Bus Roadmap. AT’s oa
kla
r
Statement of Intent 2019-2021 commits to
he
nd
t
on
Tra
development of this roadmap in the 2018/19
s
nsp
year. Our customers are overwhelmingly with
use
ort
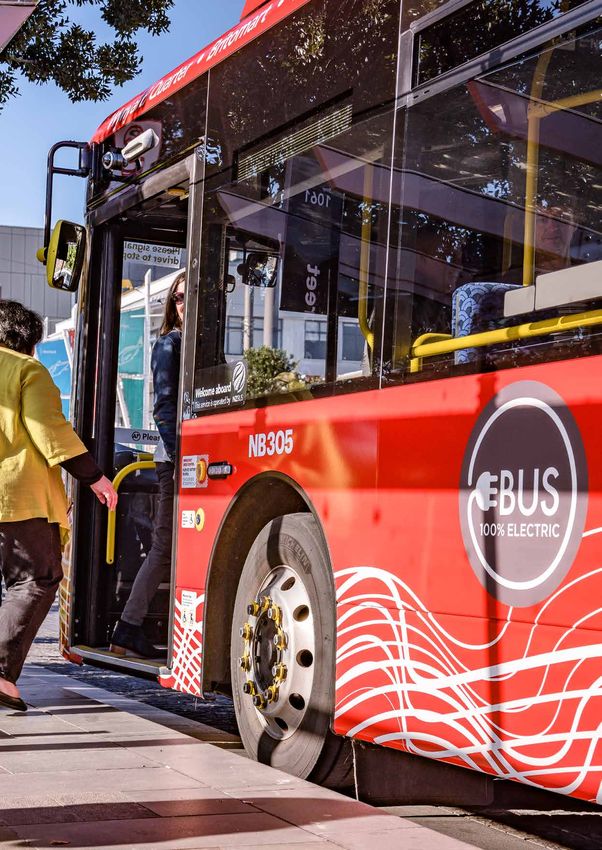
us on this journey – the majority of over 18,000
Two e-b
fleet
submissions on the Regional Land Transport
Plan 2018-2028 agreed that transport’s impact
on the environment is a key challenge.
The Low Emission Bus Roadmap presents a
baseline for transition of the Auckland bus fleet
to a low emission fleet, with key milestones
at 2020, 2025 and 2040. The baseline will be
updated and reviewed regularly as technology
advances and costs reduce. Current barriers to
Auckland Transport Low Emission Bus Roadmap 2018 | 3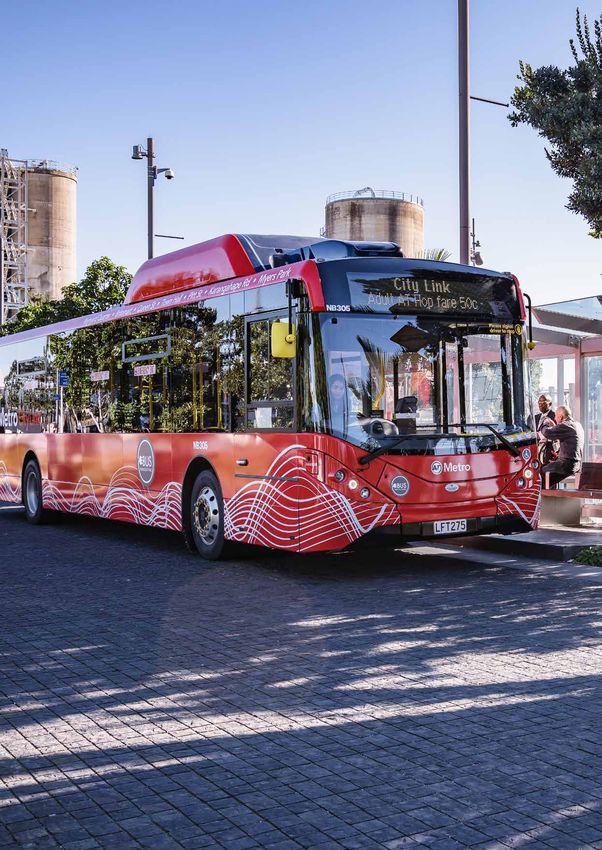
< Contents

0.1 Executive summary
4 | Auckland Transport Low Emission Bus Roadmap 2018
Contents >

The pathway to cleaner air for Auckland by eliminating diesel buses from
the city's roads.

                          2040
                          full zero emission bus fleet

                                                                                       2025
                                                   procure only zero emission buses

        2019 - 2025
        further low emission bus trials

                                              May 2018
                                pilot two e-buses on City LINK

                                                         Auckland Transport Low Emission Bus Roadmap 2018 | 5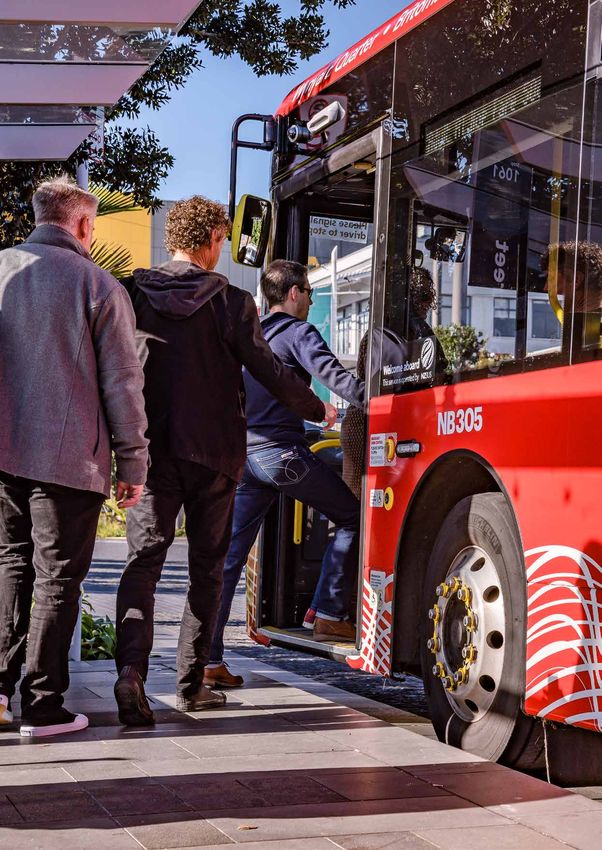
< Contents

This Low Emission Bus Roadmap is a baseline thought piece and tactical document
that outlines the pathway to transition Auckland’s bus fleet to zero emissions by 2040.
The roadmap reviews the policy and bus market context, assessment of bus technology
and fleet options and associated benefits, costs and challenges for this transition.
It also outlines next steps.

In Auckland, diesel vehicles are estimated             deliver significant benefits to the environment
to be responsible for 81% of all vehicle-              as well as to the health of the local population.
related air pollution health costs,                    Over 20 cities globally have made policy
estimated at $466 million annually.                    commitments to stop purchasing diesel buses
                                                       and have zero emission bus targets. In 2017,
In November 2017, the Mayor of Auckland                only 10% of the global bus stock operated as
joined 11 other cities in signing the C40              low emission vehicles but given the pace of
Fossil-Fuel-Free Streets Declaration. The              international development and deployment
declaration commits Auckland to buying only            of electric bus technology − in terms of both
zero emission buses from 2025 and ensuring a           technical capability and commercialisation −
major area of the city is zero emission by 2030.       AT’s long-term vision for a full zero emission
                                                       bus fleet by 2040 is thought to be achievable.
In the context of these commitments,
AT is targeting a full zero
                                                       Life cycle analysis and trial of options
emission bus fleet by 2040.
                                                       We have worked with the Low Carbon
Approximately 1,300 diesel buses are in                Vehicle Partnership (LowCVP) in the UK
operation in Auckland, with variable fleet             as we progressed to developing this Low
sizes, Euro standards and deck configurations.         Emission Bus Roadmap. Life cycle evaluation
Full conversion of Auckland’s bus fleet to             of the range of low and zero emission bus
zero emission vehicles will reduce life cycle          technologies and fuels shows that battery
greenhouse gas emissions (GHG) from buses              electric buses (BEV or e-bus) will deliver
by 72%, and eliminate the tail-pipe emissions          significantly lower GHG emissions compared
of the various oxides of nitrogen (NOx) and            to conventional diesel buses, benefiting from
particulate matter (PM). This result would             New Zealand’s renewable electricity grid. BEVs

                                 ZERO
 tail-pipe emissions                                                               less life cycle
 of nitrogen oxides
 (NOx) and particulate
 matter (PM)
                                                                 72%               greenhouse gas
                                                                                   emissions (GHG)
                                                                                   from electric buses

6 | Auckland Transport Low Emission Bus Roadmap 2018
Contents >
have a 65% share of the global low emission The roadmap also recommends a ‘quick win’
bus market and are the most commonly opportunity for the City LINK service to be run
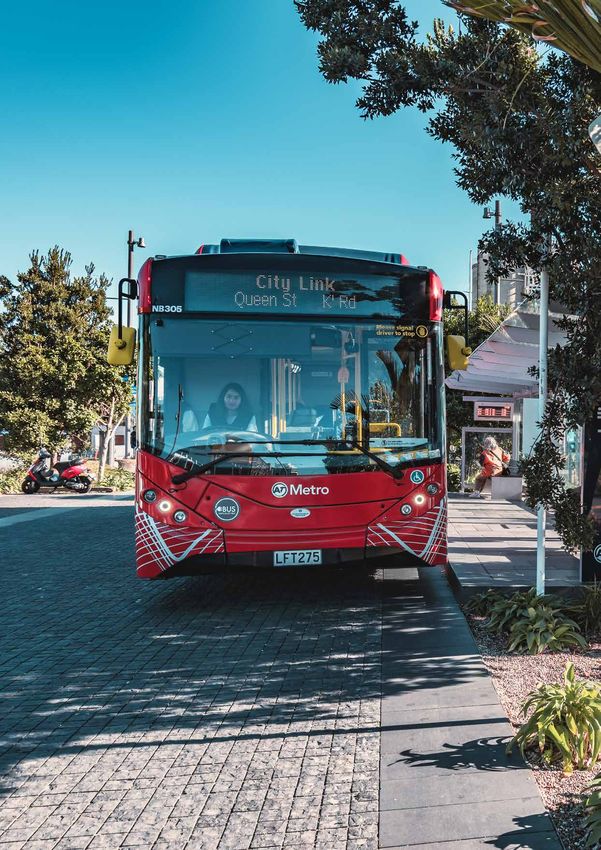
adopted technology. From 2018, AT is trialling by fully electric buses from November 2020
two e-buses on the City LINK service, with when a new service contract is due to start.
positive results in terms of service reliability,
customer feedback and operational savings. Challenges to reaching the 2040 goal
There are challenges ahead. Transitioning
The preferred strategic option for
Auckland’s bus fleet involves high capital
implementing the replacement programme of
outlay and set-up costs, although the capital
zero emission buses (ZEV) is for bus operators
costs of both e-buses and lithium ion batteries
to purchase the vehicles and AT to specify
is expected to fall as battery technology
for all contracts that from 2025 new buses
improves and market competitiveness
for end-of-life replacements and fleet growth
increases (see Figure 01). The wide variety
must be zero emission vehicle-only. This
of bus makes, models and ages, makes
option meets the C40 commitment for zero
retrofitting existing buses with battery
emission-only purchases from 2025. To achieve
electric or plug-in hybrid propulsion
100% ZEV before 2040 under the preferred
expensive. Some questions remain about
strategic option, and to reduce the risk of
service longevity of the batteries and their
operators being stranded with diesel buses,
‘green’ bottom line across their life cycle.
AT would specify − and advise bus operators
early − that all remaining diesel buses (~18%
Finance issues
of total fleet) must be removed from service
by 2040 and replaced with ZEV. This will Support for further trials may come from
allow bus operators to plan their replacement a combination of the Energy Efficiency
ahead of the 2040 deadline. A 2025 start and Conservation Authority’s (EECA) Low
date enables Auckland to benefit from further Emission Vehicle Contestable Fund and AT.
technology developments in the interim and The total operating costs of e-buses should
gives AT more time to prepare the necessary reduce over time, as the increased Peak
infrastructure. This will be reviewed and Vehicle Requirement (PVR) contract rate
updated as part of the next roadmap update. due to higher capital costs will be offset by
the lower operational in-service km rate.
Auckland Transport Low Emission Bus Roadmap 2018 | 7
< Contents

Next steps with this roadmap                                                            • Continue to collaborate with international
Given its early stage and iterative nature,                                               organisations such as C40 and other
the next steps with the roadmap are to                                                    New Zealand cities to share learning
adopt and progress its principles and:                                                  • Continue to undertake trials
                                                                                          and demonstrations.
• Establish a national Low Emission Bus
  Working Group of industry stakeholders                                                The roadmap will be refined and updated
  to influence national policy including                                                on a 12-18 month basis as further
  fiscal incentives, growing the market,                                                market information becomes available,
  and facilitating supply chains                                                        technology advances and outcomes
                                                                                        of further trials are confirmed.

$6.00
$5.75                            $5.86

$5.50
$5.25
$5.00                                                    Figure 1: The capital cost of electric buses (shown below in thousand USD) is
$4.75                                                    predicted to reach parity with diesel buses by 2030 as the cost of batteries falls.
$4.50                                                    Capital costs are offset by reduced operating costs, as shown (left) in the 2018
$4.25                                                    trial of two e-buses on Auckland’s City LINK.
$4.00
$3.75
$3.50
$3.25
$3.00
$2.75
$2.50
                                                   600
$2.25
                                                             150
$2.00                                              500                  98            79
$1.75                                                                                          66        57         49         43         38
$1.50                                              400

$1.25        $1.44
                                                   300
$1.00
$0.75                                              200
$0.50
$0.25                                              100
$0.00
                                                     0
             electric bus
             Cost per circuit

                                diesel bus
                                Cost per circuit

                                                            2016       2018          2020     2022      2024       2026       2028       2030

                                                                        e-bus vehicle

                                                                        e-bus battery

                                                                        diesel bus

                                                          Source: Bloomberg New Energy Finance. Notes: e-bus with
                                                          a 250kWh battery, initial battery price at $600/kWh.

8 | Auckland Transport Low Emission Bus Roadmap 2018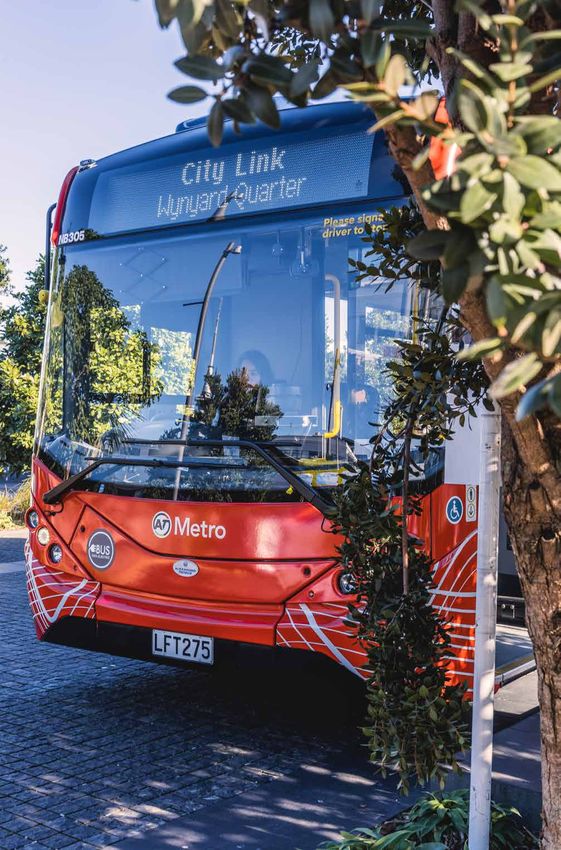
Contents >

Timeline to 2040

Figure 2 identifies some key decision and intervention points on the timeline to 2040 for a full low
emission bus fleet.

                          2020                                                       2030
      2018                                    2024                                                       2040
                                                                2025
                       • Infrastructure                                             • Fossil-fuel-free
• Low emission bus       trials, including                                            streets in parts   • All buses are ZEV
                         opportunity         • New Public                             of Auckland
  working group                                                                                          • Grid upgraded
                         charging trials       Transport       • C40 fossil-fuel-
• Research: zero                               Operating         free streets                              to support ZEV
  emission buses,      • Full City LINK                                                                    buses and fleet
                                               Model (PTOM)      – 2025 zero
  opportunity            e-bus fleet
                                               contracts         emission bus                            • AT possibly
  charging, the grid   • Further zero                            procurement                               invests in ZEV
                                             • AT possibly
• City LINK e-bus        emission bus                            deadline                                  depots
                                               invests in
  x 2 trial              trials including
                                               strategic ZEV   • New procurement
                         hydrogen
• Further zero                                 depot             is zero emission
  emission trial on                                              buses only
  380 Airporter

Contracts: Review PTOM performance, introduce new/renew contracts

Trials: City LINK, Airporter 380 and other routes

Legislation: Monitoring and review

Infrastructure: Upgrading bus depot locations and associated infrastructure eg. grid

Regulations: Improving Vehicle Dimensions and Mass (VDAM) and introduce fiscal incentives

Figure 2: Timeline for implementing Auckland’s Low Emission Bus Roadmap.

                                                                       Auckland Transport Low Emission Bus Roadmap 2018 | 9
< Contents

1.0 Introduction
10 | Auckland Transport Low Emission Bus Roadmap 2018
Contents >

This Low Emission Bus Roadmap was initially developed as a thought piece in
partnership with the Low Carbon Vehicle Partnership (LowCVP) in the UK and Transport
Research Laboratory (TRL) Limited. Their final report of January 2018 assessed
the challenges and opportunities inherent to Auckland’s context, and the range of
potential low emission options for the city’s bus fleet. Alongside this report, AT has
investigated a set of potential implementation and indicative funding scenarios to
identify preferred options and pathways to a full low or zero emission fleet by 2040.

Auckland Transport’s Low Emission                        verification (obtained through trials
Bus Roadmap 2018:                                        and further information) that the price
                                                         differential between zero emission and
• Outlines the strategic context, including
  policy and opportunities                               diesel buses has reduced as forecast:

• Identifies the research, trials and                    a. For single-deck buses – Auckland
  demonstrations of new technologies                        transitions to a battery electric new
  being undertaken                                          bus solution from 2025 replacing
                                                            diesel fleet at the end-of-life and as
• Identifies the barriers that need to be                   new fleet will be required for annual
  resolved in order to fully electrify Auckland’s           growth and new contracts, and takes
  bus fleet over the next two decades                       into account overnight depot charging
                                                            and on-route ‘opportunity’ charging.
• Analyses and evaluates the range of low
                                                            A possible future hydrogen fuel cell
  emission bus technologies and fuels
                                                            technology may also be used.
• Estimates the total cost of ownership of
                                                         b. For double-deck buses – as for
  new technologies
                                                            single-deck buses, but recognising
• Assesses the potential implementation                     zero emission capable, large double
  and financing options                                     deck vehicles are still developing
                                                            and a slower uptake may be
• Identifies next steps to be taken.                        required for all new contracts from
                                                            the start of 2025. A possible future
1.1 Recommendations
                                                            technology could be electric buses
The LowCVP and TRL Low Emission                             fitted with hydrogen fuel cells.
Bus Roadmap report made a series of
                                                    3.   The trial and demonstration of new
recommendations that we have reviewed
                                                         technologies has been invaluable
and further refined as follows:
                                                         in other cities and this approach is
1.   AT targets a full zero emission bus fleet           recommended strongly in Auckland.
     by 2040.                                            Demonstration trials should include:

2.   All buses in Auckland are to be procured            a. Battery electric buses (single and
     as zero emission vehicles from 2025 at                 double-deck) with depot and
     the latest and preferably earlier, subject             on-route charging (rapid plug-in
     to refined cost/benefit analysis and                   charging, inductive and pantograph)

                                                         Auckland Transport Low Emission Bus Roadmap 2018 | 11
< Contents
b. Hydrogen electric trials (incorporating 10. To support long-term sustainability and
hydrogen supply) reduce the end-of-life environmental
impacts of zero emission buses,
c. Retrofitting of existing Euro 5
engage with central Government
diesel buses with electric and/or
and the automotive industry put
hydrogen fuel cell technology.
measures in place for the re-use and
These trials will guide local and national recycling of lithium batteries.
policy development and validate roadmap
recommendations. 1.2 Challenges to the 2040 goal
A number of important barriers have been
4. A ‘quick win’ start on a larger-scale trial
identified in the LowCVP and TRL report,
of the City LINK electric bus service
and are set out below. Some of these will
from November 2020 when the current
need to be resolved in order to electrify AT’s
bus contract for that route is renewed.
bus fleet fully over the next two decades:
5. As part of the iterative review of
the roadmap, undertake a detailed Regulatory and financial
assessment of all Auckland bus 1. Weight restrictions imposed by Vehicle
routes for BEVs and charging Dimensions and Mass (VDAM) regulations
infrastructure deployment, and current are presently restricting adoption and
fleet replacement life cycles. capacity of some battery electric buses,
both for single and double-deck vehicles.
6. Assess the practical and cost impact of
a large electric bus fleet deployment 2. High upfront capital costs of
on Auckland’s electricity supply grid. battery electric buses and retrofit
low emission technologies.
7. Establish a Low Emission Bus Working
Group, to include a range of public 3. The high set-up cost of electric charging
and private national regulatory, infrastructure, including upgrade of
operational and supply stakeholders. the power distribution network to
accommodate overnight charging
8. Continue to engage with international
loads at most or all depots and wider
organisations such as the C40 Low
implications for the electricity industry;
Emission Vehicle Network to help expand
and potential requirement for roadside
knowledge and understanding of the
‘opportunity’ charging infrastructure,
deployment of low emission buses.
which could de-limit the number
9. Collaborate with other cities in of routes BEVs can operate on.
New Zealand to increase influence
4. Potential for high renewal cost
on central Government policies, to
of batteries, as longevity in
share learning and to cooperate
service remains uncertain.
with vehicle procurement.
12 | Auckland Transport Low Emission Bus Roadmap 2018Contents >
5. The lack of national fiscal incentives 8. Lack of procurement and ownership
to support the development of a low models for low emission buses,
emission bus market in New Zealand. charging/refuelling infrastructure
and depots to retain competition
Low emission bus market
between bus operators.
6. The wide variety of bus makes,
models and ages of AT’s contracted 9. Alternative hydrogen fuel cell technology
bus fleet could make any retrofitting is not yet developed in New Zealand
of battery electric or hydrogen fuel and requires third-party hydrogen
cell electric buses expensive. production and infrastructure.
7. Lack of established supply chains 10. Questions remain as to the ‘green’
and after-market support. An added bottom line of batteries across their
challenge is that bus manufacturers whole life cycle and hydrogen fuel.
do not currently produce three-axle Bus operators’ perspectives
battery electric buses, and three-axle
11. Bus operators’ lack of confidence in
double deck electric buses are only in
new low-emission bus technologies,
the early stages of development.
being uncertain of their performance.
Auckland Transport Low Emission Bus Roadmap 2018 | 13< Contents 2.0 National and regional policy frameworks 14 | Auckland Transport Low Emission Bus Roadmap 2018
Contents >

The Low Emission Bus Roadmap has been developed in the context of recent national and
regional policies and frameworks.

2.1 Climate change and air quality                natural gas, oil, hydroelectric, geothermal,
Experience around the world reveals that          coal and wind. All petroleum products for
Government policy has played an instrumental      transport use are imported. This means
role in helping to stimulate the market for low   that there are energy security benefits in
emission buses and associated infrastructure.     moving away from fossil-fuelled transport.

Policies include:                                 New Zealand has adopted the Vehicle
                                                  Exhaust Emissions Regulations, aimed
• Introducing subsidies and grants
                                                  at reducing road transport air pollution
• Allocating funding for demonstration
                                                  emissions. These currently require new
  trials of new technologies
                                                  heavy-duty vehicles, including urban buses,
• Setting vehicle emission targets.               to meet the Euro 5 standard as a minimum.
                                                  Auckland’s current fleet is operated by a
New Zealand is a part of international
                                                  range of diesel Euro 3 to Euro 6 standard
climate change negotiations under the
                                                  buses. (See figure 6 on page 21.)
United Nations Framework Convention
on Climate Change (UNFCCC), the Kyoto
                                                  2.2 Electric vehicle programme
Protocol and the Paris Agreement. New
                                                  A package of measures was announced by
Zealand ratified the Paris Agreement in 2016
                                                  the previous Government in 2016 aimed
setting a target to reduce GHG emissions
                                                  at increasing uptake of electric vehicles.
to 30% below 1990 levels by 2030.
                                                  Examples of the measures are listed below; it is
There is now a greater focus by the               important to highlight that these are focussed
Government on climate change, which includes      primarily on light duty vehicles (mainly cars):
an Independent Climate Change Commission,
                                                       a. A target to double the number
a Zero Carbon Act, and a potential
                                                          of electric vehicles in New
national target of zero carbon by 2050.
                                                          Zealand every year to reach
New Zealand benefits from a diverse range                 approximately 64,000 by 2021.
of energy sources, with abundant fossil fuel           b. Extending the Road User Charge
and renewable energy resources. Eighty                    (RUC) exemption on light electric
percent of this country’s energy is derived               vehicles until they make up 2%
from renewable energy. The very low carbon                of the light vehicle fleet.
intensity of electrical power in New Zealand
                                                       c. A new RUC exemption for heavy
makes the electrification of transport
                                                          electric vehicles until they make
particularly attractive. Currently there are no
                                                          up 2% of the heavy vehicle fleet.
coal-fired power plants in the South Island.
Hydroelectric power is the dominant form               d. Government agencies are co-
of electricity generation, with wind and                  ordinating activities to support the
solar beginning to contribute more to the                 development and roll-out of public
energy mix. The North Island’s electricity                charging infrastructure including
generation is much more diverse, including                providing information and guidance.

                                                      Auckland Transport Low Emission Bus Roadmap 2018 | 15
< Contents
e. A Low-Emission Vehicle Contestable • The Auckland Plan
Fund of up to NZ$6 million per • Low Carbon Auckland
year to encourage and support
• The City Centre Master Plan
innovative low-emission vehicle
• AT’s Sustainability Framework.
projects (administered by EECA).
Auckland Council has a statutory obligation
2.3 Auckland policy framework
to meet national emission standards for air
Auckland Council’s sustainability objectives quality. Over recent years concentrations of
y focus on reducing greenhouse gas and air air pollutants such as fine particulate matter
pollution emissions and lowering reliance on (PM10), nitrogen dioxide (NOx) and sulphur
fossil fuels. Aligned with these objectives dioxide (SO2) have stabilised in Auckland.
is the ambition to expand the adoption of However, heavily trafficked areas of the
low emission vehicles and to reduce car use city centre can experience higher emission
through greater adoption of sustainable concentrations and breach air quality targets.
modes of transport. Key plans that support
these aims and objectives include:
Qua
y St
t
es
tW
S
oms
Figure 3: Auckland road transport
Cust
emissions profile, including city centre
air quality hotspots.
St
awe Wol
h fe S Cus
ns t tomS
Fa t Ea
st
Swa
n The orange dots represents locations
a St
son
St
St
where weekly concentrations of NOx
Gore
gihu
exceed the proposed annual Auckland
t
rt S
Fort St
Tan
Ambient Air Quality Standards
Albe
St
(AAAQS) and the World Health
n
St
Quee
Organisation (WHO) standards of
son
Wyn
dha
m St 40µg/m3.
Hob
These air quality hotspots are
An
largely clustered around major road
za
hener St
Te Taou
intersections and busy bus routes,
cA
Kitc Res Railway
ve
which coincide with areas ofGardens
high
ve pedestrian traffic areas.
Vict en A
oria
St E Bow
ast Therefore, we are concentrating on
urbanParliament
routes first.
ReserveCity LINK has the
Beach Rd
t
er S
Wel highest profile and operates in areas Ngaoho Reserve
t
lesl
es S
ey S
hen
tW of highest public exposure, hence our
c
est
Prin
Kitc
Albert Park 2018 trial area. Ideally we are seeking
Constitution
to initially focusHill
our cleanest buses
NOx µg/m3 in areas with the highest numbers of
23 .39 - 30 .00 people. Fraser
Park
30 .01 - 35 .00 Par
St
nell
y
Ris
le
35 .01 - 38 .00
e
an
St
38 .01 - 40 .00
40 .01 - 47 .60
St
Grafton Rd
ds
on
m
16 | Auckland Transport Low Emission Bus Roadmap 2018
SyContents >
3.0 Strategic context
Auckland Transport Low Emission Bus Roadmap 2018 | 17< Contents
An assessment of the current Auckland bus fleet profile has been undertaken and its
contribution to environmental impacts in the city and region.
3.1 International context – uptake however costs remain high for implementation.
of battery electric buses 3.2 Auckland context – environment
In 2017, there were over 340,000 low and health impacts
emission vehicles operating (~10% of A review of the main sources of CO2, NOx
global bus stock) with a large proportion and PM10 (particulate matter) emissions in
in China (~75% of the clean bus market). Auckland shows that road transport is the
largest source of greenhouse gas emissions
Battery electric buses have a 65% share of
and accounts for 34.8% of emissions.
the global low emission bus market and are
the most commonly adopted technology. Cars are responsible for the highest road
Plug-in hybrid buses are the next most transport GHG (24%), with commerical vehicles
popular technology, serving 18% of the being the next largest emission source (11%).
low-emission bus market. Hybrid buses This highlights the importance of encouraging
have the third highest take up at 12%. Asia Aucklanders to make the shift from private
has the largest market share of battery vehicles to sustainable public transport.
electric, hybrid and plug-in hybrid buses.
Continuing health research has revealed that
A technology to watch or to trial early will be persistent exposure to relatively low levels of
hydrogen fuel cell. Other parts of the world are air pollution can contribute to or exacerbate
in the early trial stages with favourable results, health problems. These include respiratory
Biomethane 6,472
Hydrogen fuel cell 131 9,300 B 20 biodiesel
Plug-in hybrid 63,703
229,593 Battery electric
Hybrid 42,041
Figure 2: Global technology share of the low emission bus market.
18 | Auckland Transport Low Emission Bus Roadmap 2018Contents >
National and regional funding is still available in Europe, US, China, and Canada
to support zero emission capable buses and EV charging infrastructure, to help
reduce high capital costs. For example, £100m ($197.5m) has been put aside in
the UK alone for bus subsidy grants between FY 17/18 and 20/21. In 2017, this
equated to 326 low emission (mostly electric or hybrid electric) buses in the UK.
Europe has far more aggressive targets for greenhouse gas emission-free
city centres, with penalties/charges for not complying.
More than 20 cities globally have made policy commitments to stop purchasing
diesel buses and have zero emission bus targets. London will have a total
zero emission bus fleet by 2037. Twelve major cities including Auckland,
signed the C40 Fossil-Fuel-Free Streets Declaration in 2017 which:
• Pledges to buy only zero-emission buses from 2025
• Ensure the major area of their city is zero emission by 2030.
Wellington (Tranzit) - 10 fully electric double deckers were rolled out in
Wellington in July 2018, with another 22 to be added by 2021. They will operate
on main arterial roads between the suburbs of Island Bay and Churton Park.
These buses are two-axle and only have a similar capacity as AT’s three-axle
single-deck buses.
Christchurch (Red Bus) – Have ordered three single-deck fully electric buses
identical to the ones AT is running on the City LINK).
Figure 4: The international and New Zealand context.
and cardiovascular conditions and reduced life The LowCVP report shows that in the New
expectancy. Children are particularly at risk Zealand context, BEVs will deliver significantly
with exposure to air pollution causing asthma. lower GHG emissions over their whole life
Nearly 130 Aucklanders die prematurely cycle compared to conventional diesel buses,
every year due to pollution emitted from benefiting from this country’s renewable
motor vehicles and 215,000 days are lost electricity grid. The complete conversion of
due to illness or poor health. Diesel vehicles AT’s diesel bus fleet to e-buses will result
in Auckland are estimated to be responsible in a life cycle greenhouse gas emission
for 81% of all vehicle-related air pollution reduction of 72%, and eliminate the tail-pipe
health costs, with the annual health costs emissions of the various oxides of nitrogen
estimated at $466 million. Particulates from (NOx) and particulate matter (PM), bringing
burning diesel are particularly hazardous about significant benefits to the environment
and have been classified by the World Health and to the health of the local population.
Organisation as a carcinogen with no safe limit.
Auckland Transport Low Emission Bus Roadmap 2018 | 19< Contents
Auckland’s Greenhouse Gas (GHG) Emissions
Stationary Energy -
Manufacturing & Industrial 19.7% 34.8% TRoad
ransport -
Stationary Energy -
Commercial 3.8% ransport -
0.1% TRail
Stationary Energy -
7.8% 1.6% TAir
ransport -
GHG
Residential
ransport -
3.2% TSea
Agriculture 5.8%
Waste 6% ugitive
2.2% F(non energy)
ndustrial
15% I(non Process
energy)
Figure 5: Auckland's CO₂e emissions profile (2014). (Source Auckland Plan).
We commissioned Emission Impossible are running Euro 6 diesel buses, replacing older
Ltd to estimate the social benefits of diesel buses, with a total of 196 in operation.
progressively moving to an e-bus fleet in A breakdown of the fleet composition by
Auckland. Figures in Table 1 are derived Euro standard in 2018 is shown in figure 6.
by comparing emissions from e-buses to
emissions from Euro standard 6 diesel buses, At present 91 buses are double-deck, with
and capture all the relevant emissions: CO2 a further 98 double-deck buses on order for
equivalent, PM10, NOx, CO, HC and noise. delivery before the end of 2018. The number of
double-deck and extra-large single-deck buses
3.3 Auckland context – the city’s bus fleet will increase in the future. Buses in the current
fleet range from ~11m to 13.5m, and include
Auckland’s buses are privately owned.
both two and three-axle vehicles. Auckland
AT contracts all its urban and school bus
bus operators have strong links with European
services to 10 bus operators. There are
bus manufacturers, with many purchasing
currently 94 routes, using approximately
models from ADL, Volvo, MAN and Scania.
1,300 diesel buses. The fleet size varies
considerably between operators, with NZ Bus Urban bus fleet must not exceed an average
running over 500 buses, while some smaller age of 10 years, in line with requirements
operators have fewer than 100 buses each. under AT’s Public Transport Operating Model
(PTOM) contracts, however the maximum
Of the current fleet, 477 buses are more than
permitted age can be up to 20 years. Routes
10 years old. Some of Auckland’s bus operators
20 | Auckland Transport Low Emission Bus Roadmap 2018Contents >
Social benefits Cumulative values Net Present Value
(2017 values - $millions) of cumulative benefits
Air emissions reductions $104.6 $41.9
Noise reductions $36.7 $14.7
Total benefits $141.3 $56.7
Table 1: Total benefits over 23 years from the progressive move to a low emission bus fleet in Auckland.
will be re-tendered through the 2020s in new technologies can be procured (unless a
several batches in line with recently issued separate scenario is selected, e.g. fast-tracking
new PTOM contracts. This essentially defines deployment), as the specifications for fleet
the timescale over which the requirements for will need to be included in route tenders.
Figure 6: Auckland’s fleet by age in years and composition of Euro standards
350
300
250
Bus fleet numbers
200
150
100
50
0
0 1 2 3 4 5 6 7 8 9 10 11 12 13 14 15 16 17 18 19 20
Flat age (years)
70%
60%
Percentage of bus fleet
50%
40%
30%
20%
10%
0
Euro III Euro IV Euro V Euro VI
Bus engine emission standard
Auckland Transport Low Emission Bus Roadmap 2018 | 21< Contents 4.0 Developing the Low Emission Bus Roadmap 22 | Auckland Transport Low Emission Bus Roadmap 2018
Contents >

To migrate over time to a more renewable, greener technology, AT needs to know what to
migrate to, and by when. We need an evidence base for investment in our bus fleet based
on life cycle analysis.

4.1 Assessment of options                          • Compressed natural gas (CNG): spark-
The Low Emission Bus Roadmap report was              ignition engine powered by gas (natural
based primarily on life cycle analysis and looks     gas or biomethane), with compressed gas
at the role of different low emission fuels          stored on board the bus. Biomethane is
and technologies in advancing Auckland’s             a biofuel produced from organic waste.
bus fleet to zero emission by 2040, and the
                                                   • Biodiesel: is a biofuel produced from animal
practical means to deliver this vision. The
                                                     or vegetable oil feed-stocks which can be
range of low emission bus technologies
                                                     used in a conventional diesel engine. B20
being deployed across the world are:
                                                     (a blend of 20% biodiesel and fossil fuel)
• Diesel hybrid: series hybrid, the diesel           produced from sustainable waste feed-
  engine only charges the battery, which then        stocks was considered for this study.
  powers the electric motor; in parallel hybrid
                                                   • Hydrogen Fuel Cell (HFC): Electric
  the powertrain can be switched between
  the diesel engine and the electric motor.          propulsion using a hydrogen fuel cell as its
                                                     power source. Hydrogen fuel cell buses have
• Plug-in hybrid (PHEV): similar to diesel           been very lightly appraised in the study,
  hybrid, but with a larger battery that is          since the technology is in ‘early adopter’
  charged from the electricity grid, enabling        demonstration phase across the world and
  electric-only operation for part of a journey.     is subsidised heavily by governments.
• Battery-electric (BEV): electric                 BEVs offer the best all-round opportunities,
  propulsion, powered solely by
                                                   however HFC buses may be a potential future
  electricity stored in batteries.
                                                   solution for longer range requirements and
• Retrofit battery-electric and plug-              larger fleet, subject to third-party hydrogen
  in hybrid technologies: conversion of            production and infrastructure development.
  existing diesel buses to low or zero-            There is an emerging opportunity to trial
  emission powertrain technologies.                HFC buses with Ports of Auckland.

                                                      Auckland Transport Low Emission Bus Roadmap 2018 | 23
< Contents
4.2 Roadmap methodology • Baseline data gathering
Based on the rate of adoption of different • Low emission bus technology appraisal
low emission buses globally, and AT’s (including bus route modelling
requirements, the Low Emission Bus Roadmap of three typical urban bus routes:
report recommended a low emission 973, City LINK and Inner LINK)
bus technology roadmap be developed,
• Low emission bus technology
accompanied by key actions we should take
and fuel comparison
to achieve a zero emission bus fleet by 2040.
• Low Emission Bus Roadmap development.
The methodology involved evaluating
each low emission bus technology and
fuel against a set of criteria in terms of
suitability for AT’s fleet and operational
considerations. The methodology included:
Fuel production
Assessment of the C0₂e
emission associated
with of production and
distribution the liquid/
gaseous fuels and
electricity. In-use
Tailpipe C0₂ from
Disposal
driving, taking into Assessment of
account a real world environmental impact
bus route in Auckland. of “end-of-life” scenario.
Vehicle production Includes. re-using
Assessment of the C0₂e components, recycling
emission associated with materials and landfill.
of production of the
vehicle, including lithium
battery manufacture.
Figure 6: Life cycle analysis methodology.
24 | Auckland Transport Low Emission Bus Roadmap 2018Contents >
5.0 Assessment of early trials
and strategic options
Auckland Transport Low Emission Bus Roadmap 2018 | 25< Contents
An early e-bus trial has commenced on the City LINK bus route, which is already provided
inputs to the low emission roadmap.
5.1 City LINK e-bus trial early results positive. Initial data indicates that, despite an
Auckland Transport is working in unresolved issue with installing the charging
partnership with NZ Bus to operate units (see Appendix 1 for further detail)
two electric buses for an initial six- the chargers are functioning sufficiently to
month trial on the City LINK service. enable the vehicles to easily complete a full
day of operations on the City LINK service.
After arrival in Auckland in February 2018 the The buses on average are using 60-64% of
vehicles underwent all NZ compliance testing their battery power for a full day’s work.
and were delivered to NZ Bus in April for
final preparations, including driver training, Each bus and charger cost $840,000 and
installation of ticketing, safety equipment were purchased with a $500,000 contribution
and charger units, and AT branding. from EECA’s contestable fund. Early results
show overall operational savings (18 June -
The trial began in service during May 2018 2 Sept) of $5,759 from the two buses, which
and the vehicles are performing well, with travelled a combined 9,785km in this period.
combined vehicle availability at 84%. The
confidence of operators to fully use the Figure 8 demonstrates lower in-service costs
vehicles is growing and customer feedback is per kilometre, per hour and per circuit for trial
$6.00
$5.91
$5.75 $5.85
$5.50
$5.25
$5.00
$4.75
$4.50
$4.25
$4.00
$3.75
$3.50
$3.25
$3.00
$2.75
$2.50
$2.25
$2.00
$1.75
$1.50 $1.52
$1.50
$1.25
$1.00 Figure 8: Comparative operating costs
$0.75 $0.78 of diesel vs electric six-month trial on
$0.50 the City LINK e-bus 305 in 2018, data
$0.25 from 18 June to 2 September.
$0.20 $0.18
$0.00 $0.05
circuit Eb
Cost per
km Eb
Cost per
km Db
Cost per
hour Eb
Cost per
hour Db
Cost per
pax Eb
Cost per
pax Db
Cost per
circuit Db
Cost per
26 | Auckland Transport Low Emission Bus Roadmap 2018Contents >
e-bus 305 as compared with diesel buses. 5.2 Assessing transition and
(Bus 304 produced similar results – see ownership options
Appendix 1.) These lower operating costs Five strategic options for the transition to low
are expected to reduce the Total Cost of
emission buses in the Auckland fleet have
Ownership of electric buses and offset
been identified and are outlined below.
high capital costs. Further trials will enable
We have assessed the merits of each
total cost of ownership comparisons
approach, and recommend moving to BEVs
with diesel fleets. This early data is
from 2025 by AT specifying that new buses
further discussed in option E below.
for end-of-life replacements and fleet growth
The trial project aligns with this roadmap are BEV-only for all contracts from the start of
and is already informing future legislative 2025. All options were carefully considered.
requirements and implementation strategy. They included scenarios with different rate
A further e-bus trial is being developed for of transition to zero emission fleet and start
the 380 Airporter service and potentially dates. The rate of transition from diesel to
the 309 service. This trial will partner zero emission fleet is seen on figure 8.
with a different bus manufacturer and
slightly different technology, charging We recommend that bus operators
station and bus specification. purchase the electric buses (as they do
now for diesel buses). AT does not require
Further trials are necessary for different vehicle capital to purchase fleet, and fleet costs are
types, to complete a broader understanding. incorporated into contract rates, or Peak
Recommended option Benefits Disadvantages
No ZEV contract • Meets Mayoral commitment to buy only • Operators purchasing small
requirement until end ZEV from start of 2025 numbers of electric buses for
of 2024 patronage growth likely to be
• Later start maximises benefits of
more expensive (discounting
Then all new contracts technology development, reduced
for bulk purchase not
progressively from capital cost of vehicles and cheaper
modelled)
start 2025 specify bus future replacement batteries
replacements and growth • Achievement of 100% ZEV
• Ability to implement City LINK fleet
as ZEV-only, with early passes beyond 2040 unless
contract (opportunity) as bigger scale
indication from AT o this AT specify all remaining diesel
trial of a ZEV-fleet and assess its impact
requirement from 2020 fleet to be replaced by 2040
on depot charging and grid
• More time to prepare for infrastructure
and to plan fleet change
• Gives AT more time initially to consider
and procure depots and implement large-
scale charging infrastructure upgrades
(not in RLTP)
• Nearer to 2030 capital cost per bus parity,
with estimated total operating cost parity
or savings forecast from 2025
Table 2: Benefits and disadvantages of preferred implementation option.
Auckland Transport Low Emission Bus Roadmap 2018 | 27< Contents
Vehicle Requirement (PVR) variations rates. option for these scenarios provides the ability
to negotiate bulk procurement discounts,
We also recommend a ‘quick win’ and achieve consistent fleet and charging
opportunity for the City LINK service to be infrastructure. It also provides an ability to
full BEV operation from November 2020 re-use batteries for other AT applications.
when a new service contract starts. However, these scenarios require high capital
cost outlay that is not in the Regional Land
Options A – D were also assessed with the Transport Plan (RLTP) and would introduce a
option of AT purchasing the e-bus fleet continuing cost of fleet replacement. Therefore,
and leasing to bus operators. The financing these options are not recommended.
Option A - ZE-bus for all renewals and growth from 2020
Option B - ZE-bus for all renewals and growth from 2025 and City LINK at 2020
Option C - ZE-bus for growth 2019; City LINK in 2020; delay until 2024 for main fleet (at next PTOM expiry)
Option D - ZE-bus for City LINK in 2020; then PTOM, renewals and growth from 2025
Option E - ZE bus for all renewals and growth from 2025 and CityLink at 2020, and all remaining diesel fleet replaced by 2040 (recommended)
100%
90%
80%
70%
60%
50%
40%
30%
20%
10%
0%
2018 2019 2020 2021 2022 2023 2024 2025 2026 2027 2028 2029 2030 2031 2032 2033 2034 2035 2036 2037 2038 2039 2040
Figure 9: Annual increase in percentage of fleet ZEV under options A to E.
Recommended option - Benefits Disadvantages
financing
Bus operators AT does not require capital to Variety of buses that may affect
purchase electric purchase fleet interoperability and charging
buses infrastructure
Fleet costs incorporated into contract
rates (or PVR variations rate) Risk of higher contract costs due
to higher premium for ZEVs
While ZEV purchase price remains
higher than diesel the lower Total Cost No bulk procurement discounts
of Ownership (TOC) should limit the
Operational challenges with ZEV
impact on contract rates
across many routes
Table 3: Benefits and disadvantages of financing the recommended option.
28 | Auckland Transport Low Emission Bus Roadmap 2018Contents >
6.0 Cost assumptions and impacts
Auckland Transport Low Emission Bus Roadmap 2018 | 29< Contents
There are three significant categories of cost to consider: capital (vehicles and
infrastructure); operational (energy and maintenance); and battery renewal.
6.1 Capital costs 6.2 Operational, maintenance
The premium on the purchase price of and renewal costs
e-buses is heavily influenced by the cost Operational costs are detailed in Appendix 3:
of batteries. The expected falling costs of Assumptions. In summary, analysis shows that
battery production and increased normality relative energy costs favour electric over diesel,
of their use have been used to base future and maintenance costs from e-buses with
costs of low emission buses. As Figure 10 fewer moving engine parts than a combustion
demonstrates, e-bus prices are predicted engine are likely to be around $2,000 less per
to reach parity with diesel buses by 2030. bus per year. The additional cost of upgrades
to the power distribution grid and depot
European e-bus and diesel bus upfront price forecast (US$000)
Figure 10: Bloomberg New
600 Energy Finance forecast
150 comparison of upfront bus
500 98 79 and battery prices, based on
66 57 49 43 38 e-bus with 250kWh battery
400
and initial battery price at
300 $600kWh.
200
e-bus vehicle
100 e-bus battery
diesel bus
0
2016 2018 2020 2022 2024 2026 2028 2030
Lithium-ion battery pack price forecast (US$)
Lithium-ion battery pack price ($/kWh) Demand for lithium-ion batteries (GWh/year)
1,200 1,800 EV
1,800 E-Bus
1,000
1,800
ESS
800 1,800
observed price
2030 implies 1,800
600 price $70/kWh 18% learning rate
1,800
2025 implied
400 price $96/kWh 1,800
1,800
200
1,800
0 0
2010 2015 2020 2025 2030
30 | Auckland Transport Low Emission Bus Roadmap 2018Contents >
upgrades is estimated at between $30-$60 the period 2025 to 2040 based on contract
million. Further assessments and studies are PVR rates on par with diesel fleet and fleet
underway to better understand these costs. growth of 3% to cater for patronage growth.
Should the average PVR rates be higher for
Any increased investment in fleet from 2020 zero emission fleet than current PVR rates,
is likely to cause increases in the tendered the net NPV benefits over that period could
prices of future PTOM contract rounds with reduce down to $95m. All other assumptions
PVR rates. Changed requirements for the are explained in Appendix 3: Assumptions.
vehicles to be used on contracted services
within the life of current contracts would Appendix 3 discusses end-of-life options.
trigger variations in payments to operators. E-bus batteries are assumed to reach
The change in costs will be passed on to AT their end of life after seven years and
in the form of higher contract tender prices, to have 80% capacity left. This residual
but may be negotiated down due to lower capacity and the predicted falling prices
in-service kilometre rates. The savings from for new batteries will make used batteries
transition to zero emisson fleet are expected to attractive for other users or applications.
be fully realised by AT in contract prices from
2040 with a net NPV benefits of $152m over
Transitional fleet vs diesel fleet: costs and net savings
transition fleet cost continuation with diesel fleet cost net cost (NPV of savings vs diesel fleet cost)
$375
$325
$275
$225
$175
$125
$75
$25
-$25
-$75
2018
2019
2020
2021
2022
2023
2024
2025
2026
2027
2028
2029
2030
2031
2032
2033
2034
2035
2036
2037
2038
2039
2040
Figure 11: Likely impact on costs incurred under preferred option.
Auckland Transport Low Emission Bus Roadmap 2018 | 31< Contents 7.0 Financing options 32 | Auckland Transport Low Emission Bus Roadmap 2018
Contents >

Multiple financing options have been considered for achieving the transition to low
emission vehicles.

Funding for the replacement of the end-of-        emission propulsion (under Option E at
life diesel fleet may be provided to a bus        the end of their useful 20-year life and
operator replacing old diesel fleet before 2024   before 2040) with agreed variation rates
(Option E with opportunity to specify BEV         for PVR and in-service km costs that
for City LINK from November 2020) through         would account for the anticipated future
contracted rates in service contracts. New        reductions over time of acquisition and
contract variation rates to be agreed for ZEVs.   operation of zero emission buses.

Future contracts could be funded through          The cost-benefit analysis will change
the current model of farebox revenue              as battery technology improves and
supplemented by AT and NZ Transport               market competitiveness increases,
Agency funding for operational expenditure        therefore regular review is necessary for
for bus service delivery. These contracts         accuracy of future cost modelling which
could incorporate an agreed schedule              will impact the necessary funding.
for fleet transition from diesel to zero

                                                      Auckland Transport Low Emission Bus Roadmap 2018 | 33
< Contents 8.0 Next steps 34 | Auckland Transport Low Emission Bus Roadmap 2018
Contents >

The following five steps have been indentified to progress our commitments.

1.   Adopt and progress the Low Emission              5.    Set up a national Low Emission Bus
     Bus Roadmap principles as a baseline                   Working Group to break down the
     transition with continuing 12-18 month                 barriers to adopting low-emission buses
     updates to base level scenario cost/                   in Auckland and New Zealand. Given the
     benefit and net present value (NPV).                   early stage and iterative nature of the
                                                            roadmap, AT is intending in late 2018 to
2.   A ‘quick win’ start on a larger-scale trial
                                                            establish and lead a Low Emission Bus
     of the City LINK electric bus service
                                                            Working Group. This group is open to
     from November 2020 when the current
                                                            local bus operators and a range of public
     bus contract for that route is renewed.
                                                            and private stakeholders in deploying
3.   Continue to undertake trials and                       Auckland’s Low Emission Bus Roadmap.
     demonstrations of ZEVs and their
                                                      This group is tasked with:
     associated infrastructure (subject to
     budget and availability). Seek funding           • Growing the low emission bus
     from EECA from their LEV contestable               market in Auckland (and NZ)
     fund. Proposed options include:                  • Facilitating the development of supply
                                                        chains and aftermarket support
     • Further electric bus trials from
       other manufacturers                            • Influencing national policy
     • Hydrogen electric trials                       • Disseminating outcomes of
       (incorporating hydrogen supply)                  demonstration trials and assessments.
     • ‘Opportunity’ charging bus trials
     • Trial re-power of diesel bus to
       electric using proven technology.                                Government and
                                                                         public bodies
4.   Collaborate with C40:
     • Work with the Mayor’s office
                                                        Environmental                     Fuel suppliers
       to develop the Fossil-Fuel-Free                  and academia
       Declaration programme and the
       financial implications of procuring
       electric buses from 2025 onwards.
                                                                                            Technology/
     • Undertake research into the impacts of
                                                           Bus operators                   infrastructure
       e-buses on the grid across Auckland;                                                   suppliers
       and the financial implications.
     • Use the C40 network to learn                                        Automotive
                                                                          manufacturers
       lessons and to benchmark with
       other cities about the adoption
       of low-emission buses.
                                                   Figure 12: Proposed membership of the Low Emission Bus
                                                   Working Group.

                                                           Auckland Transport Low Emission Bus Roadmap 2018 | 35
< Contents
Glossary
Acronym Description
BEV Battery Electric Vehicle (also known as E-Bus)
EECA Energy Efficiency and Conservation Authority
EV Electric Vehicle
GHG Greenhouse Gas
LEV Low-Emission Vehicle
LowCVP Low Carbon Vehicle Partnership
NZTA New Zealand Transport Agency
NOx Nitric oxide and nitrogen dioxide
PM Particulate matter
PTOM Public Transport Operating Model
PVR Peak Vehicle Requirement
RCD Residual Current Device
RUC Road User Charges
VDAM Vehicle Dimensions and Mass (NZ)
ZEV Zero-Emission Vehicle
36 | Auckland Transport Low Emission Bus Roadmap 2018Contents >
Appendices
Appendix 1: City LINK e-bus trial data
Background
Two electric buses arrived in late February 2018. The vehicles underwent all NZ compliance
testing and are registered with the NZ Transport Agency. The buses are operating on a weight
permit issued by NZTA, and AT have speed-limited them to 70km/h (in agreement with
NZTA). The vehicles have been leased to NZ Bus for a nominal fee of $1 for the six-month
trial period. The cost of operating the vehicles during the trial will be covered mostly by NZ
Bus, but AT will be continuing to insure the vehicles and will cover maintenance costs.
An agreement is in place with NZ Bus to operate the vehicles for an initial six-month
period on the City LINK service, being up to (19) circuits over an 18-hour period. This
route was chosen for air quality issues, public exposure, length of route, changes in
topography, and close proximity of the depot to the route and to AT head office.
The vehicles were delivered fully-charged to the NZ Bus depot on 9 April, at which time
final preparations were made to put the vehicles into service. This included:
• Acceptance of vehicles by drivers’ committee
• Driver training
• Maintenance staff training
• Installation of HOP, CCTV, and RT equipment
• AT Metro branding
• Installation of depot charger units.
Vehicle implementation
With regard to driver training and operations, there were no significant differences
introducing the vehicles into the NZ Bus fleet compared to a conventional diesel vehicle.
Drivers were however given additional training on regenerative braking.
NZ Bus are not undertaking any chassis related repairs or maintenance to these vehicles
as ADL are undertaking these requirements for the trial period and beyond.
ZEV buses as standard would likely require a slightly different commissioning process.
The installation of the charging interfaces has been somewhat problematic,
due to NZ requirements for ‘Type B’ RCDs to be installed.
Auckland Transport Low Emission Bus Roadmap 2018 | 37< Contents
Initially the RCDs tripped regularly, but software changes to the vehicle have reduced these
events dramatically. A filter has been fitted to the incoming power supply on one interface,
and to date this unit has had no ‘tripping’ events. Once proven, the remaining interface will
be fitted with same filter. While the Type B requirement is currently unique to NZ, it will likely
become a European standard in ~2019. The sensitivity of the device does provide a high
level of reassurance in regard to the electrical safety of the vehicles on a daily basis.
Data collection
The following figures are based on data collected between 18 June and 2 September 2018.
Power cost $0.17 per kWh
Road User Charge $0.278 per kilometre
Combined diesel and Add Blue cost $1.44 per litre
Fuel consumption of comparable diesel bus 0.35 litres per kilometre
The kWh/km rate currently being measured would translate to a range of circa 265km
using 90% of battery capacity. The measured saving per kilometre in energy and Road
User Charge is approximately $0.59/km, which is within 5% of the saving used in the
LEV Roadmap model. To date the availability of both vehicles has been 84%.
Statistic Bus 304 Bus 305
Total km 4,030 km 5,755 km
Total operational hours 547 hours 770 hours
Total passengers 18,794 pax 25,3267 pax
Total power consumption 4,321 kWh 6,810 kWh
Average kWh/km 1.07 kWh/km 1.18 kWh/km
Average kWh/h 7.89 kWh/hour 8.85 kWh/hour
Average kWh/pax 0.23 kWh/pax 0.27 kWh/pax
Overall operational saving $2,416.90 $3,342.54
38 | Auckland Transport Low Emission Bus Roadmap 2018You can also read