Investor Presentation - July 2021 - Planet Labs
←
→
Page content transcription
If your browser does not render page correctly, please read the page content below

Investor Presentation
    July 2021

    Image: South Passage, Australia – October 1, 2015
1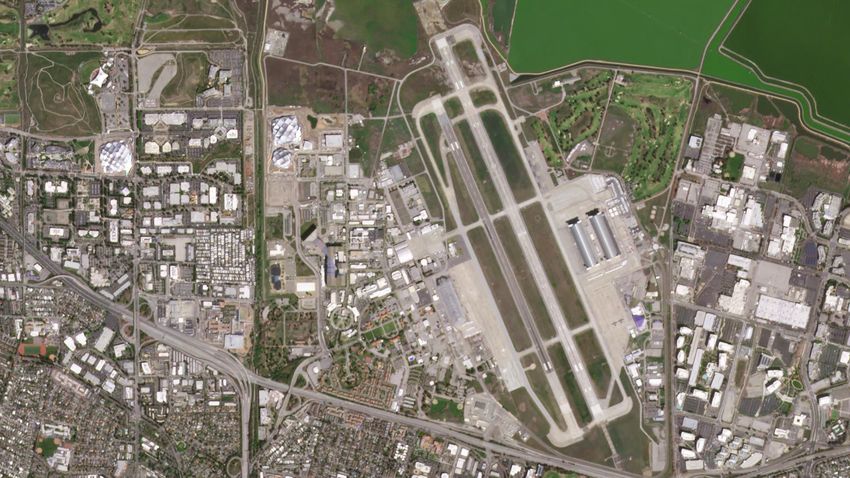
Disclaimers
    About this Presentation
    This investor presentation (this “Presentation”) relates to a proposed business combination (the “Business Combination”) between dMY Technology Group, Inc. IV (“dMY”) and Planet Labs, Inc. (the “Company”). The information contained herein does not purport to be all-inclusive and none
    of dMY, the Company or their respective affiliates or representatives makes any representation or warranty, express or implied, as to the accuracy, completeness or reliability of the information contained in this Presentation.
    This Presentation does not constitute (i) a solicitation of a proxy, consent or authorization with respect to any securities or in respect of the proposed Business Combination or (ii) an offer to sell, a solicitation of an offer to buy, or a recommendation to purchase any security of dMY, the
    Company, or any of their respective affiliates. No offering of securities shall be made except by means of a prospectus meeting the requirements of Section 10 of the Securities Act of 1933, as amended, or an exemption therefrom.
    Forward Looking Statements
    Certain statements in this Presentation may be considered “forward-looking statements” for purposes of the federal securities laws. Forward-looking statements generally relate to our current expectations, hopes, beliefs, intentions, strategies or projections about future events or dMY’s or the
    Company’s future financial or operating performance. For example, statements regarding anticipated growth in the industry in which the Company operates and anticipated growth in demand for the Company’s services, projections of the Company’s future financial results and other metrics
    and ownership of the combined company following the closing of the Business Combination are forward-looking statements. In some cases, you can identify forward-looking statements by terminology such as “pro forma,” “may,” “should,” “could,” “might,” “plan,” “possible,” “project,” “strive,”
    “budget,” “forecast,” “expect,” “intend,” “will,” “estimate,” “anticipate,” “believe,” “predict,” “potential” or “continue,” or the negatives of these terms or variations of them or similar terminology, but the absence of these words does not mean that a statement is not forward-looking. Such forward-
    looking statements are subject to risks, uncertainties, and other factors which could cause actual results to differ materially from those expressed or implied by such forward looking statements. You should not rely on these forward-looking statements as predictions of future events.
    These forward-looking statements are based upon estimates and assumptions that, while considered reasonable by dMY and its management, and the Company and its management, as the case may be, are inherently uncertain. Factors that may cause actual results to differ materially
    from current expectations include, but are not limited to: the occurrence of any event, change or other circumstances that could give rise to the termination of definitive agreements with respect to the Business Combination; the outcome of any legal proceedings that may be instituted against
    dMY, the Company, the combined company or others following the announcement of the Business Combination and any definitive agreements with respect thereto; the inability to complete the Business Combination due to the failure to obtain approval of the stockholders of dMY, to obtain
    financing to complete the Business Combination or to satisfy other conditions to closing; changes to the proposed structure of the Business Combination that may be required or appropriate as a result of applicable laws or regulations or as a condition to obtaining regulatory approval of the
    Business Combination; the ability to meet stock exchange listing standards following the consummation of the Business Combination; the risk that the Business Combination disrupts current plans and operations of the Company as a result of the announcement and consummation of the
    Business Combination; the ability to recognize the anticipated benefits of the Business Combination, which may be affected by, among other things, competition, the ability of the combined company to grow and manage growth profitably, maintain relationships with customers and suppliers
    and retain its management and key employees; costs related to the Business Combination; changes in applicable laws or regulations; the possibility that the Company or the combined company may be adversely affected by other economic, business, or competitive factors; the Company’s
    estimates of expenses and profitability; the evolution of the markets in which the Company competes; the ability of the Company to implement its strategic initiatives and continue to innovate its existing services; the ability of the Company to defend its intellectual property; the impact of the
    COVID-19 pandemic on the Company’s business; and other risks and uncertainties set forth in the section entitled “Risk Factors” and “Cautionary Note Regarding Forward-Looking Statements” in dMY’s final prospectus dated March 4, 2021 relating to its initial public offering and those risk
    factors relating to the Company’s business identified in the appendix to this Presentation.
    dMY and the Company caution that the foregoing list of factors is not exclusive. Nothing in this Presentation should be regarded as a representation by any person that the forward-looking statements set forth herein will be achieved or that any of the contemplated results of such forward-
    looking statements will be achieved. You should not place undue reliance on forward-looking statements, which speak only as of the date they are made. Neither dMY nor the Company undertakes any duty to update these forward-looking statements.
    Financial Information; Non-GAAP Financial Measures
    The financial information and data contained in this Presentation is unaudited and does not conform to Regulation S-X. Such information and data may not be included in, may be adjusted in or may be presented differently in the registration statement to be filed by dMY relating to the
    Business Combination and the proxy statement/prospectus contained therein.
    This Presentation also includes certain financial measures not presented in accordance with generally accepted accounting principles (“GAAP”) including non-GAAP Gross Profit, non-GAAP Gross Margin, Adjusted free cash flow, Adjusted free cash flow margin, Adjusted EBITDA and
    certain ratios and other metrics derived therefrom. The Company defines non-GAAP gross profit as gross profit plus stock-based compensation classified as cost of goods, and non-GAAP gross margin as the percentage of non-GAAP gross profit relative to net revenue during a given
    period. The Company defines Adjusted free cash flow as Adjusted EBITDA less capital expenditures, and Adjusted free cash flow margin as the percentage of Adjusted free cash flow relative to net revenue during a given period. The Company defines Adjusted EBITDA as net income (loss)
    before interest, taxes, depreciation and amortization and stock-based compensation expense. These non-GAAP financial measures are not measures of financial performance in accordance with GAAP and may exclude items that are significant in understanding and assessing the
    Company’s financial results. Therefore, these measures should not be considered in isolation or as an alternative to net income, cash flows from operations or other measures of profitability, liquidity or performance under GAAP. You should be aware that the Company’s presentation of
    these measures may not be comparable to similarly-titled measures used by other companies. dMY and the Company believe these non-GAAP measures of financial results provide useful information to management and investors regarding certain financial and business trends relating to
    the Company’s financial condition and results of operations. dMY and the Company believe that the use of these non-GAAP financial measures provides an additional tool for investors to use in evaluating ongoing operating results and trends in and in comparing the Company’s financial
    measures with other similar companies, many of which present similar non-GAAP financial measures to investors. These non-GAAP financial measures are subject to inherent limitations as they reflect the exercise of judgments by management about which expense and income are
    excluded or included in determining these non-GAAP financial measures.
    This Presentation also includes certain projections of non-GAAP financial measures. Due to the high variability and difficulty in making accurate forecasts and projections of some of the information excluded from these projected measures, together with some of the excluded information not
    being ascertainable or accessible, dMY and the Company are unable to quantify certain amounts that would be required to be included in the most directly comparable GAAP financial measures without unreasonable effort. Consequently, no disclosure of estimated comparable GAAP
    measures is included and no reconciliation of the forward-looking non-GAAP financial measures is included.
    Use of Projections
    This Presentation contains financial forecasts for the Company with respect to certain financial results for the Company. Neither dMY’s nor Company's independent auditors have audited, studied, reviewed, compiled or performed any procedures with respect to the projections for the
    purpose of their inclusion in this Presentation, and accordingly, they did not express an opinion or provide any other form of assurance with respect thereto for the purpose of this Presentation. These projections are forward-looking statements and should not be relied upon as being
    necessarily indicative of future results. In this Presentation, certain of the above-mentioned projected information has been provided for purposes of providing comparisons with historical data. The assumptions and estimates underlying the prospective financial information are inherently
    uncertain and are subject to a wide variety of significant business, economic and competitive risks and uncertainties that could cause actual results to differ materially from those contained in the prospective financial information. Accordingly, there can be no assurance that the prospective
    results are indicative of the future performance of the Company or that actual results will not differ materially from those presented in the prospective financial information. Inclusion of the prospective financial information in this Presentation should not be regarded as a representation by any
    person that the results contained in the prospective financial information will be achieved.
    Industry and Market Data
    In this Presentation, dMY and the Company rely on and refer to certain information and statistics obtained from third-party sources which they believe to be reliable. Neither dMY nor the Company has independently verified the accuracy or completeness of any such third-party information.
    Some data is also based on the good faith estimates of the Company and dMY which are derived from their respective reviews of internal sources as well as the independent sources described above. This Presentation contains preliminary information only, is subject to change at any time
    and, is not, and should not be assumed to be, complete or to constitute all the information necessary to adequately make an informed decision regarding your engagement with Company and dMY.
    Trademarks
    This Presentation may contain trademarks, service marks, trade names and copyrights of other companies, which are the property of their respective owners. Solely for convenience, some of the trademarks, service marks, trade names and copyrights referred to in this Presentation may be
    listed without the TM, SM © or ® symbols, but dMY and the Company will assert, to the fullest extent under applicable law, the rights of the applicable owners, if any, to these trademarks, service marks, trade names and copyrights.

2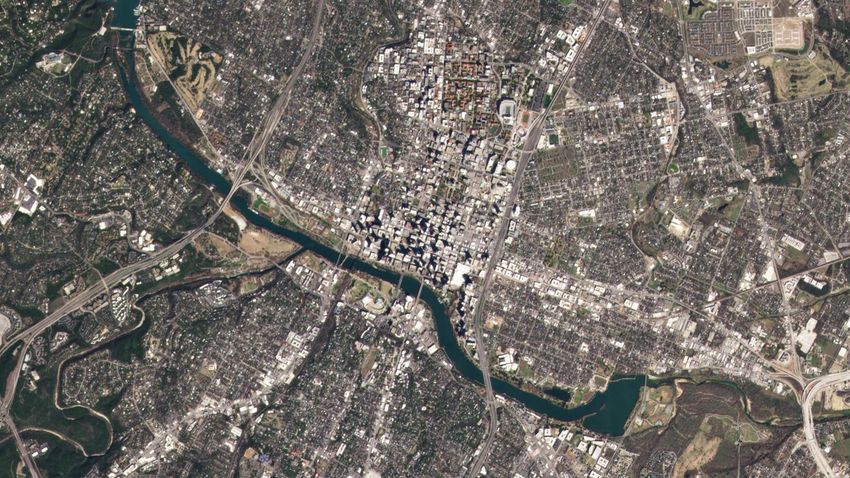
Highly Differentiated dMY Technology Franchise
7 transactions in 13 months, deploying $2B in total capital1
Former EVP, Office of Chairman of EMC Mobile pioneer – Software & Hardware
Former President, CFO and Co-Founder Former CEO of Glu Mobile, Monstermob
of GTY and Hands-On Mobile
Former CEO of Bearing Point and CFO of Chairman of Glu Mobile; Board of IonQ,
Harry You Oracle and Accenture Niccolo De Masi Jagex, GENI & RSI
Co-Chairman CEO
2
▪ $230m in trust ▪ $276m in trust ▪ $300m in trust ▪ $345m in trust
▪ $160m PIPE ▪ $330m PIPE ▪ $350m PIPE ▪ $200m PIPE
▪ Consumer internet ▪ Sports data ▪ Quantum computing ▪ Whole earth data
1Includes 4 SPAC IPOs and 3 PIPE announcements.
3 2Definitive merger announced but not yet closed.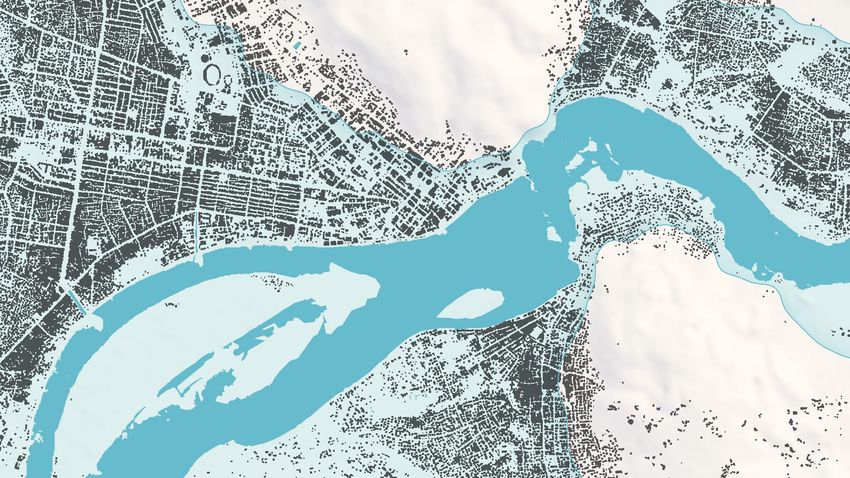
World Class Team

                                                   William Marshall
                                                   Chief Executive Officer, Co-
                                                   Founder

           Robbie Schingler                     Kevin Weil                        Ashley Fieglein Johnson
           Chief Strategy Officer, Co-Founder   President,                        Chief Financial and
                                                Product and Business              Operating Officer

           James Mason                          Rosanne Saccone                   Kristi Erickson
           Senior Vice President of             Chief Marketing Officer           Chief People Officer
           Space Systems

           Brian Hernacki                       Charlie Candy                     Laura Malinasky
           Senior Vice President of Software    Chief Revenue Officer             Chief Legal and
                                                                                  Compliance Officer

4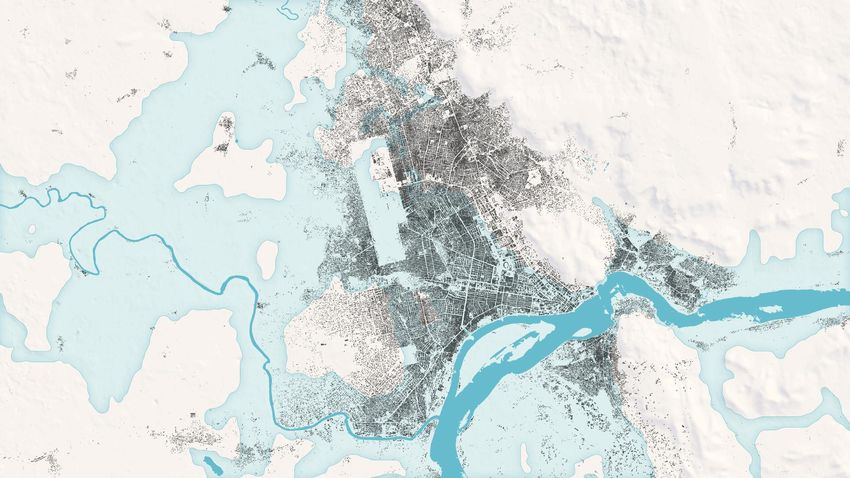
Planet indexes the Earth and makes it searchable,
           the way Google indexes the internet.

               What will you discover? |

5
Key Investment Highlights

                                The leading provider of daily, global Earth data —
                            1   mission critical to the worldwide ESG transition

                                      Proven innovator in space, data and ML analytics; first
                                  2   mover advantage – significant barriers to entry

                                             Established subscription business with multiple levers
                                        3    to capture a massive market opportunity

                                  4 Attractive financial profile with strong operating leverage

                                Experienced management team with a track-record of
                            5 building market making businesses

6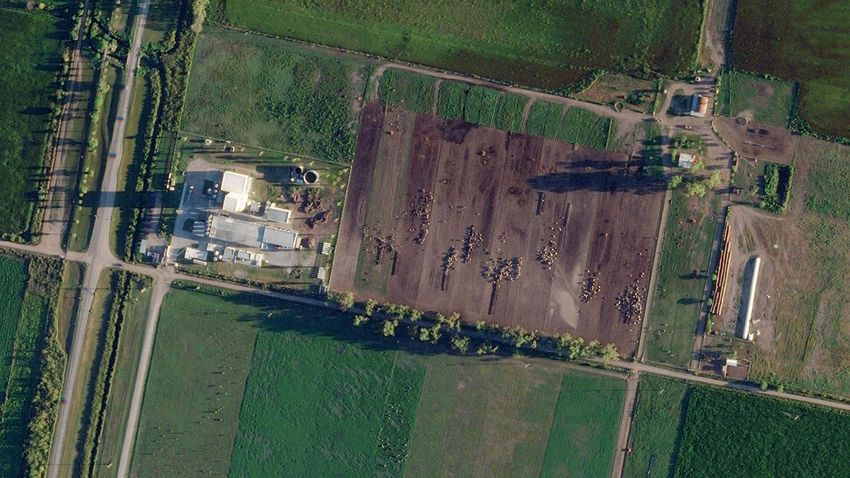
Planet is a One-to-Many Data Platform

     Daily, Global Scanning                                                          Most Frequent Cadence                                                                 Largest Fleet                                         One-to-Many Model
                 → Revolutionary                                                         → Up to 10                    revisits/day1                                  → 10x competition                                           → Uniquely Scalable

                                                      Global Scale                                                                                                                                   Business Metrics

                 200+                                            ~2x                                         25TB                                                $110M+                                           90%+                                            62%
                                                                                                                                                               FY2021A Revenue                                     Recurring3                           FY2021A PlanetScope
            Satellites in Orbit                        Earth Land Area / Day                           Data Captured Daily
                                                                                                                                                                                                                                                           Gross Margins4

                                        100%                                          50M+                                                                                                   73%                                          600+
                                                                                                                                                                                           of ACV is                                Customers Across
                               of Data is ML-analyzed2                                 Detections
                                                                                                                                                                                       Multi-Year Deals5                            Multiple Verticals6

    Note: FYE January 31st
    1 Revisits/day is defined as number of times Company satellites image a particular area of interest on a given day.
    2 ML-analyzed describes Planet’s machine learning capabilities.
    3 Recurring contracts are defined as those that are either subscription-based or have a minimum commitment of usage.
    4 PlanetScope represents 73% of FY2021A revenue. Gross Profit used to calculate gross margin reflects non-GAAP Gross Profit relative to net revenue. Non-GAAP Gross Profit includes Depreciation & Amortization costs and adds back stock-based compensation classified as cost of goods.
7   5 Represents percentage of Company Annual Contract Value contracted with a term that exceeds 1 year.
    6 A customer is defined as a distinct entity which has a commercial relationship with Company, i.e. subscription agreements or one-off purchases of data. As of end of period January 2021.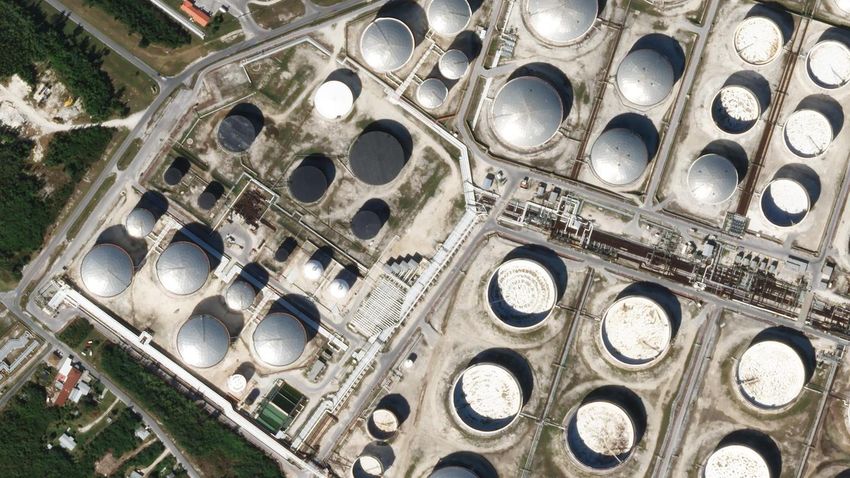
✔Cloud APIs & integrations
                                         ✔AI & ML-ready                                 MOAT 3
    Proven Innovator with                ✔Data archive for ML training
    Multiple Compounding Moats
                                                                         Platform and
                                                                           Analytics

                          MOAT 2

                                   Proprietary
                                    Big Data

                                                                                           ✔Feedback from
                           ✔Faster iteration                                                Customer use
                           ✔More satellites                                                ✔Data-enabled
                           ✔Easily add sensors                              Agile Space     apps
                                                                             Missions
    Virtuous Cycle Drives                                                               MOAT 1
    Competitive Differentiation
8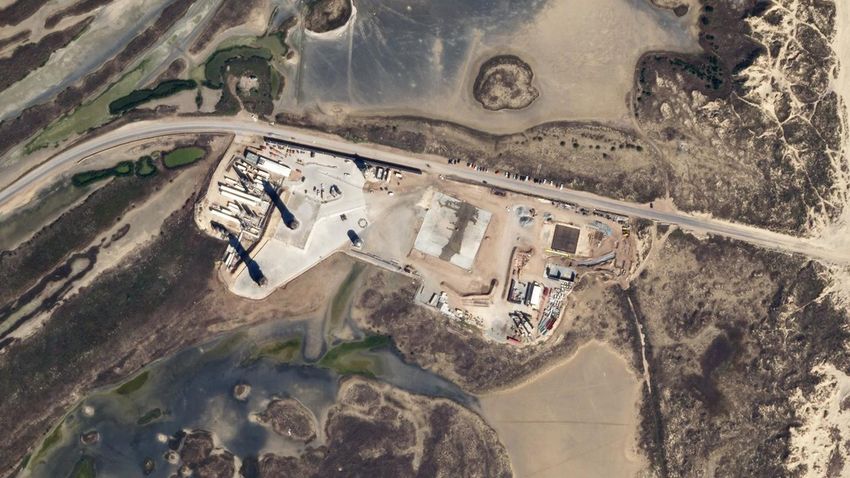
Planet is Years Ahead of the Competition
      A Scaled Next Generation Commercial Geospatial Company

                                                                                                                                                                                                                                                            Application Ecosystem

                                                                                                                                                                                                                             Business
                                                                                                                                                                                                                                                                   & Beyond
                                                                                                                                                                              ML-Ready,
                                                                                                                                                                           Harmonized Data
                                                                                                                                                                                                                                Planet Today
           Other New Space EO Providers Today
                                                                                                                                       Operational
                                                                                                                                      Constellation
                                                                                                                                                                                             2019-2020
                                                                                             Operational
                                                                                              Satellite
                                                                                                                                                    2016-2018

                                                Satellite Image                                                                          ← Iterate to Improve
                                                                                                           2014-2015                     Capabilities for Mass
                                                                                                                                         Manufacturing & Fleet
    Prototype Satellite                                                                                                                     Operations →
                                                                                                 ← Iterate to Improve
                                                                  2012-2013                       Capabilities to be
                                                                                                   Operational →                                                                    462 satellites launched to date
                                                         ← Iterate Satellite                                                                                                           30+ petabytes of Earth data
                         2010-2011                           Design →
                                                                                                                                                                                     100% of data is ML-analyzed1
                  First Spacecraft
                                                                                                                                                                              Massive archive for ML training
                  Design & Test →
9   Note: This is an illustrative example of development of EO providers based on market research and Company knowledge and experience. Includes comparison against multiple North American satellite providers and several other international entrants.
    1ML-analyzed describes Planet’s machine learning capabilities.
Planet is ‘the Bloomberg Terminal’ for Earth Data

10
Planet’s Data is Mission Critical

A field of crops                                                                A plane departs from a                         A paper company can monitor
shows early signs of infestation…                                               location of interest…                          their supply chain...

                                                                                                                                and track deforestation, a cause of up to
                         and a farmer                                              and a government maintains situational        20% of annual Greenhouse
           saves this season’s crop yield.                                                   awareness and reduces conflict.
                                                                                                                                           Gas emissions1.

Without daily data                                                                Without daily data                           Without daily data
Agriculture companies lose                                                        Governments lack situational                 Companies lack information
revenue and competitive                                                           awareness – risking national                 to report important ESG
advantage                                                                                                                      metrics – excluding them
                                                                                  security and citizen safety.
                                                                                                                               from key investor portfolios.

11   1 Source:   Measuring Carbon Emissions from Tropical Deforestation, EDF.                                                                                       11
Established Subscription Business Across Many Large Verticals
Representing Annual Revenue of $110M+, Across 600+ Customers1
Defense &
Agriculture Intelligence Civil Mapping / Internet Forestry Energy Finance Insurance
• Variable Rate Seeding • Security & Safety • Permitting & Code • Topography • Depletion • Monitoring • Imagery and Signals
• ESG Metrics
/ Fertilizer • Vessel Monitoring Enforcement • Road Detection Measurements • Spill & Disaster • Asset Monitoring
• Trading Strategies
• Crop Yield • Natural Resource • Environmental • GIS • Supply Chain Management • Risk Assessment
• Investment Research
• Directed Scouting Protection • Disaster Management Sustainability
• Harvest Planning • Emergency Response
Google Multiple Hedge Funds
U.S. National
Reconnaissance Office2
Multiple Multinational
Investment Banks Multiple Agriculture Crop
Multiple Strategic Ministries of Insurance Firms
Defense in Europe,
the Middle East, and Africa
Multiple Investment Multiple Insuretech
Research Companies
Multiple Strategic Ministries
Firms
of Defense in Asia Pacific
Large Automobile
Large Financial Insurance Company
Multiple Strategic Security & Data Provider
Intelligence Agencies in
Latin and South America
ESG & Sustainability Relevant to All Vertical Markets
12 1 As of FY2021A. FYE January 31st.
2 Press advisory by National Reconnaissance Office regarding Planet contract. nro.govPlanet is at the Center of Two Multi-Trillion Dollar Global Economic Shifts
$100 T $53 T
Cumulative value Global ESG assets
created by 20251 by 20252
DIGITAL SUSTAINABILITY
TRANSFORMATION TRANSFORMATION
Big Data & AI are unleashing a significant opportunity Planet can help countries measure their regulations,
across industry; from Agriculture to Transportation to banks measure their green bonds, companies
Forestry to Government, Planet delivers the data measure their ESG goals – valuing natural systems in
needed to create digital efficiencies and reduce cost. the economy.
1 World Economic Forum – Digital Transformation Initiative. Estimate of value that digitalization could create over the next decade.
13 2 Bloomberg – ESG Assets May Hit $53 Trillion by 2025.Planet Has a Massive Market Opportunity
Civil Government / Defense & Intelligence
Public Authorities $16B
$29B
+$75bn Agriculture
Digital $11B
Industrial/ Supply Chain
Smart Cities & Urban Planning
Transformation3
Security & Safety
$24B (2027E)
Precision Agriculture
Forestry
Supply Chain Sustainability
Air/Water Pollution Monitoring
+$35bn $8B
Weather
Sustainability Monitoring
Transformation2
(2027E) Crop
Monitoring
Sustainable Disease & Pest Monitoring
Finance &
Carbon Footprint
Insurance Management
$18B Energy & Utilities
+$19bn Forest Management
$22B
Asset Monitoring Satellite Data
Services1 Pipeline Monitoring
(2027E)
Carbon Footprint
Risk Management Management
1Satellite Data Services Market, Allied Market Research (Dec-2020). 2 Geospatial Analytics Market, Allied Market Research (Nov-2020). 3 Green Technology and Sustainability Market, Allied Market Research (Dec-2020).
14 Vertical market sizes extrapolated by Company estimates based on reports listed above.
Note: Figures reflect global market size.Simplifying Earth Data with ML to Deliver High Value in One Platform...
Crop Infestation Permitting Building Damage Wildfire Risk Illegal Logging Construction
Vessel Detection
Detection Enforcement Detection Mitigation Road Detection Monitoring
Land Cover Analytics Object Summary Change
Applications Solutions
Classification Models/Workflows Detection Statistics Detection
▪ Automated data processing ▪ Data fusion with 3rd party data sets
▪ Computer vision for color-correction ▪ Multi-modal data enhancement
▪ Harmonized time series ▪ On-demand in the cloud and via API
15Multiple Levers for Growth
Scaling in Expansion into Establish New Sensors
Existing Verticals New Platform & Data Sets
Through investment in Verticals Ecosystem
sales, marketing and Through software Create a robust apps Meet market demand
software solutions solutions that move ecosystem with new proprietary
up the stack data
Additional Advanced Predictive Enable Long-Tail Fusion of Novel Strategic
Growth Vectors Analytics and Adoption Data Sets Acquisitions
Modeling With simple consumer- To combine new products To accelerate
Not Factored Into To deliver customer value like tools for any user and capabilities with all the above
Our Model by forecasting future and apps ecosystem synergistic impact
outcomes
16Compelling Subscription KPIs
90%+
Recurring1
Predictable Subscription and
Usage-Based Model
70%+
Multi-Year Deals2
Long Term Multi-Year Contracts
110%+
Track Record of Upsell Expansion Net Dollar Retention Rate
Diverse Customer Base Across
Multiple Verticals
600+
Customers Across Multiple Markets
Note: FYE January 31st
Business metrics as of FY2021.
17 1 Recurring contracts are defined as those that are either subscription-based or have a minimum commitment of usage.
2 Defined as contracts with term lengths longer than 1 year.Strong Growth Over the Last 5 Years…
Consolidated Revenue ACV Breakdown1
($ in millions)
Fiscal Year Ended January 31st By Revenue Type
$ 113
Recurring
$ 96 Other
92%
$ 73
$ 66
By Deal Length
$ 43
> 1 Year
73% ≤ 1 Year
CY2016A CY2017A CY2018A FY2020A FY2021A
Note: Fiscal year changed from December 31st to January 31st in 2019.
18 1Annual Contract Value (ACV) is the total amount of value that a customer has agreed to pay for in a 12 month period as of the measurement date. For short-term contracts (Highly Diversified and Differentiated Revenue Base
Revenue by Vertical
Today Tomorrow
(FY2021A) (FY2026E)
Revenue $113mm Revenue $693mm
1Strong Pipeline for Near-Term Growth
Potential Upside1
Further upside
potential driven
by strategics and
higher close rates
$ 250 on sales pipeline
$ 206 A Based on 112% net
$ 200 $ 191 retention rate, which
excludes significant upside
Revenue ($ in millions)
C opportunity for expansion
$ 150
within existing customers
$ 130
B
B Based on ~20% close rate
A
on pipeline of business
$ 100
Q2’22E ACV of Upside to model based on
$130mm C
demonstrates strong momentum from
$ 50 high visibility to
FY2022E revenue strategic discussions
$0
FY2022E Net Federal International Agriculture / Other FY2023E Strategic FY2023E +
Retention & Civil Government Fusion Commercial Partners Strategic
Partner Upside
20 Note: FYE January 31st
1 References existing Planet pipeline for period shownMultiple Levers to Accelerate Revenue
$ 300 $ 289
$ 250
B
A Grow Customer Success
$ 200 headcount by ~2x to drive
Revenue ($ in millions)
65% of FY2022E customer retention and
revenue from upsell
committed contracts
$ 150
$ 130
B Grow Software Engineering
Increase Sales Account Executives
A by ~2.5x headcount by ~2x and
$ 100
Increase Marketing spend by ~2x
develop wide distribution of
new products such as Data
Fusion
$ 50
$0
FY2022E Expand within Land Customers in Capture New Verticals + FY2024E
Existing Customers Core Verticals Move Up Data Stack
Note: FYE January 31st
21 “Land Customers in Core Verticals” represents gaining new customers in core verticals of agriculture, government and mapping. “Capture New Verticals + Move up Software Stack” represents gaining new customers in less mature verticals such as Energy & Infrastructure, E&R
+Impact, Commercial Forestry, Finance & Insurance, and ISV, BI & Analytics (“Independent Software Vendor, Business Intelligence and Analytics”).…And a Path to Significant Scale with Compelling Unit Economics
Consolidated Revenue
($ in millions)
$693
$449
A $289
$191 A
$113 $130 65% of FY2022E revenue
from committed contracts
FY2021A FY2022E FY2023E FY2024E FY2025E FY2026E
B PlanetScope (~73% of
Gross Profit1 FY2021A Revenue) had
gross margins of
($ in millions) 74%
~62% in FY2021A
$515 (including Depreciation &
70%
Amortization)
B 62%
50% $314
40%
24% $180
$95
$27 $52
FY2021A FY2022E FY2023E FY2024E FY2025E FY2026E
22 Note: FYE January 31st.
1 Gross Profit used to calculate gross margin reflects non-GAAP Gross Profit relative to net revenue. Non-GAAP Gross Profit includes Depreciation & Amortization costs and adds back stock-based compensation classified as cost of goods.Clear Path to Profitability and Robust Cash Flow Generation
Adjusted EBITDA1
Unaudited, ($ in millions)
A 27%
$ 187
15%
$ 67
(9%) (28%) (20%) (3%)
A Transaction proceeds fund
growth investments
$(11) $(10)
$(36) $(39) through Adjusted EBITDA
FY2021A FY2022E FY2023E FY2024E FY2025E FY2026E breakeven
Adjusted Free Cash Flow2 B Significant FCF generation
B
driven by one-to-many
Unaudited, ($ in millions)
20% business model and
revenue scale relative to
$ 140 maintenance capex for
5%
constellation
(36%) (42%) (30%) (15%) $ 24
$(41) $(55) $(58) $(43)
FY2021A FY2022E FY2023E FY2024E FY2025E FY2026E
Note: FYE January 31st.
23 1 Adjusted EBITDA is a non-GAAP metric defined as gross profit less operating expenses, add back stock-based compensation and depreciation & amortization, and EBITDA margin as the percentage of EBITDA relative to net revenue during a given period.
2 Adjusted Free Cash Flow defined as Adjusted EBITDA less capital expenditures, and Adjusted free cash flow margin as the percentage of Adjusted free cash flow relative to net revenue during a given period.A Business Model with Strong Operating Leverage
Description Commentary Long-Term Target1
▪ Cloud Hosting Costs ▪ Low incremental cost to serve a data 15-20%
▪ Mission Operations Teams subscription model
COGS ▪ Technical Support ▪ Self-serve model drives high gross
▪ Professional Services margins
▪ Spacecraft & Engineering Operations ▪ R&D investments in tools for enhanced 16-19%
▪ Software Development & Data Science data insights and analytics
R&D ▪ Space investments in new ESG data
sets and ML-readiness
▪ Sales (Direct & Channel) ▪ Scalable model through platform 24-27%
▪ Marketing ecosystem
S&M ▪ Customer Success ▪ Multi-year subscription model drives
high Customer Lifetime Value
▪ Corporate Functions (Finance, HR, ▪ Scales with absorption of public 6-9%
Legal, Regulatory) company costs
G&A ▪ Overhead allocated across departments
▪ Space Capex includes Bill of Materials, ▪ Agile approach drives manufacturing 5-8%
manufacturing, and launch ground efficiency and reduced Bill of Materials
Capex ▪
stations (non-leased)
Leasehold improvements ▪
costs
Satellite payback periodValuation Overview
Image: Shallow Seas, Bahamas – February 4, 2016
25Proposed Transaction Summary Pro Forma Valuation
($ in millions, except per share amounts)
Share Price $ 10.00
Key Transaction Terms Pro Forma Shares Outstanding 276
▪ Pro forma enterprise value of $2,250mm Equity Value $ 2,758
▪ Existing Planet shareholders will retain 77% ownership in the pro forma company Pro Forma Net Debt / (Cash) (508)1
▪ Net proceeds of $434mm (after transaction expenses and paydown of existing Enterprise Value $ 2,250
debt) will go to the balance sheet3
Sources
Illustrative Pro Forma Ownership7 dMY IV Shares to Planet Existing Shareholders $ 2,1352
dMY IV Cash Held in Trust 345
dMY Shareholders PIPE Investors PIPE Investment 200
34.5mm, 12.5% 20.0mm, 7.3% Total Sources $ 2,680
Uses
dMY Sponsor8 Cash to Balance Sheet $ 4343
7.8mm, 2.8%
Existing Planet Paydown of Existing Debt 714
Shareholders9 Equity to Planet Existing Investors 2,1355
213.5mm, 77.4% Estimated Transaction Expenses 406
Total Uses $ 2,680
1 Pro Forma Net Debt / (Cash) includes pre-transaction cash of $74mm and cash proceeds of $434mm from the transaction.
2 Represents 213.5mm pro forma shares owned by Planet existing shareholders valued at $10.00 / share. Excludes unvested equity awards.
3 $20 million of potential Planet transaction expenses expected to be paid out from the cash to balance sheet. Such transaction expenses could be higher than anticipated.
4 Includes $65mm of debt and $6mm of repayment fees. Debt repayment excludes convertible debt, which is treated as equity. At the proposed transaction value, all convertible notes are anticipated to convert to common stock of Planet immediately prior to the closing of the DeSPAC at a 20%
discount to the consideration per share received by existing Planet equity, and are included in Existing Planet Shareholders share count.
5 Determined using treasury stock method. Will not be subject to any adjustments to purchase price based on cash, debt and debt-like items or working capital.
6 Excludes $20mm of potential Planet transaction expenses expected to be paid out upon closing of the merger. Such transaction expenses could be higher than anticipated..
7 Assumes no redemptions from dMY IV’s existing public shareholders. Assumes PIPE shares are issued at a price of $10.00. Excludes unvested equity awards, the impact of dMY IV’s warrants (public or private) and 10% LTIP and 2.5% ESPP to be created as part of deSPAC.
8 Based on 7.8mm founder shares at $10.00. Excludes 0.22mm founder shares subject to earnout based on achievement of $15.00 price per share, 0.22mm founder shares subject to earnout based on achievement of $17.00 price per share, 0.22mm
founder shares subject to earnout based on achievement of $19.00 price per share, and 0.22mm founder shares subject to earnout based on achievement of $21.00 price per share any time prior to or as of the 5th anniversary of the closing of the transactions. Excludes 5.93mm Private Placement
Warrants held by dMY Sponsor IV, 2.97mm of which will be subject to the same earnout as described above. The remaining Private Placement Warrants have a strike price of $11.50. A small group of investors, including one of dMY Technology Group's independent directors, contributed to dMY’s
sponsor approximately 55% of the risk capital for an interest in the sponsor corresponding to approximately 30% of the sponsor’s founder shares.
9 Excludes 27mm of earnout shares subject to the same earnout conditions as described above for the sponsor founder shares.
Note: Will Marshall and Robbie Schingler will be issued “high vote” shares with 20:1 voting power. The high vote shares will sunset into single vote common stock upon the earlier of the (i) tenth anniversary of the closing of the merger and (ii) six month anniversary of such founder no longer
providing services as a director, executive officer, member of the senior leadership team or other full-time employee with an on-going substantial role at Planet; provided that the shares will automatically convert into single vote shares if the founder is terminated for cause. Shares owned by Planet
Founders and Directors & Officers of dMY will proportionally be subject to an 18-month lock-up with potential for early release after 12 months if certain conditions are met; shares owned by 5% shareholders of Planet (other than Founders), go-forward Directors & Officers of Planet and other
26 investors in dMY Sponsor subject to a 12-month lock-up with potential for early release after 6 months if certain conditions are met. The 10% plus holders of Planet's voting stock prior to the merger include Google LLC, affiliates of Draper Fisher Jurvetson, William Marshall and Robert Schingler.
Planet also has engaged Marc Benioff as a strategic advisor. For his services, he received an option to purchase 1.2mm shares of Planet's Class A common stock at $14.94 per share, which he exercised early in full. Mr. Benioff can only be terminated with cause for the first 30 months. In
addition, he will purchase PIPE shares.Identifying the Competitive Universe
Planet is Unique and Category-Creating
Data Analytics & Infrastructure Peers
▪ Similar long-term growth and margin profile
▪ Predictable, recurring business models
▪ Operating in large, underserved markets
▪ Competitive moats associated with platform and
technology capabilities
27Operational Benchmarking
CY2021E – CY2024E Revenue CAGR
Median: 32%
51%
39% 37% 34% 32% 29%
24% 24%
CY2023E Gross Margin
Median: 77%
88%
80% 78% 77% 75% 73%
1
62% 57%
Data Analytics & Infrastructure
Source: Company filings, Wall Street Research, Management Estimates, IBES estimates; market data as of 22-Jun-2021
28 Note: Peer estimates calendarized to December year end, Planet projections reflect FY metrics (FYE January 31st).
1 Gross Profit used to calculate gross margin reflects non-GAAP Gross Profit relative to net revenue. Non-GAAP Gross Profit includes Depreciation & Amortization costs and adds back stock-based compensation classified as cost of goods.Valuation Benchmarking
EV / CY2022E Revenue
Median: 27x
42x
31x 29x 27x 26x 25x
20x
12x
Growth Adjusted EV / CY2022E Revenue1
Median: 0.95x
1.35x
1.10x
0.96x 0.95x 0.88x 0.82x
0.64x
0.24x
Data Analytics & Infrastructure
Source: Company filings, Wall Street Research, Management Estimates, IBES estimates; market data as of 22-Jun-2021
29 Note: Peer estimates calendarized to December year end, Planet projections reflect FY metrics (FYE January 31st). Planet multiples based on pro forma Enterprise Value of $2,250mm.
1 Calculated as EV / Revenue multiple divided by (CY2021E-CY2023E Revenue CAGR * 100).Valuation Benchmarking
EV / CY2023E Revenue
Median: 22x
33x
24x 22x 22x 21x 19x
15x
8x
Growth Adjusted EV / CY2023E Revenue1
Median: 0.65x
1.09x
0.94x
0.82x
0.65x 0.65x 0.55x
0.43x
0.15x
Data Analytics & Infrastructure
Source: Company filings, Wall Street Research, Management Estimates, IBES estimates; market data as of 22-Jun-2021
30 Note: Peer estimates calendarized to December year end, Planet projections reflect FY metrics (FYE January 31st). Planet multiples based on pro forma Enterprise Value of $2,250mm.
1 Calculated as EV / Revenue multiple divided by (CY2022E-CY2024E Revenue CAGR * 100).Appendix
Image: Lake Tuborg, Canada – May 30, 2015
31Driving Results for Customers
Case Study – Agriculture
Goal: Help farmers optimize input and build a stronger business
CHALLENGE ACTION RESULTS
Obtain granular visibility Detect problems, prescribe Farmers spent less time in
of the field to make the actions and track progress the field scouting, saw less
right decisions in a timely with PlanetScope crop damage and
manner Monitoring reduced input costs
32Driving Results for Customers
New Mexico State Case Study – State Government
Land Office Goal: Help with Permit Enforcement, Compliance & Land Reclamation
CHALLENGE ACTION RESULTS
Enforce regulations cross 9 Track leased and to-be- Discovered 53 trespasses
million acres of surface leased land with PlanetScope and generated >30% ROI
land Monitoring & Analytics
33Driving Results for Customers
Case Study – Government
Goal: Protect global forest ecosystems
CHALLENGE ACTION RESULTS
Identify and track Provide Monthly Basemaps 4k+ users in 120
deforestation across the imaging of tropics spanning countries leveraging
world’s tropical forests across insights to reduce
70+ countries deforestation
34EVER GIVEN • Suez Canal, Egypt • March 28, 2021 • SkySat 0.5m 35
SPACEX STARSHIP SN9 & SN10 • Boca Chica, Texas • February 2, 2021 • SkySat 0.5m
36
LACTEAR DAIRY • Córdoba, Argentina • March 10, 2021 • SkySat 0.5m
37
TANK FARM • Freeport, Bahamas • February 3, 2021 • SkySat 0.5m
38
FAGRADALSFJALL VOLCANO • RGB • Iceland • March 26, 2021 • SkySat 0.5m
39
FAGRADALSFJALL VOLCANO • NRG • Iceland • March 26, 2021 • SkySat 0.5m
40
NEOM • Tabuk Saudi Arabia • October 25, 2019 • PlanetScope 3M
41
NEOM • Tabuk, Saudi Arabia • March 8, 2021 • PlanetScope 3M
42
CHIRIBIQUETE NATIONAL PARK • Colombia • January 16, 2021 • PlanetScope 3M
43
SNOW • Austin, Texas • February 7, 2021 • PlanetScope 3M
44
MOFFETT FIELD • Mountain View, CA • March 27, 2021 • PlanetScope 3M
45
BUILDINGS & FLOOD RISK• Bangui, Central African Republic • 2019
46
BUILDINGS & FLOOD RISK• Bangui, Central African Republic • 2019
47
ROAD & BUILDING DETECTIONS• Cairo, Egypt • February 2021
48
49
Reconciliation of Non-GAAP Financials
     ($ in millions)

                                        Non-GAAP Gross Profit                          Adjusted EBITDA and Adjusted Free Cash Flow
                                                                             FY2021A                                         FY2021A
            Gross Profit                                                        $ 26    Net Income (Loss)                     $ (127)

                  (+) Stock-Based Compensation1                                    1     (+) Taxes                                 1

            Non-GAAP Gross Profit                                               $ 27     (+) Net Interest and Other Income        39

                                                                                         (+) Depreciation & Amortization          62

                                                                                         (+) Stock-Based Compensation             14

                                                                                        Adjusted EBITDA                        $ (11)

                                                                                         (-) Capex                               (30)

                                                                                        Adjusted Free Cash Flow                $ (41)

50   Note: FYE January 31st.
     1 Reflects   stock-based compensation classified under cost of goods.
Risk Factors Summary
All references below to “we,” “us” or “our” refer to the business of Planet Labs Inc. (the “Company”). The risks described below summarize certain of the risks related to the Company’s business but are not intended to reflect all risks the Company faces or relating to an investment in the Company. A more extensive
discussion of these risks will be disclosed in future documents filed or furnished by the Company and/or dMY Technology Group, Inc. IV (“dMY Technology Group”) with the United States Securities and Exchange Commission (“SEC”) following execution of definitive agreements in connection with the proposed
transactions between the Company and dMY Technology Group.
Risks Related to our Business and Industry ▪ Limited insurance coverage and availability may prevent us from obtaining insurance to cover all risks of loss.
▪ We have a limited history of operating at our current scale and under our current strategy, which makes it difficult to predict our future operating results, and we may not ▪ Our projections are subject to significant risks, assumptions, estimates and uncertainties. As a result, our projected revenues, gross profit Adjusted EBITDA, Adjusted
achieve our expected operating results in the future. operating profit, and Adjusted Free Cash Flow may differ materially from our expectations.
▪ We have a history of operating losses and we anticipate our operating expenses will increase substantially in the foreseeable future. As a result, we may not achieve or ▪ Our quarterly results may fluctuate significantly and may not fully reflect the underlying performance of our business.
sustain profitability in the future. Risks Related to Intellectual Property, Information Technology and Data Security and Privacy
▪ Our daily scan of the Earth is a data set that has not existed before. If the market for our products and services built upon this data set fails to grow as we expect, or if ▪ If we are unable to protect our intellectual property, the value of our brand and other intangible assets may be diminished, and our business may be adversely affected.
our current customers or prospective customers fail to adopt our platform, our business, financial condition and results of operations could be harmed. ▪ We may be, in the future, party to intellectual property rights claims and other litigation which are expensive to support, and if resolved adversely, could have a
▪ There is increasing competition from commercial entities and governments in our markets, and if we do not compete effectively, our business, financial condition and significant impact on us.
results of operations could be harmed. ▪ If we use open source software inconsistent with our policies and procedures or the license terms applicable to such software, we could be subject to demands to
▪ Our international operations create business and economic risks that could impact our financial results. release material portions of our source code, legal expenses, damages, or costly remediation or disruption to our business.
▪ If we or our third-party service providers experience, or are unable to protect against, cyber-attacks, ransomware, security incidents, or security breaches, or if Risks Related to Legal, Regulatory, Accounting, and Tax Matters
unauthorized parties otherwise obtain access to our customers’ data, our data, or our platform, then our platform may be perceived as not being secure, we may ▪ We operate in a highly regulated industry and government regulations may adversely affect our ability to sell our services, may increase the expense of such services or
become unable to meet our service level commitments, our reputation may be harmed, demand for our platform and products may be reduced, and we may incur otherwise limit our ability to operate or grow our business.
significant liabilities or additional expenses which may not be covered by existing cyber insurance. ▪ We are subject to the requirements of the National Industrial Security Program Operating Manual for the facility security clearance of our subsidiary, Planet Labs
▪ Interruption or failure of our infrastructure, or loss of our data storage, could hurt our ability to effectively perform our daily operations and provide our products and Federal, Inc., which is a prerequisite to our ability to perform services requiring classified personnel for the U.S. government.
services, which could damage our reputation and harm our operating results. ▪ We are subject to anti-corruption, anti-bribery, anti-money laundering and similar laws, and non-compliance with such laws can subject us to criminal and/or civil liability
▪ We process, store and use personal information and other data, which subjects us to governmental regulation and other legal obligations related to privacy, and any and harm our business.
failure to comply with such obligations could harm our business. ▪ Failure to comply with governmental laws and regulations could harm our business.
▪ We may experience a number of issues such as delayed launches, we may suffer launch failures, our satellites may fail to reach their planned orbital locations, the cost ▪ Our policies regarding customer confidential information and support for individual privacy and civil liberties could cause us to experience adverse business and
of satellite launches may significantly increase and or satellite launch providers may not have sufficient capacity. An y such issue could result in the loss of our satellites reputational consequences.
or cause significant delays in their deployment, which could harm our business, prospects, financial condition an d results of operations. ▪ We could be subject to changes in tax rates or the adoption of new tax legislation, whether in or out of the United States, or could otherwise have exposure to additional
▪ We may experience a failure of ground operations infrastructure, interference with our satellite signals or geomagnetic solar storms that impair the performance of our tax liabilities, which could harm our business.
satellites, which could harm our business, prospects, financial condition and results of operations. ▪ Our results of operations may be harmed if we are required to collect sales and use, gross receipts, value-added, or similar taxes for our products in jurisdictions where
▪ Our satellites may not be able to capture Earth images due to weather, natural disasters or other external factors, or as a result of constellation of satellites having we have not historically done so.
restrained capacity. ▪ We may not be able to utilize a significant portion of our net operating loss, which could adversely affect our potential profitability.
▪ If we are unable to develop and release product and service enhancements and new products and services to respond to rapid technological change, or to develop new ▪ Our customers may fail to pay us in accordance with the terms of their agreements, necessitating action by us to compel payment.
designs and technologies for our satellites, in a timely and cost-effective manner, our business, financial condition and results of operations could be harmed. ▪ Our reported financial results may be adversely affected by changes in accounting principles generally accepted in the United States.
▪ Our business depends, in part, on sales to large enterprises and U.S. and foreign governmental entities, which are subject to a number of challenges and risks that may ▪ If our judgments or estimates relating to our critical accounting policies are based on assumptions that change or prove to be incorrect, our results of operations could
make our sales cycle, forecasting processes, and deployment processes more difficult to predict, require greater time and expense or negatively impact our business. fall below expectations of securities analysts and investors, resulting in a decline in our stock price.
▪ The competitive position of our products depends in part on their ability to operate with third-party products and services, and if we are not successful in maintaining and Additional Risks Related to Ownership of Planet Common Stock Following the Business Combination and Planet Operating as a Public Company
expanding the compatibility of our products with such third-party products and services, our business, financial position, and operating condition and results of ▪ The price of Planet’s common stock and warrants may be volatile.
operations could be harmed. ▪ The SEC has recently issued guidance on the accounting treatment of warrants. Such guidance may require us to restate or revise our financial statements, make new
▪ If our satellites fail to operate as intended, our ability to collect imagery and market our products and services successfully could be materially and adversely affected. SEC filings or file amendments to existing filings or amend certain provisions of our warrant agreement.
▪ Our revenue, results of operations and reputation may be negatively impacted if our products fail to meet contractual requirements or our products contain defects or fail ▪ We have broad discretion in how we use the net proceeds from the Business Combination, and we may not use them effectively.
to operate in the expected manner. ▪ If securities or industry analysts either do not publish research about us, or publish inaccurate or unfavorable research about us, our business, or our market, or, if such
▪ We are partially dependent on resellers of our imagery for a portion of our revenue. If these resellers fail to market or sell our products and services successfully, our analysts change their recommendations regarding our common stock adversely, the trading price or trading volume of our common stock could decline.
business would be harmed. ▪ We do not intend to pay cash dividends for the foreseeable future.
▪ Downturns or volatility in general economic conditions, including as a result of the current COVID-19 pandemic or any other outbreak of an infectious disease, could ▪ We may be subject to securities litigation, which is expensive and could divert management attention.
have a material adverse effect on our business, financial condition, results of operations and liquidity. ▪ Future resales of common stock after the consummation of the Business Combination may cause the market price of our securities to drop significantly, even if our
▪ Our business, financial condition, results of operations, and prospects may be harmed if we are unable to sell our existing and new customers multiple of our data business is doing well.
solutions. ▪ The obligations associated with being a public company will involve significant expenses and will require significant resources and management attention, which may
▪ We depend on a limited number of suppliers for critical supplies and services, for research, development, manufacturing and launch of our satellites, which could in turn divert from Planet’s business operations.
harm our business, prospects, financial condition and results of operations. The loss of any one or more of these suppliers or their failure to supply us with the ▪ If Planet fails to maintain effective internal control over financial reporting at a reasonable assurance level, Planet may not be able to accurately report Planet’s financial
necessary supplies or services on a timely basis could cause delays in our research, development or satellite manufacturing and adversely affect our business. results, which could have a material adverse effect on Planet’s operations, investor confidence in Planet’s business and the trading prices of Planet’s securities.
▪ We may be unable to establish supply relationships for necessary components and may be required to develop alternative relationships with different component ▪ Compliance obligations under the Sarbanes-Oxley Act may make it more difficult for us to effectuate the Business Combination, require substantial financial and
suppliers, which could delay the introduction of our products, increase the costs for components more than anticipated, and negatively impact our business. management resources and increase the time and costs of completing a business combination.
▪ The effects of the ongoing COVID-19 pandemic have materially affected how we and our customers, vendors, and partners are operating our businesses, and the ▪ We are an emerging growth company within the meaning of the Securities Act, and if we take advantage of certain exemptions from disclosure requirements available
duration and extent to which this will negatively impact our future business and operations, results of operations, financial condition, and cash flows remain uncertain. to emerging growth companies, this could make our securities less attractive to investors and may make it more difficult to compare our performance with other public
▪ We have limited experience with respect to determining the optimal prices and pricing structures for our products and services which may impact our financial results. companies.
▪ The loss of one or more of our key personnel, or our failure to attract, hire, retain and train other highly qualified personnel in the future, could harm our business, ▪ The dual class structure of our post-Business Combination common stock will have the effect of concentrating voting power with New Planet’s Chief Executive Officer
financial condition and results of operations. and Co-Founder and Chief Strategy Officer and Co-Founder, which will limit an investor’s ability to influence the outcome of important transactions, including a change
▪ We believe our long-term value as a company will be greater if we focus on growth, which may negatively impact our profitability. in control.
▪ Failure to effectively develop and expand our sales and marketing capabilities could harm our ability to increase our customer base and achieve broader market ▪ We cannot predict the impact New Planet’s dual class structure may have on the stock price of New Planet Class A common stock.
acceptance of our products and platform. ▪ Delaware law and provisions in our post-Business Combination amended and restated certificate of incorporation and amended and restated bylaws could make a
▪ We have substantial customer concentration, with a limited number of customers accounting for a substantial portion of our revenues and accounts receivable. takeover proposal more difficult.
▪ Our business is capital intensive and we may not be able to raise adequate capital to finance our business strategies, or we may be able to do so only on terms that ▪ Claims for indemnification by our directors and officers may reduce our available funds to satisfy successful third-party claims against us and may reduce the amount of
significantly restrict our ability to operate our business, and as a result raises substantial doubt about our ability to continue as a going concern. money available to us.
▪ Our indebtedness could adversely affect our financial condition, our ability to raise additional capital to fund our operations, our ability to operate our business, our ability ▪ Our post-Business Combination amended and restated certificate of incorporation designates the Court of Chancery of the State of Delaware as the sole and exclusive
to react to changes in the economy or our industry and our ability to pay our debts and could divert our cash flow from operations for debt payments. forum for certain types of actions and proceedings and the federal district courts as the sole and exclusive forum for other types of actions and proceedings, in each
▪ We have experienced, and expect to continue to experience, seasonality in our business and fluctuations in our operating results due to usage-based contracts. case, that may be initiated by New Planet’s stockholders, which could limit New Planet’s stockholders’ ability to obtain what such stockholders believe to be a favorable
▪ We may face exposure to foreign currency exchange rate fluctuations. judicial forum for disputes with New Planet or New Planet’s directors, officers or other employees.
▪ We rely upon third-party providers of cloud-based infrastructure to host our products. Any disruption in the operations of these third-party providers, limitations on ▪ Following the Business Combination, we will operate as a Delaware public benefit corporation. As a public benefit corporation, we cannot provide any assurance that we
capacity or interference with our use could adversely affect our business, financial condition and results of operations. will achieve our public benefit purpose.
▪ Our business depends on a strong brand. If we are not able to maintain and enhance our brand, our ability to retain or expand our base of customers will be impaired ▪ As a public benefit corporation, our focus on a specific public benefit purpose and producing a positive effect for society may negatively impact our financial
and our business and operating results will be harmed. performance.
▪ If we cannot maintain our company culture as we grow, our success and our business and competitive position may be harmed. ▪ Our directors have a fiduciary duty to consider not only our stockholders' interests, but also our specific public benefit and the interests of other stakeholders affected by
▪ Our past and future acquisitions will require significant management attention. Our acquisitions could disrupt our business, dilute stockholder value or adversely affect our actions. If a conflict between such interests arises, there is no guarantee such a conflict would be resolved in favor of our stockholders.
our operating results. ▪ As a Delaware public benefit corporation, we may be subject to increased derivative litigation concerning our duty to balance stockholder and public benefit interest, the
51
▪ Issues in the use of artificial intelligence, including machine learning and computer vision (together, “AI”), in our geospatial data and analytics platforms may result in occurrence of which may have an adverse impact on our financial condition and results of operations.
reputational harm or liability.You can also read