INVESTOR PRESENTATION HEIMSTADEN BOSTAD AB - January 2020
←
→
Page content transcription
If your browser does not render page correctly, please read the page content below

INVESTOR PRESENTATION
HEIMSTADEN BOSTAD AB
January 2020

Disclaimer
Acceptance of limitations: The information in this presentation (the “Material”) is presented by Heimstaden AB (publ), reg. no. 556670-0455 (the “Company”), solely for the recipient’s information in connection with a contemplated issuance of hybrid debt instruments (the “Capital Securities”). The
intended recipients are determined by the Company. By attending a meeting where this Material is presented, or by reading this Material you agree to be bound by the terms, conditions, limitations and notifications described below. This Material has been prepared exclusively for the benefit and internal
use of the addressee and no part of this Material or the information it contains may be disclosed, reproduced or redistributed to any other party without the prior written consent of the Issuer. References to “Heimstaden”, the “Company”, the “Issuer” and the “Group” refer in this Material to Heimstaden AB
(publ) and its subsidiaries, unless otherwise indicated by the context.

Use of this Material: This Material does neither constitute an offer to sell nor a solicitation of an offer to buy any securities, and it does not constitute any form of commitment in relation thereto. No representation or warranty (expressed or implied) is made as to, and no reliance should be placed on, the
fairness, accuracy or completeness of the information in this Material. This Material should not be considered as a recommendation that any investor should subscribe for or purchase Capital Securities, and must be read together with the Listing Particulars (as defined below). Any person who
subsequently acquires Capital Securities is advised to read the Listing Particulars carefully and must not rely on any information contained in this Material, which is subject to amendment, revision and updating. In particular, investors should pay special attention to any sections of the Listing Particulars
describing the relevant risk factors. The merits or suitability of the Capital Securities described in this Material to any investor’s particular situation should be independently determined by such investor. Any such determination should involve, inter alia, an assessment of the legal, tax, accounting,
regulatory, financial, credit and other related aspects of the Capital Securities. No person is authorised to give any information or to make any representation not contained in and not consistent with this Material and the Listing Particulars and, if given or made, such information or representation must not
be relied upon as having been authorised by or on behalf of the Issuer or Danske Bank, Deutsche Bank, J.P. Morgan and Nordea (the “Joint Bookrunners”). The content of this Material is not to be construed as legal, credit, business, financial, investment or tax advice.

No financial advice: The Joint Bookrunners are not giving and are not intending to give financial advice to any potential investor, and this Material shall not be deemed to be financial advice from the Joint Bookrunners to any potential investor. Participation, by the means of subscription of Capital
Securities, involves a high level of risk and several factors could cause the actual results or performance of the Company to be different from what may be expressed or implied by statements contained in this Material. Investors should not subscribe for or purchase any financial instruments or securities
only on the basis of the information provided herein. Any investor investing in the Capital Securities is bound by the final terms and conditions for the Capital Securities, which the investor acknowledges having accepted by subscribing for the Capital Securities. Investors are encouraged to request from the
Company and other sources such additional information as they require to enable them to make informed investment decisions, to seek advice from their own legal, tax and financial advisors and to exercise an independent analysis and judgment of the merits of the Company.

No liability: Although the Company has endeavored to give a correct and complete picture of the Company, neither the Company nor the Joint Bookrunners can be held liable for any loss or damage of any kind arising from the use of this Material.

Information sources: The information in this Material is presented by the Company and has been produced by the Company exclusively for information purposes. Only a limited due diligence has been carried out in connection with the preparation of this Material. Thus, there may be risks related to the
Company which are not included in this Material and which could have a negative effect on the Company's operations, financial position, earnings and result. No information in this Material has been independently verified by the Company, the Joint Bookrunners or any advisor to the Company or the Joint
Bookrunners. None of the Joint Bookrunners and the Company or their respective affiliates, agents, directors, partners and employees accepts any responsibility whatsoever for, or any liability for any loss howsoever arising, directly or indirectly, from this Material or its contents, or makes any
representation or warranty, express or implied, as to the contents of this Material or for any other statement made or purported to be made by it, or on its behalf, including (without limitation) information regarding the Issuer or the Capital Securities and no reliance should be placed on such information. To
the fullest extent permitted by applicable law, the Joint Bookrunners and the Company accordingly disclaim any and all responsibility and/or liability, whether arising in tort, contract or otherwise, which they might otherwise have in respect of this Material or any such statement. The information relating to
the Company does not constitute a complete overview of the Company and must be supplemented by the reader wishing such completeness. To the extent available, the industry, market and competitive position data contained in this presentation comes from official or third party sources. Third party
industry publications, studies and surveys generally state that the data contained therein have been obtained from sources believed to be reliable, but that there is no guarantee of the accuracy or completeness of such data.

Forward looking statements: Certain information contained in this Material, including any information on the Company’s plans or future financial or operating performance and other statements that express the Company’s expectations or estimates of future performance, constitute forward-looking
statements (when used in this document, the words “anticipate”, “believe”, “estimate” and “expect” and similar expressions, as they relate to the Company or its management, are intended to identify forward-looking statements). Such statements are based on a number of estimates and assumptions that,
while considered reasonable by management at the time, are subject to significant business, economic and competitive uncertainties. The Company cautions that such statements involve known and unknown risks, uncertainties and other factors that may cause the actual financial results, performance or
achievements of the Company to be materially different from the Company’s estimated future results, performance or achievements expressed or implied by those forward-looking statements.

Actuality: This Material is dated 5 November 2019. Neither the Company nor the Joint Bookrunners intend to, or assume any obligation to, update or correct any information included in this Material. This Material may however be changed, supplemented or corrected without notification.

Conflicts of interest: The Joint Bookrunners and their clients and/or employees may hold shares, options or other securities of any issuer referred to in this report and may, as principal or agent, buy or sell such securities.

Listing Particulars: This presentation is an advertisement. A final form listing particulars (“listing particulars”) will be prepared and made available to the public in accordance with the rules of Euronext Dublin. The final form listing particulars, when published, will be available on the website of Euronext
Dublin.

Distribution: Neither this Material nor any copy of it or the information contained herein is being issued, nor may this Material, any copy of it or the information contained herein be distributed directly or indirectly, in or into the United States, Canada, Australia, Hong Kong, Italy, New Zealand, the Republic
of South Africa, Japan, the Republic of Cyprus, the United Kingdom or any other jurisdiction in which such distribution would be unlawful or would require registration or other measures. No securities referred to in this Material have been or will be registered by the Company under the U.S. Securities Act of
1933, as amended (the “Securities Act”) or the securities laws of any state of the United States. This Material may not be distributed into or in the United States or to any “US person” (as defined in Rule 902 of Regulation S under the Securities Act). The distribution of this Material in other jurisdictions
may be restricted by law and persons into whose possession this Material comes should inform themselves about, and observe, such restrictions. Any failure to comply with these restrictions may constitute a violation of the laws of any such other jurisdiction. This Material is not intended to be made
available to and should not be made available to any retail investor in the EEA. For these purposes, a retail investor means a person who is one (or more) of: (i) a retail client as defined in point (11) of Article 4(1) of MiFID II; or (ii) a customer within the meaning of Directive 2016/97/EU, where that
customer would not qualify as a professional client as defined in point (10) of Article 4(1) of MiFID II. Consequently no key information document required by Regulation (EU) No 1286/2014 (as amended, the "PRIIPs Regulation") for offering or selling the Capital Securities or otherwise making them
available to retail investors in the EEA has been prepared and therefore offering or selling the Capital Securities or otherwise making them available to any retail investor in the EEA may be unlawful under the PRIIPs Regulation.

This Material is being distributed only to and directed only at (i) persons who are outside the UK, or (ii) persons who are in the UK and who are (a) persons who have professional experience in matters relating to investments falling within Article 19(5) of the Financial Services and Markets Act 2000
(Financial Promotion) Order 2005 or (b) otherwise, persons to whom it may otherwise lawfully be distributed (all such persons together being referred to as “relevant persons”). This Material is directed only at relevant persons and must not be acted on or relied on by persons who are not relevant persons.
Any investment or investment activity to which this Material is available only to relevant persons and will be engaged in only with relevant persons.

Target market: Solely for the purposes of the manufacturers’ (as used herein, “Manufacturers" refers to the Joint Bookrunners) product approval process, the target market assessment in respect of the Capital Securities has led to the conclusion that: (i) the target market for the Capital Securities is
eligible counterparties and professional clients, each as defined in Directive 2014/65/EU (as amended, "MiFID II"); and (ii) all channels for distribution of the Capital Securities to eligible counterparties and professional clients are appropriate. Any person subsequently offering, selling or recommending the
Capital Securities (a "Distributor") should take into consideration the Manufacturers’ target market assessment; however, a Distributor subject to MiFID II is responsible for undertaking its own target market assessment in respect of the Capital Securities (by either adopting or refining the Manufacturers’
target market assessment) and determining appropriate distribution channels. For the avoidance of doubt, the target market assessment does not constitute: (a) an assessment of suitability or appropriateness for the purposes of MiFID II; or (b) a recommendation to any investor or group of investors to
invest in, or purchase, or take any other action whatsoever with respect to the Capital Securities.

Placement fee: The Joint Bookrunners will be paid a fee by the Issuer in respect of the placement of the transaction.

Rounding: Certain data in this presentation has been rounded. As a result of such rounding, the totals of data prescribed in this presentation may vary slightly from the arithmetic total of such data.

Rating: A rating is not a recommendation to buy, sell or hold securities and may be subject to revision, suspension or withdrawal at any time by the assigning rating organisation.

                                                                                                                                                                                                                                                                                                                       1
Today’s presenters and agenda
                                         Presenters                                                                 Agenda

                                                                                                1
                             MAGNUS NORDHOLM                                                        Heimstaden Bostad in a brief
                                 Deputy CEO, Heimstaden AB

                                                                                                2
Magnus is the deputy CEO of Heimstaden AB. Until recently he also was CEO of Fredensborg
AS. Before joining Heimstaden AB in 2008 he was Head of Nordic Structured Real Estate               Markets and property portfolio
Finance at HSH Nordbank AG.

                                                                                                3
                                       Adam Lindh
                               Head of Finance, Heimstaden AB                                       Long term value creation

Adam is Head of Finance at Heimstaden AB and joined in 2014. He previously held the             4
positions as Vice President at Situs, a real estate security consultancy firm in Copenhagen.
Before that he was Senior Project Manager at HSH Nordbank AG, Copenhagen branch.                    Financial overview

                                 Christian Fladeland                                            5
                           Chief Investment Officer, Heimstaden AB
                                                                                                    Proposed transaction

Christian is Chief Investment Officer at Heimstaden AB and joined in 2019. He previously held
positions as partner at Colliers International Denmark and Sadolin & Albæk

                                                                                                                                     2
1   2   3   4   5   6

Heimstaden Bostad in a brief

Heimstaden Bostad in a brief

Recent material events in Heimstaden Bostad
                               October to January 2020

  •    Heimstaden Bostad AB (“HSTB”) announces the acquisition of a Residomo, a Czech
       Republic residential portfolio, for €1.3bn (9 January)

  •    HSTB announces the acquisition of a German residential portfolio in the cities of
       Berlin and Bielefeld for SEK1.32bn (23 December)

  •    HSTB announces Folksam Group will become new owners of HSTB after
       subscribing to c.SEK4bn of a cash rights issue to be made on January 2020.
       Simultaneously Heimstaden Investment AB will subscribe SEK7.2bn (18 December)

  •    HSTB receives a revised BBB- rating with a positive outlook from S&P (affirmed 10
       January)

  •    HSTB strengthens its equity base with a SEK 9.5bn private placement directed to
       Heimstaden AB (“HST”) and Alecta. Simultaneously, it acquired 10,447 residential units
       in the Netherlands with a GAV of SEK 18bn from HST. HSTB also signed a letter of
       intent to acquire the remaining properties in HST, as well as Alecta's residential portfolio
       with a total GAV of SEK 2.6bn (25 October)

  •    HSTB communicates that future real estate investments in Europe are to be made via
       HSTB; and Alecta commits to further equity contributions of SEK 7.5bn in HSTB to
       support its development (25 October)

  •    HSTB communicates its ambition to reach its target BBB+ rating by summer 2021 (25
       October)

  •    The financial policy is adjusted with a net debt / net debt + equity ratio of 45-55% and
       a hedge ratio of 75%, up from 50% (25 October)

Source: Company Information.

                                                                                                      4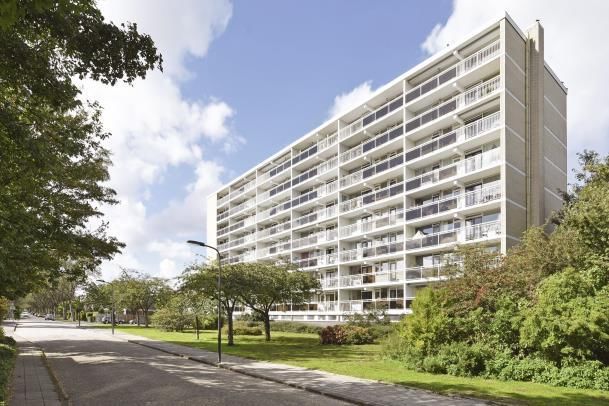
Heimstaden Bostad in a brief

HSTB is a leading Northern European residential platform
                                                         Highlights                                                                               Portfolio split as of Q3 2019 (pro-forma for the Netherlands)
 •    HSTB is one of the largest residential real estate companies in Northern Europe with                                                                               Residential units                                     Property portfolio
      a property portfolio of c. 52k residential units and total assets valued at SEK 108bn                                                                                                                       Value                          Value/sqm
                                                                                                                                               Country               Number                 Share                                   Share
 •    HSTB creates value by investing, managing and repositioning properties located in                                                                                                                          (SEKbn)                           (SEKt)
      growth areas in Sweden, Denmark, Norway and the Netherlands (since October                                                                                      28,151                 54.4%                  38.8                 36.1%                  20.0
      2019)
                                                                                                                                                                       8,716                 16.8%                  33.4                 31.1%                  42.1
 •    HSTB portfolio is highly diversified and focused on capital cities and high growth
      urban areas with favourable market dynamics                                                                                                                      4,441                  8.6%                  17.4                 16.2%                  80.2

 •    HSTB’s majority owner is the Norwegian Fredensborg group (via HST), and the                                                                                     10,447                 20.0%                  17.9                 16.7%                  20.7
      second largest owner is Alecta, with minority owners consisting of the corporate                                                           Total                51,755                100.0%                 107.5                100.0%                  28.2
      pension funds of Ericsson and Sandvik

                                       Key performance indicators

                                                          FY18                 3Q 2019            3Q 2019 (Pro-forma)4)
 Key ratios
 ICR2)                                                 2.7x                    2.5x                        2.5x
                                                                                                                                             Ystad, Sweden                                Malmö, Sweden                                 Norrköping, Sweden
 LTV3)                                                51.5%                   51.8%                       49.8%
 Credit rating                                      BBB- (stable)           BBB- (stable)              BBB- (positive)
 Earnings capacity (SEKm)2)
 Rental income                                            3,819                   4,377                       5,215
 NOI                                                      2,223                   2,595                       3,134
 EBITDA                                                   2,078                   2,450                       2,969
 Balance sheet (SEKm)                                                                                                                        Copenhagen, Denmark                           Oslo, Norway                                 Rotterdam, The Netherlands

 GAV                                                     72,329                  89,629                     107,540
 Net debt                                                39,279                  48,944                      57,015
 Equity                                                  31,925                  38,776                      48,385
 Operational (%)
 Surplus ratio (earnings capacity)                       58.2%                   59.3%                        60.1%
 Real occupancy1)                                        98.5%                   99.2%                        98.6%                          Copenhagen, Denmark                           Oslo, Norway                                 De Bilt, The Netherlands

Source: Company information as of 3Q 2019 (pro-forma for the Netherlands). Notes: 1) Real occupancy rate defined as leased housing, adjusted for remodelling vacancies due to standard improvements, divided by the total number of residential units. 2) Earnings
capacity defined as earnings capacity as of 30 September 2019. 3) Defined as Net debt / Total assets. 4) Prior to planned installment of c. SEK 700m
                                                                                                                                                                                                                                                                       5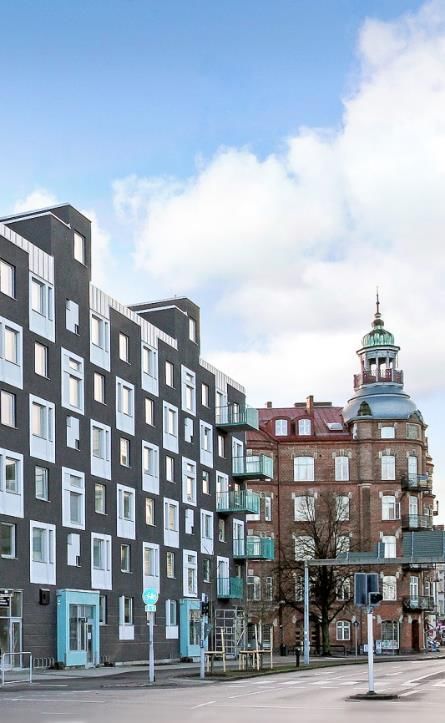
Heimstaden Bostad in a brief

HSTB accumulates more than two decades of growth and
continuous increase in operational quality
                                                                                Key operational developments and milestones

                                                      Operational development                                                                          Milestones                                       Property value

                                                                                                                           • Expansion to Netherlands through acquisition of properties worth SEK
                 • Continued acquisitions of properties in Sweden, Denmark and Norway and expansion into the Netherlands     18bn from HST
      2019                                                                                                                                                                                          •     SEK ~108bn
                 • HSTB issues a bond for SEK7.4bn under the EMTN program                                                  • Private placement of SEK9.5bn equity from HSTB and Alecta
                                                                                                                           • Received a revised BBB- rating with a positive outlook from S&P

      2018       • HSTB increases its exposure to Norway and Denmark
                                                                                                                           • HSTB achieves IG rating by S&P                                         •     SEK ~72bn
                 • Further acquisitions in growth areas in Sweden

                • HSTB enters the Danish and Norwegian markets for the first time                                          • Expansion to Norway through acquisition of properties from
      2017                                                                                                                                                                                          •     SEK ~44bn
                • Acquisition from HST continues in Q4                                                                       Fredensborg

                • Acquisition from HST continues in Q3
      2016                                                                                                                                                                                          •     SEK ~20bn
                • Portfolios in Luleå and Växjö, Sweden, are acquired from the municipalities

                • Strategy to acquire residential properties is supported by favourable macro environment
      2015                                                                                                                 • Expansion to Denmark                                                   •     SEK ~6bn
                • Portfolios in Trelleborg, Skellefteå and Katrineholm, Sweden, are acquired

                                                                                                                           • Strong partnerships with Alecta as well as Ericsson’s and Sandvik’s
      2013      • HSTB is established and the first portfolio is acquired from HST                                                                                                                  •     SEK ~3bn
                                                                                                                             pension funds are established

      2008-                                                                                                                • Magnus Nordholm joins as CFO and is elected to the Board of
                • Expansion through acquisitions in Mälardalen, Skåne and Småland                                                                                                                   •     SEK ~10bn
      2005                                                                                                                   Directors

                                                                                                                           • The founder of Fredensborg AS Ivar Tollefsen becomes Chairman of
      2005      • Fredensborg AS acquires HST from Reiten & Co AS                                                                                                                                   •     SEK ~2bn
                                                                                                                             the Board in HST. Patrik Hall also joins Board of Directors

      2003      • Reiten & Co AS acquires HST from the founders                                                            • Patrik Hall becomes CEO, joined the company in 2001

      1999      • Wallenstam portfolio in Malmö is acquired

      1998      • HST is founded

 xx    Refers to HST           xx   Refers to HSTB

Source: Company information.

                                                                                                                                                                                                                         6
Heimstaden Bostad in a brief

Why we like residential real estate
 Supportive trends                                  A long-term investment

                                                      Housing is an      •   Everyone needs a place to live
                High degrees of urbanization         essential human     •   A home today looks much like it did 200 years ago and cannot be digitalized
                                                          need           •   In Europe, most governments support housing costs for their population

                Rising age of population                                 •   In smaller cities, rents and returns are mainly driven by income growth while in
                                                     Strong demand           larger cities rents and returns are also driven by urbanization trends
                                                        dynamics
                                                                         •   Highly unlikely that regulated rents below market rents will decrease

                Smaller household size
                                                        Favourable
                                                         regulated
                                                                         •   Rent regulation provides access to affordable living space in city centers and
                                                                             opportunity of gradual shift to unregulated housing (at natural churn rates)
                                                       environment
                Steady increase in housing prices
                                                    Co-investing with population that also wants value growth

                Limited new housing stock                                •   With home ownership at c.50-95% across Europe, HSTB is “co-invested” with the
                                                      High levels of         majority of the population
                                                     home-ownership      •   Being “co-invested” is a safe spot for value preservation and growth since
                                                                             housing price decreases would weaken purchasing power and financial stability

                Digital “revolution”
                                                                         •   Fluctuations in the residential sector will occur, however long-term sustainable value
                                                        Long-term            growth is an objective of states and private stakeholders
                                                        sustainable          ― Increased productivity and real salaries (low inflation) support residential prices and
                                                       value growth             rent appreciation
                Green living, sense of community
                                                                             ― HSTB ensures people across social classes can live in city centers

Source: Company information.

                                                                                                                                                                         7
Heimstaden Bostad in a brief

Vision and business concept

                                   OUR VISION                                                       OUR BUSINESS CONCEPT
            We enrich and simplify life through friendly homes                       We acquire, manage and refurbish foremost residential
                                                                                                         properties

                                                                       OUR OFFERING
                               1                             2                                 3                                 4

          Value creation for shareholders      Value creation for customers by       Value creation for our            Value creation for society
                and partners through              developing and delivering a    employees through nurturing a     through long-term investments,
           developing and optimising an        friendly home in growth regions   corporate culture and a working   resource-efficient management
           attractive residential property               in the Nordics          environment that is permeated         and operations as well as
          portfolio in growth regions in the                                           by our core values:          through property development
                        Nordics                                                                                    in areas with housing shortage
                                                                                     “Care, dare and share”

Source: Company information.

                                                                                                                                                    8
Heimstaden Bostad in a brief

HSTB business model and asset management agreement with
HST is focused on long term value creation
          HSTB business model                                                          HSTB group structure

•    HSTB benefits from having HST, a
                                                                                                                Institutional
     dedicated manager and owner with                                                    HST
                                                                                                               shareholders
     experience of operations in the
     residential sector, as its largest
                                                 HSTB
     shareholder                              shareholders   Property & Facility
                                                             management
•    HSTB does not have any employees of
                                                             services
                                                             through HST
     its own but instead has established a                   subsidiaries        Asset
                                                                                 management
     group-wide asset management
                                                                                 agreement
     agreement with HST

                                                Holding
•    The asset management agreement
                                               company
                                                                                                        HSTB
     entails several central functions
     including management, transaction and
     project development

•    In addition, wholly owned subsidiaries     Property
                                                portfolio
     of HST provide property and facility
                                                                   Sweden                     Denmark          Norway           Netherlands
     management services

                We work in very close cooperation with our largest shareholder, HST, with whom we have a long term asset management
                              agreement to manage, expand and optimize our portfolio, as well as develop new properties

Source: Company information.

                                                                                                                                              9
Heimstaden Bostad in a brief
Strong alignment of interests between HST and institutional
shareholders
Legal structure and shareholders Shares in HSTB
HST Share of votes2) Share of capital (equity)2)3)
management
Ivar Tollefsen
(private individual) More voting rights through
52% HST common shares 45% HST
100%
(Pension fund) 39% Alecta 45% Alecta
6% Folksam (Group) 7% Folksam (Group)
98.4% 2% Ericsson Pension 2% Ericsson Pension
(Pension fund)
% %
HST1)(group) 1% Sandvik Pension 1% Sandvik Pension
through subsidiaries (Pension fund)
(Group)Heimstaden Bostad in a brief
Why invest in HSTB?
One of the largest European residential players, SEK108bn GAV, with portfolio spread
1 across Sweden (36%), Denmark (31%), Norway (16%) and the Netherlands (17%)
Robust Northern European housing markets benefiting from sound macro-economic
2
fundamentals and favourable social and demographic trends
High quality diversified portfolio with high real occupancy3) (c.98.6%1)) anchored in capital
3
cities and prime locations in high growth urban areas
Portfolio with a high degree of regulated residential units (72%) combined with attractive
4
unregulated markets underpin enhanced cash-flow predictability
Stable residential income with track record of organic and accretive acquisition-led growth
5 with improving profitability, and with actionable opportunities with minimal development risk
Well-balanced BBB- positive (S&P) capital structure (49.8% LTV2)) with announced
6
ambition to reach its target BBB+ by summer 2021
Top class asset and property facility management skills with >20 years of track record in
7 the Nordics lead by HST, HSTB’s majority shareholder and dedicated industrial owner
8 Institutional support with strong alignment of interest between shareholders, including
HST, Alecta, Folksam (Group) and the corporate pension plans of Sandvik and Ericsson
Source: Company information as of 3Q 2019 (pro-forma for the Netherlands). Notes: 1) On the basis of total residential units; 2) Calculated as Net debt / Total assets 3Q 2019PF; 3) Real occupancy rate defined as leased housing, adjusted for remodelling vacancies due
to standard improvements, divided by the total number of residential units
111 2 3 4 5 6 Markets and property portfolio
Markets and property portfolio

Positive residential sector fundamentals across markets…
                Property prices are rising across targeted markets                                                                                                    Rents are outgrowing inflation

Indexed property prices in housing markets (%, 2008)                                                                               Indexed rent development (%, 2008)
220                               CAGR 08-18         Growth ‘18                                                                     220                             CAGR 08-18        Growth ‘18
            Sweden                  4.6%                0.1%                                                                                   Sweden                 2.4%              2.4%
200         Copenhagen              3.2%                3.5%                                                                        200        Denmark                4.0%              2.6%
            Oslo                    7.7%                4.4%                                                                                   Oslo                   4.0%              0.8%
180         The Netherlands         2.5%               10.3%                                                                        180        The Netherlands        2.6%              2.3%
                                                                                                                                               CPI                    1.4%              1.9%
160                                                                                                                                 160
140                                                                                                                                 140
120                                                                                                                                 120
100                                                                                                                                 100
  80                                                                                                                                 80
    2008        2009   2010           2011   2012   2013               2014        2015    2016     2017             2018              2008        2009   2010     2011              2012        2013    2014            2015   2016     2017   2018
                   Sweden                Copenhagen                   Oslo            the Netherlands                                                 Sweden                                   Denmark                            Oslo
                                                                                                                                                                  2)
                                                                                                                                                      Average CPI                              the Netherlands

              Across Northern Europe, yield gaps remain attractive                                                                                                                    Commentary

Yield gap1) development – Residential property yields vs. 5 year swap (%)                                                            •    Strong performance of residential property prices and rents across all HSTB
                                                                                                                                          markets
     6,0%
     5,0%
                                                                                                                                     •    The growing middle income tenant segment with increasing purchasing
                                                                                                                                          power has been one of the key drivers for the residential rental sector
     4,0%
                                                                                                                                          expansion
     3,0%
     2,0%
                                                                                                                                     •    Average rent levels continue its upward trend, particularly in capital cities
                                                                                                                                          and growth cities across HSTB’s portfolio
     1,0%
     0,0%
                                                                                                                                     •    Higher urbanisation is driving increasing number of young families and
                                                                                                                                          young professionals into cities, supporting growing demand for the
    -1,0%
        2008       2009       2010     2011      2012      2013      2014      2015     2016      2017      2018                          residential asset class
                    Sweden                                  Copenhagen                               Oslo                            •    The era of low interest rates continues to support the sector across several
                    5 year EUR swap                         the Netherlands                                                               regions
Source: Bloomberg, Eiendom Norge, Euroconstruct, Genesis, JLL Global Research, MSCI Real Estate Analytics Portal, Morgan&Stanley and Cushman&Wakefield (property yields), NVM, Realkreditradet, SCB, SSB, Statbank, UN
Notes: 1) Residential property yield – 5-year local currency swap rate; 2) Refers to average CPI of Sweden, Denmark, Norway
                                                                                                                                                                                                                                                   13
Markets and property portfolio
… supported by favourable demographic trends and continued
supply-demand imbalance
The gap between housing starts and population growth persists HSTB regions stand out as growing urban areas
200 000 Urbanisation1) (%, 2020E)
Population growth - Sweden Housing starts - Sweden
92,2%
100 000 Europe 88,0% 88,1%
83,0%
average:
74.9%
0
2008 2009 2010 2011 2012 2013 2014 2015 2016 2017 2018
20 000 Population growth - Copenhagen Housing starts - Copenhagen
10 000
0 Sweden Denmark Norway the Netherlands
2008 2009 2010 2011 2012 2013 2014 2015 2016 2017 2018
Commentary
20 000
Population growth - Oslo Housing starts - Oslo
10 000
• New housing developments are insufficient to close substantial excess
demand, which is projected to persist post peak-completions across capital
cities in HSTB’s portfolio
0
2008 2009 2010 2011 2012 2013 2014 2015 2016 2017 2018 • New housing supply predominantly targeted at a tenant profile with higher
disposable income and larger families
200 000 Population growth - the Netherlands Housing starts - the Netherlands
• Most new housing supply in target markets are not expected to meaningfully
compete with HSTB’s portfolio due to different size and target tenant profiles
100 000
• Strong demand for residential housing from small families, young
0 professionals, expats and students across HSTB’s focus markets
2012 2013 2014 2015 2016 2017 2018
Source: Euroconstruct, BMI, ECB Europa, Fred Economic data, Department of Economic and Social Affairs, Population Division, World Bank, SCB, Eurostat, OECD, Worldpopulationreview, United Nations, European Mortgage Federation, Trading Economics
Notes: 1) Urban areas as defined by each country’s statistical authority
14Markets and property portfolio
72% of HSTB’s residential portfolio is regulated…
Break-down of residential units 3Q 2019 share of residential units
Residential – unregulated 28%
Residential – regulated 72% of total residential units
Simplified overview of the residential rental markets of HSTB’s existing portfolio
Sweden Denmark Norway The Netherlands
100% units are regulated 20% units are regulated 100% units are unregulated 31% units are unregulated
• Based on the principle of utility value • Different rent regulation systems • Market rent is used on all contracts • A unit is categorized as regulated or
(assessed value for the user) depending on construction year. signed unregulated depending on monthly
Properties built before 1992 have rent and WWS points (based on
• Rent negotiated between property
regulated rents
• Every third year each rental contract
certain characteristics such as
owner and Swedish Union of is by default terminated and the rent
location, standard, equipment and
Tenants on annual basis • Regulated rents can only be for the coming contract is adjusted to
size)
increased through investments i) by the assessed market rent. During the
• Units with the same utility value shall
theoretical financing costs (low three years rents are regulated by
have the same price, given the same
investment), and ii) to an utility value CPI
micro location
(high)
• Rent levels may be lower than the
• Rental contracts run without a fixed
theoretical market rent
maturity
• Residential contracts run without a
fixed maturity
Source: Company information as of 3Q 2019 (pro-forma for the Netherlands), MVGM, Goethe Institute, CBS
15Markets and property portfolio
… thus benefiting from exposure to both regulated and highly
attractive unregulated markets
Best of both worlds Key best practices Regulatory strategy
Regulated Unregulated • Optimal risk-reward profile due to mix of
regulated vs. unregulated units is assessed • HSTB is confident that a mix of regulatory
72% 28% on a country-by-country basis regimes provides a highly attractive risk-
of residential units of residential units adjusted return profile
Opportunity to
Significant cushion
benefit more from • The assessment of regulatory impact is
based on rental rates
faster reversion to reflected in the purchase price HSTB is
below market-level
market rents willing to pay • Exposure to both regulated and
unregulated segment allows HSTB to take
Ability to secure advantage of possibly diverging supply-
Acquisitions below
replacement cost higher cash yields • Investing in unregulated units based on demand dynamics in target locations
high degree of certainty that downside-
Higher liquidity in risks are mitigated effectively
Favourable policies secondary markets
combine attractive
• Only invest in unregulated markets when • Going forward, HSTB will retain
returns and Ability to acquire
underlying macro-economic, balanced exposure to both regulated
downside assets at a discount
demographic and residential Real and unregulated segment
protection to vacant
possession value1) Estate drivers are considered supportive
Favourable regulatory regimes combined with attractive unregulated exposure to enhance cash-flow predictability
Source: Company information as of 3Q 2019 (pro-forma for the Netherlands). Note: 1) Also valid in some regulated markets, such as the Netherlands, where regulated properties can be privatized
16Markets and property portfolio
HSTB has a geographically diversified high quality residential
property portfolio in Northern Europe…
The largest private residential portfolio SEK 17bn GAV 4,441 residential units
across the Nordic region with growing
presence in the Netherlands SEK 108bn
GAV
Portfolio anchored in larger cities and Oslo Oslo
prime locations in growth urban areas
51,755 SEK 33bn GAV 8,716 residential units
Diversified portfolio with high occupancy # of residential units
rate
Type and size of units adapted to the SEK 5,215m Copenhagen Copenhagen
demographic trends Passing rent1)
NORWAY SEK 39bn GAV 28,151 residential units
Rental performance above inflation SWEDEN
Stockholm
Oslo
across all regions
Attractive risk-adjusted yields with Uppsala Malmö
DENMARK Malmö
further rent and value upside potential Copenhagen
SEK 18bn GAV 10,447 residential units
Significant visibility on expansion
THE NETHERLANDS
of current platform supported by
refurbishments, new developments and Rotterdam
forward option projects with minimal Utrecht Arnhem
development risk
Source: Company information as of 3Q 2019 (pro-forma for the Netherlands). Note: 1) Passing rent refers to the earning capacity as per 30 September, 2019
17Markets and property portfolio
… with largest portfolio in Sweden, followed by Denmark, the
Netherlands and Norway
Portfolio snapshot Q3 2019 (pro-forma for the Netherlands)
Number of Number of Average size per Real occupancy Market value Market value per
Country properties apartments Total area (tsqm) apartment (sqm) rate (%)1) (SEKm) sqm (SEKt)
Sweden 763 28,151 1,942 61 99.5 38,774 20.0
Denmark 136 8,716 794 87 98.4 33,422 42.1
Norway 84 4,441 217 35 99.1 17,433 80.2
The Netherlands 555 10,447 865 82 96.5 17,917 20.7
Total 1,538 51,755 3,818 67 98.6 107,546 28.2
Portfolio distribution Q3 2019 (pro-forma for the Netherlands)
Split per region (property value) Split per property type (tsqm) 10 largest cities in portfolio (in terms of property value, SEKbn)
Commercial 22,4
The Netherlands
9% 17,2
17% Sweden
36%
7,2
4,9
2,5 2,0 2,0 1,7 1,6 1,6
Norway
16% Oslo
Rotterdam
Stockholm
Copenhagen
Ystad
Gävle
Lund
Malmö
Norrköping
Uppsala
Greater
Denmark Residential
31% 91%
Source: Company information as of 3Q 2019 (pro-forma for the Netherlands). Note: 1) Real occupancy rate defined as leased housing, adjusted for remodelling vacancies due to standard improvements, divided by the total number of residential units
18Markets and property portfolio
HSTB country-level portfolio highlights
Sweden portfolio KPI evolution
• Nationwide geographical presence concentrated in 28 key growth cities 2018 3Q 2018 3Q 2019
• Growth historically delivered via acquisitions and developments favouring areas with GAV (SEKm) 35,881 33,962 38,774
population growth, infrastructure and proximity to universities and colleges Gross rental income (SEKm) 2,014 1,478 1,648
• High quality 100% regulated units well positioned vs. the competition Net operating income (SEKm) 985 772 808
Net operating income margin (%) 48.8% 52.2% 49.0%
• SEK 38.8bn portfolio of 763 properties and 28,151 apartments (36% of HSTB’s GAV)
Residential properties (#) 751 763 763
• Total area of 1.9m sqm with average rent/sqm/year of SEK 867 Occupancy (%)1) 98.1 98.4 98.0
Denmark portfolio KPI evolution
• Residential portfolio targeting a wide segment from students and young professional to small 2018 3Q 2018 3Q 2019
families and seniors GAV (SEKm) 20,927 18,113 33,422
• Properties located predominantly in central Copenhagen locations, consisting of a mixture of Gross rental income (SEKm) 616 406 866
recently developed units as well as regulated older stock Net operating income (SEKm) 400 270 587
• SEK 33.4bn portfolio of 136 properties and 8,716 apartments (31% of HSTB’s GAV)
Net operating income margin (%) 65.1% 66.6% 67.8%
Residential properties (#) 83 75 136
• Total area of 0.8m sqm with average rent/sqm/year of SEK 1,237 Occupancy (%)1) 94.1 94.3 96.4
Norway portfolio KPI evolution
• Residential portfolio targeting highly sought-after entry-level housing in Oslo city centre 2018 3Q 2018 3Q 2019
GAV (SEKm) 15,521 16,454 17,433
• Highly liquid portfolio distinctively characterised by its high share of small residential units
Gross rental income (SEKm) 601 419 516
• SEK 17.4bn portfolio of 84 properties and 4,441 apartments (16% of HSTB’s GAV) Net operating income (SEKm) 366 259 344
• Total area of 0.2m sqm with average rent/sqm/year of SEK 2,580 Net operating income margin (%) 61.1% 61.8% 66.7%
• 100% of rental income based on market rents Residential properties (#) 82 82 84
Occupancy (%)1) 96.6 97.3 97.7
The Netherlands portfolio KPI evolution
• Well located portfolio spread across the Netherlands 2018 3Q 2018 3Q 2019
GAV (SEKm) NM NM 17,917
• Price well below replacement cost limits competition from new construction
Gross rental income (SEKm) NM NM 681
• SEK 17.9bn portfolio of 555 properties and 10,447 apartments (17% of HSTB’s GAV) Net operating income (SEKm) NM NM 372
• Total area of 0.9m sqm with average rent/sqm/year of SEK 969 Net operating income margin (%) NM NM 54.6%
• 31% of rental income based on market rents Residential properties (#) NM NM 10,447
Occupancy (%)1) NM NM 96.5%
Source: Company information as of 3Q 2019 (pro-forma for the Netherlands). Note: Gross rental income and Net operating income represents 9-months 2018/2019. 1) Definition according to quarterly report. 19Markets and property portfolio
HSTB portfolio impressions across countries
Aktern 1, Malmö Havneholmen, Copenhagen Waldemar Thranes Gate 71, Oslo Spechtlaan, Leidschendam
Markattan 5, 10, Norrkoping Schades Have, Copenhagen Vibes gate 11, Oslo De Verademing, Den Haag
Fålhagen 11-3, Uppsala Øresundsterasserne, Copenhagen Nedre gate 8, Oslo Duincarré, Rotterdam
Source: Company information.
201 2 3 4 5 6 Acquisition of Residomo
Acquisition of Residomo

Residomo is the largest privately held residential portfolio in Czech Republic

                                     Overview                                                                                                                               Locations
 •    Residomo owns and operates the largest privately-held residential portfolio
      in the Czech Republic which provides affordable accommodation                                                                                                                                                Portfolio by value (3Q2019)
                                                                                                                        Olomouc region
 •    Portfolio valued at CZK 32,781m (€1.3bn)1 as at 30-Sep-2019:                                                                                                                                                                          Haviřov
                                                                                                                                                                                                                                            26,7%
                                                                                                                                                                                                                    Ostrava
      ―    Focused mainly on Moravia-Silesia region, 3rd most densely populated
                                                                                                                                                  Moravia-Silesia region                                            45,6%
           region in CR, with over 1.2m inhabitants
                                                                                                                                                                                                                                  GAV
      ―    c. one-third is in Ostrava, 2nd largest urban area in CR, c.350km East
           of Prague                                                                                                                                                                                                             €1.3bn           Karviná core
                                                                                                                                                                                                                                                     9,7%
      ―    42,730 apartments and 1,687 commercial units                                                                          Opava 435
                                                                                                                                                    Orlova 2,050
                                                                                                                                                                                                                                                  Karviná non-core
                                                                                                                                                    Units
                                                                                                                                 Units                                            Karvina 7,168 Units                Other                              1,4%
      ―    Quality housing at attractive, reasonably priced rents                                                                                                                                                    5,3%
      ―    Occupancy rate of 91.9%                                                                                                                                                                                             Opava    Orlová    Frýdek-Místek
                                                                                                                                                                                                                               1,3%     3,5%          6,6%
                                                                                                                                            Ostrava
      ―    Right apartment size: 74% of apartments
Acquistion of Residomo
Operations Overview
Key data Comments
30-Sep-2019 30-Sep-2018
• Located in the Moravian-Silesian region which is the third most densely populated
GAV CZK 32,781m1 CZK 30,675m1
region in the Czech Republic
Number of residential units 42,730 43,268
Free units2 / post-regulated units 64% / 36% 61% / 39% • Quality housing at attractive, reasonably priced rents
Monthly rent (market/ post-regulated) CZK/sqm 92.9 / 84.8 87.4 / 80.7
Residential sqm 2.5m 2.6m • 8.14% vacancy, 4.60% structural vacancy6
Commercial sqm 0.1m 0.1m
Occupancy 91.9% 91.3% • Right apartment size: 74% of apartmentsAcquistion of Residomo
Residomo is fully focused on Czech Republic, which is among the strongest
performers in the EU offering a stable environment with healthy growth prospects
High GDP growth in relative terms… …Environment of low unemployment…
GDP growth by country in 3Q20191 Unemployment in EU in Sep-20192
16,9%
14,2%
4,8%
4,0%
3,8%
3,7%
3,6%
9,9%
3,2%
3,0%
8,4%
2,5%
6,7%
6,6%
6,6%
6,5%
6,3%
6,3%
2,0%
1,9%
1,9%
1,9%
5,6%
5,6%
1,8%
1,8%
1,7%
1,6%
1,5%
4,5%
4,1%
1,3%
1,3%
3,9%
3,9%
3,8%
3,5%
3,4%
3,3%
1,0%
3,1%
2,1%
0,5%
0,3%
Poland
Finland
Portugal
EU (28)
Hungary
Bulgaria
Lithuania
Romania
Cyprus
Greece*
Latvia
Slovakia
CR
UK
Germany
Belgium
Italy
Netherlands
Estonia*
Spain
Austria
France
Poland
Finland
UK**
Romania
Bulgaria
EU (28)
Lithuania
Portugal
Greece**
CR
Germany
Cyprus
Slovakia
Belgium
Latvia
Italy
Hungary*
Netherlands
Estonia*
Austria
France
Spain
…Combined with rising inflation… …And rising household disposable income
Inflation & interest rate (monthly average) Net household disposable income per person growth
Inflation 3M PROBOR
7,0% 6,0% Czech Republic (%) Moravia-Silesia (%)
6,0% 5,0%
5,0% 4,0%
4,0%
3,0%
3,0% 2.6% 2,0%
2,0% 2.1%
1,0%
1,0%
0,0%
0,0%
2000
2001
2002
2003
2004
2005
2006
2007
2008
2009
2010
2011
2012
2013
2014
2015
2016
2017
2018
2019
(1,0)%
2010
2011
2012
2013
2014
2015
2016
2017
Source: Eurostat, Czech Statistical Office, Czech National Bank
1 Percentage change compared with the same quarter of the previous year
2 Eurostat definition for unemployment (seasonally adjusted). * As of 31-Aug-2019, ** as of 31-Jul-2019 241 2 3 4 5 6 Long term value creation
Long term value creation

Value creation through turn key and development projects
                                                       Snapshot development portfolio in Denmark – completion 2020
                                                                                                                        Area tsqm
                                                 Number of               Number of                                                                                        Market value
  Country                                 Residential units        Commercial units                    Total             Residential             Commercial                      SEKm
  Denmark                                                556                          5                44,011                   42,329                     1,682                  1,584

                          Illustrative example turn key project                                                   Comments on Copenhagen

   Copenhagen
                                                                            •   The turn key project portfolio is located in growth areas and strong micro locations in the respective
                                                                                markets, micro location typically defined as area type A or B (source and definition of area type
                                                                                provided by Colliers International)
                                                                            •   In principle, all Danish forward projects are based on turn-key contracts, hence HSTB does not hold
                                                                                any construction risk. Payment of the fixed priced will be made to the developer upon completion
                                                                                and handover of each project
                                                                            •   HSTB is responsible for and holds the occupancy risk. The asset management team of HST
                                                                                initiates the letting process 6-9 months before the project is completed

                      Illustrative example development project                                                      Comments on Sweden

   Sweden
                                                                            •   Development projects in Sweden is foremost including in-fill projects on existing land owned by
                                                                                HSTB
                                                                            •   As part of the total property portfolio of HSTB the development portfolio is of limited size
                                                                            •   In addition to own projects HSTB has signed a framework agreement with Magnolia Bostad for a
                                                                                portfolio located in Stockholm, Sundsvall and Helsingborg to a value of SEK 8.8bn which will be
                                                                                developed over 5-10 years. The agreement includes an option for HSTB to refrain from single
                                                                                projects given a non-recurring compensation to Magnolia Bostad
                                                                            •   All projects in the Magnolia portfolio will be built to achieve Green Building Council's Silver standard
                                                                                or equivalent classifications

Source: Company information.

                                                                                                                                                                                       26
Long term value creation
Four geographies creates great possibilities to impact the
environment and local communities
Four geographies creates great possibilities to impact the environment
• With properties in four regions and an ambition to grow in a responsible and sustainable way, HSTB is able to make a great impact by
focusing on energy efficient properties
• All new production in Sweden is to meet the Sweden Green Building Council’s Silver standard
• During 2018, HSTB managed to reduce costs of SEK 6m in Sweden, by a reduction in carbon emissions of 670 ton CO2
• With a continuous focus of reducing energy usage in all regions HSTB will impact other countries in Europe and challenge companies in
other cities to do the same
Environmental objectives Social objectives
Sustainable and energy efficient properties Sustainable working environment leading to long lasting relations
Reduce the climate impact of HSTB Close to the customers through in-house property management
100% source-certified renewable power by 2021 Social lease contracts – 1% by 2023 (of total)
100% renewable or recycled* heat (*district heating) by 2030 At least 2 % of employees shall be in trainees
Investments in energy efficiency, solar cells etc. 100 young adult jobs a year (student jobs, summer jobs)
Using intelligent, modern and cost-efficient technologies Local community engagement
Strive to achieve high classifications (Green Building Council's Silver
standard or equivalent)
Sustainable material and technologies
Source: Company information.
271 2 3 4 5 6 Financial overview
Financial overview

HSTB income statement
                                                                             Pro-forma for 30 September 2019

 SEKm                                                                            Jan-Sep 19      The Netherlands    Acquisition adjustments   Jan-Sep 19 pro-forma
 Rental income                                                                        3,030                  681                                             3,711
 Property costs                                                                      (1,291)                (309)                                           (1,601)
 Net operating income                                                                 1,739                  372                                             2,111

 Central administration                                                                (127)                   0                                             (127)
 Other operating income                                                                  10                    0                                                10
 Other operating expenses                                                               (11)                   0                                               (11)
 Profit before financial items                                                        1,611                  372                                             1,982

 Financial income                                                                        10                    0                                                10

 Financial expenses - Interest bearing liabilities                                     (727)                (255)                                            (983)
 Financial expenses - Interest bearing subordinated
                                                                                          0                    0                                                 0
 shareholder loans
 Other financial income & expenses                                                     (155)                   0                                             (155)
 Income from property management                                                        738                  117                                               855

 Changes in value of investment properties                                            3,324                1,392                        267                  4,984
 Changes in value interest rate derivatives                                            (284)                (146)                         0                  (430)
 Profit before taxes                                                                  3,778                1,363                        267                  5,408

 Current tax                                                                           (136)                 (43)                         0                  (179)
 Deferred tax                                                                          (737)                (255)                      (55)                 (1,047)
 The result of the period                                                             2,904                1,065                        213                  4,182

 Other comprehensive income                                                           1,074                    0                          0                  1,074
 Overall Results                                                                      3,978                1,065                        213                  5,256

Source: Company information as of 3Q 2019 (pro-forma for the Netherlands).

                                                                                                                                                                 29
Financial overview
HSTB pro-forma earning capacity, 12 months
Data as of 30 September 2019
SEKm September 2019 Pro-forma for the Netherlands
Rental income 4,377 5,215
Property costs (1,781) (2,081)
Net operating income 2,595 3,134
Central administration (155) (175)
Other operating income 10 10
Other operating costs 0 0
Participations in profit of associated companies 0 0
Profit before financial items 2,450 2,969
Financial income 0 0
Financial costs – interest-bearing subordinated shareholder loan 0 0
Financial costs – interest-bearing liabilities (985) (1,190)
Profit from property management 1,465 1,779
Key data
Surplus ratio 59.3% 60.1%
Interest coverage ratio (ICR) 2.5x 2.5x1)
Source: Company information as of 3Q 2019 (pro-forma for the Netherlands). 1) Prior to planned installment of c. SEK 700m
30Financial overview
HSTB balance sheet
Pro-forma for 30 September 2019
Acquisition
SEKm As of Sep-19 The Netherlands New share issue Sep-19 Pro-forma1)
adjustments
Assets
Fixed assets
Investment property 89,629 17,650 267 107,546
Other long-term receivables 835 0 835
Total fixed assets 90,464 17,650 267 108,381
Current assets
Development properties 756 0 756
Other receivables 913 27 940
Cash and bank balances 2,381 297 6,229 (4,455) 4,452
Total current assets 4,050 323 6,229 (4,455) 6,147
Total assets 94,514 17,973 6,229 (4,188) 114,528
Equity and liabilities
Equity 38,776 7,332 9,500 (7,223) 48,385
Long-term liabilities
Long-term interest-bearing liabilities 50,641 10,141 (3,271) 3,271 61,437
Non-current liabilities, financial leasing 655 0 0
Interest rate derivatives 127 148 275
Deferred tax liability 2,096 291 (236) 2,151
Total long-term liabilities 53,519 10,579 (3,271) 3,035 63,862
Short-term liabilities
Short-term interest-bearing liabilities 685 0 685
Other short-term liabilities 1,534 62 1,596
Total short-term liabilities 2,219 62 2,281
Total equity and liabilities 94,514 17,973 6,229 (4,188) 114,528
Source: Company information as of 3Q 2019 (pro-forma for the Netherlands). 1) Prior to planned installment of c. SEK 700m
31Financial overview
… and responsible leverage management
Interest coverage ratio LTV1) Secured LTV2)
4,0x 60% 60%
3,5x At earnings
3,0x capacity: 2.5x 55%
40%
2,5x
2,0x 50%
1,5x
20%
1,0x 45%
0,5x
0,0x 40% 0%
Q4 2017
Q1 2018
Q2 2018
Q3 2018
Q4 2018
Q1 2019
Q2 2019
Q3 2019
Q3 2019PF
Q4 2017
Q1 2018
Q2 2018
Q3 2018
Q4 2018
Q1 2019
Q2 2019
Q3 2019
Q4 2016
Q4 2017
Q1 2018
Q2 2018
Q3 2018
Q4 2018
Q1 2019
Q2 2019
Q3 2019
Q3 2019PF
Financial miminum < 1.5x Net debt / Total assets (%) Secured LTV (%)
• The decrease in ICR ratio mainly due to higher • Due to the large number of acquisitions, LTV (Net • Secured LTV reduced to below 40% in Q4 2018
interest rate costs in the Norwegian portfolio, debt / Total assets) has fluctuated between 48%- as part of HSTB receiving an investment grade
acquired in 2017 and 2018 and due to the issue of 56% over the past years, with an average of 52% rating from S&P
investment grade bonds in HSTB with higher
financial costs than the average of the loan
• New financial policy states a maximum S&P • Going forward HSTB expects a Secured LTV of
defined LTV (Net debt / Capitalisation) of 55% 34-36%
portfolio
• Going forward an ICR of 2,3x-2,6x is expected
foremost due to recent and coming acquisitions in
markets where the ICR is higher than the average
of the portfolio
Source: Company information as of 3Q 2019 (pro-forma for the Netherlands). Note: Shareholder loans treated as equity in ratios. Ratios includes non-controlling interest
All numbers prior to planned installment of c. SEK 700m. 1) LTV calculated as Net debt / Total assets; 2) Secured LTV calculated as Secured Loans / Total assets
32Financial overview
HSTB has remained committed to a prudent financial policy
Description of policies Comments
Maximum /
Financial Guidelines minimum levels 30 September 2019 • HSTB remains committed to retain credit-metrics in line with
according to policy a strong investment grade rating, which is considered a key
Refinancing risk pillar of its long-term funding structure
Fixed credit term (months) >15 140 – S&P issued a revised credit rating of BBB- with a
positive outlook (November 2019)
Loan maturity in a single year (%) ≤40 21
Financial
– HSTB issued a public statement regarding its target to
Limitation, individual lenders (%) ≤40 14 policy achieve a BBB+ by summer 2021
• Throughout its expansion, HSTB has demonstrated an
Net debt / Capitalisation (%) 45-55 55.8
impressive deleveraging capability and shareholders
Interest rate risk continue to dedicate equity to support its growth
In accordance with • The financial policy is adjusted with a net debt / net debt +
Average fixed interest term (yrs) interest rate 2.4 equity ratio of 45-55% (25 October)
hedging strategy
• Dividends on common shares are evaluated on a regular
Hedging ratio (%) >75 57
basis and decided based on market conditions, investment
opportunities, and HSTB’s capital structure
Credit risk
Equity ratio (%) >30 40.9
Dividend – Dividends have historically been reinvested; since 2013,
policy shareholders have injected SEK 30.4bn into HSTB and
received SEK 1.8bn as dividends as of the 30 June 2019
ICR (times, R12 months) ≥1.5 2.1
• Minimum 1.25x liquidity buffer has been enshrined in
Quick ratio (times) ≥1.25 2.23 HSTB’s Shareholders’ Agreement
Source: Company information.
33Financial overview
HSTB debt structure summary
Loan maturity profile Key credit ratio development
Gross debt, 3Q 2019PF1) 3,7x
3,4x
3,1x
33% 2,6x 2,5x
2,1x
17% 19%
16%
54% 54% 55% 54% 52% 50%
8% 6%
2020 2021 2022 2023 2024 ≥2025 2015 2016 2017 2018 Q3 2019 Q3 2019PF
1)
LTV ICR
Unencumbered assets % Commentary
90,2% • After two sucessful bond issues, HSTB has established itself as a strong
invesment grade bond issuer
• HSTB is only working with banks which have financing of residential properties as
their core product and HSTB’s geographic markets as their home markets. This is
to assure a low counterparty risk
25,2% 22,9%
• HSTB’s loan portfolio is financed by strong Nordic and European institutions to
assure a low counterparty risk
0,6% 0,0%
Sweden Denmark Norway The Netherlands Total • Unutilised credit commitment SEK 9.0m
Source: Company information as of 3Q 2019 (pro-forma for the Netherlands). All numbers prior to planned installment of c. SEK 700m. 1) 3Q 2019 pro-forma calculation for ICR based on earnings capacity
34Appendix
Appendix

Staying true to our history – entrepreneurially driven company
with experienced leaders, management and board of directors
                                                                                                           HSTB - Board of Directors
                          2019                                2018                                 2008                                 2018                                  2019                                2019                                   2019

         Frans Heijbel                        Ramsay Brufer                    Magnus Nordholm                         Stefan Attefall                    Christer Franzén                        John Giverholt              Erik Glæsel Gullestad
       Chairman of the board                 Member of the board                  Acting CFO and                      Member of the board                   Member of the board                  Member of the board                Member of the board
                                                                                 Member of the Board
•   Head of International Real         •   Head of Corporate               •   Appointed deputy CEO as well    •   Active senior advisor and         •   CIO at Ericsson Pension Fund,     •   Member of the board of          •   Director and co-head of the
    Assets at Alecta where he              Governance at Alecta for over       as Board member of                  Board member of several               which has a broad investment          issuer’s main shareholder           Investment Team in
    previously held the role of Head       20 years                            Heimstaden AB                       companies in the Nordic               portfolio with a capital              Heimstaden AB since 2018            Fredensborg AS.
    of Investment, Real Estate
                                       •   Board member of several
                                                                           •   Has been the Deputy                 construction and residential          preservation approach and
                                                                                                                                                                                           •   Previously, CEO at Ferd,        •    Prior to his five years at
    Sweden                                                                     CEO/CFO of Heimstaden               property segment                      focus on cash generating
•   Prior to his seven years at            companies in the Swedish real       Bostad since the company                                                  investments
                                                                                                                                                                                               Deputy CFO at NorskHydro,           Fredensborg, he has
    Alecta, he held senior roles at        estate and infrastructure           was founded in 2013             •   Previously, Minister for                                                    Executive VP at DnB, and VP         experience from Arctic
    Trinova Real Estate LLP, Bank          sector where Alecta is          •   Previously Head of Nordic           Construction and Housing and      •   Has held his role for more than       at Orkla ASA amongst others         Securities and Arkwright.
    of Ireland REIM and JLL                shareholder                                                             a Civil minister of the Swedish       ten years
                                                                               Structured Real Estate
•   Responsible for Alecta’s                                                                                       government from 2010-2014
    international real estate and
                                                                               Finance at HSH Nordbank AG,
                                                                               Copenhagen branch
                                                                                                                                                     •   He is also a board member of
    infrastructure investments, with                                                                                                                     several other Real Estate
    a combined portfolio value of ca                                                                                                                     Companies with Nordic focus
    SEK 50bn in equity including
    HSTB

                                                                      HSTB - Management (via the HST Asset Management agreement)
                          2001                                2008                                 2019                                 2018                                  2019                                2017                                   2018

             Patrik Hall                   Magnus Nordholm                         Arve Regland                     Göran Bengtsson                      Christian Fladeland                   Suzanna Malmgren                    Helge Krogsböl
             Group CEO                            Deputy CEO                     Chief Financial Officer           Chief Asset Management                 Chief Investment Officer             Chief Human Resources               Chief Operating Officer

•   CEO since 2003                     •   Deputy CEO since 2020           •   Chief Financial Officer since   •   Chief Asset Management            •   Chief Investment Officer since    •   Chief Human Resources since     •   Chief Operating Officer since
•                                      •   See Board of Directors
                                                                               2019                                Officer since 2018                    2019                                  2017                                2018
    Previously Head of
    Negotiations at the Tenant
                                                                           •   Previously CEO at Entra ASA     •   Previously at Barings Real        •   Previously partner at Colliers    •   Previously partner at Alumni    •   Previously SVP at Pandox AB,
                                                                               and prior to that; ABG Sundal       Estate Advisors, Aberdeen             International Denmark                 Harvey Nash Nordic EE and           GM/RDO at Benelux, MP at
    Association and Lieutenant in                                              Collier, Arthur Andersen and
    the Swedish Army                                                                                               Asset Management and                                                        Manager at Impact Executives        Room2Room and VPO/CEO
                                                                               EY
                                                                                                                   Ericsson                                                                    Nordic                              at First Hotels

    Joined
Source: Company information.

                                                                                                                                                                                                                                                                 36
You can also read