Room air conditioners - Motilal Oswal
←
→
Page content transcription
If your browser does not render page correctly, please read the page content below
Sector Update
Consumer Durables| l17 April
The heat2018
is on
Room air conditioners
Please refer our previous report
dated on April 2017
CY18 to be another year of strong industry growth
Inverters’ share in industry volumes to rise to 50% by FY20
Another scorching summer is coming, India!: The Indian Meteorological
Division (IMD) has warned of above-normal temperatures in the CY18 summer
season (April to June) across most parts of the country. We, thus, expect
continued strong momentum in room air conditioner (AC) sales, which are
highly levered to the soaring temperature. Led by healthy demand, the room air
conditioner industry is likely to grow at 15% (in terms of volumes) in FY19/CY18,
in our view.
AC penetration to inch up from current low levels: Increasing disposable
income, cheap financing and lower running costs for ACs are expected to further
drive demand for air conditioners in India, in our view. We took a deep dive into
the room AC market in urban India and discovered that AC penetration remains
very low at 10%. There are 9.1m/24m households with washing
machines/refrigerators but no ACs. Thus, as more households install ACs going
forward, demand could reach 18-48m (which is equal to 3-8 years of annual
industry AC sales) and penetration levels could increase significantly from
current low levels of 10% in urban India.
Brand, distribution, service network and dealer margins are key
differentiators: Our discussion with channel partners/manufacturers indicates
that brand, distribution (~50–55% of AC sales now in tier 2/3 cities), service
network and dealer margins are the key success factors in the industry. In our
view, Voltas has been able to retain/grow its market share in India’s room AC
industry, primarily due to its strong competitive positioning across all the
aforementioned parameters.
Shift toward inverter ACs accelerates – estimated at 50% of industry by FY20
(30-35% in 4QFY18): We see three key factors driving the shift to inverter ACs:
(1) the narrowing price gap between fixed and inverter ACs, which now stands
at only INR3,000-4,000, 2) free installation (INR1,500/unit) and comprehensive
3-5 year warranty on inverter ACs and (3) rising electricity prices, which may
persuade consumers to look for energy-efficient inverter ACs. Our channel
checks indicate that the share of inverter ACs has already increased to >50% of
overall sales in the metros/tier 1 cities. Moreover, the new energy ratings
(effective from January 2018) would only accelerate this trend, as 4- and 5-star
rated ACs would operate only on inverter technology.
Valuation and risks: We prefer Blue Star (Neutral, TP: INR880, 35x FY20E UCP
segment EPS, which we value at INR720; INR160 for the remaining business)
over Voltas (Neutral, TP: INR660, 35x FY20E UCP segment EPS, which we value
at INR530; INR130 for the remaining business). While Voltas is the market leader
in the room AC segment, its share and margins are under threat from players
like Daikin, Blue Star, Lloyd Electric and Panasonic. Moreover, we see increasing
risks from: a) industry convergence to inverters, where Voltas has a relatively
weak share, b) margin pressure due to rising commodity prices and inability to
raise prices in inverters, and c) excise benefits going away from March 2018.
Ankur Sharma – Research Analyst (Ankur.VSharma@MotilalOswal.com); +91 22 3982 5449
Amit Shah – Research Analyst (Amit.Shah@MotilalOswal.com); +91 22 3029 5126
Investors are advised to refer through important disclosures made at the last page of the Research Report.
17 April 2018 1
Motilal Oswal research is available on www.motilaloswal.com/Institutional-Equities, Bloomberg, Thomson Reuters, Factset and S&P Capital.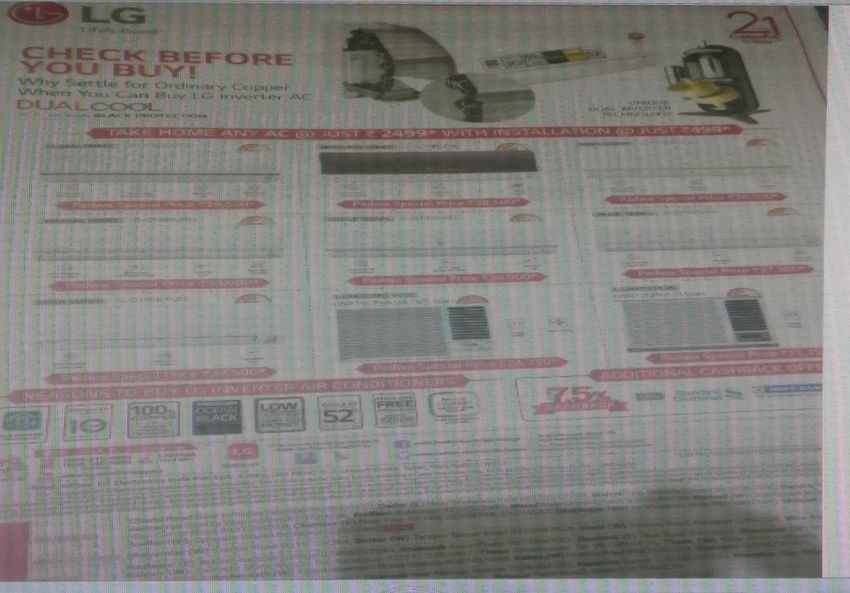
Consumer Durables l The heat is on

                                      Hotter summers, hotter demand
                                      Expect 15% room AC industry CAGR over FY18-20

                                      IMD expects above-normal temperature this summer
                                      According to the IMD forecast, most parts of India are expected to witness warmer-
                                      than-normal temperatures in the April-June summer season. Moreover, heat wave
                                      conditions are likely to prevail in the states of Punjab, Himachal Pradesh,
                                      Uttarakhand, Delhi, Rajasthan, Haryana, UP, Gujarat, MP, Bihar, Telengana, Orissa,
                                      AP and Maharashtra. However, providing to relief, the IMD mentioned that east,
                                      east central and south India may witness slightly below maximum temperatures.
                                       Exhibit 1: Mean temperature anomaly during April-June 2018

                                                                                                                Source: Industry, MOSL

                                      The soaring temperatures are likely to drive demand for air conditioners in CY18. A
                                      low base of the previous year (demonetization impact) may also provide support.
                                      We expect India’s room AC industry to grow at a 15% CAGR over FY18-20.
 Exhibit 2: Room AC volumes (FY05–20E) and growth (% YoY)
                                                   Room Aircon Volume (m)           YoY (%)
                                                     31%                                             30%
                              22%           25%                                      23%
                20%    20%
     15%                                                                                                             15%     15%
                                                                                              12%            12%
                                     7%
                                                                             3%
                                                                      -5%
                                                              -14%
     1.1        1.3    1.5    1.9    2.0    2.5      3.3              2.7    2.8      3.5     4.0    5.2     5.8      6.7     7.7
                                                                2.9
    FY05        FY06   FY07   FY08   FY09   FY10     FY11   FY12      FY13   FY14    FY15     FY16   FY17   FY18     FY19    FY20

                                                                                                                Source: MOSL, Industry

17 April 2018                                                                                                                       2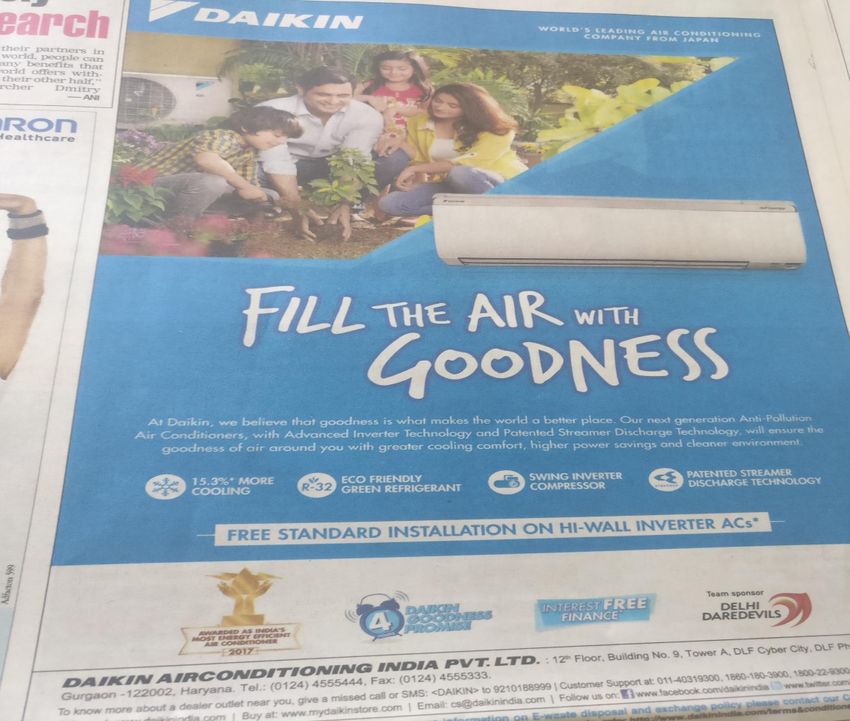
Consumer Durables l The heat is on
Room AC penetration at only 3-4% pan India…
…but cheap financing, rising affordability and lower running cost may push
up demand
From 5.2m units in FY18, India’s AC sales are expected to increase to 7.7m units by
FY20, implying a 15% CAGR. We have listed below some of the key factors that could
contribute toward this growth.
India significantly lags other countries in terms of AC penetration levels. Thus,
progress on this front could drive sales significantly.
Given the improving macroeconomic conditions, ACs are now considered as a
necessary rather than a luxury item, with many houses even installing multiple
ACs.
An air conditioner was previously considered as a seasonal product (used mostly
during summer months). However, manufacturers have now started offering
heating/cooling options so that it can be used throughout the year.
Manufacturers have come up with an increasing range of energy-efficient ACs.
This addresses the Indian consumers’ concerns about high electricity bills.
Exhibit 3: India remains under penetrated vis-à-vis other countries
Country Penetration (%)
Taiwan 90%
US 87%
Korea 70%
China 100%**
Thailand 30%
Indonesia 8%
India 3-4%
Source: Industry, MOSL. ** for urban areas only
Exhibit 4: Consumer durables penetration across categories
Description Penetration (%)
Fans 80%
Water Heaters 10%
Mixer - Grinder 35%
TV 60%
Fridge 20%
Air Cooler 17%
Microwave 5%
Washing machine 10%
Air Conditioner 6-7%
Source: Industry
We take the example of the US to highlight penetration growth of ACs within
households. As seen in the chart below, AC penetration started to pick up from
1950s – it then jumped to 15% in 1960 and to 50% by 1975. In contrast, penetration
in China grew from 8% in 1995 to 70% in 2011 and to 100% in 2017, implying that
penetration rates are increasing much faster than earlier years. We highlight that
India’s PPP per capita GDP at USD6,000 is similar to that of the US in 1960s.
17 April 2018 3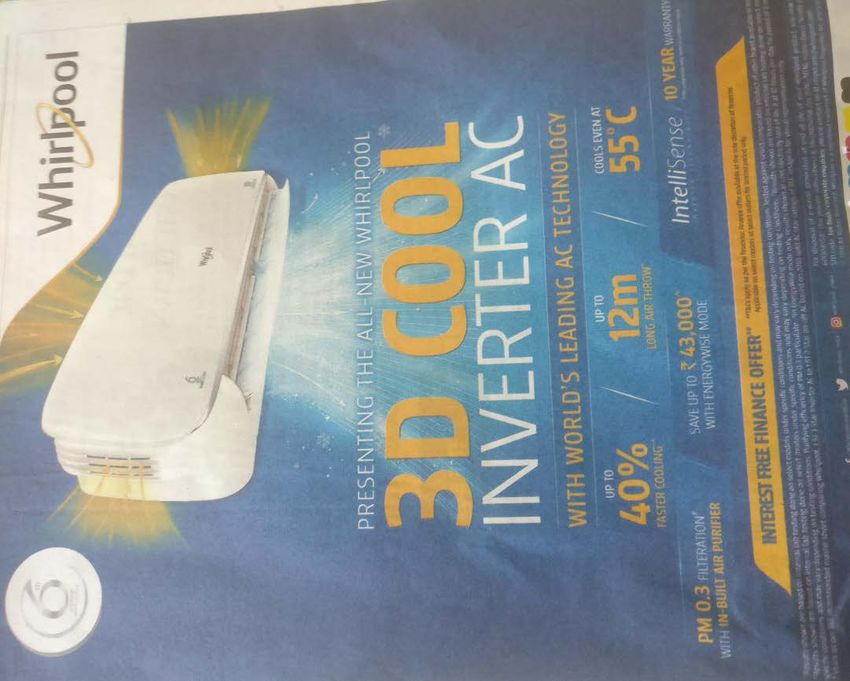
Consumer Durables l The heat is on
Exhibit 5: US – penetration of consumer durables 1900-2005
Source:
Exhibit 6: China – growth in penetration of washing machines, AC and fridge (2008-17)
W. Machines(%) AC(%) Fridge(%)
110
95
80
65
50
2008 2009 2010 2011 2012 2013 2014 2015 2016 2017
Source: MOSL, Industry
According to the Indian Weather Data Handbook, 2014, around 65% of the total
numbers of hours in a year have a temperature above 24 degrees (based on the
weather profile of 54 major cities in India). This, supported by rising income levels,
has been the key driver of increasing demand for ACs. In our view, ACs could be one
of the largest discretionary budget items in India over the next few years.
Deep dive into Indian household AC penetration
We took a deep dive into AC penetration levels in India for urban households (using
the state-wise date available from SEC, 2011) to ascertain the number of potential
households that could upgrade from only owning only refrigerators/washing
machines to also owning ACs in the future. We followed the following steps in our
analysis.
We extracted the list of urban households currently owning an air conditioner.
We discovered that only 6.3m out of the total of 65.1m households in India (as
of 2011) own an AC.
We extracted the number of households that have refrigerators but do not have
an AC. Similarly, we extracted the number of households that own washing
17 April 2018 4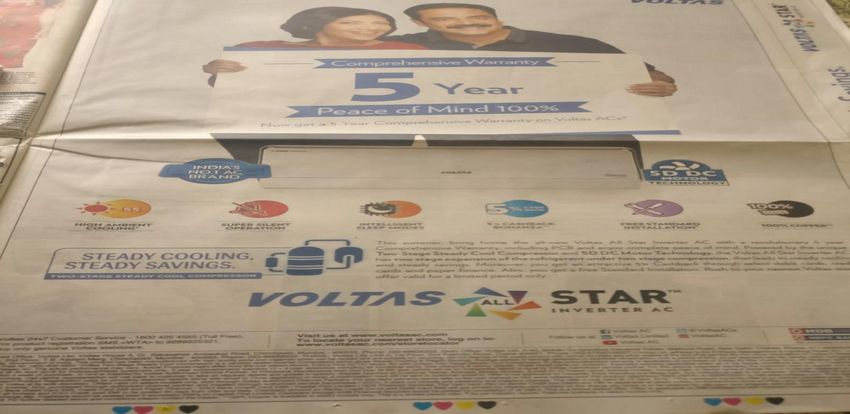
Consumer Durables l The heat is on
machines but do not own an AC. Our thesis here is that households owning at
least a refrigerator or a washing machine are highly likely to also own an AC in
the future.
Our analysis shows that there are 9.1-24m households that would look to
upgrade to buying an AC after having already bought a washing machine or a
refrigerator.
Lastly, we assume at least two ACs are bought by each household – providing
sales opportunity of 18.3-48m ACs or visibility of 3-8 years of sales – purely on
existing households upgrading to buying an AC.
Exhibit 7: Urban households owning a refrigerator and a washing machine but not an AC
No of No of Household Urban Household
Total % % not
State Household Household Region with Ref. with WM
Household with AC having AC
having AC not having AC but not AC but not AC
All India 65,133,952 6,285,809 9.7% 58,745,005 90.2% 37% 14%
ANDHRA PRADESH 2,925,984 198,465 6.8% 2,726,243 93.2% South 815,494 292,180
BIHAR 2,245,176 89,818 4.0% 2,152,488 95.9% East 310,302 88,765
CHHATTISGARH 1,173,799 57,248 4.9% 1,108,964 94.5% Central 339,304 138,959
GOA 82,219 15,556 18.9% 66,563 81.0% West 49,523 24,095
GUJARAT 4,708,936 492,853 10.5% 4,214,942 89.5% West 1,937,466 231,176
HARYANA 1,661,450 278,626 16.8% 1,378,650 83.0% North 834,884 531,029
JHARKHAND 997,697 82,960 8.3% 913,530 91.6% East 279,015 94,458
KARNATAKA 5,090,399 216,924 4.3% 4,869,054 95.7% South 1,878,083 1,012,923
KERALA 1,379,341 137,755 10.0% 1,241,492 90.0% Central 738,733 293,949
MADHYA PRADESH 3,434,918 126,618 3.7% 3,255,976 94.8% Central 1,123,599 443,520
MAHARASHTRA 9,120,640 913,692 10.0% 8,201,936 89.9% West 4,190,632 1,242,214
ODISHA 1,264,486 107,772 8.5% 1,152,209 91.1% East 359,656 113,395
PUNJAB 1,762,732 332,975 18.9% 1,429,757 81.1% West 1,092,121 508,689
RAJASTHAN 2,913,518 176,953 6.1% 2,735,892 93.9% West 1,175,555 432,610
TAMILNADU 7,433,837 1,071,868 14.4% 6,349,067 85.4% South 1,907,687 763,845
TELANGANA 2,600,702 204,833 7.9% 2,395,232 92.1% South 1,168,121 540,448
UTTAR PRADESH 6,460,192 528,282 8.2% 5,928,631 91.8% North 2,921,800 1,449,266
WEST BENGAL 4,610,394 338,753 7.4% 4,271,217 92.6% East 1,567,354 139,604
CHANDIGARH 198,576 53,482 26.9% 145,094 73.1% West 88,556 44,004
DELHI 2,340,216 688,888 29.4% 1,651,214 70.6% North 1,164,246 757,518
Potential for AC purchase 23,942,131 9,142,647
AC demand @2 AC's/house 47,884,262 18,285,294
No. of years of sales 8.0 3.0
Source: India Census 2011, MOSL
17 April 2018 5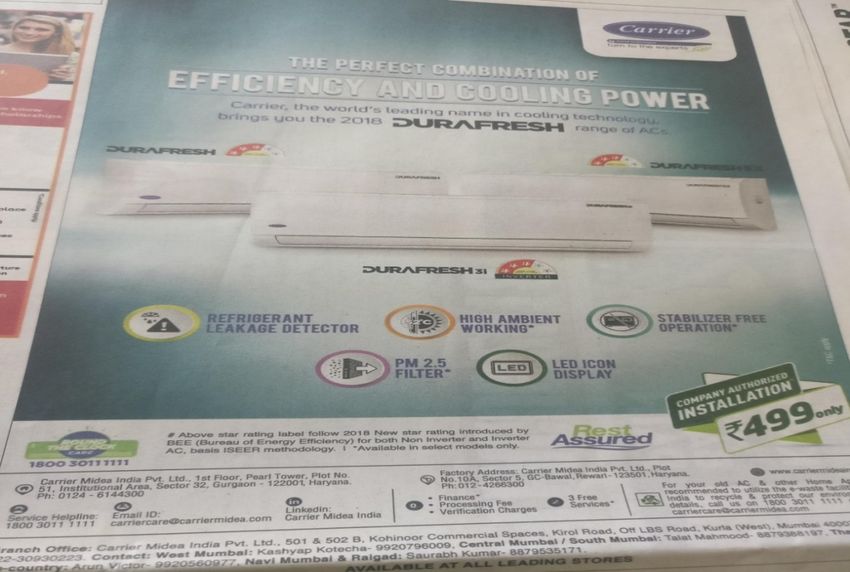
Consumer Durables l The heat is on

                Competition to remain heated among AC players
                Brand, distribution, service network, dealer margins are key success factors

                Competitive intensity in the room AC industry remains high, with more than 40
                brands competing for market shares. We, thus, believe that brand, distribution,
                service center network and dealer margins are key to grab or even retain market
                shares. Based on various media articles, company interactions and reports, we have
                derived market shares of players in the room AC segment. According to GfK
                Nielsen’s multi-brand outlet survey, Voltas ranked first with a share of ~23% as of
                3QFY18, but this does not include sales by exclusive brand outlets of MNC players.

                Exhibit 8: Break-up of room AC market share (by volumes sold)

                                                                                          Daikin India
                                                      5%   11%
                                                 6%                                       Lloyd Electric
                                        7%                                                Blue Star
                                                                 11%
                                                                                          Voltas
                                     11%                                                  LG
                                                                  12%                     Hitachi
                                                                                          Samsung
                                           16%
                                                                                          Carrier Midea
                                                           21%
                                                                                          Others

                                                                        Source: Industry, MOSL, Channel checks,

                Exhibit 9: Brand hierarchy in the Indian room AC market

                                 •   O General
                                 •   Mitsubishi Electric
                                 •   Toshiba
                  Premium        •   Hitachi

                                 •   Voltas
                                 •   Blue Star
                                 •   LG
                                 •   Daikin
                                 •   Whirlpool
                   Popular       •   Panasonic
                                 •   Lloyd Electric

                                 • Videocon
                                 • Electrolux
                  Economy        • GREE

                                                                        Source: Dealer feedback, Industry, MOSL

17 April 2018                                                                                                6
Consumer Durables l The heat is on

                We delve into each of these aforementioned key success factors in more detail:

                Branding/advertisement spend: Brand name and trust are key differentiators in the
                AC industry. For example, Voltas, through its highly successful ‘Murthy campaign’
                (launched in 2012), has strengthened its relationship with the Indian customers over
                past four years. The advertisement was also used to highlight the company’s ‘all-
                weather air conditioners’ with both heating and cooling functionalities. In CY17,
                Voltas has bought back ‘Mr Murthy’ in its new TVCs with a focus on its ‘All Star’
                inverter range of ACs. Blue Star has also used the ‘Nobody cools better’, ‘Get office
                like cooling at home’ and ‘Daddy Cool’ advertising campaigns to build a strong
                connect with the Indian customers. Companies typically spend 1-7% of their sales on
                advertising.

                Exhibit 10: Advertising spends as % of UCP segment sales
                Name of company                     % of FY17UCP sales               % of FY16 UCP sales
                Hitachi                                          4.8%                              5.2%
                Blue Star                                        5.5%                               4.0%
                Voltas                                           2.1%                               2.0%
                Whirlpool                                        1.3%                               1.7%
                Lloyd Electric                                   4.0%                               2.7%
                Daikin                                           3.5%                               3.0%
                                                                                    Source: Company, Industry

                Dealer margins: Voltas, LG and Lloyd Electric are very dealer-oriented and provide
                high margins, while Samsung and Blue Star are not equally so. Voltas provides 35%
                margins to some of the bigger dealers and 28% to smaller dealers, while LG offers
                28-30%. Blue Star, a relatively newcomer to the industry having entered the retail
                market only in CY11, provides lesser margins of 25-26%. O General and Mitsubishi
                Electric offer the lowest margins of 18-20%.

                Exhibit 11: Dealer margins offered by various AC manufacturers
                Name of company                                                   Margin offered
                Voltas                                                              +++++++
                LG / Lloyd Electric                                                  ++++++
                Blue Star/Samsung                                                    +++++
                Daikin/Hitachi                                                        ++++
                Mitsubishi                                                             +++
                O General                                                              +++
                                                       Source: Industry, MOSL, **higher denotes better margins

                Distribution: In our view, distribution/sales reach is the key differentiator in the
                Indian AC market. This has become all the more important, as ~50-55% of overall
                industry volumes are outside metros/tier-1 cities. In our view, Voltas has been able
                to command a leadership position mainly because it has managed to increase its
                pan-India touch points to more than 14,500, from 6,500 in FY14.

17 April 2018                                                                                               7
Consumer Durables l The heat is on

                Exhibit 12: Dealer touch points across the industry
                Company Name                                                No of touch points
                Voltas                                                                ~14,500
                Blue Star                                                                4,500
                Daikin                                                                   5,000
                Intex                                                                  10,000
                Hitachi                                                                  8,500
                Lloyd Electric                                                         >10000
                Whirlpool                                                              35,000
                Micromax                                                                 4,000
                Carrier Midea                                                            3,200
                                                                                     Source: Company, Industry

                Service network: LG has >1,000 service centers, much more than competitors.
                However, this is because LG is a multi-product company. Pure AC manufacturers like
                Voltas, Hitachi, Daikin and Blue Star have service centers in the range of 300-400
                across the country.

                Exhibit 13: Service centers by company (nos.)
                Name of company                                                         No. of centers
                Voltas                                                                     300-350**
                Blue Star                                                                          400
                Hitachi Home and Life                                                              400
                Daikin                                                                            +300
                LG                                                                              >1,000
                Carrier                                                                            175
                Lloyds Electric                                                                    485
                Micromax                                                                           400
                Panasonic                                                                           100
                                                            Source: Company, MOSL, ** Only for air conditioners

                R&D spending: Most AC manufacturers in India follow the ‘outsource and assembly’
                model, with low spending on R&D. Compressors are mostly sourced from
                China/Thailand and condensers from local vendors, with the complete AC being
                assembled at the AC manufacturer’s factory. Typical, R&D spends are in the range of
                0.2%-3% of sales.

                Exhibit 14: R&D spending by company (INR m)
                Name of company                                       FY17 (INR m)               % of total
                Voltas                                                          45                    0.1%
                Blue Star                                                      537                    2.7%
                Hitachi Home and Life                                          114                    0.6%
                Whirlpool                                                      349                    0.8%
                Daikin                                                          NA                      3%
                Symphony                                                        33                    0.5%
                                                                                       Source: Company. MOSL

17 April 2018                                                                                                 8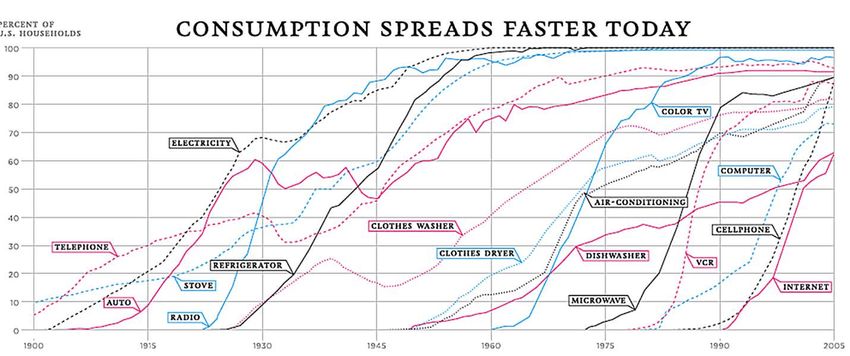
Consumer Durables l The heat is on
Shift toward inverter ACs accelerates
Inverter ACs to account for 50% of industry in FY20 (30-35% in 4QFY18)
The room AC industry has been shifting toward energy-efficient models (i.e. 5-
star/inverter ACs) over the past few years, as customers are increasingly becoming
aware of lifetime costs of ACs vis-à-vis upfront costs. In our view, there are three key
factors driving the shift toward inverter ACs:
Narrowing price gap between fixed and inverter ACs, which now stands at only
INR3,000-4,000
Free installation (INR1,500/unit) and comprehensive 3-5 year warranty offered
on inverter ACs (which usually costs INR3,000-3,500/unit annually)
Rising electricity prices, which may persuade consumers to look for energy-
efficient inverter ACs
Our channel checks indicate that the share of inverter ACs has already increased to
>50% of overall sales in metros/tier-1 cities. The new energy ratings (effective from
January 2018) would only accelerate this trend, as 4- and 5-star rated ACs would
operate only on inverter technology. This apart, the split AC market is expected to
transition to inverter technology over the next few years. Consequently, the share
of inverter ACs is expected to increase from 30-35% of the overall market in 4QFY18
to 50% by 2020.
Exhibit 15: Break-up of ACs by star ratings (FY17) Exhibit 16: Breakup of AC sales by star ratings (FY18)
5%
6%
22% 5 Star fixed
Inverter
35%
Inverter 3 star fixed
3 Star fixed 1/2 Star fixed
12%
1/2 Star fixed
60% 60%
Source: Industry, MOSL Source: MOSL estimates
Exhibit 17: Inverter sales for key AC manufacturers v/s industry
Description % of total sales
Industry 30-35%
LG 100%
Daikin >50%
Blue Star 25-30%
Hitachi 40-50%
Lloyd Electric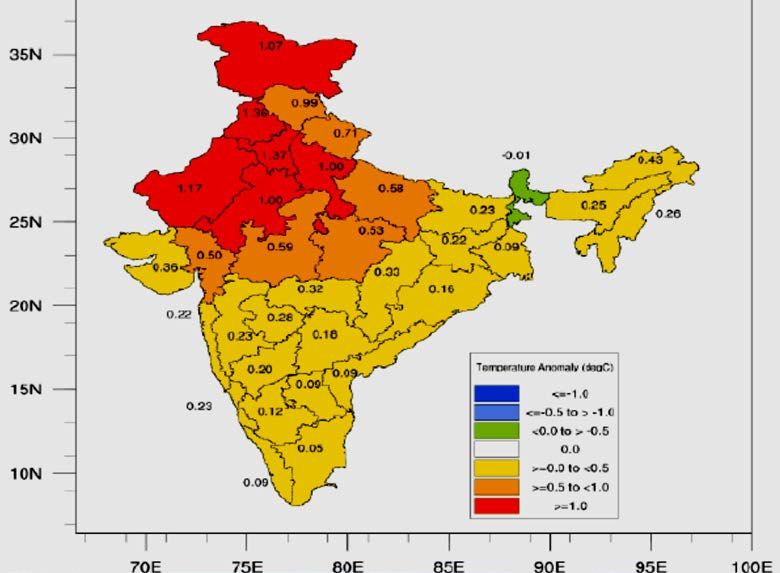
Consumer Durables l The heat is on
Exhibit 18: India room ACs – split ACs continue to gain share
Window(%) Split(%)
42% 50% 55% 61% 67% 71% 75% 78% 82% 84% 84% 85% 85%
58% 50% 45% 39% 33% 29% 25% 22% 18% 16% 16% 15% 15%
FY06 FY07 FY08 FY09 FY10 FY11 FY12 FY13 FY14 FY15 FY16 FY17 FY18
st
Exhibit 19: Star rating for window ACs (valid from 1 January 2016-31 December, 2017)
Description Energy Efficiency Ratios (Watt)
Star Level Minimum Maximum
1 Star * 2.5 2.69
2 Star ** 2.7 2.89
3 Star ** 2.9 3.09
4 Star **** 3.1 3.29
5 Star ***** 3.3
Source: BEE; one-star rated ACs cannot be sold from January 1, 2016
Exhibit 20: Star rating for split ACs (from 1 January 2016)
Description Energy Efficiency Ratios (Watt)
Star Level Minimum Maximum
1 Star * 2.7 2.89
2 Star ** 2.9 3.09
3 Star ** 3.1 3.29
4 Star **** 3.3 3.49
5 Star ***** 3.5
Source: BEE; one-star rated ACs cannot be sold from January 1, 2016
st
Exhibit 21: Indian Seasonal Energy Efficiency ratio(ISEER) from 1 Jan’18 - Inverter and Split ACs ratings merged
Description Energy Efficiency Ratios (Watt)
Star Level Minimum Maximum
1 Star * 3.1 3.29
2 Star ** 3.3 3.49
3 Star ** 3.5 3.99
4 Star **** 4.0 4.49
5 Star ***** 4.5
Source: BEE; one-star rated ACs cannot be sold from January 1, 2016
Competitive landscape in inverter ACs
In the inverter AC segment, Japanese players like Daikin, Mitsubishi Electric and
Hitachi had an edge over Indian peers as they were the early movers to
introduce inverter models in the Indian market and had access to technology
from their parent companies. LG was the first player to completely switch to
inverters in January 2017 (a year before the new energy ratings came into force)
with an aggressive pricing strategy (1.5-ton, 3-star inverter AC priced at INR36,
000-37,000 versus peers at >INR40,000) and a strong marketing drive.
Consequently, it has claimed a market leadership position, with ~50% share in
the inverter AC segment.
17 April 2018 10Consumer Durables l The heat is on
Exhibit 22: Room AC prices across brands under new 2018 energy efficiency ratings
1ton inverter 1.5ton inverter 1ton fixed 1.5ton fixed
Name of company
3 star 3 star 3 star 3 star
Voltas 31,000 35,000 26,000 32,000
Daikin 33,000 38,000 31,000 35,000
LG 33,000 37,000 - -
Blue Star 35,000 45,000 32,000 36,000
Source: Industry, MOSL
Our recent channel checks indicate that Voltas and Daikin have also become
very aggressive in inverter ACs. Voltas has now come up with the cheapest
product in the market, with its 1-ton, 3-star inverter AC priced at INR31,000 and
1.5-ton, 3-star inverter AC priced at INR35,000. Daikin, too, has cut prices – its
products are now priced in line/marginally higher than Voltas and LG. Blue Star,
on the other hand, has maintained a premium to Voltas/LG/Daikin, with its
products priced around 5-10% higher across the fixed and inverter AC
categories.
In our view, inverter ACs should do well in metros and large cities/towns, where
power is relatively reliable – our channel checks indicate that inverter AC sales
have already crossed 50% of overall AC sales in metros/tier-1 cities. The investor
AC segment is not expected to do that well in smaller cities/towns, as power
fluctuations can affect inverter/PCB chips, which cost INR3,000-3,500/unit.
17 April 2018 11Consumer Durables l The heat is on
Summer season strategy of key aircon manufacturers
Inverters to be a key focus category across brands
In FY19/CY18, competition is likely to intensify among AC manufacturers. Based on
media articles/channel checks/company feedback, we highlight the key strategies
adopted by various players with the onset of the summer season.
Blue Star – impressive line-up of AC models; targets market share of 12.5%
Blue Star has a line-up of 100 models, 40 of which are equipped with the latest
inverter technologies. The stellar array ranges from 0.75 TR to 4.5 TR across 2-
star and 3-star split ACs, as well as 3-star and 5-star inverter split ACs.
Three models of the 5-star inverter split AC range have a smart Wi-Fi feature,
enabling the user to operate the machine remotely.
As far as distribution is concerned, in 2019, Blue Star’s room air conditioners will
be available at 4,500 outlets in 550 locations across the country, exclusive as
well as multi-brand sales outlets, service dealers, retail showrooms and modern
trade. Blue Star has 150 exclusive product stores in the country, and plans to
increase it to 200 stores by end-FY19.
The company plans to invest ~INR0.6b in the forthcoming summer season, as
against INR0.5b in FY18. Marketing would be done via a set of TV commercials,
as well as ads in mainline dailies, cinema halls and hoardings.
Blue Star expects to outperform the market and achieve a market share of
12.5% in FY19.
Voltas – aggressively targeting the inverter segment
The company has continued with its ‘All Star Inverter’ AC range in 2018 based
on the unique ‘two stage steady cool’ compressor, which operates on a two-
stage inverter technology, providing power saving across weather conditions.
This cutting-edge technology leads to significant power savings vis-à-vis an
ordinary compressor. In addition, All Star ACs are environment-friendly and
efficient, with super-silent operations (noise levels as low as 18 decibels), high
ambient cooling (efficient in temperatures as high as 54 degree celsius) and an
advanced air purifier. The company is offering this unique range with a five-year
warranty.
Voltas has also continued with its range of advanced ‘All Weather Smart ACs’ by
integrating three smart features: 1) Smart Access: Wi-Fi enabled ACs can be
operated from anywhere and anytime through a smartphone using local Wi-Fi
or GPRS connection. 2) Smart Sense: The AC senses outside weather conditions
and adapts to the changing environment without any manual intervention. 3)
Smart Analytics: It keeps a tab on energy usage and consumption trends. In
addition, the company has revamped its Smart AC mobile app.
The company has launched India’s first window air conditioner that operates on
the DC inverter technology. It works on a unique steady cool inverter
compressor, which is a variable speed compressor, providing steady cooling and
steady savings.
17 April 2018 12Consumer Durables l The heat is on
LG India – aiming for sales growth of 50% to 1.2m inverter units in CY18
LG has several new product launches lined up for CY18, including 59 new
inverter AC split models (which are 100% ISEER-compliant) and the first window
inverter AC.
The target is to sell 1.2m inverter ACs (+50% YoY), forming 53% share in overall
industry inverter sales of 3.1m units.
Because of LG’s pioneering role, the inverter AC segment’s share in the overall
AC market has grown remarkably from 12% to 31%. Moreover, LG’s inverter AC
market share has increased from 19% to 53%.
Daikin India – target to expand reach and market share; doubled capacity at
Neemrana to 1.2m units
Daikin ACs run on a unique inverter technology, which improves efficiency and
also adjusts the compressor speed based on the ambient weather, making it
more powerful yet energy efficient.
The company’s plant in Neemrana was originally set up at a cost of INR11b and
produces 0.5m ACs, 6,000 ductable and 18,000 chiller units. With the second
facility operational, it has manufacturing capacity of 1.2m units per year.
Daikin India has aggressive plans to expand its national dealership network to
5,000 and develop 100 additional Daikin exclusive solution plazas.
Daikin India is planning to introduce window ACs in selected markets, especially
in tier-III and tier-IV cities.
In 2016, Daikin had launched its marketing campaign under the tag “Fill the air
with goodness”. The campaign reiterates the company’s commitment to provide
state-of-the-art technology, which offers comfort, savings and is environment
friendly. It continued with this campaign in CY17 as well.
Panasonic – aiming for 20% growth to INR15b in FY19
Panasonic is eyeing business of around INR15b (+20% YoY), riding on its new
range of air purifying ACs.
The company’s range of air purifying inverter ACs (inbuilt with a patented air
purification system called Nanoe Technology that actively removes PM2.5 and
airborne particles) gives up to 99% clean air.
It also comes with Aerowings, which, according to the company, provides more
control over the direction of the airflow across a wider area and ensures flow of
cool/purified air evenly in every corner of the room.
The new air purifying inverter ACs are available from a starting price of
INR39,000-72,000 and in 0.8T, 1.0T, 1.5T, 2.0T variants.
Samsung – launches wind-free ACs in CY18
The company has launched two new models for the coming summer season: 1)
AC with wind free technology – this has 21,000 micro holes to spread the flow of
air. 2) Digital inverter with 8 pole motor for lower power consumption, noise
and higher efficiency.
The wind free range of ACs would be available in the price range of INR50,950 to
INR74,260. The AC promises a comfortable cooling experience without the
discomfort of direct airflow and also reduces energy consumption by up to 72%.
17 April 2018 13Consumer Durables l The heat is on
Exhibit 23: Key marketing campaigns being run by AC manufacturers for the CY18 summer season
Name of company USP Key features offered
Voltas ‘All Star Inverter' AC Voltas has launched India's first window AC with inverter technology in CY18. The
Window Inverter AC company has continued with its ‘All Star Inverter’ AC campaign launched in 2016, but has
got back Mr Murthy in its TVC. It focuses on the AC’s significant power savings,
environment friendly, super silent operations, advanced air purifier and ambient cooling
at high temperature. Its ‘All Weather Smart ACs’ can be operated by a phone using
Wifi/GPRS; these ACs sense outside temperature and adapt to the weather.
LG Ocean Black Within split ACs, LG has completely switched to inverters, which are 100% copper with
Protection Ocean Black Protection that prevents coil rusting/corrosion and gas leakage, thereby
Window Inverter AC resulting in durability and longevity. First-of-its-kind to offer WiFi technology, making it
an appliance suited to today’s fast-paced and connected life, stabilizer free operations,
10-year warranty on the compressor, including gas charging and cools up to 52 degrees
Celsius. LG's ACs also offer "Mosquito Away" technology to drive away mosquitoes,
"Himalaya Cool" technology for faster cooling, "Monsoon Comfort" for controlling
humidity and "Hot & Cold" AC for all-weather usage. Window inverter ACs launched in
3/5 star in 1/1/.5 ton capacity.
Hitachi ‘iCare’ ACs with Hitachi's inverter ACs offer iClean Plus technology, which automatically cleans the dust in
‘iClean’, ‘iSense’ and the air filter; iSense which regulates the temperature as per the person's active body
‘iSee’ technology movements; iSee which detects faces of people and directs air flow to everyone; Wi-fi
technology to control AC from anywhere; R410 green refrigerant which is eco-friendly.
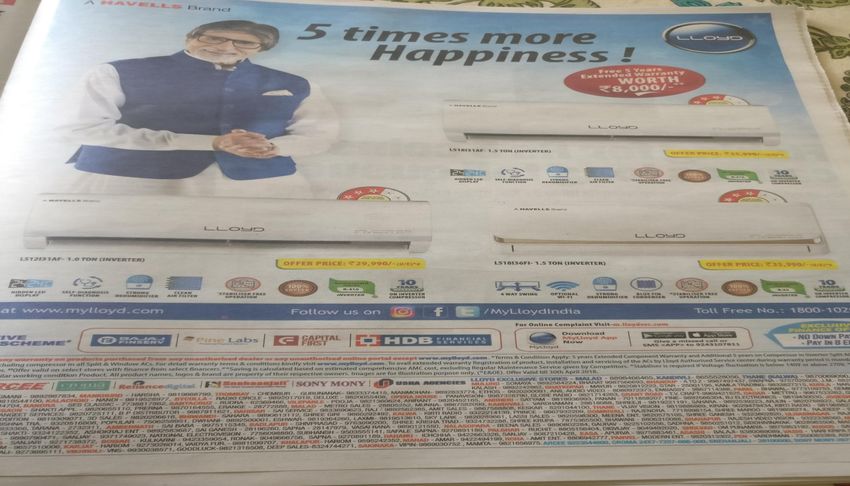
Lloyd ‘Bring home Lloyd, Lloyd has launched Wifi-enabled ACs with 10-year warranty on compressors and 5-year
Switch on happiness’ warranty on condensers. This enables the user to control the AC through the use of a
smartphone. Wifi feature is available across inverter, 5-star and 3-star range of ACs. It has
continued with Mr Amitabh Bachhan as the brand ambassador for its CY18 marketing
campaign.
Panasonic Quality air for Life Its air-conditioner comes with 'Aerowings' that give more control over the direction of
Nanoe G Technology the airflow across a wider area and ensures flow of cool and purified air evenly in every
corner of the room. After reaching a set temperature, the Aerowings twin blades direct
the air towards the ceiling to create a `shower cooling effect’. The ACs use nano-sized
electrostatic atomized water particles to deodorize inhibit bacteria and virus growth and
remove dust and particulate matter in the room even when the cooling function of the
AC is turned off.
Daikin ‘Fill the air with Daikin has launched ACs with air purifiers which run on ‘Streamer Technology” – these air
Goodness’ purifiers helps eliminate bacteria, airborne particles and unpleasant odors. ACs offer 64%
more power savings (Good for Savings), 15.3% more comfort (Good for Comfort), 75%
less CO2 emission (Good for Environment) and Swing Inverter Technology (Good for
living). Its ACs also have dehumidifiers, intelligent eye (adjusts cooling to human
presence), smartphone connectivity for ACs, stabilizer-free operation and all-season ACs
for heating/cooling. Daikin has also entered the window aircon space targeting the
Tier3/4 cities.
Blue Star ‘Nobody cools FY19 market growth estimated at 15-20% with Blue Star growing at 30-40% in the
better’ upcoming summer season. Blue Star now introduced innovative models which deliver
30% extra cooling power, faster temperature pull-down and extra energy savings apart
from precise temperature setting in steps of 0.1°C and 0.5°C. Has 100 models with 40 in
inverter range and 17 in 5 star inverter range
Whirlpool ‘Sixth Sense The AC has an in-built air purifier that comes with a PM 0.3 filtration to improve indoor
IntelliComfort’ air quality. The 3D Purafresh technology can remove pollutants present at home. The 3D
‘3D Purafresh’ Cool Inverter AC range comes with a 5-star rating and is also energy efficient. It comes
with 6th Sense IntelliComfort Technology that bears advance humidity sensing
mechanism that takes into consideration high humidity levels in coastal regions of India
and reduces humidity 40% faster.
Samsung Wind free Launched two new models for the CY18 season with a) AC with wind free technology -
technology this has 21,000 micro holes to spread the flow of air, b) Digital inverter with 8 pole motor
Digital Inverter ACs for lower power consumption, noise and higher efficiency. Samsung's digital inverter
compressor offer power savings, stabilizer free operation, virus doctor and easy filter to
eliminate dust, Multi Jet Plus technology for better cooling efficiency, tropicalized
compressor for cooling till 52 degrees, turbo cooling, good sleep for regulating
temperature throughout the night, full HD filter and dry cool for comfort even in
humidity.
Source: Industry, MOSL
17 April 2018 14Consumer Durables l The heat is on
Marketing campaigns – focused on inverters
Aggressive marketing campaigns to gain market share
Exhibit 24: Voltas – betting on its “All Star” inverter range of aircon for CY18
Source: Industry
Exhibit 25: Lloyd Electric – continuing with its “Switch on happiness” brand promise
Source: Industry
17 April 2018 15Consumer Durables l The heat is on
Exhibit 26: ‘O General’ – focusing on its inverter range
Exhibit 27: LG has launched window air conditioner and 100% copper models in CY18
Source: Industry
17 April 2018 16Consumer Durables l The heat is on
Exhibit 28: Whirlpool’s 3D Cool Inverter with Sixth Sense and Air purifier
Source: Industry
Exhibit 29: Carrier – “Durafresh’ range focusing on efficiency and cooling
Source: Industry
17 April 2018 17Consumer Durables l The heat is on
Exhibit 30: Daikin – ‘Fill the air with happiness’ ad campaign
Exhibit 31: Hitachi focusing on inverter ACs – now present across mass and economy range
Source: Industry
17 April 2018 18Consumer Durables l The heat is on
Valuation and view
Strong growth in volumes factored into current valuations
In our view, the street is factoring in strong volume growth over the next few years
as the low penetration of ACs, increasing affordability, easy EMI schemes and lower
electricity costs drive demand. We prefer Blue Star (Neutral, TP: INR880, 35x FY20E
UCP segment EPS, which we value at INR720; INR160 for the remaining business)
over Voltas (Neutral, TP: INR660, 35x FY20E UCP segment EPS, which we value at
INR530; INR130 for the remaining business). While Voltas is the market leader in the
room AC segment, its share and margins are under threat from players like Daikin,
Blue Star, Lloyd Electric and Panasonic.
Exhibit 32: Voltas - SOTP valuation
Name of segment FY20E EPS Multiple Value/Share
Unitary Cooling Products 15.2 35 533
Engineered Products Services 2.6 15 40
Electro Mechanical Products(incl. non allocable) 6.1 15 91
Total 664
Source: MOSL, Company
Exhibit 33: Blue Star - SOTP valuation
Description FY20E EPS Multiple Value/Share
Electro Mechanical Projects 8.8 15 132
Unitary Cooling Products 20.4 35 714
Professional Electronics 2.2 15 33
Total 880
Source: MOSL, Company
Exhibit 34: Voltas P/E band chart Exhibit 35: Blue Star P/E band chart
P/E (x) Avg (x) Max (x) P/E (x) Avg (x) Max (x)
Min (x) +1SD -1SD Min (x) +1SD -1SD
60.0 52.0
41.8
45.0 39.1 40.0 33.8
27.9 29.1 25.1
30.0 28.0 30.7
20.1
12.4 16.3
15.0 16.0
4.1 6.4
0.0 4.0
Jun-09
Jun-14
Jun-09
Jun-14
Mar-08
Sep-10
Dec-11
Mar-13
Sep-15
Dec-16
Mar-18
Mar-08
Sep-10
Dec-11
Mar-13
Sep-15
Dec-16
Mar-18
Source: MOSL Source: MOSL
Exhibit 36: Voltas P/B band chart Exhibit 37: Blue Star P/B band chart
P/B (x) Avg (x) Max (x) P/B (x) Avg (x) Max (x)
Min (x) +1SD -1SD Min (x) +1SD -1SD
10.0 60.0
51.9
7.8
7.5 45.0
4.5 4.8
5.0 30.0
3.2 15.3
2.5 2.0 15.0 7.8 8.4
1.1 2.6 0.4
0.0 0.0
Jun-09
Jun-14
Jun-09
Jun-14
Mar-08
Sep-10
Dec-11
Mar-13
Sep-15
Dec-16
Mar-18
Mar-08
Sep-10
Dec-11
Mar-13
Sep-15
Dec-16
Mar-18
Source: MOSL Source: MOSL
17 April 2018 19Explanation of Investment Rating
Investment Rating Expected return (over 12-month)
BUY >=15% Consumer Durables l The heat is on
SELL < - 10%
NEUTRAL > - 10 % to 15%
UNDER REVIEW Rating may undergo a change
NOT RATED
NOTES
We have forward looking estimates for the stock but we refrain from assigning recommendation
*In case the recommendation given by the Research Analyst becomes inconsistent with the investment rating legend, the Research Analyst shall within 28 days of the inconsistency, take appropriate measures to make the recommendation consistent with the investment rating legend.
Disclosures:
The following Disclosures are being made in compliance with the SEBI Research Analyst Regulations 2014 (herein after referred to as the Regulations).
Motilal Oswal Securities Ltd. (MOSL) is a SEBI Registered Research Analyst having registration no. INH000000412. MOSL, the Research Entity (RE) as defined in the Regulations, is engaged in the business of providing Stock broking services,
Investment Advisory Services, Depository participant services & distribution of various financial products. MOSL is a subsidiary company of Motilal Oswal Financial Service Ltd. (MOFSL). MOFSL is a listed public company, the details in respect of
which are available on www.motilaloswal.com. MOSL is registered with the Securities & Exchange Board of India (SEBI) and is a registered Trading Member with National Stock Exchange of India Ltd. (NSE) and Bombay Stock Exchange Limited
(BSE), Metropolitan Stock Exchange Of India Ltd. (MSE) for its stock broking activities & is Depository participant with Central Depository Services Limited (CDSL) & National Securities Depository Limited (NSDL) and is member of Association of
Mutual Funds of India (AMFI) for distribution of financial products. Details of associate entities of Motilal Oswal Securities Limited are available on the website at http://onlinereports.motilaloswal.com/Dormant/documents/Associate%20Details.pdf
MOSL, it’s associates, Research Analyst or their relative may have any financial interest in the subject company. MOSL and/or its associates and/or Research Analyst may have beneficial ownership of 1% or more securities in the subject company at
the end of the month immediately preceding the date of publication of the Research Report. MOSL and its associate company(ies), their directors and Research Analyst and their relatives may; (a) from time to time, have a long or short position in, act
as principal in, and buy or sell the securities or derivatives thereof of companies mentioned herein. (b) be engaged in any other transaction involving such securities and earn brokerage or other compensation or act as a market maker in the financial
instruments of the company(ies) discussed herein or act as an advisor or lender/borrower to such company(ies) or may have any other potential conflict of interests with respect to any recommendation and other related information and opinions.;
however the same shall have no bearing whatsoever on the specific recommendations made by the analyst(s), as the recommendations made by the analyst(s) are completely independent of the views of the associates of MOSL even though there
might exist an inherent conflict of interest in some of the stocks mentioned in the research report. Research Analyst may have served as director/officer, etc. in the subject company in the last 12 month period. MOSL and/or its associates may have
received any compensation from the subject company in the past 12 months.
In the last 12 months period ending on the last day of the month immediately preceding the date of publication of this research report, MOSL or any of its associates may have:
a) managed or co-managed public offering of securities from subject company of this research report,
b) received compensation for investment banking or merchant banking or brokerage services from subject company of this research report,
c) received compensation for products or services other than investment banking or merchant banking or brokerage services from the subject company of this research report.
d) Subject Company may have been a client of MOSL or its associates during twelve months preceding the date of distribution of the research report.
MOSL and it’s associates have not received any compensation or other benefits from the subject company or third party in connection with the research report. To enhance transparency, MOSL has incorporated a Disclosure of Interest Statement in
this document. This should, however, not be treated as endorsement of the views expressed in the report. MOSL and / or its affiliates do and seek to do business including investment banking with companies covered in its research reports. As a result,
the recipients of this report should be aware that MOSL may have a potential conflict of interest that may affect the objectivity of this report. Compensation of Research Analysts is not based on any specific merchant banking, investment banking or
brokerage service transactions.
Terms & Conditions:
This report has been prepared by MOSL and is meant for sole use by the recipient and not for circulation. The report and information contained herein is strictly confidential and may not be altered in any way, transmitted to, copied or distributed, in part
or in whole, to any other person or to the media or reproduced in any form, without prior written consent of MOSL. The report is based on the facts, figures and information that are considered true, correct, reliable and accurate. The intent of this report
is not recommendatory in nature. The information is obtained from publicly available media or other sources believed to be reliable. Such information has not been independently verified and no guaranty, representation of warranty, express or implied,
is made as to its accuracy, completeness or correctness. All such information and opinions are subject to change without notice. The report is prepared solely for informational purpose and does not constitute an offer document or solicitation of offer to
buy or sell or subscribe for securities or other financial instruments for the clients. Though disseminated to all the customers simultaneously, not all customers may receive this report at the same time. MOSL will not treat recipients as customers by
virtue of their receiving this report.
Analyst Certification
The views expressed in this research report accurately reflect the personal views of the analyst(s) about the subject securities or issues, and no part of the compensation of the research analyst(s) was, is, or will be directly or indirectly related to the
specific recommendations and views expressed by research analyst(s) in this report.
Disclosure of Interest Statement Companies where there is interest
Analyst ownership of the stock No
A graph of daily closing prices of securities is available at www.nseindia.com, www.bseindia.com. Research Analyst views on Subject Company may vary based on Fundamental research and Technical Research. Proprietary trading desk of MOSL or
its associates maintains arm’s length distance with Research Team as all the activities are segregated from MOSL research activity and therefore it can have an independent view with regards to subject company for which Research Team have
expressed their views.
Regional Disclosures (outside India)
This report is not directed or intended for distribution to or use by any person or entity resident in a state, country or any jurisdiction, where such distribution, publication, availability or use would be contrary to law, regulation or which would subject
MOSL & its group companies to registration or licensing requirements within such jurisdictions.
For Hong Kong:
This report is distributed in Hong Kong by Motilal Oswal capital Markets (Hong Kong) Private Limited, a licensed corporation (CE AYY-301) licensed and regulated by the Hong Kong Securities and Futures Commission (SFC) pursuant to the Securities
and Futures Ordinance (Chapter 571 of the Laws of Hong Kong) “SFO”. As per SEBI (Research Analyst Regulations) 2014 Motilal Oswal Securities (SEBI Reg No. INH000000412) has an agreement with Motilal Oswal capital Markets (Hong Kong)
Private Limited for distribution of research report in Hong Kong. This report is intended for distribution only to “Professional Investors” as defined in Part I of Schedule 1 to SFO. Any investment or investment activity to which this document relates is only
available to professional investor and will be engaged only with professional investors.” Nothing here is an offer or solicitation of these securities, products and services in any jurisdiction where their offer or sale is not qualified or exempt from
registration. The Indian Analyst(s) who compile this report is/are not located in Hong Kong & are not conducting Research Analysis in Hong Kong.
For U.S.
Motilal Oswal Securities Limited (MOSL) is not a registered broker - dealer under the U.S. Securities Exchange Act of 1934, as amended (the"1934 act") and under applicable state laws in the United States. In addition MOSL is not a registered
investment adviser under the U.S. Investment Advisers Act of 1940, as amended (the "Advisers Act" and together with the 1934 Act, the "Acts), and under applicable state laws in the United States. Accordingly, in the absence of specific exemption
under the Acts, any brokerage and investment services provided by MOSL, including the products and services described herein are not available to or intended for U.S. persons. This report is intended for distribution only to "Major Institutional
Investors" as defined by Rule 15a-6(b)(4) of the Exchange Act and interpretations thereof by SEC (henceforth referred to as "major institutional investors"). This document must not be acted on or relied on by persons who are not major institutional
investors. Any investment or investment activity to which this document relates is only available to major institutional investors and will be engaged in only with major institutional investors. In reliance on the exemption from registration provided by Rule
15a-6 of the U.S. Securities Exchange Act of 1934, as amended (the "Exchange Act") and interpretations thereof by the U.S. Securities and Exchange Commission ("SEC") in order to conduct business with Institutional Investors based in the U.S.,
MOSL has entered into a chaperoning agreement with a U.S. registered broker-dealer, Motilal Oswal Securities International Private Limited. ("MOSIPL"). Any business interaction pursuant to this report will have to be executed within the provisions of
this chaperoning agreement.
The Research Analysts contributing to the report may not be registered /qualified as research analyst with FINRA. Such research analyst may not be associated persons of the U.S. registered broker-dealer, MOSIPL, and therefore, may not be subject
to NASD rule 2711 and NYSE Rule 472 restrictions on communication with a subject company, public appearances and trading securities held by a research analyst account.
For Singapore
In Singapore, this report is being distributed by Motilal Oswal Capital Markets Singapore Pte Ltd (“MOCMSPL”) (Co.Reg. NO. 201129401Z) which is a holder of a capital markets services license and an exempt financial adviser in Singapore,
as per the approved agreement under Paragraph 9 of Third Schedule of Securities and Futures Act (CAP 289) and Paragraph 11 of First Schedule of Financial Advisors Act (CAP 110) provided to MOCMSPL by Monetary Authority of Singapore.
Persons in Singapore should contact MOCMSPL in respect of any matter arising from, or in connection with this report/publication/communication. This report is distributed solely to persons who qualify as “Institutional Investors”, of which some of
whom may consist of "accredited" institutional investors as defined in section 4A(1) of the Securities and Futures Act, Chapter 289 of Singapore (“the SFA”). Accordingly, if a Singapore person is not or ceases to be such an institutional investor, such
Singapore Person must immediately discontinue any use of this Report and inform MOCMSPL.
Disclaimer:
The report and information contained herein is strictly confidential and meant solely for the selected recipient and may not be altered in any way, transmitted to, copied or distributed, in part or in whole, to any other person or to the media or reproduced
in any form, without prior written consent. This report and information herein is solely for informational purpose and may not be used or considered as an offer document or solicitation of offer to buy or sell or subscribe for securities or other financial
instruments. Nothing in this report constitutes investment, legal, accounting and tax advice or a representation that any investment or strategy is suitable or appropriate to your specific circumstances. The securities discussed and opinions expressed in
this report may not be suitable for all investors, who must make their own investment decisions, based on their own investment objectives, financial positions and needs of specific recipient. This may not be taken in substitution for the exercise of
independent judgment by any recipient. Each recipient of this document should make such investigations as it deems necessary to arrive at an independent evaluation of an investment in the securities of companies referred to in this document
(including the merits and risks involved), and should consult its own advisors to determine the merits and risks of such an investment. The investment discussed or views expressed may not be suitable for all investors. Certain transactions -including
those involving futures, options, another derivative products as well as non-investment grade securities - involve substantial risk and are not suitable for all investors. No representation or warranty, express or implied, is made as to the accuracy,
completeness or fairness of the information and opinions contained in this document. The Disclosures of Interest Statement incorporated in this document is provided solely to enhance the transparency and should not be treated as endorsement of the
views expressed in the report. This information is subject to change without any prior notice. The Company reserves the right to make modifications and alternations to this statement as may be required from time to time without any prior approval.
MOSL, its associates, their directors and the employees may from time to time, effect or have effected an own account transaction in, or deal as principal or agent in or for the securities mentioned in this document. They may perform or seek to perform
investment banking or other services for, or solicit investment banking or other business from, any company referred to in this report. Each of these entities functions as a separate, distinct and independent of each other. The recipient should take this
into account before interpreting the document. This report has been prepared on the basis of information that is already available in publicly accessible media or developed through analysis of MOSL. The views expressed are those of the analyst, and
the Company may or may not subscribe to all the views expressed therein. This document is being supplied to you solely for your information and may not be reproduced, redistributed or passed on, directly or indirectly, to any other person or
published, copied, in whole or in part, for any purpose. This report is not directed or intended for distribution to, or use by, any person or entity who is a citizen or resident of or located in any locality, state, country or other jurisdiction, where such
distribution, publication, availability or use would be contrary to law, regulation or which would subject MOSL to any registration or licensing requirement within such jurisdiction. The securities described herein may or may not be eligible for sale in all
jurisdictions or to certain category of investors. Persons in whose possession this document may come are required to inform themselves of and to observe such restriction. Neither the Firm, not its directors, employees, agents or representatives shall
be liable for any damages whether direct or indirect, incidental, special or consequential including lost revenue or lost profits that may arise from or in connection with the use of the information. The person accessing this information specifically agrees
to exempt MOSL or any of its affiliates or employees from, any and all responsibility/liability arising from such misuse and agrees not to hold MOSL or any of its affiliates or employees responsible for any such misuse and further agrees to hold MOSL
or any of its affiliates or employees free and harmless from all losses, costs, damages, expenses that may be suffered by the person accessing this information due to any errors and delays.
Registered Office Address: Motilal Oswal Tower, Rahimtullah Sayani Road, Opposite Parel ST Depot, Prabhadevi, Mumbai-400025; Tel No.: 022-3980 4263; www.motilaloswal.com. Correspondence Address: Palm Spring Centre, 2nd Floor, Palm
Court Complex, New Link Road, Malad (West), Mumbai- 400 064. Tel No: 022 3080 1000. Compliance Officer: Neeraj Agarwal, Email Id: na@motilaloswal.com, Contact No.:022-38281085.
Registration details of group entities.: MOSL: SEBI Registration: INZ000158836 (BSE/NSE/MCX/NCDEX); CDSL: IN-DP-16-2015; NSDL: IN-DP-NSDL-152-2000; Research Analyst: INH000000412. AMFI: ARN 17397. Investment Adviser:
INA000007100.IRDA Corporate Agent-CA0541. Motilal Oswal Asset Management Company Ltd. (MOAMC): PMS (Registration No.: INP000000670) offers PMS and Mutual Funds products. Motilal Oswal Wealth Management Ltd. (MOWML): PMS
(Registration No.: INP000004409) offers wealth management solutions. *Motilal Oswal Securities Ltd. is a distributor of Mutual Funds, PMS, Fixed Deposit, Bond, NCDs, Insurance and IPO products. * Motilal Oswal Commodities Broker Pvt. Ltd. offers
Commodities Products. * Motilal Oswal Real Estate Investment Advisors II Pvt. Ltd. offers Real Estate products. * Motilal Oswal Private Equity Investment Advisors Pvt. Ltd. offers Private Equity products
17 April 2018 20You can also read