New Frontier Corporation Business Combination with United Family Healthcare - July 2019
←
→
Page content transcription
If your browser does not render page correctly, please read the page content below

Updated 16:00PM Aug 12, 2019

New Frontier Corporation Business
Combination with United Family Healthcare

July 2019

                                                              1
DISCLAIMER
This investor presentation (“presentation”) is for informational purposes only and does not constitute an offer to sell, a solicitation of an offer to buy, or a recommendation to purchase any equity,
debt or other financial instruments of New Frontier Corporation ("NFC"), United Family Healthcare ("UFH") or any of their respective affiliates. This presentation has been prepared to assist
investors in making their own evaluation with respect to the proposed business combination (the “Transaction”) between NFC and UFH, and for no other purpose.

The information contained herein does not purport to be all-inclusive. The data contained herein is derived from various internal and external sources. No representation is made as to the
reasonableness of the assumptions made within or the accuracy or completeness of any projections or modeling or any other information contained herein. Any data on past performance or
modeling contained herein is not an indication as to future performance. NFC and UFH assume no obligation to update the information in this presentation, except as required by law. Furthermore,
any and all trade names referred to in this presentation are the property of their respective owners.

Forward-Looking Statements
This presentation includes “forward-looking statements” within the meaning of the “safe harbor” provisions of the Private Securities Litigation Reform Act of 1995. NFC’s and UFH’s actual results
may differ from their expectations, estimates and projections and consequently, you should not rely on these forward-looking statements as predictions of future events. Words such as “expect”,
“estimate”, “project”, “budget”, “forecast”, “anticipate”, “intend”, “plan”, “may”, “will”, “could”, “should”, “believes”, “predicts”, “potential”, “continue”, and similar expressions are intended to identify
such forward-looking statements. These forward-looking statements include, without limitation, NFC’s and UFH’s expectations with respect to future performance and anticipated financial impacts of
the Transaction and the timing of the completion of the Transaction. These forward-looking statements involve significant risks and uncertainties that could cause the actual results to differ
materially from the expected results, including the inability to complete the Transactions (including due to failure to receive required shareholder approvals or the failure of other closing conditions),
the inability to recognize the anticipated benefits of the Transaction; the inability to meet the New York Stock Exchange's listing standards, costs related to the Transaction, the combined company's
ability to manage growth, the combined company's ability to execute its business plan (including due to changes in government policies or regulation affecting the combined company's business)
and meet its projections, rising costs (including due to changes in regulation or government policies affecting the combined company's business) affecting the combined company's profitability,
potential litigation involving NFC, UFH, or after the closing of the Transaction, the combined company, and other risks and uncertainties indicated from time to time in the proxy statement to filed
relating to the Transaction, including those under the section entitled "Risk Factors" therein and in NFC's other filings with the U.S. Securities and Exchange Commission (the "SEC"). Most of these
factors are outside of NFC’s and UFH’s control and are difficult to predict. NFC cautions readers not to place undue reliance upon any forward-looking statements, which speak only as of the date
made. NFC and UFH do not undertake or accept any obligation or undertaking to release publicly any updates or revisions to any forward-looking statements to reflect any change in its
expectations or any change in events, conditions or circumstances on which any such statement is based.

No Offer or Solicitation
This presentation shall not constitute a solicitation of a proxy, consent or authorization with respect to any securities or in respect of the Transaction. This presentation shall also not constitute an
offer to sell or the solicitation of an offer to buy any securities, nor shall there be any sale of securities in any states or jurisdictions in which such offer, solicitation or sale would be unlawful prior to
registration or qualification under the securities laws of any such jurisdiction.

                                                                                                                                                                                                                     2
DISCLAIMER (CONT'D)
No Representation or Warranty
None of NFC, UFH or any of their respective affiliates makes any representation or warranty as to the accuracy or completeness of the information contained in this presentation. The sole purpose
of the presentation is to assist persons in deciding whether they wish to proceed with a further review of the Transaction and is not intended to be all-inclusive or to contain all the information that a
person may desire in considering the Transaction. It is not intended to form the basis of any investment decision or any other decision in respect of the Transaction.

Use of Projections
This presentation contains financial projections. Such financial projections have not been prepared in conformity with accounting principals generally accepted in the United States or the
International Financial Reporting Standards as adopted by the International Accounting Standards Board ("IFRS"). Neither NFC’s nor UFH’s independent auditors have studied, reviewed, compiled
or performed any procedures with respect to the projections for the purpose of their inclusion in this presentation, and accordingly, neither of them expressed an opinion or provided any other form
of assurance with respect thereto for the purpose of this presentation. These projections are for illustrative purposes only and should not be relied upon as being necessarily indicative of future
results. In this presentation, certain of the above-mentioned projected information has been provided for purposes of providing comparisons with historical data. The assumptions and estimates
underlying the prospective financial information are inherently uncertain and are subject to a wide variety of significant business, economic and competitive risks and uncertainties that could cause
actual results to differ materially from those contained in the prospective financial information. Projections are inherently uncertain due to a number of factors outside of NFC’s and UFH’s control.
Accordingly, there can be no assurance that the prospective results are indicative of future performance of UFH or the combined company after the Transaction or that actual results will not differ
materially from those presented in the prospective financial information. Inclusion of the prospective financial information in this presentation should not be regarded as a representation by any
person that the results contained in the prospective financial information will be achieved.

Industry and Market Data
In this presentation, we rely on and refer to information and statistics regarding market participants in the sectors in which UFH competes and other industry data. We obtained this information and
statistics from third-party sources, including reports by market research firms and company filings.

Use of Non-IFRS Financial Matters
This presentation includes certain financial measures, including Adjusted EBITDA that were not calculated in accordance with IFRS. Adjusted EBITDA is defined as net income / (loss) plus (i)
depreciation and amortization, (ii) interest expense, (iii) other expenses (such as share based compensation), (iv) provision for income taxes, as further adjusted for one-off rental and relocation
expenses as well as the management fee to Shanghai Fosun Pharmaceutical (Group) Co., Ltd. ("Fosun") and TPG. NFC and UFH believe that these non-IFRS measures are useful to investors for
two principal reasons. First, they believe these measures may assist investors in comparing performance over various reporting periods on a consistent basis by removing from operating results the
impact of items that do not reflect core operating performance. Second, these measures are used by UFH’s management to assess its performance and may (subject to the limitations described
below) enable investors to compare the performance of UFH and the combined company to its competition. NFC and UFH believe that the use of these non-IFRS financial measures provides an
additional tool for investors to use in evaluating ongoing operating results and trends. These non-IFRS measures should not be considered in isolation from, or as an alternative to, financial
measures determined in accordance with IFRS. Other companies may calculate Adjusted EBITDA and other non-IFRS financial measures differently, and therefore UFH’s non-IFRS financial
measures may not be directly comparable to similarly titled measures of other companies. For additional information and a reconciliation of these non-IFRS financial measures to the nearest
comparable IFRS financial measures, see the section entitled "EBITDA Reconciliation" in the Appendix at the end of this presentation.

                                                                                                                                                                                                              3
DISCLAIMER (CONT'D)
Historical Financial Information
Certain historical financial information of UFH included in this Presentation has been derived from the annual financial statements of UFH which were prepared in accordance with IFRS and are
currently being audited in accordance with standards of the Public Company Accounting Oversight Board. In connection with such audit, such financial information included herein is subject to
change, and any such changes could be material.

Additional Information About the Transaction and Where to Find It
The Transaction is expected to be submitted to shareholders of NFC for their consideration. NFC intends to file with the SEC preliminary and definitive proxy statements in connection with the
Transaction and other matters and will mail a definitive proxy statement and other relevant documents to its shareholders as of the record date established for voting on the Transaction. NFC's
shareholders and other interested persons are advised to read, once available, the preliminary proxy statement and any amendments thereto and, once available, the definitive proxy statement, in
connection with NFC's solicitation of proxies for its extraordinary general meeting to be held to approve, among other things, the Transaction, because these documents will contain important
information about NFC, UFH and the Transaction. Shareholders may also obtain a copy of the preliminary or definitive proxy statement, once available, as well as other documents filed with the
SEC regarding the Transaction and other documents filed with the SEC by NFC, without charge, at the SEC's website located at www.sec.gov or by directing a request to Harry Chang at (852)
6126 4345.

Participants in the Solicitation
NFC, UFH and their respective directors, and executive officers may, under SEC rules, be deemed to be participants in the solicitations of proxies from NFC’s shareholders in connection with the
Transaction. Information regarding the persons who may, under SEC rules, be deemed participants in the solicitation of NFC's shareholders in connection with the Transaction will be set forth in
NFC's proxy statement when it is filed with the SEC. You can find more information about NFC's directors and executive officers in NFC’s Annual Report on Form 10-K for the year ended December
31, 2018, filed with the SEC on April 1, 2019. Additional information regarding the participants in the proxy solicitation and a description of their direct and indirect interests will be included in NFC's
proxy statement when it becomes available, which can be obtained free of charge from the sources indicated above.

                                                                                                                                                                                                                4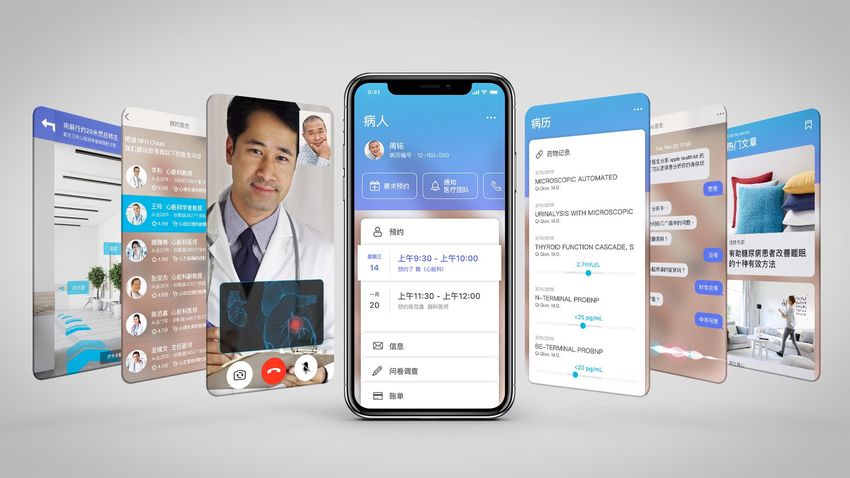
TABLE OF CONTENTS

SITUATION OVERVIEW

COMPANY OVERVIEW

INDUSTRY OVERVIEW

GROWTH INITIATIVES AND FINANCIALS

APPENDIX

                                    5
SITUATION OVERVIEW

 ▪ New Frontier Corporation (“NFC”) is a Special Purpose Acquisition Company (“SPAC”) sponsored by New Frontier
  Group (“NF Group”). NFC completed a successful IPO on the NYSE in June 2018 (raised IPO proceeds of US$
  287.5mm and FPA of US$ 190.0mm)

 ▪ NFC is in the process of acquiring United Family Healthcare ("UFH"), one of the largest and most recognized
  integrated premium private healthcare operators in China
     ⁻ UFH is one of the largest integrated private healthcare service providers in China by revenue, with 9 hospitals (2 of which are
        under construction ) and 14 clinics in all 4 first tier cities and select second tier cities
     ⁻ Comprehensive suite of full-lifecycle practices in 30+ specialties including IVF services, primary care, family medicine,
        pediatrics and obstetrics, gynecology, surgical services orthopedics, oncology and other services
     ⁻ International standard healthcare services and top medical professionals
     ⁻ Mature operations platform built by mature experienced team

 ▪ NFC believes it can drive continuous growth to UFH's business
     ⁻ Large supply and demand mismatch for high quality healthcare
     ⁻ Highly visible growth and expansion plan
     ⁻ NFC has significant experience and expertise in China's healthcare industry

                                                                                                                                         6
COMPANY OVERVIEW
                   7
THE LEADING PRIVATE HEALTHCARE SERVICES PROVIDER IN CHINA

    1                                                                                      1
          One of the LARGEST private                                                            TOP-RANKED brand among                                                                     COMPREHENSIVE
    healthcare services providers                                                            high-end private hospitals                                                                   SERVICE OFFERING
         in China by revenue                                                                                                                                                            covering 30+ specialties
     2019E total revenue: RMB ~2.5bn
        2014A-2019E CAGR: 13.3%

   9 hospitals1 14 clinics1 700+ licensed beds                                                             Operating Assets2                                                               ALL3 JCI certified
 600+ physician staff 600+ physician consultants                                         2019E Adjusted EBITDA: RMB    469mm                                         Beijing United Family ONLY JCI and CAP certified hospital
       2019E outpatient visits: ~670,000                                                          2015A-2018A CAGR: 36.6%                                                 FIRST da Vinci and MAKO in private hospital
        2019E inpatient visits: ~12,000

               Source: Company; As of Dec 31, 2018
               1. Include 2 hospitals under construction,13 directly operated clinics and 1 managed clinic
               2. Operating assets include Beijing, Shanghai Puxi, Tianjin, Qingdao and Beijing Rehab Hospitals as well as Bo’Ao and Hangzhou Clinics and post-partum care worker business
               3. All hospital and clinics with at least 3 years of operating experience are accredited or re-accredited on a 3 year cycle. The newest Qingdao and Shanghai Pudong hospitals
               were not yet eligible in the 2017 audit, but Qingdao will be included in the 2020 audit and Pudong will be eligible in the next cycle.                                                                        8
NATIONWIDE GEOGRAPHIC FOOTPRINT
Broad geographic coverage                                                                                                                                          BEIJING CLUSTER + NORTH CHINA1
across all four Tier 1 cities
                                                                                                                                                                                    H
                                                                                                                                                                                        H
Strategic opportunity for                                                                                                                                                                   H
expansion into Tier 2 cities                                                                                                                                                                H

                                                                                                                                                                                                Qingdao H
GREATER BAY CLUSTER                                                                                                  Beijing
                                                                                                                                                                                      Hub-and-Spoke Model

                        H                                                                                                                                                        5 Hospitals                    8 Clinics
                                                                                                                                Tianjin                                  Hub
                                                                                                                                                                                                        Spoke

                            H

                                                                                                                                        Qingdao
                                                                                                                                                                   SHANGHAI CLUSTER + EAST CHINA

           Hainan
                                                                                                                   Shanghai
             Hub-and-Spoke Model                                                                                                                                                                       H        H

          2 Hospitals                    2 Clinics
                                                                                                                          Hangzhou
                                 Spoke
    Hub

                                                                                                       Guangzhou

                                                                                                                                                                                      Hub-and-Spoke Model
Disciplines Across Centers:
Dental, Dermatology, Emergency Care, Family Medicine, Internal                                                     Shenzhen2                                                     2 Hospitals                    4 Clinics
                                                                                                                                                                                                        Spoke
                                                                                                                                                                         Hub
Medicine, OB/GYN, Pediatrics, Rehab, Postpartum Rehab,                                                        Hainan
Radiology, Surgery, Orthopedics, Urology, and others                                                                                   Existing Hospitals
                                                                                                                                       Pipeline Hospitals
                    Source: Company
                                                                                                                                    Clinics
                    1. 5 hospitals in Beijing Cluster including Qingdao United Family
                    2. UFH is expected to be given the exclusive right to manage New Frontier Group’s 64,000 sq. meter flagship Shenzhen city center hospital as part of the transaction                                    9
DIVERSIFIED FOUNDATION FOR FUTURE GROWTH

MULTI-SPECIALTY SERVICE OFFERING1                                              DIVERSIFIED PAYER STRUCTURE2                                                           REVENUE MIX BETWEEN SERVICE & PHARMACY

                       2018A                                                                                2018A                                                                      2018A
      Others                                OB/GYN                                                                                                                                                 Pharmacy
       22%                                   23%                                                                                Commercial
                                                                                                                                                                                                    13.0%
                                                                                                                                 Insurance
                                                                                                                                    39%
    PPR
    3%

     ER                                                                       Self-pay
     7%                                          Peds
                                                 16%                           61%
                                                                                                                                                                         Service
          IM                                                                                                                                                             87.0%
          5%
               FM                  Surgery
                         Ortho       8%
               9%         7%
BROADER ADDRESSABLE MARKET WITH MORE LOCAL PATIENTS3

                                               2014                                                                                                                            2018A

                                                                                                                                                                                         Expat
                                                                                                                                                                                         31%

                     Local
                     54%                                                Expat
                                                                        46%
                                                                                                                                                        Local
                                                                                                                                                        69%
                Source: Company
                1. OB/GYN: Obstetrics and Gynecology; Peds: Pediatrics; Ortho: Orthopaedics; FM: Family Medicine; IM: Internal Medicine; ER: Emergency Room; PPR: Post-Partum Rehab
                2. Split by revenue from insurance / self-pay patients
                3. Split by volume of expat and local Chinese patients                                                                                                                                         10
COMPREHENSIVE PROVIDER WITH ENTIRE "LIFECYCLE" COVERAGE
HUB-AND-SPOKE MODEL CREATES COMPREHENSIVE HEALTHCARE SERVICES PLATFORM WITH MULTIPLE PATIENT TOUCHPOINTS
Clinics Home Health Dental
Attracting traffic Broader patient base Potential for Dermatology, ENT1, Revenue driven by high acuity Expanding differentiated services
with OB/GYN and Pediatrics built up by Family Medicine Ophthalmology & departments including complemented by
New Hope Oncology Centre Orthopedics & Surgery Rehabilitation and PPR
Prenatal OB/ Pediatrics Family New High Rehabilitation PPR1
Care GYN1 Medicine Specialties Acuity
Revenue (RMB mm)
783 88
89 299
483 176
51 162
112
14
2014 2018A 2014 2018A 2014 2018A 2014 2018A 2014 2018A
Pediatrics OB/GYN Family Medicine Ophthalmology ENT Dermatology Surgery Orthopedics PPR Rehabilitation
Source: Company
1. OB/GYN: Obstetrics and Gynecology; ENT: Ear, Nose and Throat; PPR: Post-Partum Rehabilitation 11THE MOST REPUTABLE PRIVATE HEALTHCARE BRAND IN CHINA
RANKS TOP FOR MEDICAL QUALITY AMONG HIGH-END PRIVATE HOSPITALS BY PATIENTS, DOCTORS AND GOVERNMENT REGULATORS
◼ 2003 – The designated healthcare institution for foreigners during the SARS period ◼ 2016 – Ranked No.2 in China Private Hospital Valuable Brands
◼ 2010 – Official designated medical institutions for the Shanghai World Expo ◼ 2016 – Ranked No.18 in China Private Hospital Conglomerates Top 50 League
◼ 2015 - Named as Most Investment-Worthy Healthcare Company ◼ 2018 – The designated Well-Known Trademark
◼ 2016 – Ranked No.1 in China Top 100 Private Hospitals ◼ 2018 - Ranked No.1 repeatedly as The Best Employer among all private hospitals
RANKING SCORE OF PRIVATE BRANDS AMONG MONTHLY HOUSEHOLDS INCOME >RMB 27K1,2,3
BEIJING SHANGHAI GUANGZHOU
1.85
1.75
1.64
1.64
1.55
1.53
1.55 1.50 1.48
1.37
1.30 1.28
1.25
1.38 1.38
1.30
1.03 1.08
UFH AmCare Parkway New HarMoniCare Oasis UFH
UFH American- Landseed
American- Landseed St. Jiahui Parkway UFH
UFH Clifford Distinct iBorn Elisabeth Bupa
Century Sino
Sino Michael Healthcare
Source: Company, Company Analysis
1. Survey Question 4: Please force rank the following private hospital brands’ medical quality? Screening criteria: Have had any kind of medical treatment in private hospital in past 36 months
2. Scoring methods: a) Score 5 for brand ranked 1st; Score 3 for brand ranked 2nd; Score 1 for brand ranked 3rd; b) Divide summed score by the number of respondents 12
3. Sample size for Beijing, Shanghai and Guangzhou were 105, 110 and 62 respectivelyPLATFORM FOR HIGHEST CALIBER MEDICAL TALENT
ECONOMICS, BRAND AND CAREER OPPORTUNITIES ARE THE KEY FACTORS FOR ATTRACTING THE BEST PHYSICIANS
SALARY PACKAGE, BRAND NAME AND WORKING ENVIRONMENT ARE THREE MOST IMPORTANT FACTORS FOR CAREER CONSIDERATIONS BY PHYSICIANS
BEST SALARY PACKAGE MOST REPUTABLE BRAND BEST WORKING ENVIRONMENT
1
ANNUAL INCOME OF CHIEF PHYSICIAN (PRE-TAX) TOP-RANKED AMONG PRIVATE HEALTHCARE PROVIDERS1 ◼ Equipped with advanced facilities
Ranking
– One of only 2 da Vinci in private hospitals4 in China
~2.0-3.0 x Beijing UFH 1
– One of only 3 MAKO in China4
Shanghai UFH 3
◼ UFH physicians spend an average of ~20 min per
x AmCare Beijing 4
outpatient appointment, as opposed to the average
Peking University Intl. Hospital 10 less than 5 min consultation available in public hospitals
Guangzhou UFH 14
UFH Public Hospitals ◼ Substantially low physician churn rate, 12%, 24%
New Century Healthcare 24 and 5% for UFH Beijing, Shanghai and Guangzhou
Shanghai Pudong UFH 31 respectively, versus ~30% turnover rate in most private
hospitals in China
1
ANNUAL INCOME OF CHIEF PHYSICIAN (POST-TAX) TOP-RANKED AMONG PHYSICIANS2 STRONG MEDICAL NETWORK WITH REPUTABLE PARTNERS
(% of response) Beijing Shanghai
~1.7-2.0x 35 19
x 9
6 6 4
UFH Public Hospitals
UFH Sanbo3 AmCare UFH Parkway Int'l SOS
Source: China Private Healthcare Branding Value Ranked by DXY.com, Company, Company Analysis
1. Sample size of 274
2. Beijing Sanbo Brain Hospital, a private (mid market) specialty brain hospital
3. Also first to have Da Vinci and MAKO among all private hospitals in China 13ASSET OVERVIEW
UFH
OPERATING ASSETS EXPANSION ASSETS (TIER 1 ONLY)
TIER 1 TIER 2 EXPANSION
ASSETS
Management
Contract
(TIER 2)
Beijing Shanghai Shanghai Beijing Shanghai Beijing
Tianjin Qingdao Guangzhou
Chaoyang Puxi1 (old) Puxi2 (new) Rehab Pudong Datun Shenzhen
Operating Stats4
Open Date 1997/2014 2004 2019 2012 2015 2013 2018 2018 2020 2021
Gross Floor Area (sqm) 24,5043 5,9003 21,7693 6,900 30,0008 11,520 70,6073 28,471 22,834 64,000
# of Licensed Beds 120 50 100 30 2008 101 105 100 200 250-350
# of Consultation Rooms 2393 713 1063 26 29 32 1353 835 825 TBC
Signed MoU &
# of Satellite Clinics 8 4 0 0 0 1 0 N/A TBC framework
agreement in major
2019E Financials (RMB mm) 2018
Tier 2 locations
Revenue 1,3043 4923 5313 136 86 93 1763 109 0 5
(lease / operate and
Revenue Contribution 52%3 24%3 21%3 5% 3% 4% 7%3 4% 0% 0% management
contract model)
Revenue / Bed6 14.03 12.03 7.53 5.9 1.8 1.1 1.73 1.3 N/A N/A
Revenue / Sqm (RMB k) 53.23 83.43 24.43 19.7 4.3 8.1 2.53 3.8 N/A N/A
Adjusted EBITDA 3453 1273,7 1303,7 22 (22) (1) (43)3 (79) (45) 5
Initial Investments9 31810 7810 29611 10510 348 20610 727 561 447 N/A12
Beijing City Cluster Shanghai City Cluster Greater Bay Cluster JCI-Certified
Source: Company 6. Revenue / bed is calculated based on bed in use for each year 9. Initial Capex plus historical or expected loss and pre-opening expenses during ramp-
1. All financials for old Shanghai Puxi are 2018A figures 7. Adjusted EBITDA of Shanghai Puxi in 2018 and 2019 been adjusted up period
2. New Shanghai Puxi is the expansion of the old Shanghai Puxi for one-off rent and relocation expenses in New Puxi Hospital; after 10. Only includes initial Capex as losses are not traceable
3. Includes satellite clinics associated with hospitals adjustment, Shanghai Puxi recorded RMB 13mm and RMB 16mm 11. Expects no loss to be incurred as it is considered as an expansion of the old Puxi
4. As of Dec 31, 2018 additional rent in 2018 and 2019 respectively site (~1km from the existing site), which already has mature and stable patient base 14
5. Stands for consultation rooms available at stabilization 8. Includes Building A and additional capacity from Building B expansion 12. Management contract: CAPEX paid for by the project companyONE TEAM, ONE DREAM
SENIOR LEADERSHIP
▪ Chairman / Co-Founder of New Frontier ▪ Founder of UFH ▪ CEO / Co-Founder of New Frontier
▪ Chairman of Nan Fung Group ▪ Medical industry experience: 35+ years ▪ Experienced healthcare entrepreneur
▪ Former HK Financial Secretary ▪ One of the most well regarded (Co-founder of Care Alliance, YD Care,
healthcare executives in China and Heal)
▪ Former Chairman of Blackstone China,
JP Morgan Asia ▪ Founding member of Blackstone Asia
Antony Leung Roberta Lipson Carl Wu Pacific and Blackstone China
OPERATIONAL / MEDICAL EXPERTS FINANCE / M&A PROFESSIONALS
▪ Medical industry ▪ Medical industry ▪ Medical industry ▪ Past experience: ▪ Past experience:
experience: 25+ experience: 20+ experience: 25+ 25+ years in CITIC Capital,
years years years healthcare industry China Everbright,
China Minsheng
▪ Past experience: ▪ Past experience:
Investment,
SOS, Parkway NHS, Aspen
Dr. Jeff Staples Health DJ Hamblin-Brown Medical Walter Xue Harry Chang Lehman Brothers,
Sylvia Pan
COO - UFH CMO - UFH GM, Beijing UFH CFO - UFH Managing Director - NFMerrill Lynch
▪ Past experience: ▪ Past experience:
▪ Medical industry ▪ Medical industry Blackstone Hong Hilton Greater
experience: 22+ experience: 20+ years Kong, Barclays China
years ▪ Past experience:
▪ Past experience: KPJ SIMC, Xinhua Hospital
Healthcare Berhad David Zeng Francis Lee
Lai Heng Mah Dr. Michael Zhang Executive Director - NF Managing Director - NF
GM, Shanghai Puxi UFH GM, Shanghai Pudong UFH
OPERATING PARTNERS
▪ Medical industry ▪ Professor of Pediatrics in ▪ Operating Partner ▪ Operating Partner
experience: 15+ China of New Frontier of New Frontier
years ▪ Published over 20 papers Health Health
▪ Past experience: US in medical journals ▪ Past experience: ▪ Past experience:
CDC, Hawaii DMAT Blackstone, Morgan Stanley
Dr. Kate Gaynor Dr. Kelly Xia Albert Xu Deutsche Bank Shuai Yuan PE, Morgan
GM, Guangzhou UFH CMO, Guangzhou UFH Executive Director - NF Executive Director - NF Stanley IBD
15EXPERIENCED BOARD OF DIRECTORS
Dr. C H Leong Frederick Ma David Johnson Shan Fu
Independent Director Independent Director Independent Director Director2
▪ Chairman of the Hong Kong ▪ Senior Managing Director / ▪ Managing Partner, Co-CEO
▪ Non-executive Chairman
University Council Senior Advisor and CEO of Greater China
(2009 – 2015) (2016 – Present) (2013 – present) (2013 – present)
▪ Senior Managing Director in
▪ Secretary for Commerce & ▪ Senior Vice President of
▪ Non-official member of the Private Equity group
Economic Development of Strategy and Business
Executive Council HKSAR
the HKSAR Development ▪ Chief Representative in
Precedent (2005 – 2012) (2007 – 2008) (2009 – 2013) (2008 – 2013) Beijing office
experience ▪ Department of Foreign
▪ Secretary for Financial
▪ Chairman of the Hong Kong Investment in National
Services and the ▪ Vice President of Corporate
Hospital Authority Development and Reform
Treasury for HKSAR Development
(1988 – 2000) (2002 – 2007) (2003 – 2008) Commission (NDRC) of PRC
▪ Led IBM’s $3.5 billion
(1981 – 2009) acquisition of PwC’s
▪ Member of Legislative consulting arm ▪ State Economic and Trade
▪ Chief Financial Officer
Council of Hong Kong Commission3 of PRC
(1988 – 2000) (2002 – 2002) (1993 – 2003)
Board
directorships1
Notes:
1. Past and present
2. Mr. Shan Fu (CEO of Vivo China) will join as Director after closing 16
3. Currently part of Ministry of Commerce of PRCNEW FRONTIER HEALTHCARE ADVISOR TEAM
Dr. Leong Che-hung, GBM, JP Dr. Ko Wing Man, GBS, JP Professor Grace Tang Wai King, JP
◼ Former Chairman of the Hospital Authority ◼ Former Secretary of Food and Health Bureau ◼ Honorary Clinical Professor of Department of Obstetrics and
◼ Former member of the Legislative Council ◼ Member of the Medical Council of Hong Kong Gynecology, University of Hong Kong
◼ Former Chairman of the University of Hong Kong (HKU) ◼ Chairman of the Hong Kong Anti-Cancer Society ◼ Founding Hospital Chief at The University of Hong Kong-
Council ◼ Director of the Hong Kong Red Cross Shenzhen Hospital
◼ Member of the Board of Hong Kong Baptist University ◼ Founding Chairman of The Asian Medical Education
Association
David D. Ho, M.D. Professor Chung-Mau Lo, BBS, JP Professor Yuen Kwok-yung
◼ Irene Diamond Professor at The Rockefeller University ◼ Hospital Chief Executive at The University of Hong Kong- ◼ Professor of Department of Microbiology, University
◼ Scientific Director and CEO of the Aaron Diamond AIDS Shenzhen Hospital of Hong Kong
Research Center ◼ Director of Liver Transplantation Centre at Queen Mary ◼ Co-Director of State Key Laboratory of Emerging
◼ Time Magazine’s Man of the Year (1996) Hospital Infectious Diseases at HKU
◼ Honorary Fellow of the American Surgical Association and the ◼ Academician of Chinese Academy of Engineering
American College of Surgeons
Dr. Carrie Willis, Yau Sheung Mui Dr. Zhang Naizi Mrs. Kwok Yuen Wai Yee Victoria
◼ Chairman of Committee on Professional Development of ◼ Director of Shanghai third community welfare institute ◼ Three committees of the Association’s Residential Aged
Teachers and Principals ◼ Director of the Institute of Ageing Industries, Shanghai Jiaotong Care Accreditation Scheme
◼ Board of Canadian International School University ◼ Former non-government organization representative to the
◼ Executive Director of the Vocational Training Council ◼ Member of the national pension service expert committee Central Committee on Elderly Services
◼ Former Member of Social Welfare White Paper Aged Service
Committee
Professor Diane T.F. Lee, JP Dr. Leong Chi-tat Professor Jean Woo
◼ Professor of Nursing at the Nethersole School of Nursing, ◼ Director of Haven of Hope Sister Annie Skau Holistic Care ◼ Director of the Jockey Club Institute of Ageing at CUHK
CUHK Centre ◼ Director of the SH Ho Centre for Gerontology and Geriatrics
◼ Director of Y.K. Pao Foundation Centre for Nursing ◼ Fellow of the Royal College of Internal Medicine ◼ Honorary Consultant of the Hospital Authority
Excellence in Chronic Illness Care ◼ Fellow of the Hong Kong Institute of Social Medicine
◼ Deputy Director of CUHK Jockey Club Institute of Ageing
17INDUSTRY OVERVIEW
18RAPID GROWTH IN DEMAND FOR HEALTHCARE SERVICES
REVENUE FOR HEALTHCARE SERVICES IN CHINA - HOSPITALS & PREMIUM HEALTHCARE EXPENDITURE2 IN CHINA
PRIMARY CARE
(US$ bn)1 (US$ bn)1
CAGR CAGR CAGR CAGR
13-17 (%) 17-23 (%) 40 13-17 (%) 17-23 (%)
1,009
4%
17% 16%
15%
25% 22% 38%
38% 23% 20%
19%
11% 10%
544
3%
488 9%
3%
434 8%
389 20%
7%
20%
340 6% 13
20% 62% 25% 22%
6% 20% 62% 12% 9% 62%
21% 10
40%
40%
8
7 41%
41%
70% 69%
71% 5 41%
41%
71% 41%
41%
71% 42%
42% 60%
59% 60%
59% 59%
59% 59%
58%
58% 59%
2013A 2014A 2015A 2016A 2017A 2023E 2013A 2014A 2015A 2016A 2017A 2023E
Private primary care Public primary care 1st tier 2nd tier
Private hospitals Public hospitals
Source: NHFPC, Company Analysis
1. Exchange rate at USD:RMB = 1.00 : 6.80
2. Annual high-end medical spending by residents (Expatriate, Local out of Pocket, Local Insured Patients) in Tier 1 & Tier 2 cities of China
Local out of Pocket is defined as affluent households with annual income > RMB 324K 19
Assumed addressable population all live in Tier 1 and Tier 2 cities; Tier 1 cities: Beijing, Shanghai, Guangzhou and Shenzhen; Tier 2 cities: 46 cities incl. Tianjin, Nanjing, Hangzhou, Chongqing, Chengdu, Ningbo and etc.CHINA IS UNDER-PENETRATED IN PRIVATE HEALTHCARE
Countries and Regions
85 Asia
EU
80
Switzerland NA
75 AU
70 LatAm & Africa
65
United States
60
Singapore Australia
55
GDP 50
per capita 45 Hong Kong SAR2 Germany Canada
(US$ ‘000)
40 France
Japan
35
30 South Korea
Spain
25 Taiwan
20 China Tier 11
15
South Africa and Brazil have
10 BRAZIL lower/comparable income but
5 China SOUTH AFRICA higher spending than China
0
0 300 400 500 600 700 800 900 1,000 1,100 1,200 1,300 5,300
Private healthcare spending per capita (US$)
Source: EIU, Euromonitor, BMI, Hong Kong Food and Health Bureau; As of 2017
1. Tier 1 cities include Beijing, Shanghai, Guangzhou and Shenzhen. Private healthcare spending per capita assumed to mirror private vs. public hospital revenue trends in China
2. Private healthcare spending per capita assumed to mirror private vs. public hospital revenue trends in Hong Kong SAR 20TOP TRENDS IN THE CHINESE PUBLIC AND PRIVATE HOSPITAL SECTORS
TOP TRENDS IN THE PUBLIC HOSPITAL SECTOR TOP TRENDS IN THE PRIVATE HOSPITAL SECTOR
SCARCITY AND UNEVEN DISTRIBUTION OF QUALITY MEDICAL RESOURCES
Highly Fragmented Market
# of Annual Hospital Outpatient Visits (mm)
− Limited scaled players provide opportunity for a large,
Class III: Class III:
branded player like UFH
2,232 (8%) 1,628 (50%)
Class II: Class II:
7,944 (27%) 1,217 (37%) Lack of a Comprehensive Service Provider
Class I: Class I: − Most private hospital systems are focused on a single
9,282 (32%) 218 (7%) specialty / low acuity situations
Unrated: Unrated:
9,682 (33%) 207 (6%)
Brand Recognition and Reputational Issues
# of Hospitals in China
− Scarcity value as few players have both a strong
IMMENSE PRESSURE ON PUBLIC HEALTHCARE SYSTEM brand and reputation
3 hours 5 mins ~90%
Average time Actual time Average bed Willingness to Pay
to visit a spent in a occupancy − >80% of patients are willing to pay a premium to visit
physician physician rate in public
a private hospital
consultation hospitals
− Huge under supply of premium hospitals
EXPECTED DEFICIT OF THE BASIC SOCIAL MEDICAL INSURANCE
(RMB bn) 2020E 2026E
Private hospitals in China are facing challenges that present unique
Deficit is expected
to arise opportunities for a branded comprehensive player like UFH
(2,300)
Source: Frost & Sullivan, PwC survey on urban middle class Chinese, National Health and Family Planning Commission, Company Analysis; As of 2016
21AGING POPULATION AND COMMERCIAL HEALTHCARE INSURANCE ARE
KEY LONG TERM GROWTH DRIVERS OF HEALTHCARE SERVICES
RAPIDLY AGING POPULATION COMMERCIAL HEALTH INSURANCE GWP1 HIGH-END PHI2 ADDRESSABLE POPULATION
China population aged 65+ (Persons mm) (US$ bn)2 ('000)
400
CAGR CAGR
294 797 12-18 (%) 18-23 (%)
303
483 15% 15%
212
200
22%
155 343
15%
109 94 247
90 11% 240
59 179 28% 25%
7% 8%
131 183 314
139
23 106
13 103
25 40 64
0
2000A 2010A 2020E 2030E 2040E 2012A 2014A 2016A 2018E 2023E 2012A 2014A 2016A 2018E 2023E
China Population Aged 65+ (Persons mm) Tier 1 cities Tier 2 cities
Population Aged 65+ as % of Total Population
Source: United Nations, China Insurance Yearbook, CIRC, McKinsey Global Institute, Company Analysis
1. Include all local and foreign players. Health insurance GWP (gross written premium) includes premium sold by both life and P&C insurers
2. PHI = Private Health Insurance 22
3. Exchange rate at USD:RMB = 1.00 : 6.80THE LEADING COMPREHENSIVE HEALTHCARE SERVICES PROVIDER IN
CHINA
ONE OF THE LARGEST BY REVENUE MOST COMPREHENSIVE HEALTHCARE BROADEST GEOGRAPHIC COVERAGE
SERVICES OFFERING
◼ One of the largest multi-specialty healthcare ◼ Covering over 30+ specialties while major ◼ All 4 Tier 1 cities in China
services group peers1 only have 10-15 specialties ◼ Complementary strategic coverage in
◼ High entry barriers selective Tier 2 cities
2018A REVENUE2
(RMB mm)
PUBLICLY LISTED PRIVATE
Estimated revenue
contributions from new
facilities with pre-spent
Capex (~4-5x the size
of the existing mature
hospitals)
OB/GYN
Peds
Internal Medicine
23.2% General Surgery
Ortho
15.6% Family Medicine
5.5% 1,000 Other Specialties3
Existing facilities 2018A: 2,059 7.7% 924
7.1%
8.7%
77.7% 615 490(5)
16.6% ~90%
350
32.2%
83.4% ~90%
4.8%
17.5% ~10% ~10%
UFH Company A Company B Company C5 Company D Company E
Largest comprehensive
OB/GYN focus Peds focus OB/GYN and Peds OB/GYN and Peds Family Medicine
group
# of Tier 1 cities4 4 2 1 2 2 1
Market Capitalization (US$ mm)6 N/A 1986 212 N/A N/A N/A
Source: Company, Company Analysis
1. Major peers include Parkway Health, AmCare, HarMoniCare, American-Sino and New Century Healthcare 4. Refers to Beijing, Shanghai, Guangzhou and Shenzhen
2. Revenue and breakdown based on 2018A except for Company A (2018 annual report not released) 5. Includes Shanghai hospital revenue only 23
3. Other Specialties include Medical Aesthetic, Oncology, Dental, Neurology, and Emergency Medicine 6. As of Jul 29, 2019 except for Company A; Company A entered into stock suspension since Apr 1, 2019VALUE CREATION SUMMARY
24SUM-OF-THE-PARTS VALUATION: TODAY
Sum of the parts valuation of NFC post acquisition of UFH Acquisition Cost of UFH
68 ($0.5/share3) 2,091 ($14.9/share3)
(in US$ mm unless otherwise noted) 825 ($5.9/share3) 3
2
1,440 ($10.0/share)
1,198 ($8.5/share3)
1
Tier 2
Beijing, Shanghai Puxi
Expansion Assets SZ Mgmt. Contract SOTP Valuation PFMA Enterprise Value
Operating Assets (Tier 1)1 of NFC2
1 2 3
Operating Assets (BJ, SH Puxi, Tianjin, Rehab, Qingdao) Expansion Assets (Tier 1 only) SZ Mgmt Contract
• Valued at 16x 2020E Adjusted EBITDA of US$ 75mm • Valued at 5.8x Stabilized EBITDA of US$ 142mm (based off discounted • Valued at US$ 68mm (based
(RMB 589mm less 50% of HQ cost allocation) vs. 15-21x cash flow of Guangzhou, Pudong, BJ Datun and 50% of HQ cost off discounted cash flow of
2020E Adjusted EBITDA for regional healthcare service allocation since 2019 with 13% WACC and 16x terminal multiple) Shenzhen management
leaders with similar growth profile (reflecting 1 year of • Expansion assets will generate RMB 11mm revenue per bed at contract since 2019 with
ramp-up in new SH Puxi and no contribution from Qingdao) stabilization, comparing with RMB 13mm for BJ and RMB12 mm for SH 13% WACC and 16x
Puxi in 2018 terminal multiple)
Notes: 3. Assuming US$ 300mm net debt post transaction and 132mm total number of shares before accounting for
1. DCF includes 100mm outstanding investments in stabilized assets the exercise of 26.875 mm SPAC warrants
2. Fully diluted (including SPAC founder shares dilution) 25POTENTIAL TRANSACTION VALUE CREATION
$7.01$39.4 - $45.2/Share1
7 $4.0 -
$6.0 - $6.51
6
4 $3.5 - $4.01 5 $0.4 - $0.71
1
$3.5 - $4.01
3 $3.0 - $3.5
$9.0-$9.51 2
1
$10.0/Share1
UFH Operating Asset Expansion Asset Tier 2 City Other Call Option on Bolt-on Multiple UFH
Status Quo Organic Growth2 Organic Growth2 Expansion3 Initiatives4 Shenzhen Opco5 Acquisitions6 Re-Rating
Immediate Near-Term Medium-Term
1• Organic growth 2• Ramp-up of Tier 3• Management 4• Other Initiatives include 5• Call option 6• US$300-400 mm of 7 • Assume re-rating
from Tier 1 and 1 new assets contract model which continued expansion of exercised on the acquisitions done at to regional leader
Tier 2 existing (GZU, PDU and charges a fixed managed care business, Shenzhen Opco 10x LTM EBITDA multiple of 20x
assets in line with DTU) toUPSIDE CATALYSTS DELIVERING ADDITIONAL VALUE
◼ Scale more capital efficiently by using a combination
of lease/operated and managed contract model in ◼ Focus on increasing acuity services (robotics,
Tier 2 cities oncology, advance imaging) to drive ASP / margin
and create higher barriers to competitors
◼ Grow from 4 Tier 1 to 46 Tier 2 cities (in
partnership with strategic real estate developers) ◼ Continued investment in the AI and mobile
FULLY technology for data analytics, online consultation,
EXPLORE ◼ Establishing sub-brands to further broaden TECHNOLOGY risk underwriting, preventive care
POTENTIAL IN UFH’s outreach within the local population and UPGRADES
TIER 2 CITIES enhance UFH's brand equity
◼ Continue deep specialization in select areas but
maintain a comprehensive suite of services ◼ Roll out managed care network on the back of the
largest private provider system in China
◼ Grow IVF from Tianjin to nationwide
◼ Further spin-off of procurement, staffing and IT
◼ New centers of excellence: oncology, MANAGED service verticals as standalone businesses that
CLEAR
orthopedics, ENT, sleep center, geriatric CARE AND service 3rd parties
SPECIALTY
center, gynecology, advanced surgical, etc. OTHER
FOCUS
INITIATIVES
◼ Continue to replicate the successful hub & spoke
model from Beijing to nationwide ◼ Strategic acquisitions of specialty hospitals,
outpatient and services network to further
◼ Maximize clustering effects by setting up complement our existing portfolio
additional complementary services
◼ Management contracts include a right to acquire
ENHANCED Broaden our service suite though clinics and M&A
◼ managed hospitals
OUTPATIENT pharmaceutical services OPPORTUNITIES
NETWORK
27POTENTIAL ON TIER 2 CITY EXPANSION
Tier 1 Tier 2
# of cities 4 461
Population
72mm 339mm
GDP per Capita
RMB 149k RMB 99k
High-End Hospital Presence
More competition Limited competition
Current UFH Coverage
2019E Rev: RMB 2,218mm2 2019E Rev: RMB 257mm3 Current
15-19E CAGR: 13.8%2 15-19E CAGR: 40.7%3 Pipeline ◼ 4 MOU signed
Source: National Bureau of Statistics, Oxford Economics, McKinsey Global Institute, Company Analysis; As of 2017
1. Tier 2 cities are defined as cities with 2016 GDP (latest available consistent historical data in McKinsey Global Institute) from RMB 200-1500bn, in 2010 price
2. Tier 1 coverage includes 7 hospitals in Beijing (3) /Shanghai (2) /Guangzhou (1) /Shenzhen (1) and 11 clinics in Beijing (8), Shanghai (2), and Guangzhou (1)
3. Tier 2 coverage includes 2 hospitals in Tianjin (1) /Qingdao (1) and 3 clinics in Hangzhou (1) / Bo’Ao (1) / Wuxi (1). 28TECHNOLOGY INITIATIVES
29SOURCES & USES OF FUNDS
Illustrative Pro Forma Valuation Ownership
Post-Transaction
RMB1 USD Stake %
NFC IPO 22%
NFC Illustrative Share Price 68.00 10.00 NFC FPA 14%
(x) Pro Forma Shares Outstanding (mm) 2,3 132.0 132.0 NFC New Issuance3 43%
Fully Distributed Equity Value 8,979 1,320 NFC SPAC Dilution Management roll-over 9%
Plus: Pro Forma Net Debt 816 120 Management4,5 estimated ~85% of net value7 5%
held pre-transaction
Fully Distributed Enterprise Value 9,795 1,440 Fosun 7%
Total 100%
Uses of Funds Sources of Funds
Quantum Quantum % of
RMB1 USD RMB1 USD Total
Cash Proceeds to Vendors 7,902 1,162 Term Loan A3 2,040 300 20%
Cash to the Balance Sheet 1,020 150 NFC IPO 1,955 288 19%
Transaction Fees 204 30 NFC FPA6 1,292 190 13%
Total Cash Uses 9,126 1,342 NFC New Issuance3 $711 million of PIPE 3,839 565 38%
committed as of July 30th
Roll-over Equity 1,081 159 Roll-over Equity (subject to 25% scale back at 1,081 159 11%
Total Uses 10,207 1,501 Total Sources NFC’s discretion) 10,207 1,501 100%
Note:
1. Exchange rate at USD:RMB = 1.00 : 6.80 3. Depending on the outcome of trust account redemption and other considerations, NFC may increase initial primary capital or
2. Includes an estimated 59.7m shares held by NFC public and Forward Purchase Agreement investors reduce the debt drawdown by approximately US$ 100mm in total and increase the NFC new PIPE issued by approximately US$
(including 28.8mm public NFC shares, 11.9mm NFC Founder shares, 19.0 mm shares issued to FPA 100mm, which may increase total shares count to 142mm but will not impact the Fully Distributed Enterprise Value
investors), 15.9mm rollover shares issued to existing UFH shareholders, and at least 56.5mm shares issued 4. Management exercise ESOP plan using fully diluted basis
to PIPE investors; excluding NFC warrants, which are currently out-of-the-money; all share information 5. Subject to further confirmation with ESOP participants before closing, assuming full vesting of ESOP with a small portion of
throughout this presentation assumes no redemptions by public shareholders, assumes a US$10.00 per RSU & options rolling over to NFC RSU & options
share price for illustrative purposes and assumes conversion of the class B Founder Shares into Class A 6. FPA: Forward Purchase Agreement
common shares on a 1:1 basis in connection with the business combination 7. Value of management shares at US$10.0 less estimated income tax of ESOP vesting less repayment of company loan to
executives 30INVESTMENT HIGHLIGHTS
1 Robust outlook of the Chinese private healthcare industry supported by favorable long term secular drivers
2 The leading comprehensive healthcare services provider with the most reputable brand in China
3 Unique hospital + clinic hub & spoke network; “entire lifecycle” coverage
4 Well-established nationwide platform with scale and an experienced management platform
5 Attractive valuation on a sum-of-the-parts basis
6 Multi-dimensional growth opportunities
7 Substantial platform synergies with New Frontier led by a proven management team
31APPENDIX A – FINANCIALS & BENCHMARKING
32SUBSTANTIAL INVESTMENTS HAVE BEEN MADE FOR FUTURE EXPANSION
Area Bed in Use
GFA (sqm) 2015A 2016A 2017A 2018A 2019E 2020E 2021E 2022E 2023E 2024E
Operating Assets
Beijing (incl. Clinics)1 24,504 78 83 84 91 93 93 95 95 97 97
2
Shanghai Puxi (incl. Clinics) 21,769 36 39 41 41 71 71 80 80 90 90
Tier 2 (TJ, QD, Rehab)3 48,420 99 120 130 142 156 167 194 194 214 214
Sub-total 94,693 213 241 255 274 320 331 369 369 401 401
Expansion Assets (Tier 1)
Guangzhou (incl. Clinics)4 70,607 - - - 105 105 105 120 120 140 140
Shanghai Pudong 28,471 - - - 85 85 85 100 100 100 100
Beijing Datun 22,834 - - - - - 62 62 80 90 100
Shenzhen (mgmt. contract)5 64,000 - - - - - - 100 150 150 150
Sub-total 185,912 - - - 190 190 252 382 450 480 490
Total 280,605 213 241 255 464 510 583 751 819 881 891
Notes:
1. Includes 16,532 sq.m. from Beijing Hospital and 7,972 sq.m. from Beijing Clinics. Beijing Clinics expanded from 6,887 sq.m. to 7,972 sq.m. in 2015 with the opening of 2 new clinics
2. Total GFA of Shanghai Puxi (incl. clinics) was 5,900 sq.m. until 2018. Shanghai Puxi (incl. clinics) underwent an expansion to reach a total GFA of 21,769 sq.m. in 2019
3. Consists of Tianjin with a total GFA of 6,900 sq.m., Beijing Rehab with a total GFA of 11,520 sq.m. and Qingdao (opened in 2015) with a total GFA of 20,000 sq.m. (with 10,000 sq.m. more capacity in building B)
4. Guangzhou expanded its total GFA from 648 sq.m. in 2017 (consisting only of Guangzhou Clinic) to 70,607 sq.m. in 2018 following the opening of its Guangzhou Hospital
5. Shenzhen facility is currently estimated to have approximately 250-350 beds and will initially be operated under a management contract model
33REVENUE SUMMARY (EXCL. M&A)
Revenue Breakdown (RMB mm)
15-18A 18-20E 18-24E
2015A 2016A 2017A 2018A 2019E 2020E 2021E 2022E 2023E 2024E
CAGR CAGR CAGR
Operating Assets See Appendix P44 for back-up
Beijing (incl. clinics) 751 962 1,064 1,168 1,304 1,423 1,542 1,656 1,773 1,899 15.8% 10.4% 8.4%
1
Shanghai Puxi (incl. clinics) 496 508 495 492 531 682 792 882 976 1,076 (0.2%) 17.7% 13.9%
Tier 2 (TJ, QD, Rehab) & Other Assets2 102 150 207 305 374 461 539 612 684 753 44.2% 23.0% 16.3%
Sub-total 1,348 1,620 1,766 1,965 2,209 2,566 2,873 3,150 3,433 3,727 13.4% 14.3% 11.3%
Expansion Assets (Tier 1)
Expansion (GZ3, SH Pudong, BJ Datun) 42 50 59 97 285 526 786 1,053 1,340 1,641 32.1% 133.3% 60.3%
Shenzhen (mgmt. contract) - - - - 5 9 14 12 24 40
Sub-total 42 50 59 97 290 535 800 1,065 1,364 1,681 32.1% 135.2% 61.0%
Others
Expansion Assets (Tier 2)4 5 6 3 (3) 2 15 30 47 67 88
Total 1,395 1,675 1,828 2,059 2,501 3,116 3,704 4,262 4,863 5,496 13.8% 23.0% 17.8%
Revenue per Bed (RMB mm)
Operating Assets
Beijing (incl. clinics) 9.6 11.6 12.7 12.8 14.0 15.3 16.2 17.4 18.3 19.6 10.0% 9.2% 7.3%
Shanghai Puxi (incl. clinics) 13.8 13.2 12.1 12.0 7.5 9.6 9.9 11.0 10.8 12.0 (4.5%) (10.5%) (0.1%)
Tier 2 (TJ, QD, Rehab) & Other Assets 1.0 1.3 1.6 2.1 2.4 2.8 2.8 3.2 3.2 3.5 27.8% 13.4% 8.6%
Sub-total 6.3 6.7 6.9 7.2 6.9 7.8 7.8 8.5 8.6 9.3 4.2% 4.0% 4.4%
Expansion Assets (Tier 1)
Expected 10-12mm
Expansion Assets (Tier 1)5 - - - 0.5 1.5 2.1 2.8 3.5 4.1 4.8 RMB revenue per bed 45.5%
Notes: at stabilization6
1. Shanghai Puxi's historical revenue growth was limited by capacity constraints and out of date infrastructure (only 5,900 sq.m. GFA incl. clinics). Shanghai Puxi will operate in a new, expanded complex (~1km from our existing
complex) from the end of Q2 / beginning of Q3 2019
2. Other Assets include Bo’Ao Clinic, Hangzhou Clinic and Yuesao (post partum care worker) business
3. Prior to Guangzhou Hospital's opening in 2018, Guangzhou consisted of 1 clinic with a total GFA of 648 sq.m.
4. Expansion assets (Tier 2) include HQ
5. Expansion Assets' Revenue Per Bed excludes Shenzhen (mgmt. contract). Shenzhen (mgmt. contract) revenues are derived from fixed branding and management fees as a % of hospital revenues
6. Represent asset performance once it reaches a level of revenue per bed similar to Beijing and Shanghai in 2018 34ADJUSTED EBITDA SUMMARY (EXCL. M&A)
1
Adjusted EBITDA Breakdown (RMB mm)
15-18A 18-20E 18-24E
2015A 2016A 2017A 2018A 2019E 2020E 2021E 2022E 2023E 2024E
CAGR CAGR CAGR
Operating Assets Reflected double rental payment in Shanghai Puxi hospital (for both old and new sites) during 2018 and 2019
Beijing (incl. clinics) 117 257 282 310 345 371 402 430 461 494 38.4% 9.5% 8.1%
2
Shanghai Puxi (incl. clinics) 141 157 140 126 130 176 212 238 263 288 (3.7%) 18.0% 14.7%
Tier 2 (TJ, QD, Rehab) & Other Assets3 (91) (48) (36) (9) (6) 42 79 103 126 147
Sub-total 167 366 386 426 469 589 694 771 851 928 36.6% 17.5% 13.8%
Expansion Assets (Tier 1) US$ 75mm Adjusted EBITDA for Operating Assets after allocating 50% HQ expense
Expansion (GZ, SH Pudong, BJ Datun)4 5 8 (52) (177) (167) (55) 57 164 271 384
Shenzhen (mgmt. contract) - - - - 5 9 14 12 24 40
Sub-total 5 8 (52) (177) (162) (46) 71 177 295 425
Others
Expansion Assets (Tier 2)5 - - - - - 9 20 32 45 60
6
HQ (116) (130) (147) (140) (168) (160) (160) (168) (176) (185) 6.6% 6.8% 4.8%
Total 57 244 187 110 140 392 625 812 1,014 1,227 24.6% 89.1% 49.6%
Adjusted EBITDA Margin (%)
Operating Assets Adjusted EBITDA margin impacted by double rent for Shanghai Puxi Hospital (for both old and new sites) during 2018 and 2019
Beijing (incl. clinics) 15.5% 26.8% 26.5% 26.5% 26.5% 26.1% 26.1% 26.0% 26.0% 26.0%
Beijing (hospital only excl. clinics) 14.0% 27.3% 28.7% 30.2% 30.0% 29.2% 29.0% 28.6% 28.6% 28.4%
Shanghai Puxi (incl. clinics) 28.5% 30.9% 28.2% 25.6% 24.5% 25.7% 26.8% 27.0% 27.0% 26.8%
Tier 2 (TJ, QD, Rehab) & Other Assets (89.2%) (32.2%) (17.3%) (3.1%) (1.6%) 9.2% 14.7% 16.9% 18.5% 19.5%
Sub-total 12.4% 22.6% 21.9% 21.7% 21.2% 22.9% 24.2% 24.5% 24.8% 24.9%
Expansion Assets (Tier 1) Expected 25-30% adj. EBITDA
Expansion (GZ, SH Pudong, BJ Datun)7 12.5% 15.7% (88.7%) (182.6%) (58.6%) (10.4%) 7.2% 15.6% 20.2% 23.4% margin at stabilization8
Overall 4.1% 14.6% 10.2% 5.3% 5.6% 12.6% 16.9% 19.0% 20.9% 22.3%
Notes:
1. Reconciliation of historical Adjusted EBITDA to net income / (loss) can be referred in Appendix D. Adj. EBITDA (excl. loss from expansion assets) excludes Guangzhou / Pudong / Datun in 2019; excludes
Pudong / Datun in 2020; and excludes Datun only in 2021;
2. Shanghai Puxi's historical Adj. EBITDA growth was limited by capacity constraints (only 5,900 sq.m. GFA incl. clinics) and infrastructure limitations relative to patient volumes
3. Other Assets include Bo’Ao Clinic, Hangzhou Clinic and Yuesao (post partum care worker) business
4. Prior to Guangzhou Hospital's opening in 2018, Guangzhou consisted of 1 family health clinic
5. Expansion assets (Tier 2) doesn’t include HQ
6. HQ loss is evenly allocated between operating assets and expansion assets
7. Expansion Assets Adjusted EBITDA margin excludes Shenzhen (mgmt. contract). Shenzhen (mgmt. contract) revenues are derived from fixed branding and management fees as a % of hospital revenues 35
8. Represent asset performance once it reaches a level of revenue per bed similar to Beijing and Shanghai in 2018HOSPITALS: LONG TERM MATURITY CYCLE
1,000
Hospital Revenue BJU (26,596 sqm)
950 (mm RMB)
900
850
800
750
700
650
600
550
500 SHM (5,900 sqm)
450
400 SH hospital is the smallest hospital
350 (4,131 sqm) and has been struggling
to take on additional patient volume
300 and develop higher acuity services
250
200
150 GZM (70,607 sqm) May-19 (Month 81) Run Rate Revenue2 (RMB 173mm)
TJU (6,900 sqm)
100 Rehab (11,520 sqm)
PDU (28,471 sqm) May-19 (Month 61) Run Rate Revenue2 (RMB 111mm)
50 QDU (30,000 sqm)
0
1997 1998 1999 2000 2001 2002 2003 2004 2005 2006 2007 2008 2009 2010 2011 2012 2013 2014 2015 2016 2017 2018
Source: Company (Unaudited)
1 Since the hospital obtained its OB license
2 Run-rate revenue is defined as monthly revenue * 12 36BENCHMARKING ANALYSIS
2015A-2018A REVENUE CAGR (%)
China Leaders Ex-China Regional Leaders
Average: 13.6% Average: 49.7% Average: 8.1%
63.1%3
3
36.3%
6
13.8% 13.4% 5
17.0%
8.4% 7.6% 6.0%
1.5%
1
UFH All UFH Operating Aier Eye Hospital Jinxin Fertility 4 IHH Bangkok Dusit Raffles Medical Bumrungrad Apollo Hospitals
Assets 1,2 Medical Group Hospital
Est. Organic growth Est. M&A
2018A-2020E REVENUE CAGR (%)
China Leaders Ex-China Regional Leaders
Average: 18.7% Average: 40.1% Average: 10.6%
51.7%3
3
28.4%
23.0% 5
14.3% 14.8% 14.1% 12.9%
7.9%
3.1%
UFH All1 UFH Operating Aier Eye Hospital Jinxin Fertility IHH Bangkok Dusit Raffles Medical Bumrungrad Apollo Hospitals
Assets 1,2 Medical Group Hospital
Est. Organic growth Est. M&A
Source: FactSet and company disclosures as of Jul 29, 2019
1. UFH's historical growth has all been derived from organic growth from its own hospitals
2. Operating asset Revenue includes other assets (i.e. Bo’Ao clinic, Hangzhou Clinic, Yuesao (post partum care worker) business and asset light business)
3. Estimated breakout of organic growth and M&A growth
4. Historical revenue CAGR represents 2016-2018 CAGR as previous financial data is not available
5. Adjusted to exclude IHH's acquisition of Global Hospitals in 2015 37
6. Apollo Hospitals underwent a large capacity expansion project between 2015 and 2018 and also acquired Nova Specialty Hospitals (11 hospitals in total) in Jan 2015BENCHMARKING ANALYSIS (CONT’D)
2015A-2018A Adjusted EBITDA CAGR (%)
China Leaders Ex-China Regional Leaders
Average: 30.8% Average: 54.0% Average: 5.6%
3
69.5%
3
36.7% 38.4%
24.8%
5
5.0% 6.5% 3.1% 5.5% 8.0%
1
UFH All UFH Operating Aier Eye Hospital Jinxin Fertility 4 IHH Bangkok Dusit Raffles Medical Bumrungrad Apollo Hospitals
Assets 1,2 Medical Group Hospital
Est. Organic growth Est. M&A
2018A-2020E Adjusted EBITDA CAGR (%)
China Leaders Ex-China Regional Leaders
88.8% Average: 53.2% Average: 41.9% Average: 10.8%
58.1%
3
25.6%
17.5% 19.0% 18.6%
9.5% 5.5%
1.6%
1
UFH All UFH Operating Aier Eye Hospital Jinxin Fertility IHH Bangkok Dusit Raffles Medical Bumrungrad Apollo Hospitals
Assets 1,2 Medical Group Hospital
Est. Organic growth Est. M&A
Source: FactSet and company disclosures as of Jul 29, 2019
1. UFH's historical growth has all been derived from organic growth from its own hospitals
2. Operating asset EBITDA includes other assets (i.e. Bo’Ao clinic, Hangzhou Clinic, Yuesao (post partum care worker) business and asset light business)
3. Breakout of organic growth and M&A growth based on company estimates
4. Historical adjusted EBITDA CAGR represents 2016-2018 CAGR as previous financial data is not available 38
5. Adjusted to exclude IHH's acquisition of Global Hospitals in 2015BENCHMARKING ANALYSIS (CONT’D)
2018A Adjusted EBITDA MARGIN (%)
China Leaders Ex-China Regional Leaders
Average: 13.5% Average: 32.1% Average: 21.6%
38.5%
32.8%
25.7%
21.7% 21.5% 22.1% 20.8%
10.8%
5.3%
6
UFH All UFH Operating Aier Eye Hospital Jinxin Fertility IHH Bangkok Dusit Raffles Medical Bumrungrad Apollo Hospitals
Medical Group Hospital
NUMBER OF HOSPITALS1
China Leaders Ex-China Regional Leaders
Ramp- up
Hospitals2 53 04 05 5 N/A 2 0 4
94 4
83
47 43
9 75 3 2
UFH All Aier Eye Hospital Jinxin Fertility IHH Bangkok Dusit Raffles Medical Bumrungrad Apollo Hospitals
Medical Group Hospital
Source: FactSet and company disclosures as of Jul 29, 2019
1. Exclude clinics 4. Include Aier Hospitals within the listed entity only. Ramp-up hospitals are kept outside of the listed entity until stabilized
2. Define ramp up hospital as hospitals with less than 3 years of operating history or still in pipeline 5. Including facility under management and in the US
6. UFH Operating asset Adjusted EBITDA margin calculation doesn’t include other assets (i.e. Bo’Ao clinic, Hangzhou Clinic,
3. UFH ramp up hospitals include Pudong, Guangzhou, Datun, New Puxi and Shenzhen (under
management contract) Yuesao (post partum care worker) business and asset light business)
39BENCHMARKING ANALYSIS (CONT’D)
EV/REVENUE
TEV = US$ 1.44bn China Leaders Ex-China Regional Leaders
2019E Average: 9.7x 2019E Average: 4.3x
2020E Average: 7.9x 2020E Average: 3.9x
2021E Average: 6.2x 2021E Average: 3.6x
10.3x
9.1x 8.6x
7.2x 7.2x
6.3x 6.0x 5.8x
5.1x 4.5x 4.1x 5.0x 4.6x
3.9x 3.7x 4.2x 3.6x 3.0x
3.1x 2.6x 2.6x 2.1x 1.9x 1.6x
UFH All Aier Eye Hospital Jinxin Fertility IHH Bangkok Dusit Raffles Medical Bumrungrad Apollo Hospitals
Medical Group Hospital
2019E 2020E 2021E
EV/Adjusted EBITDA
TEV = US$ 1.44bn China Leaders Ex-China Regional Leaders
2019E Average: 31.6x 2019E Average: 19.8x
70.1x
2020E Average: 24.8x 2020E Average: 18.0x
2021E Average: 18.5x 2021E Average: 15.9x
36.3x
29.0x 27.0x
25.0x 25.1x 22.1x 20.3x
18.5x 20.7x 20.6x 20.0x 17.8x 18.4x 19.8x 18.4x 18.7x 17.5x 16.5x 18.6x 15.8x
15.7x 13.4x 16.3x 16.0x 15.2x 13.5x
UFH All UFH (excl. Losses Aier Eye Hospital Jinxin Fertility IHH Bangkok Dusit Raffles Medical Bumrungrad Apollo Hospitals
from Expansion Medical Group Hospital
Assets)
2019E 2020E 2021E
Source: FactSet consensus estimates as of Jul 29, 2019
1. UFH (excl. losses from new assets)'s multiples are calculated based on Adjusted EBITDA of UFH excluding losses from expansion assets (i.e. excludes Guangzhou / Pudong / Datun in 2019; excludes Pudong / Datun in
2020; and excludes Datun only in 2021) with allocation of 50% HQ cost 40You can also read