THE BITCOIN MINING NETWORK Trends, Average Creation Costs, Electricity Consumption & Sources - CoinShares
←
→
Page content transcription
If your browser does not render page correctly, please read the page content below
CoinShares Research

THE BITCOIN
MINING NETWORK
Trends, Average Creation Costs,
Electricity Consumption & Sources
JUNE 2019 UPDATE
Foreword

The Bitcoin mining industry is opaque, mysterious and misunderstood, but the health of the network
supporting Bitcoin through mining is critical—vital actually—to the protocol. There is a lot of talk about
investing in Bitcoin, trying to build a parallel financial system atop Bitcoin, using Bitcoin for payments or a
safe-haven store of value, but there’s not enough attention paid to securing the underlying network.
Despite its outsized importance, there are serious questions around mining that have not been answered.
Bitcoiners yearn for decentralization, but mining is still relatively centralized. To reach the decentralized
future we all hope Bitcoin can achieve, and to understand Bitcoin at all, we need to understand the
Bitcoin mining ecosystem. The need for adequate research in the Bitcoin mining network is imperative,
but also no small feat. Collecting data points, trends, and estimates on the dynamics and economics of
mining is nearly impossible without extensive, on-the-ground research. In such a secretive space,
CoinShares stands out for their in-depth research on this topic.
At Fidelity’s Center for Applied Technology, we believe the future of financial services will take place on
open and permissionless ledgers like Bitcoin, but to truly understand the space requires rolling up your
sleeves and diving deep into the technology. To understand Bitcoin mining, we knew we had to mine
ourselves. Since the inception of our mining efforts in 2016, we have taken this “learn by trying”
approach. As soon as we set up our first miners in a small shop at our office, we realized the mining
industry is in a state of constant change. Over the past year, we have expanded our mining efforts to
ramp up our knowledge of the space. We have explored optimal locations, hardware procurement, mining
farm setups, and the economics of the mining industry as a whole.
Two interesting developments covered in the report are the insolvency of mining companies during the
bear market and new trends in mining hardware manufacturing. It seems that every time we examine
mining, we find ourselves on a new frontier, with miners and manufactures uncovering new ways to
optimize and compete.
But the more things change, the more they stay the same. As CoinShares continues to highlight, chasing
down the cheapest power remains the cornerstone of capturing competitive edge in Bitcoin mining.
Power is the single complexity of the mining ecosystem that can be controlled or confined. You may not
be able to control hashrate, price, or hardware costs/specs, but locking yourself into an advantageous
electricity contract will allow for flexibility and profitability.
Mining is a profit-driven competition, but its most important function is securing the Bitcoin network.
Anyone seeking to a build business around Bitcoin or investing in its long-term value proposition has an
incentive to maintain the integrity of the Bitcoin network. So, as you hunt for nonces, we encourage
miners to remember their utmost goal—securing Bitcoin for the future. The better we all understand the
mining industry through cooperation and transparency, the stronger Bitcoin will be.

Amanda Fabiano
Fidelity Center for Applied Technology

                                                       1
The Bitcoin Mining Network
- Trends, Composition, Average Creation Cost,
Electricity Consumption & Sources
Christopher Bendiksen & Samuel Gibbons
CoinShares Research
research@coinshares.co.uk
Note: this white paper is provided subject to acceptance of the conditions contained on page 18.
Abstract
In this report we investigate the geographical distribution, composition, efficiency, electricity
consumption and electricity sources of the Bitcoin mining network. We also investigate trends in
hashrate, hardware costs, hardware efficiency and marginal creation costs. Among our findings is an
estimate that since November, the market-average, all-in marginal cost of creation, at ¢5/KWh, and 18-
month depreciation schedules has decreased from approximately $6,800 to approximately $5,600, mainly
as a result of lower assumed cooling and overhead costs. This suggests that, at current prices, the
average miner is highly profitable, with even older gear and high-cost producers currently able to make
positive ROI. Furthermore, we show that Bitcoin mining is mainly located in global regions where there are
ample supplies of renewable electricity available. And finally, we calculate a conservative estimate of the
renewables penetration in the energy mix powering the Bitcoin mining network at 74.1%, making Bitcoin
mining more renewables-driven than almost every other large-scale industry in the world.
Introduction
Here in the third iteration of our bi-annual mining (31 May 2019) prices and 30d average fees per
report we continue our ongoing observations and block, Bitcoin miners are earning an estimated
analysis regarding the state of the Bitcoin mining total annualised return of $6.2bn per year, 94%
network. From this report and onwards we will of which come from new coins and 6% from fees.
discontinue any explanatory treatment of mining
The recent increase in the ratio of mining fees as
as a concept and focus entirely on results. For
a component of the block reward is an interesting
readers wanting to familiarise themselves with—
development and certainly a welcome
or revisit—the fundamentals and economics of
development for miners, particularly considering
the Proof-of-Work (PoW) mining utilised in
the upcoming halving of the block reward, now
Bitcoin, we recommend the following sources [1]
less than a year away.
[2] [3] [4].
Network Development
Bitcoin’s PoW miners continue to dominate the
cryptocurrency mining industry both in terms of Since our last report of November 2018, the
total revenue and total security spend. According hashrate has grown from approximately 40 EH/s
to data from CoinMarketcap.io, over the course of to approximately 50 EH/s, an increase of 25%.
2018, Bitcoin miners received an estimated During this period the Hashrate grew slower than
$5.5bn in total block rewards, $5.2bn (97%) of the 10-year average [Figure 3], but in line with
which was newly minted coins, and $300m (3%) the five-year average (the beginning of which—
of which were transaction fees. At current 2014, marks the beginning of the industrial
2 31 May 2019mining era). Bitcoin prices.
The 6 months passed can be roughly divided into Returning to the second era of our 6-month
two major eras: the final drop and subsequent observation period, we believe the recent spike in
bottoming-out of the hashrate—coinciding with hashrate is caused by two separate drivers: 1) The
the capitulation-phase of the Bitcoin price curve, re-starting of much of the previously shuttered
and; the return to growth and near-full-recovery mining gear as the Bitcoin price recovery has
of the hashrate—coinciding with the recent rally caused even previous-generation mining units to
in Bitcoin prices and the onset of the wet season become cashflow positive at commonly
in South-Western China. Meanwhile, Bitcoin attainable wet-season electricity prices, and; 2)
prices have more than doubled from around Deployment of next-generation mining gear at
$4,000 to $8,500 which has taken some appreciable scale, predominantly in Sichuan, in
pressure off the highest cost miners. line with the advent of the wet-season. The
efficiency and dollar cost per TH/s both keep
During the same period, we have observed two
improving in line with the five-year trends
substantial macro trends, coinciding with the two
[Figures 1 and 2]. These efficiency gains are
above inter-period eras: 1) A large number of
contributing to a current all-time high of mining
bankruptcies, liquidations and ownership
efficiency of 11.5 GH/J, up from 10.5 GH/J in
transfers of mining units, often to more well-
November 2018 (+10%).
situated and capitalised miners whose new
capital stock has been acquired at a much lower We also note some jurisdictional developments
cost basis than their previous owners, and; 2) The in North America with consequences for local
first at-scale deployment of the latest generation miners. In Oregon, miners have been facing
mining gear. unwelcome treatment both by local governments
and electricity providers, leading to a mass
It is also worth noting that the ~40% drop in
exodus of miners from the state. On the other
hashrate observed at the tail-end of 2018
side of the US-Canada border, however, previous
represents the first time we have ever observed a
negative signals towards the industry from both
substantial and prolonged drop in hashrate as a
governments and Hydro Quebec now seem to
result of sustained large-scale corrections in the
have reversed with both added clarity from
Bitcoin price. As we explained in our Medium
regulators and less hostility towards miners on
commentary at the time [3], this would not lead
the part of utility providers.
to a mining death-spiral. On the contrary, the
system acted exactly in accordance with its Lastly, we will briefly touch on the never-ending
design, with the difficulty lowering perfectly in- topic of Chinese mining trends. Over the last few
line with the hashrate reduction, decreasing years we have observed a steady trend of
mining costs in accordance with the reduced reduction of Chinese geographical dominance
Figure 1: Hardware Efficiency Figure 2: Hardware Cost Figure 3: Total Estimated
(GH/J) vs Shipping Date ($/TH/s) vs Shipping Date Bitcoin Hashrate (EH/s)
Sources: Bitcoin Wiki (May 2018), Sources: Bitcoin Wiki (May 2018), Sources: blockchain.com (May 2019),
CoinShares Research (May 2019) CoinShares Research (May 2019) CoinShares Research ( May 2019)
3 31 May 2019among Bitcoin miners. However, this latest 6- and brand new next-generation gear (potentially
month period has offered little evidence of that enabling depreciation over 2-3 years) are able to
trend continuing at its previous rate. While it is mine Bitcoin at less than $3,500/btc [Table 3].
too soon to make any judgement about whether This combination of circumstances becomes even
or not the general trend is abating, we offer it as more powerful if the miner has access to
an interesting observation amid the current preferential pricing on their mining gear, such as
industry conditions. miner-manufacturers [Tables 1 & 2]. Please see
page 4 of our May 2018 report for a more detailed
On the other hand, Chinese dominance in the
discussion of our modelling methodology [6].
hardware manufacturing sector remains as
strong as ever and is showing no immediate Considering the recent relief rally in Bitcoin
signs of reduction. Even if the most damning prices, we believe the mining industry is currently
rumours of Bitmain’s struggles were true (we highly profitable, with both previous-generation
have our doubts), it would have minimal impact hardware—though only at relatively cheap
on Chinese dominance in the miner electricity costs (¢5/kWh)—currently able to generate a
positive ROI [Figure 4].
Then there is the ongoing uncertainty of Chinese
government policy towards miners, latest We also note that as a result of the collapse in
exemplified by an official note of increased secondary market pricing of mining gear, and
scrutiny of mining [5]. This note caused large ownership turnover during late-2018 to
customary panic in western media, but seem to early-2019, the capex component of the total
have had little actual impact on Chinese miners. market-average creation cost (at ¢5/kWh and 18-
It is important to note that Chinese miners month depreciation schedule) has fallen from
already operate in a legal grey area, with large 53% at the time of our November 2018 report, to
differences in treatment between local 38% at the time of writing. The two other
jurisdictions, and that concrete, large-scale components are Hashing Electricity Opex at 54%
coordinated action on the ground would likely be and Cooling and Other Opex (C&O Opex) at 8%.
required to effectively uproot miners. We also Average Cashflow Breakeven Levels
note that there appears to exist significant
The other important cost level to consider is the
differences between local and national
cashflow breakeven level. As we have detailed in
treatments of the mining industry, with certain
our previous work (3), this level is critical for
local governments seemingly much more inclined
to view the industry positively due to its vigorous estimating the price level below which the
average miner would have to start shutting down
revenue generation on municipal levels. With the
his mining equipment. While ROI breakeven
exception of some miners rumoured to be
levels are also important, sustained prices below
‘unwelcome’ in Inner Mongolia and Xinjiang
such levels only wipe out miner capital, causing
during last year’s dry-season, national-level
Chinese policy restrictions on mining—at least changes in industry ownership ratios over time,
whereas prices below cashflow breakeven levels
thus far—seems to be much less of an issue ‘on
cause immediate hashrate reductions.
the ground’ than we assume in the West.
Our estimate for the current market-average
Average All-In Creation Cost (ROI Breakeven Level)
cashflow breakeven at ¢5/kWh and 15%
As is customary we calculate and present our additional C&O Opex is $3,300, up from $3,000 in
current estimates of market-wide average November 2018. We attribute this increase
creation costs [Tables 1 – 5]. Our current estimate mainly to the ~25% increase in total hashrate,
at ¢5/KWh and 18-month capex depreciation now tempered by the ~10% increase in mining gear
stands at approximately $5,600 versus $8,500 in efficiency. We also caution that our model
November [Table 3]. Also observable in the table, operates on the basis of hashrate, not difficulty,
we see that certain segments of miners— meaning that it will tend to overestimate cash
particularly those with that highly coveted (and ROI) costs in times of hashrate growth and
combination of very cheap electricity (~¢3/kWh) underestimate it in times of hasrate reduction.
4 31 May 2019Table 1: Market-Wide Creation Cost (US$/BTC) at 15% C&O OPEX and -50% Below Standard CAPEX Assumption
-50% CAPEX
+15% C&O OPEX CAPEX Horizon (Depreciation Schedule)
Electricity OPEX 30 Months 24 Months 18 Months 12 Months 6 Months
0.01 $/kWh 1,344 1,516 1,803 2,377 4,100
0.03 $/kWh 2,653 2,826 3,113 3,687 5,409
0.05 $/kWh 3,963 4,135 4,422 4,996 6,719
0.07 $/kWh 5,272 5,445 5,732 6,306 8,028
0.09 $/kWh 6,582 6,754 7,041 7,615 9,338
Source: CoinShares Research (May 2019)
Table 2: Market-Wide Creation Cost (US$/BTC) at 15% C&O OPEX and -25% Below Standard CAPEX Assumption
-25 CAPEX
+15% C&O OPEX CAPEX Horizon (Depreciation Schedule)
Electricity OPEX 30 Months 24 Months 18 Months 12 Months 6 Months
0.01 $/kWh 1,688 1,947 2,377 3,238 5,822
0.03 $/kWh 2,998 3,256 3,687 4,548 7,132
0.05 $/kWh 4,307 4,566 4,996 5,857 8,441
0.07 $/kWh 5,617 5,875 6,306 7,167 9,751
0.09 $/kWh 6,926 7,185 7,615 8,477 11,060
Source: CoinShares Research (May 2019)
Table 3: Market-Wide Creation Cost (US$/BTC) at 15% C&O OPEX at the Standard CAPEX Assumption
Standard CAPEX Assumption
+15% C&O OPEX CAPEX Horizon (Depreciation Schedule)
Electricity OPEX 30 Months 24 Months 18 Months 12 Months 6 Months
0.01 $/kWh 2,033 2,377 2,951 4,100 7,545
0.03 $/kWh 3,342 3,687 4,261 5,409 8,854
0.05 $/kWh 4,652 4,996 5,570 6,719 10,164
0.07 $/kWh 5,961 6,306 6,880 8,028 11,473
0.09 $/kWh 7,271 7,615 8,189 9,338 12,783
Source: CoinShares Research (May 2019)
Table 4: Market-Wide Creation Cost (US$/BTC) at 15% C&O OPEX and +25% Above Standard CAPEX Assumption
+25 CAPEX
+15% C&O OPEX CAPEX Horizon (Depreciation Schedule)
Electricity OPEX 30 Months 24 Months 18 Months 12 Months 6 Months
0.01 $/kWh 2,377 2,808 3,526 4,961 9,267
0.03 $/kWh 3,687 4,117 4,835 6,270 10,577
0.05 $/kWh 4,996 5,427 6,145 7,580 11,886
0.07 $/kWh 6,306 6,736 7,454 8,889 13,196
0.09 $/kWh 7,615 8,046 8,764 10,199 14,505
Source: CoinShares Research (May 2019)
Table 5: Market-Wide Creation Cost (US$/BTC) at 15% C&O OPEX and +50% Above Standard CAPEX Assumption
+50 CAPEX
+15% C&O OPEX CAPEX Horizon (Depreciation Schedule)
Electricity OPEX 30 Months 24 Months 18 Months 12 Months 6 Months
0.01 $/kWh 2,722 3,238 4,100 5,822 10,990
0.03 $/kWh 4,031 4,548 5,409 7,132 12,299
0.05 $/kWh 5,341 5,857 6,719 8,441 13,609
0.07 $/kWh 6,650 7,167 8,028 9,751 14,918
0.09 $/kWh 7,960 8,477 9,338 11,060 16,228
Source: CoinShares Research (May 2019)
5 31 May 2019Table 6: Market-Wide Average Cashflow Breakeven Levels
Additional Cooling & Other (C&O) OPEX
Electricity OPEX 5% 10% 15% 20% 25%
0.01 $/kWh 598 626 655 683 712
0.03 $/kWh 1,793 1,879 1,964 2,050 2,135
0.05 $/kWh 2,989 3,131 3,274 3,416 3,558
0.07 $/kWh 4,185 4,384 4,583 4,783 4,982
0.09 $/kWh 5,380 5,637 5,893 6,149 6,405
Source: CoinShares Research (May 2019)
Electricity Draw block reward (new coins plus fees), minus a
competitive margin. This means that increasing
As of the time of writing, we estimate the total
the efficiency of mining gear has no impact on
electricity draw of the entire Bitcoin mining
the total electricity draw of the network, it can
industry to be approximately 4.7 GW. This is the
only increase the hashrate per unit of electricity
same estimate as in November 2018, but
consumed. Over the long term, it is only the value
includes a caveat. In our last report we estimated
of the block reward that can impact the
that miners on average used 20% additional
network’s total electricity draw.
electricity—on top of that required by hashing—
for cooling. We now understand that estimate to Geographical Distribution of Miners
be grossly overstated and have reduced it to 10%.
Bitcoin miners are fairly well distributed across
Meanwhile, the current amount of energy
the globe [Figure 6], however they do have a
required for hashing alone is estimated to be
significant tendency to cluster into certain similar
~4.3 GW, up from 3.9 GW in November 2018. This
geographies. Looking more closely at their
result is also broadly in line with a ~25% increase
distribution, it is clear that they are
in hashrate and a ~10% increase in gear
predominantly—by volume weight—confined to
efficiency. On an annualised basis, we estimate
technologically advanced, relatively sparsely
that the network currently draws the equivalent
populated, hilly or mountainous regions
of ~41 TWh.
traversed by powerful rivers.
It is worth mentioning here that as a general
Among these regions we find the major mining
principle, the Bitcoin mining network will
centres of: Washington and New York States in
consume as much electricity as the market is
the United States; British Columbia, Alberta,
willing to sell it in return for the total value of the
Newfoundland and Labrador, and Quebec
Figure 4: Sensitivity of Marginal Creation Cost to Figure 5: Sensitivity of Marginal Creation Cost to
Electricity OPEX and CAPEX Horizon CAPEX Assumption Size and CAPEX Horizon at
0.05 $/kWh
Source: CoinShares Research (May 2019) Source: CoinShares Research (May 2019)
6 31 May 201931 May 2019
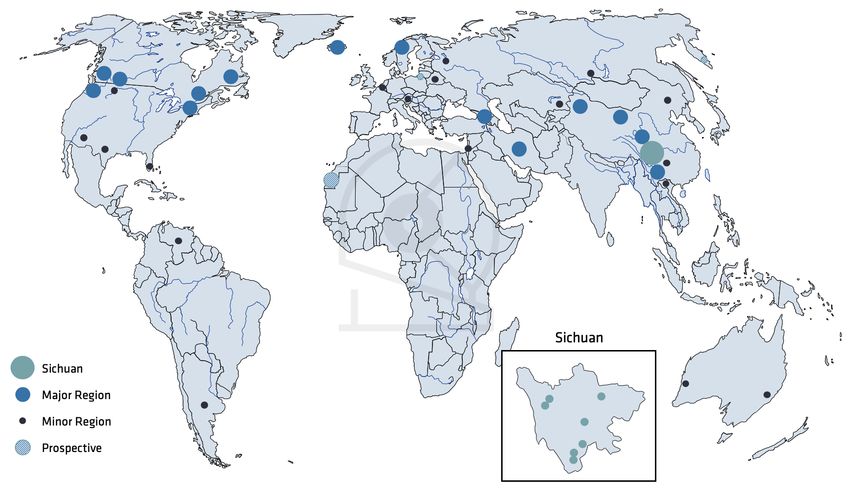
Figure 6: Global Overview of Bitcoin Mining Regions. Regions With Large Relevant Regions Shown in Blue, Sichuan in Teal and Remaining Minor Regions in Black
UPDATE
7
Circles do not show relative scale of mining facilities
(7) (8) (9) (10) (11) (12) (13) (14) (15) (16) (17) (18) (19) (20) (21) (22) (23) (24) (25) (25) (26) (27) (28) (29) (30) (31) (32) (33) (34) (35) (36) (37) (38) (39) (40) (41) (42) (43)Provinces of Canada; Iceland; Northern first basket the hydro regions and the second
Scandinavia (Norway and Sweden); The Caucasus basket the non-hydro regions. The hydro regions,
(Georgia and Armenia); Yunnan and most as implied by the name, are global regions of
importantly of all regions, Sichuan, provinces of hydro-power abundance.
China. There are also minor mining centres found
In the remaining regions we observe a mix of
in similar geographies such as Austria, Montana
fossil, nuclear, solar and wind generation sources,
in the United States, Guizhou Province in China
with some, such as Iran, dominated by natural
and the Siberian Federal District of Russia.
gas, and others, such as Xinjiang and Inner
The remaining major mining regions which do not Mongolia, dominated by coal and supplemented
fit into the above geographical mould are Iran, with wind. While there exist miners using solar as
and Xinjiang and Inner Mongolia provinces of their main power source, such operations are still
China. Minor mining regions where the above relatively rare.
described geography does not (or where we
We currently estimate that 60% of global mining
cannot be certain that it does) fit the above
happens in China, and that Sichuan alone
description include: Florida, Texas and Arizona in
produces 50% of global hashrate, with the
the United States; Western Australia and New
remaining ten percent split more or less evenly
South Wales states of Australia; Belgium;
between Yunnan, Xinjiang and Inner Mongolia.
Belarus; the North West Federal District of
Our estimate for Sichuan’s dominance within
Russia; Argentina; Venezuela; and Israel. See
both China and the world is marginally higher
map for list of sources.
than in our last report and is a result of the
Energy Mix ‘Fengshui’ rainy season in the hydro-heavy
Building on our increasing visibility of the mining ‘Yunguichuan’ (colloquial name for Yunnan,
industry as a whole, we continue our ongoing Guizhou and Sichuan, here, awkwardly in latin
reporting on the likely energy mix of the input alphabet) provinces of Southwestern China.
energy in the mining industry. Again, we refer During this period, electricity prices are among
back to our previous reports—in this case page 5 the lowest in the world, making it one of the
of our November 2018 report—for a more detailed most attractive global mining regions available.
discussion of the methodology and background We expect this estimate to drop in our next
of the investigation. For more casual readers, report (November 2019) as many miners migrate
however, we summarise our methodology in towards Xinjiang and Inner Mongolia for the dry
simplified terms below. season, but more on that in the next section.
Our main assumption is that miners, wherever Out of the remaining 40% of miners, we
they are located, utilise the same mix of power estimate that 35% of global hashrate production
generation (fossil/nuclear or renewable) as the is evenly split between Washington, New York,
average reported in their region. We then British Columbia, Alberta, Quebec, Newfoundland
estimate the total percentage of hashrate and Labrador, Iceland, Norway, Sweden, Georgia
residing in each relevant region, down to the and Iran. The last 5% is assumed to be
lowest administrative subdivision for which distributed widely enough that the global
reports of energy mix are available. Finally, we average energy mix is a good enough fit to
multiply the percent of renewables penetration in estimate their energy sources. These estimates
each relevant mining region with the percent of and the corresponding regional renewables
the total global mining industry residing in that penetrations are summarised in Table 9.
region to arrive at a global weighted average Using the above methodology, we arrive at a new
estimate of renewables penetration in the lower-bound estimate of 74.1% renewables
Bitcoin mining network’s total energy generation penetration in the mining energy mix. The reason
[Tables 7 - 9]. we consider it a lower bound is that we believe
From the previous section (Geographical our methodology to be highly conservative in its
Distribution of Miners) readers will note that we treatment of certain regions where we know
divided the geographical clusters of Bitcoin miners are using renewable energy sources even
miners into two main baskets. We will call the though the regional average is less than 100%,
8 31 May 2019such those in New York. therefore expect our estimates of total
renewables penetration in the mining energy mix
The renewables estimate is down from 77.8% in
to vary somewhat with the seasons.
our November 2018 report and reflects increased
visibility of the industry on our part as well as Caveats and Uncertainty Factors
movements within the industry. For example, we
It is necessary at this point to caveat that while
have observed a significant exodus of Oregon
we do our utmost to accurately pinpoint the
miners as well as an influx into natural-gas-
location of global mining centres, the Bitcoin
dominated areas such as Iran.
mining industry remains a highly private and
Seasonality Factors of the Energy Mix secretive industry. As a result, our estimates may
be subject to significant potential uncertainty.
As we have alluded to in previous sections we
While we have made no attempt to formally
continue to observe moderate seasonal mobility,
quantify these uncertainly levels, we intuitively
especially among Chinese miners. We believe this
guesstimate that, e.g. our renewables
mainly to be a result of the seasonal variability in
penetration figures should be taken to include a
rainfall, and consequently hydro power prices, in
tentative uncertainty of around ±10%.
the ‘Yunguichuan’ region of Southwestern China.
As the annual ‘Fengshui’, or wet season, period That being said, we confidently consider our
manifests, electricity prices fall as low as ¢2.5/ numbers to be amongst the best available in the
kWh, and generally to levels that are among the industry. For other estimates using survey-based
lowest in the world. Multiple sources suggest methodologies we refer readers to the following
that more than 100 TWh of electricity could be sources [48] [49].
wasted annually across these three provinces
Conclusion
alone [44] [45] [46].
The Bitcoin mining network continues to develop
When the dry season returns, electricity prices
along its five-year trend-lines on metrics of
rise again, causing some miners to migrate to
efficiency increase, investment cost reduction
Xinjiang and Inner Mongolia where cheap coal
and hashrate growth.
and wind power is available year around. Some
sources suggest that as many as 500,000 mining After having emerged from one of the most
units migrated to and from Xinjiang last year challenging price environments ever observed in
[47]. Migration, however, is an expensive
endeavour restricted to the most well-capitalised Table 8: Non-Chinese Renewables Penetration by
miners with 7-figure (US$) relocation costs and Country, State or Province
20% breakage rates reported.
Relevant Non-Chinese Renewables
Combined, these migration patterns will cause
Countries/States/Provinces Penetration
seasonal variability in the renewables
Washington (2016) 92%
penetration of the Bitcoin mining industry. We
New York (2016) 45%
Alberta (2018) 11%
Table 7: Chinese Renewables Penetration by British Columbia (2018) 98%
Province Quebec (2018) 100%
Relevant Chinese Renewables Newfoundland and Labrador (2018) 95%
Provinces Penetration Norway (2016) 99%
Sichuan (2017) 90% Sweden (2016) 65%
Iceland (2016) 100%
Yunnan (2017) 92% Iran (2017) 0%
Inner Mongolia (2017) 16% Armenia (2017) 33%
Xinjiang (2017) 23% Georgia (2016) 79%
Average ex. Sichuan 44% Average 68%
Source: Morgan Stanley Research (Oct 2018)
Rest of the World 18.2%
Sources: EIA (Nov 2018), R2E2 (Jul 2017),
Natural Resources Canada (Sep 2018), SATBA (Feb 2017)
9 31 May 2019Table 9: Breakdown of Global Renewables Penetration in Bitcoin Mining
Share of Share of
Global Mining Renewables
Region Renewables Fossil/Nuclear
Share Penetration
for Mining for Mining
Sichuan 50.0% 90.1% 45.1% 5.0%
Relevant Remaining China 10.0% 43.6% 4.4% 5.6%
Relevant Non-Chinese Regions 35.0% 68.0% 23.8% 11.2%
Rest of World 5.0% 18.2% 0.9% 4.1%
Global Total 100.0% 74.1% 25.9%
Sources: Morgan Stanley Research (Oct 2018), EIA (Nov 2018), Natural Resources Canada
(Sep 2018), R2E2 (Jul 2017), SATBA (Feb 2017), CoinShares Research (May 2019)
the industry, miners now appear generally Finally, using a combination of estimates of
healthy and profitable at current price levels. global mining locations and regional renewables
penetrations we again calculate the Bitcoin
Over the last six months we have observed
mining industry to be heavily renewables-driven.
significant liquidations of miners and a high
Our current approximate percentage of
corresponding turnover in mining gear. While this
renewable power generation in the Bitcoin
has certainly been painful for the eliminated
mining energy mix stands at 74.1%, more than
miners, the remaining ones are now much better
four times the global average.
equipped to handle further market downturns,
should they emerge. This estimate is marginally lower than our
November 2018 estimate of 77.8%, reflecting the
Miners are still majorly confined to regions
upstart of major mining clusters in fossil-
dominated by cheap hydro-power, such as
dependent regions such as Iran as well as
Scandinavia, The Caucasus, The Pacific North
relocation away from hydro-dependent regions
West, Eastern Canada and Southwestern China.
such as Oregon.
We believe this to be a direct consequence of the
extremely low electricity prices available in these Overall, our findings reaffirm our view that
regions, especially where the hydro-power is Bitcoin mining is acting as a global electricity
relatively under-utilised. buyer of last resort and therefore tends to cluster
around comparatively under-utilised renewables
Where we previously had observed a strong
infrastructure. This could help turn loss making
tendency of miners moving out of China, the
renewables projects profitable and in time—as
preceding six months have not shown many
the industry matures and settles as permanent
signs of this trend continuing. Here we also want
in the public eye—could act as a driver of new
to caution that the arrival of the ‘Fengshui’ wet
renewables developments in locations that were
season might be a complicating factor as Chinese
previously uneconomical.
miners would likely be unwilling to risk
international relocation in the face of upcoming
boons in domestic electricity pricing.
The migrations we do observe are mainly
confined within China where miners will
opportunistically relocate their gear between
Xinjiang/Inner Mongolia in the dry season and
Sichuan/Yunnan/Guizhou in the wet season.
While this is certainly an interesting pattern
certain factors such as high relocation costs and
breakage rates seem to act as dampening factors
to the overall migratory behaviour.
10 31 May 2019Appendix Bitfury Tardis:
US$ 5,070 – 6/10
The Bitfury Tardis does not have information
Specific Assumptions available from the retailer, however, from other
(CoinShares Research Assumption Rating people that have inquired we understand that
Strength from 0 – 10) the price is dependent on the amount of
hashboards and efficiency one prefers. The upper
This is a list of old and updated/new
bound – the price we use – is $5,070. This is a
assumptions. Where updates have been added
Tardis assembled using ‘Clarke’ chips using 8
we have placed them in brackets, and where the
chipboards doing about 78 TH/s at $65 per TH/s.
updates are recent to this report they are in
Thus, the machine is assumed to cost 78 * 65
brackets and italics.
which is 5,070. The most efficient machine but
with the least hashrate is a Tardis assembled
with the same chips but using only 5 hashboards.
Mining Unit Cost in US$
It comes out at 66 TH/s and the price is $55 per
All unit prices are attempts at volume weighted TH/s thus for this machine you get 66 * 55 =
averages across the entire hardware life cycle and 3,630. To be conservative we assume the miners
at the cost incurred by current hardware holders. are operating more firepower trading off
efficiency, even if we don’t think this is
necessarily the case as they are likely to optimise
Bitfily: and even reconfigure in operation.
US$ 899 – 8/10
This is sourced from the BitcoinTalk overview of Bitfury x Hut 8:
currently competitive hardware [50]. The price is
pulled from the website of the retailer at the last US$ 1,300,000 – 8/10
time available. Therefore, we are quite confident See above assumption for privately sold Bitfury
this at least accurately represents the retail price units.
even if it does not fully capture the second-hand
prices. For less popular miners such as this there
are not enough second-hand sales to get a good Antminer S7:
idea of secondary market pricing.
US$ $50 – 3/10
[Update May 2019. It is very hard to update the
Bitfury Block Box: price of this assumption so we have simply scaled
US$ 1,300,000 – 8/10 down the certainty. With Bitcoin prices where they
are at the time of writing it is assumed some
This is a composite estimate from private people have turned at least a few of these units
conversations with Bitfury where we simply take back on.]
the average of their two options, with and
without immersion cooling.
Antminer S9 Publicly Available Units:
US$ 390 – 7/10
Private Bitfury Facilities:
[Update May 2019. Recently in China, 1,000 is
US$ 400,000 – 4/10
frequently cited by miners both in interviews and
This assumption is an order of proportionally on forums, blogs and social media platforms. We
scaling Song's Bitmain supply cost [51] onto also discovered a lot that larger mines can get for
Bitfury and then doubling the per-chip cost to as low as 700 or 800 yuan and we also heard from
reflect higher costs of the full set up and the a particular source in the West they were as low as
higher production costs suggested by the lower 150 USD. Sources are Mr Nasser, Yu Wei (the
success of Bitfury relative to Bitmain. former head of a Bitmain mine [52]) and Liu Feng
11 31 May 2019(a miner connected enough to be amongst the Avalon 841:
first miners to find preferential rates in Iran [53]). US$ 415 – 7/10
Some miners will have held on to their miner since Assuming the officially stated price is accurate.
their original investment. So, we took there to be
roughly 2,000,000 S9 and assume 75% of them [Update November 2018: We have been unable to
have changed hands. We took a weighted average find any new price information as previous
across the four data points we have: i) the price information was taken from Chinese sources.
from our previous report, ii) the price we believe This is significant because the vast majority of
was wholesale for Western mines, iii) the price we Canaan’s customers are domestic; previously it
heard most frequently from Chinese sources and has been as high 99.6% yet as of 2017 it still
iv) the price we heard for wholesale amongst remains as high as 91.5%] Unfortunately, this
Chinese miners. source has since been removed.
25% @ November’s 1,100 weighted average – 1,100
USD Avalon 921:
25% @ Ray Nasser, via Telegram says other US$ 742 – 7/10
Western prices reported – 200 USD
Assuming the officially stated price is accurate.
25% @ Yu Wei, former head of Bitmain Mine says
1,000 yuan, roughly – 150 USD [Update November 2018: We have been unable to
find any new price information as previous
25% @ Liu Feng, well connected miner says on information was taken from Chinese sources.
average 750 yuan, roughly 110 USD This is significant because the vast majority of
Taking the average returns $390] Canaan’s customers are domestic; previously it
has been as high 99.6% yet as of 2017 it still
remains as high as 91.5%] Unfortunately, this
source has since been removed.
Antminer S9 Private Bitmain Facilities:
US$ 500 - 7/10 Ebang E10:
Here we base the assumption on an article by US$ 1800 – 7/10
Jimmy Song entitled “Just how profitable is This is sourced from the BitcoinTalk overview of
Bitmain?” [51]. currently competitive hardware [50]. The price is
[Update November 2018: We do not believe pulled from the website of the retailer at the last
Bitmain have added any more S9’s to their time available. Therefore, we are quite confident
private facilities since May.] this at least accurately represents the retail price
even if it does not capture the second-hand
prices. For less popular miners such as this there
Antminer S15 Private Bitmain Facilities: are not enough second-hand sales to get a good
US$ 500 – 7/10 idea of secondary market pricing.
At the time of writing this unit has not yet began
shipping to the public even though payment has GMO Mining B2/B3:
been taken both domestically on their Chinese e-
US$ 1,999 – 9/10
shop and on the international website. The
estimate is based on a similar ratio of the retail This price is listed on their website [54].
price compared to the price that Song calculated
in his article [51]. While we appreciate that 7nm
chips are more expensive than 16nm chips, we DragonMint T1:
also believe Bitmain have unlocked significant US$ 1,199 – 7/10
economies of scale since their first introduction
of the S9. This assumption is based on the price of batch 1.
We know of no further batches but have seen a
12 31 May 2019lot of people exchanging these for lower prices 12% of total hashrate (28 exahash) as stated by
and so have altered the price down to reflect the CEO of Bitfury to reverse-arrive at 448 by
secondary market conditions. This is also to using stated efficiency figures.
match the price on the Bitcointalk.org. [Update November 2018: We have carried the
assumption over but scaled the assumptions
certainty down by a factor of one to reflect the
Innosilicon T2 Turbo:
inevitable decrease in certainty as time passes
US$ 1,350 – 7/10 from the last data point.]
This is sourced from the BitcoinTalk overview of
currently competitive hardware [50]. The price is
Private Bitfury Facilities:
pulled from the website of the retailer at the last
time available. Therefore, we are quite confident 112 – 6/10
this at least accurately represents the retail price This assumption is reverse calculated from
even if it does not capture the second-hand Bitfury investor presentations stating 132
prices. For less popular miners such as this there megawatts and subtracting off the known 'Hut
are not enough second-hand sales to get a good 8' units leaving Bitfury’s own facilities.
idea of secondary market pricing.
[Update November 2018: This figure has just
been brought forward but knocked down a point
MicroBT’s Whatsminer M10: as Bitfury have released a new chip and sold
some Block Boxes [55] publicly and thus
US$ 1,441 – 7/10
presumably a few privately as well.
This is sourced from the BitcoinTalk overview of
currently competitive hardware [50]. The price is
pulled from the website of the retailer at the last Bitfury Tardis:
time available. Therefore, we are quite confident 1,000 – 5/10
this at least accurately represents the retail price
even if it does not capture the second-hand The Bitfury Tardis is a very new miner with their
prices. For less popular miners such as this there new ‘Clarke’ chips and so it is assumed very few
are not enough second-hand sales to get a good have been sold so far. The only sale we know of is
idea of secondary market pricing. the aforementioned one to Hut 8.
Total Mining Units Bitfury x Hut 8:
85 – 10/10
Bitfily: This information is available to us by email from
Hut 8 and as a publicly listed company we have
1,000 – 3/10 strong reason to believe this is entirely accurate.
This estimate is low because the amount of
information available is equally small. We
therefore have little to no information about Antminer S7 Series:
sales. Having said that, considering the mediocre
specifications of this hardware there is nothing 1,000 – 5/10
to indicate this unit has sold much more than
1,000 copies. We have assumed a certain small amount of
these miners has come back online considering
price of Bitcoin at the time of writing. However,
Bitfury Block Box: these miners are few and far between where the
448 – 4/10 operator essentially has access to ‘free’
electricity. For example, Upstream Data.
Here we use market estimates of approximately
13 31 May 2019Antminer S9 Publicly Available Units: limited and we have therefore assumed no
additional gear added. Unfortunately, this source
1,730,000 – 7/10
has since been removed.
Bitmain’s S9 and other very similar hardware
Update May 2019: This figure has reduced by
from Bitmain (T9’s and all other versions of the
130,000 as Bitmain have taken 130,000 offline
S9) are widely assumed by many mining experts
including having made a sale of 100,000 or more.
and large-scale miners to be the vast majority of
They have been added to the mining S9’s as a
the network at about 2/3 of all miners in their
result [60] [61].
efficiency class.
[Update May 2019: Previously I had estimated
about 1,950,000 S9 machines were in use Antminer S15 Private Bitmain Facilities:
privately. Mao Shing, founder of the F2Pool (one 120,000 – 5/10
of the largest in the world), thinks between
600,000 and 800,000 mines have been turned Although this miner has only just been
off. Given the kind of mine that would be turned announced it is well known that Bitmain does not
off is around this level of efficiency and the prolific mind mining on gear before it is released to the
role of the S9 in this bracket, I took the average public and so we have assumed that it has a
and removed that from the figure of S9’s significant amount of these mining already.
operating. [Update May 2019 According to Coindesk and
*The speaker says that amount fell off in multiple Chinese sources 200,000 Bitmain miners
November, so we take it off the highest figure but have been deployed. They are potentially all S17
since they are for themselves to mine with and so
given the new price levels and lagging difficulty it’s it’s likely they gave themselves the best gear, but
possible for miners to be making good profits even for now, as its an assumption already, we have
at 7 cents [56] [57]. Thus, we have assumed that split them across both models evenly. There are
at least half of the S9’s that were taken off due to 20,000 extra S15 in D15 as we had previously
price levels have been fired back up. Another assumed 20,000 of this model had already been
130,000 have been added see below ‘S9 Private’.] deployed [61] [62].
Antminer S9 Private Bitmain Facilities: Antminer S17 Private Bitmain Facilites:
100,000 – 7/10 100,000 – 5/10
Here we base our assumption on remarks from According to Coindesk and multiple Chinese
Bitmain employees and interviews from Quartz sources 200,000 Bitmain miners have been
articles on Bitmain (https://qz.com/search/ deployed. They are potentially all S17 since they
bitmain, all worth reading) and Chinese news are for self-mining and so it’s likely they gave
sources covering Bitmain. The Chinese sources themselves the best gear. For now however, as
suggest that the mine in Xinjiang is ‘three times’ this is an assumption already, we have split them
the size of the Ordos mine of 25,000 machines; across both models evenly. There are 20,000 extra
that the Xinjiang mine and the Sichuan and S15 in D15 as we had previously assumed 20,000
Yunnan mines have a migratory cycle based on of this model had already been deployed [61] [62].
the abundance of wind and solar in the dry
season (Xinjiang, Northwest) [58] [59] and the
hydropower of Sichuan and Yunnan in the rainy Antminer S17
season (Southwest) [58]; and lastly that they
have facilities like it elsewhere in China and the 20,000 – 3/10
world (such as in Anhui and Newfoundland [17]) There has been some S15 and S17 shipped we
[Update November 2018: This figure has been assume but we do not know much about figures
brought forward despite Bitmain’s assumed yet.
making and selling of units. Their IPO documents
state that their private mining operations are
14 31 May 2019Avalon 7-series As with the previous estimate for GMO we are
grateful for their transparency and from multiple
5/10 - We have assumed a certain small amount
public documents their aggregate number of
of these miners has come back online considering
machines deduced from their total hashrate and
the price of Bitcoin at the time of writing. Of
the efficiency of their hardware.
course, this only applies to particular locations
where electricity rates meet the needs of miners
like in Canada or China. It would be assumed DragonMint T1:
most of these remain in China and so are being
used in the hydro-centric areas of Sichuan and 25,000 – 3/10
neighboring provinces. We have low confidence in this figure but we
wanted to include an estimate nevertheless.
There was a widespread need for a Bitmain
Avalon 841: competitor and in anticipating this, miners
225,000* – 6/10 bought up all of the Halong mining products
unseen and with a minimum order size of 5 units.
This is estimated from extrapolating inferred
At such a small batch size estimate the figure
production runs given the reports of total
has minimal impact on overall calculations.
amount of hardware sold in Canaan’s IPO
application. Unfortunately, this source has since
been removed. Innosilicon T2 Turbo:
10,000 – 3/10
Avalon 921:
As with the other smaller companies it is very
75,000 – 6/10
hard to gather much information to make a
This is estimated from extrapolating inferred reliable estimate as to the number of miners out
production runs given the reports of total there.
amount of hardware sold in Canaan’s IPO
application. Unfortunately, this source has since
been removed. MicroBT’s Whatsminer M10:
25,000 – 3/10
Ebang E10: This is a difficult estimate for the same reasons
200,000 – 6/10 as above. However, the efficiency of this miner is
very impressive for its release date and there is
This is an estimate back-calculated from the
significant forum support. Therefore, we have
percentage of hardware claimed by Ebang to be
assumed they have put out a maximum output
produced in 2017 and carried forward. This figure
due to the community response.
is independently calculated by a company
commissioned to do the work for their IPO
application and they expect that Ebang Hashrates and Power Efficiency per Unit
accounted for 11% of hardware produced in 2017.
This is mentioned on various occasions, first on
page 1. The reason we do not consider it entirely All except GMO Mining – 9/10
reliable is that as we have seen little evidence of This represents a tempered belief in the state of
a market share of that magnitude, and that the the producers which will have modified only
report supporting the IPO application documents slightly if we believe the real-life specs are
was commissioned by Ebang themselves. different (e.g. reading published reviews or forum
Unfortunately, this source has since been reviews of trusted members acknowledging there
removed. to be a large disparity between the advertised
spec and the testing spec).
GMO Mining B2/B3:
GMO Mining – Hashrates taken from company
16,000– 8/10 filings [63].
15 31 May 2019Works Cited 18. Bitfarms. [Online] May 2019. https://
www.bitfarms.io/#operations.
1. Wikipedia. [Online] May 2019. https://
en.wikipedia.org/wiki/Proof-of-work_system. 19. 31QU. [Online] January 2019. https://www.
8btc.com/article/349247.
2. Bitcoin Wiki. [Online] May 2019. https://
en.bitcoin.it/wiki/Proof_of_work. 20. Planet Daily. [Online] February 2019. https://
www.8btc.com/article/359114.
3. Bendiksen, Christopher. [Online] December
2018. https://medium.com/coinshares/an- 21. Hunting Cloud Network. [Online] February
honest-explanation-of-price-hashrate-bitcoin- 2019. http://www.bitcoin86.com/wk/
mining-network-dynamics-f820d6218bdf. 35735.html.
4. —. [Online] December 2018. https:// 22. PANews. [Online] March 2019. http://
medium.com/coinshares/beware-of-lazy- www.gs265.com/archives/10816.
research-c828c900b7d5. 23. Vayne. [Online] March 2019. http://
5. NDRC. [Online] April 2019. http:// liancaijing.com/405440.html.
gys.ndrc.gov.cn/cyjgtzzdml20190408.pdf. 24. Bitcoin86. [Online] February 2019. http://
6. Bendiksen, Christopher, Gibbons, Samuel and www.bitcoin86.com/wk/36208.html.
Lim, Eugene. [Online] November 2018. https:// 25. Office of the Chief Economist. [Online] May
coinshares.co.uk/bitcoin-mining-cost/. 2018. http://documents.worldbank.org/curated/
7. ARminers. [Online] May 2019. https:// en/293821525702130886/pdf/125990-
arminers.com. WP-7-5-2018-9-39-58-
ECAEconomicUpdateCryptocurrenciesandBlockch
8. Gogo, Jeffrey. [Online] October 2018. https://
ainMayweb.pdf.
news.bitcoin.com/50-million-bitcoin-mining-
farm-opens-in-armenia/. 26. Alderman, Liz. [Online] January 2019. https://
www.nytimes.com/2019/01/22/business/
9. Haig, Samuel. [Online] April 2018. https://
georgia-bitcoin-blockchain-bitfury.html.
news.bitcoin.com/20mw-solar-farm-set-to-
power-crypto-mining-in-rural-australia/. 27. Moonlite. [Online] May 2019. https://
www.moonlite.io.
10. Das, Samburaj. [Online] May 2018. https://
www.ccn.com/australian-blockchain-firm- 28. Genesis Mining. [Online] May 2019. https://
strikes-190-million-crypto-mining-deal. www.genesis-mining.com.
11. Hydrominer. [Online] May 2019. https:// 29. Hive Blockchain. [Online] May 2019. https://
www.hydrominer.org. www.hiveblockchain.com/projects/.
12. Coin Factory. [Online] May 2019. https:// 30. Pizza, Ratchet. [Online] January 2019. https://
www.coin-factory.at. www.8btc.com/article/351712.
13. Cinerama. [Online] February 2018. https:// 31. Teng, Lylian. [Online] April 2019. https://
www.bitcoinisle.com/2018/02/25/new-plant-to- bitcoinmagazine.com/articles/chinese-bitcoin-
assemble-mining-rigs-in-belarus/. miners-suffer-iran-despite-cheap-power/.
14. NRMine. [Online] May 2019. https:// 32. GMOminer. [Online] May 2019. https://
www.nrmine.com/our-stores/. gmominer.z.com/en/.
15. Hut8. [Online] May 2019. https:// 33. Northern Bitcoin. [Online] May 2019. https://
hut8mining.com/operations. northernbitcoin.com.
16. DMG. [Online] May 2019. https:// 34. Marinoff, Nick. [Online] March 2018. https://
dmgblockchain.com. bitcoinmagazine.com/articles/bitfury-expands-
norway-35-million-bitcoin-data-center/.
17. Antle, Rob. [Online] April 2017. https://
www.cbc.ca/news/canada/newfoundland- 35. Akolkar, Bhushan. [Online] August 2018.
labrador/great-north-data-bitmain- https://bitcoinist.com/russias-leningrad-region-
technologies-lawsuit-1.4084925. unveils-the-largest-crypto-mining-farm/.
16 31 May 201936. JIWO. [Online] October 2018. https://jiwo.ru/ 51. Song, Jimmy. [Online] April 2017. https://
stolica-rossiyskogo-mayninga-irkutsk. medium.com/@jimmysong/just-how-profitable-
is-bitmain-a9df82c761a.
37. Sweans. [Online] May 2019. https://
www.sweans.com/mining/. 52. Bihu. [Online] April 2019. https://bihu.com/
article/1905931713.
38. Parks, Lisa. [Online] December 2018. http://
globalmedia.mit.edu/2019/01/13/sounds-of-a- 53. Xinglian Caijing. [Online] April 2019. http://
bitcoin-data-center-in-montana/. www.xingliancaijing.com/blockchain/chainnews/
10758.html.
39. Prindle, Drew. [Online] April 2018. https://
www.digitaltrends.com/computing/inside- 54. GMOminer. [Online] May 2019. https://
bitcoin-mine/. gmominer.z.com/en/pricing.
40. Giga Watt. [Online] https://giga-watt.com. 55. Hut8. [Online] November 2018. https://
www.globenewswire.com/news-release/
41. Plattsburgh BTC. [Online] May 2019. https://
2018/11/12/1649570/0/en/Hut-8-Adds-12-
plattsburghbtc.com.
Bitcoin-Mining-BlockBoxes-to-Drumheller-
42. CoinMint. [Online] June 2018. https:// Facility.html.
www.prnewswire.com/news-releases/worlds-
56. Zillian8. [Online] April 2018. https://
largest-digital-currency-data-center-
www.zilian8.com/130015.html.
commences-operations-300659812.html.
57. Philipma1957. [Online] May 2019. https://
43. Helms, Kevin. [Online] January 2018. https://
bitcointalk.org/index.php?
news.bitcoin.com/vietnam-imported-mining-
topic=5091665.msg51107675#msg51107675.
rigs/.
58. Jiansheng, M. [Online] March 2017. http://
44. Wu, Wen. [Online] February 2019. http://
www.chinasmartgrid.com.cn/news/
finance.sina.com.cn/blockchain/roll/2019-02-13/
20170308/622441.
doc-ihqfskcp4812906.shtml.
59. Kidneybeans. [Online] February 2018. http://
45. Stanway, David. [Online] March 2018. https://
www.bitcoin86.com/wk/19509.html.
www.reuters.com/article/china-parliament-
hydropower/chinas-yunnan-defends-dam- 60. Jinse. [Online] May 2019. https://
building-as-activists-head-to-court- www.jinse.com/blockchain/364841.html.
idUSL4N1QP3U1. 61. Elecfans. [Online] March 2019. http://
46. —. [Online] August 2018. https:// www.elecfans.com/emb/dsp/
uk.reuters.com/article/us-china-hydropower/ 20190325890024.html.
dam-nation-big-state-projects-spared-in-chinas- 62. Zhao, Wolfie. [Online] May 2019. https://
hydro-crackdown-idUKKCN1LF2RG. www.coindesk.com/bitmain-bitcoin-mining-
47. Bitcoin86. [Online] February 2019. http:// farms-antminer.
www.bitcoin86.com/wk/36208.html. 63. GMOmining. [Online] May 2019. https://
48. Hileman, Garrick and Rauchs, Michel. [Online] mining.gmo.jp/en/.
April 2017. https://www.jbs.cam.ac.uk/
fileadmin/user_upload/research/centres/
alternative-finance/downloads/2017-global-
cryptocurrency-benchmarking-study.pdf.
49. Rauchs, Michel, et al. [Online] December
2018. https://www.jbs.cam.ac.uk/fileadmin/
user_upload/research/centres/alternative-
finance/downloads/2018-12-ccaf-2nd-global-
cryptoasset-benchmarking.pdf.
50. Steamtyme. [Online] October 2018. https://
bitcointalk.org/index.php?topic=5045732.
17 31 May 2019Important Disclaimer
Please note that this document is provided on the basis that the recipient accepts the following conditions
relating to provision of the same (including on behalf of their respective organisation). Should the following
conditions not be acceptable, please destroy this document without retaining any copies.
This document does not contain, or purport to be, financial promotion(s) of any kind. This document does not
contain reference to any of the investment products or services offered by members of the CoinShares Group.
Digital assets and related technologies can be extremely complicated. Cryptocurrencies can be extremely
volatile and subject to rapid fluctuations in price, positively or negatively. Cryptocurrencies are loosely regulated
and there is no central marketplace for currency exchange. Supply is determined by a computer code, not by a
central bank, and prices can be extremely volatile. The digital sector has spawned concepts and nomenclature
much of which is novel and can be difficult for even technically savvy individuals to thoroughly comprehend.
The sector also evolves rapidly.
With increasing media attention on digital assets and related technologies, many of the concepts associated
therewith (and the terms used to encapsulate them) are more likely to be encountered outside of the digital
space. Although a term may become relatively well-known and in a relatively short timeframe, there is a
danger that misunderstandings and misconceptions can take root relating to precisely what the concept
behind the given term is.
The purpose of this document is to provide objective, educational and interesting commentary and analysis in
connection with Bitcoin Mining. This document is not directed at any particular person or group of persons. This
material is solely for informational purposes and shall not constitute an offer to sell or the solicitation to buy
securities. Although produced with reasonable care and skill, no representation should be taken as having been
given that this document is an exhaustive analysis of all of the considerations which its subject-matter may
give rise to. This document fairly represents the opinions and sentiments of CoinShares (UK) Limited
(“CSUKL”), which is the issuer of this document, as at the date of its issuance but it should be noted that such
opinions and sentiments may be revised from time to time, for example in light of experience and further
developments, and this document may not necessarily be updated to reflect the same.
The information presented in this document has been developed internally and / or obtained from sources
believed to be reliable; however, the CoinShares Group (which includes CSUKL) does not guarantee the
accuracy, adequacy or completeness of such information. Predictions, opinions and other information
contained in this document are subject to change continually and without notice of any kind and may no longer
be true after the date indicated. Any forward-looking statements speak only as of the date they are made, and
the CoinShares Group assumes no duty to, and does not undertake, to update forward-looking statements.
Forward-looking statements are subject to numerous assumptions, risks and uncertainties, which change over
time.
Nothing within this document constitutes (or should be construed as being) investment, legal, tax or other
advice. This document should not be used as the basis for any investment decision(s) which a reader thereof
may be considering. Any potential investor in digital assets, even if experienced and affluent, is strongly
recommended to seek independent financial advice upon the merits of the same in the context of their own
unique circumstances.
CoinShares (UK) Limited is an Authorised Representative of Sapia Partners LLP, which is authorised and
regulated by the Financial Conduct Authority (FRN: 550103). CoinShares (UK) Limited is registered in England
and Wales (no.03269801) Octagon Point, 5 Cheapside, St. Paul’s, London, EC2V 6AA
This document is subject to copyright with all rights reserved. Use and reproduction of this document or any
parts thereof may be done without permission, however, the following citation should accompany any
reference to or other use of the information contained in this document: The Bitcoin Mining Network—Trends,
Average Creation Cost, Electricity Consumption & Sources. Available at www.coinshares.co.uk
18 31 May 2019You can also read