THE GUINNESS GLOBAL ENERGY REPORT
←
→
Page content transcription
If your browser does not render page correctly, please read the page content below
THE GUINNESS GLOBAL ENERGY REPORT
Developments and trends for investors in the global energy sector                                 October 2021

 GUINNESS                                     HIGHLIGHTS FOR SEPTEMBER
 GLOBAL ENERGY FUND
                                              OIL
                                              WTI/Brent up on tighter market
 The Guinness Global Energy Fund              Brent and WTI oil prices were both up in September, as a tight oil
 invests in listed equities of companies      market saw oil and refined product inventories decline sharply. WTI
                                              closed the month up $6/bl at $75/bl, whilst Brent rose by nearly
 engaged in the exploration, production
                                              $8/bl to $79/bl. OPEC+ met in early October and resolved to
 and distribution of oil, gas and other
                                              continue on the path agreed in July, raising group production
 energy sources. We believe that over
                                              monthly by 0.4m b/day until quota cuts are unwound. There is
 the next twenty years the combined           increasing pressure on the group to accelerate the unwind.
 effects of population growth, developing
 world industrialisation and diminishing      NATURAL GAS
 fossil fuel supplies will force energy       US, European and Asian gas prices all up very strongly
 prices higher and generate growing           Another month of strong demand, limited supply and low
 profits for energy companies.                inventories in Europe and Asia have caused tight gas markets to
                                              persist and prices to spike higher. The European gas price (using UK
                                              NBP) and Japanese LNG prices both rose to over $30.0/mcf; and the
 The Fund is run by co-managers Will          US spot price (Henry Hub) increased to $5.9/mcf.
 Riley, Jonathan Waghorn and Tim
 Guinness, supported by Jamie Melrose         EQUITIES
 (analyst). The investment philosophy,        Energy outperforms the broad market in September
 methodology and style which                  The MSCI World Energy Index (net return) rose by 9.4% in
 characterise the Guinness approach           September, outperforming the MSCI World Index (net return) which
 have been applied to the management          fell by 4.2% over the month (all in US dollar terms).
 of energy equity portfolios since 1998.
                                              CHART OF THE MONTH
                                              Improvement in oil demand from the aviation sector
                                              So far this year, most areas of oil product demand have recovered well
                                              in the COVID recovery, though the laggard has been jet fuel for
 This is a marketing communication.           aviation. Jet fuel refining margins have been depressed, and this has
 Please refer to the prospectus and KIID      weighed on overall refining margins. However, this is now changing:
 for the Fund before making any final         with the number of flights rising, jet fuel crack spreads have firmed up
 investment decisions.                        notably recently, closing in on their 5-year average. Global commercial
                                              flight numbers have been tracking 30-35% below 2019 levels, but this
 Important information about this             has closed in recent weeks to 20-25% below 2019.
 report

 This report is primarily designed to                       Jet fuel refining margin vs Brent crude ($/bl)
 inform you about recent developments
 in the energy markets invested in by the
 Guinness Global Energy Fund. It also
 provides information about the Fund’s
 portfolio, including recent activity and
 performance. This document is provided
 for information only and all the
 information contained in it is believed to
 be reliable but may be inaccurate or
 incomplete; any opinions stated are
 honestly held at the time of writing, but
 are not guaranteed. The contents of the
 document should not therefore be
 relied upon. It is not an invitation to
 make an investment nor does it
                                                       Source: Morgan Stanley; Guinness Asset Management
 constitute an offer for sale.

Tel: +44 (0) 20 7222 5703                                                                   Guinness Asset Management Ltd
Email: info@guinnessfunds.com                                                             is authorised and regulated by the
Web: guinnessfunds.com                                                                           Financial Conduct Authority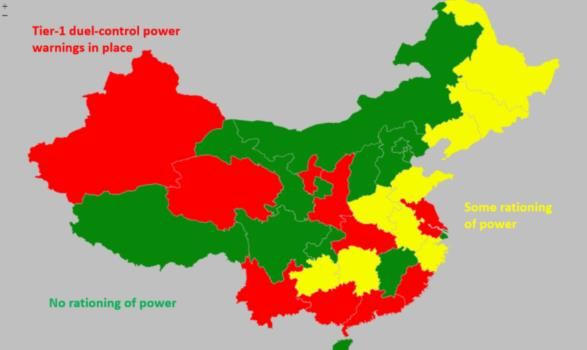
The Guinness Global Energy Report                                                                                                  October 2021

Contents
     1.     SEPTEMBER IN REVIEW ..........................................................................................................2
     2.     MANAGER’S COMMENTS .......................................................................................................6
     3.     PERFORMANCE Guinness Global Energy Fund.............................................................. 10
     4.     PORTFOLIO Guinness Global Energy Fund ..................................................................... 11
     5.     OUTLOOK ................................................................................................................................. 14
     6.     APPENDIX Oil and gas markets historical context ...................................................... 22

 1. SEPTEMBER IN REVIEW

i)    Oil market
Oil price (WTI and Brent $/barrel): March 2020 to September 2021

                                                              Source: Bloomberg LP

The West Texas Intermediate (WTI) oil price started September at $68.5/bl and moved steadily higher over the
month to close at $75.0/bl. WTI has averaged $65/bl so far in 2021, having averaged $40/bl in 2020 and $58/bl
in 2019.

Brent oil traded in a similar shape, opening at $71.2/b and closing the month at $78.8/bl. Brent has averaged
$67/bl so far in 2021, having averaged $42/bl in 2020 and $64/bl in 2019. The gap between the WTI and Brent
benchmark oil prices widened over the month, ending September at just below $4/bl. The Brent-WTI spread
averaged $3/bl in 2020.

Factors which strengthened WTI and Brent oil prices in September:

•    Jet fuel demand picking up
     So far this year, most areas of oil product demand have recovered well in the COVID recovery, though the
     laggard has been jet fuel for aviation. Jet fuel refining margins have been depressed, and this has weighed
     on overall refining margins. However, this is now changing: with the number of flights rising, jet fuel crack
     spreads have firmed up notably recently, closing in on their 5-year average. Global commercial flight
     numbers have been tracking 30-35% below 2019 levels, but this has closed in recent weeks to 20-25% below
     2019.

Guinness Global Energy Fund                                                                                                     guinnessfunds.com
The value of investments and the income from them can go down as well as up.
Guinness Asset Management is authorised and regulated by the Financial Conduct Authority.                                                             2
The Guinness Global Energy Report                                                                   October 2021

•    Chinese oil demand bouncing back from Delta variant hit
     Data from China showed a dip in mobility in July and August, coincident with higher levels of the Delta
     variant of COVID being reported across the country. However, September data showed that mobility has
     improved again, and has moved ahead of 2019 and 2020 levels. These reports imply that Chinese oil
     demand is likely to have rebounded quickly. Total Chinese oil demand for 2021 is estimated by the IEA at
     15.0m b/day, up from 13.7m/13.9m b/day in 2019/2020.

•    OPEC exports lagging OPEC production
     OPEC’s crude production has risen steadily since the lows in June 2020. From April to August 2021, their
     supply has increased by around 1.8m b/day. However, tanker shipments suggest that much of this additional
     supply is not reaching the export market. According to Morgan Stanley, aggregate loadings (i.e. tanker
     exports) for OPEC production were 19.2m b/day in September, up by only 0.2m b/day. This points towards
     sharply rising domestic demand within OPEC itself, leaving non-OPEC consumers facing an increasingly tight
     market.

Factors which weakened WTI and Brent oil prices in September:

•    Rising US shale oil rig count
     The number of rigs drilling for oil in the US rose to 428 rigs in September, up from 410 at the start of the
     month. This implies greater US supply, albeit with a lag. We observe that the recovery in the rig count is
     lagging the recovery in the previous cycle (2016), by around 90 rigs. It is also notable that the rigs are mainly
     being added by the smaller private participants in the US market, with little change from companies in the
     listed sector.

Speculative and investment flows

The New York Mercantile Exchange (NYMEX) net non-commercial crude oil futures open position was 356,000
contracts long at the end of September versus 374,000 contracts long at the end of August. The net position
peaked in February 2018 at 739,000 contracts long. Typically, there is a positive correlation between the
movement in net position and movement in the oil price. The gross short position decreased to 150,000
contracts at the end of September versus 154,000 at the end of the previous month.

NYMEX Non-commercial net and short futures contracts: WTI January 2004 – September 2021

                                         Source: Bloomberg LP/NYMEX/ICE (2021)

Guinness Global Energy Fund                                                                      guinnessfunds.com
The value of investments and the income from them can go down as well as up.
Guinness Asset Management is authorised and regulated by the Financial Conduct Authority.                         3
The Guinness Global Energy Report October 2021
OECD stocks
OECD total product and crude inventories at the end of August (latest data point) were estimated by the IEA to
be 2,819m barrels, down by 31 barrels versus the level reported for June. This compares to a 10-year average
increase for August of 15m barrels, implying that the OECD market was significantly undersupplied. The
significant oversupply situation in 2020 pushed OECD inventory levels close to maximum capacity in August 2020
(c3.3bn barrels), with a tightening thereafter taking inventories back to normal levels.
OECD total product and crude inventories, monthly, 2004 to 2021
Source: IEA Oil Market Reports (Sept 2021 and older)
ii) Natural gas market
The US natural gas price (Henry Hub front month) opened September at $4.38/mcf (1,000 cubic feet) and moved
up strongly over the month, closing at $5.87/mcf. The spot gas price has averaged $3.33/mcf so far in 2021,
having averaged $2.13/mcf in 2020 and $2.53/mcf in 2019.
The 12-month gas strip price (a simple average of settlement prices for the next 12 months’ futures prices) also
rose over the month, opening at $3.93/mcf and closing at $4.79/mcf. The strip price averaged $2.54 in 2020 and
$2.60 in 2019.
Henry Hub gas spot price and 12m strip ($/Mcf) 18 months Feb 2020 to Sept 2021
Source: Bloomberg LP
Guinness Global Energy Fund guinnessfunds.com
The value of investments and the income from them can go down as well as up.
Guinness Asset Management is authorised and regulated by the Financial Conduct Authority. 4The Guinness Global Energy Report October 2021
Factors which strengthened the US gas price in September included:
• Market undersupplied (ex-weather effects)
Injections into US natural gas inventories during September were lower than expected for the time of year.
Adjusting for the impact of weather, the builds implied that the US gas market was, on average, around 1
Bcf/day undersupplied.
• Lower than normal international gas inventories and stronger international demand
High gas demand and low inventories in Europe and Asia has sent international gas prices over $25/mcf.
This in turn is maximising demand for exports of LNG from the US. In addition, exports of US natural gas to
Mexico are strong.
• US onshore supply down slightly
The latest US natural gas production data published by the EIA (for July) indicates that onshore supply of
gas has risen since the start of the year by only 1.0 Bcf/day, to 101.5 Bcf/day. Despite the increase in supply
so far in 2021, it has been more than outweighed by the rise in demand, coming from improving economic
activity, warm summer weather and rising LNG exports.
Weather adjusted US natural gas inventory injections and withdrawals
Source: Bloomberg LP; Guinness Asset Management
Natural gas inventories
Swings in the balance for US natural gas should, in theory, show up in movements in gas storage data. Natural
gas inventories at the end of September were reported by the EIA to be 3.2 Tcf. Current gas in storage is around
0.2 Tcf below the 10-year average.
Deviation from 10yr gas storage norm
Source: Bloomberg; EIA (October 2021)
Guinness Global Energy Fund guinnessfunds.com
The value of investments and the income from them can go down as well as up.
Guinness Asset Management is authorised and regulated by the Financial Conduct Authority. 5The Guinness Global Energy Report October 2021
2. MANAGER’S COMMENTS
Over the past few weeks, natural gas has moved from being a reasonably obscure commodity to
front page news, thanks to a surge in pricing which is contributing to global resource inflation. Here,
we examine the reasons behind the sharp uplift in prices, how it matters for our portfolio, and how
it might play out.
Since the early part of the summer, we have seen significant price inflation in various energy and
energy related commodities. European and Asian gas prices have rallied from ~US$7/mcf to over
~US$20/mcf whilst US gas prices have rallied from $3/mcf to over $6/mcf. Other power-related
commodities have moved up sharply: thermal coal prices, for example, more than doubling to
US4180/tonne. European electricity prices have risen as a result – day ahead prices have gone from
around €50/MWh to ~€150/MWh. Energy-dependent commodities have also rallied. Aluminium
prices, for example, have gone from $2,000/tonne at the start of the year to US$2,900/tonne today.
Commodity/power price summary, 2017-21
Source: Morgan Stanley, Platts, Bloomberg. Index: Jan 2017 = 100
Whilst there are many interconnected factors at play, the story starts with global electricity demand,
which has been particularly strong. According to the International Energy Agency (IEA), after falling by
around 1% in 2020 due to the COVID slowdown, global electricity demand is set to grow by close to 5%
in 2021 and 4% in 2022. For context, global electricity consumption grew by an average of 2.7% per
annum between 2010 and 2018.
Strong demand has been especially evident in China, where electricity consumption has been driven
not only by economic recovery, but also an unusually hot summer which has driven demand for air-
conditioning.
Typically, in China, around 65% of electricity consumption is powered by coal, and a further 17% is
power by hydro. However, the supply of power from both sources has been restricted. For coal,
domestic production has struggled, thanks to regulatory reforms, underinvestment and safety
concerns. Meanwhile, thermal coal imports into China from Australia have been reduced to virtually
Guinness Global Energy Fund guinnessfunds.com
The value of investments and the income from them can go down as well as up.
Guinness Asset Management is authorised and regulated by the Financial Conduct Authority. 6The Guinness Global Energy Report October 2021
zero this year, stemming from a political row around the origins of COVID. Australia normally accounts
for around 40% of China’s thermal coal imports, so the impact is sizeable. The output from
hydropower has disappointed because of low rainfall and ensuing droughts.
As a result, demand for natural gas in China has been very strong. That demand is satisfied in three
ways: domestic production, pipeline imports and liquefied natural gas (LNG) imports. And whilst all
three sources have increased in recent months, it has not been enough to satisfy the Chinese power
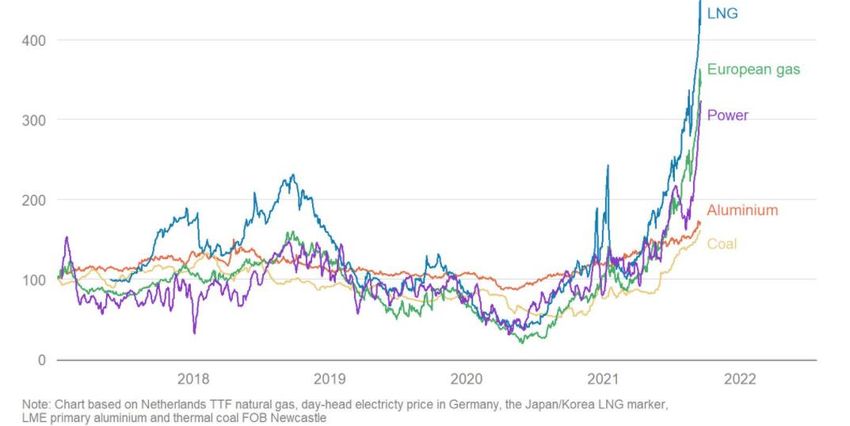
market as whole, causing gas and coal prices to rise. Power usage restrictions have now escalated,
with twenty provinces implementing power cuts since mid-August, including the key manufacturing
hubs of Guangdong, Zhejiang and Jiangsu.
Power rationing in China
Source: Reuters
In Europe in recent years, there has often been a surplus of LNG imports, with Europe acting as the
market of last resort. However, with the global LNG market being much tighter than usual, Europe has
seen a reduction in its usual LNG supply. The tightness in the global LNG market can partly be
explained by the pull of supply into Asia, but there are other factors also at play, such as LNG terminal
supply outages running at unusually high levels, and higher than expected demand from South
America, where rainfall has been low and hydropower limited.
Another factor influencing European gas prices is the competitive dynamic between gas and coal
power plants. Historically, high natural gas prices would catalyse a meaningful switch to coal
generation, which would be offering better economics. However, with the rise in European carbon
prices, up by over 80% since November last year, coal fired plants (which are more carbon intensive
than gas fired plants) have become less competitive relative to gas. With this ‘relief’ valve of coal
power being relatively less attractive, the pressure on gas demand has only intensified.
The current tight situation for gas in Europe was exacerbated by an unusually cold 2020/21 winter,
resulting in high heating demand and low inventories of gas at the start of the summer. With
inventories only moving lower (relative to seasonal averages) over the summer, it has set up a concern
in the market that there will be insufficient supply for the coming winter, hence forward prices for the
winter also heading significantly higher.
Guinness Global Energy Fund guinnessfunds.com
The value of investments and the income from them can go down as well as up.
Guinness Asset Management is authorised and regulated by the Financial Conduct Authority. 7The Guinness Global Energy Report October 2021
NW European natural gas inventories
Source: Goldman Sachs
Questions have been raised this summer around Russia’s role in Europe’s gas market, and whether
exports of gas have been lowered to incentivise support for the approval of the Nord Stream 2
pipeline, designed to channel natural gas from Russia directly to Germany, bypassing the Ukraine. So
far this year, it appears that Russian net flows into NW Europe have been only slightly below
expectations, with more gas coming via Slovakia and Czech to offset lower volumes via the Ukraine.
For October, Gazprom has declined to book the full capacity available on one of the key export
pipelines into Germany, though whether this is a political move or a shortage of Russian supply is less
clear. In September, President remarked: "Those Europeans who have agreed to sign long-term
contracts with us can rub their hands with joy". However, even Putin can see that extreme prices are
not in Russia’s interest, and indicated on October 6 that his country was prepared to help stabilise
soaring global energy prices.
How does this play out? As with any commodity, predicting short-term moves is a mug’s game. Relief
will come partly via lower demand, either from a dampening of activity or switching to other
commodities. We have written here around gas-to-coal switching in Europe being challenged, but we
do expect to see some gas-to-oil switching, as heating oil supply is maximised. Additional supply will
be forthcoming from Russia and Norway; China is likely to increase its coal supply, and with
normalised weather, hydro and wind generation will pick up again. Ultimately, we do not expect these
very high prices to be sustained and see the price in the medium term at around $7-9/mcf. Keep in
mind that European gas prices averaged around $4.5/mcf in 2019 (and sub $4/mcf in 2020), so this
would represent a reasonable step up.
With regard to Guinness’ Global Energy portfolio, we have natural gas exposure via the following
routes:
• European gas ‘majors’, Equinor and Gazprom. Together, Equinor and Gazprom supply around
60% of the European gas market
• Chinese gas ‘major’, Petrochina. Petrochina controls the majority of China’s domestic natural
gas reserves
• Super-majors and European mid-cap integrateds, most with significant international gas
reserves and production
In total, we estimate that around 50% of the upstream production of our portfolio currently comes
from natural gas. We think our portfolio currently discounts a long-term gas price of around $5-6/mcf
and a long-term oil price of around $53-54/bl, which is below our medium and long-term commodity
Guinness Global Energy Fund guinnessfunds.com
The value of investments and the income from them can go down as well as up.
Guinness Asset Management is authorised and regulated by the Financial Conduct Authority. 8The Guinness Global Energy Report October 2021 price assumptions. At the end of September 2021, the fund was trading at 9.1x 2022 P/E with an estimated 5.0% dividend yield. Guinness Global Energy Fund guinnessfunds.com The value of investments and the income from them can go down as well as up. Guinness Asset Management is authorised and regulated by the Financial Conduct Authority. 9
The Guinness Global Energy Report                                                                                            October 2021

                3. PERFORMANCE Guinness Global Energy Fund
            The main index of oil and gas equities, the MSCI World Energy Index (net return), rose by 9.4% in September,
            while the MSCI World Index (net return) fell by 4.2%. The Fund was up by 11.8% (class Y*) in the month,
            outperforming the MSCI World Energy index by 2.4% (all in US dollar terms).

            Within the Fund, September’s strongest performers were Gazprom, Conocophillips, Devon, Imperial Oil and
            Equinor while the weakest performers were Enquest, Enbridge, Helix, Chevron and Schlumberger.

            *Class Y formerly named the E class. OCF remains at 0.99%.

Performance (in USD) Past performance does not predict future returns                                                                                                30/09/2021

Cumulative                                             YTD             1                 3                6               1                3               5 years
                                                                                                                                                                               F ro m
                                                                                                                                                                              La unc h
% returns                                                            month             months           months           year            years                               (31/03/08)

Guinness Global Energy Fund (Class Y, 0.99% OCF)       40.0%          11.8%             4.1%            15.1%           82.9%            -27.4%            -13.2%             -32.3%

MSCI World Energy NR Index                             34.1%            9.4%            1.3%            10.1%           69.9%            -19.8%             -2.8%             -10.6%

MSCI World Small Cap Energy Index                      55.3%          15.2%             3.1%            20.6%           121.8%           -34.2%            -29.2%             -57.5%

50/50 Mix of World Enegy and Small Cap Index           44.7%          12.3%             2.2%            15.4%           95.9%            -27.0%            -16.0%             -34.1%

Calendar year
% returns                                                      YTD    2020     2019     2018    2017     2016    2015    2014    2013     2012    2011      2010     2009    2008**
Guinness Global Energy Fund (Class Y, 0.99% OCF)               40.0% -34.7%    9.8%    -19.7%   -1.3%   27.9%    -27.6% -19.1%   24.4%    3.0%    -13.7%   15.3%     61.8%    -44.8%

MSCI World Energy NR Index                                     34.1% -31.5%    11.4%   -15.8%   5.0%    26.6%    -22.8% -11.6%   18.1%    1.9%    0.2%     11.9%     26.2%    -32.8%

MSCI World Small Cap Energy Index                              55.3% -30.5%    -2.3%   -31.3% -12.0%    37.0%    -37.3% -33.1%   16.4%    1.4%    -9.2%    34.8%     77.5%    -54.7%

50/50 Mix of World Enegy and Small Cap Index                   44.7% -31.0%    4.6%    -23.6%   -3.5%   31.8%    -30.1% -22.3%   17.3%    1.6%    -4.5%    23.3%     51.9%    -43.8%

Source: Guinness Asset Management and Bloomberg, bid to bid, gross income reinvested, in US dollars

Calculation by Guinness Asset Management Limited, **Simulated past performance prior to 31.3.08, launch date of Guinness Global Energy Fund.
The Guinness Global Energy investment team has been running global energy funds in accordance with the same methodology continuously since
November 1998. These returns are calculated using a composite of the Investec GSF Global Energy Fund class A to 29.2.08 (managed by the
Guinness team until this date); the Guinness Atkinson Global Energy Fund (sister US mutual fund) from 1.3.08 to 31.3.08 (launch date of this Fund),
the Guinness Global Energy Fund class A (1.49% OCF) from launch to 02.09.08, and class Y (0.99% OCF) thereafter. Performance would be lower if
an initial charge and/or redemption fee were included. Returns for share classes with a different OCF will vary accordingly

TB Guinness Global Energy Fund

UK investors should be aware that the Guinness Global Energy Fund is now available as a UK domiciled fund denominated in GBP. The TB Guinness
Global Energy Fund is available from 0.95% OCF. The historical performance of this fund will differ from the Guinness Global Energy Fund as the TB
Guinness Global Energy fund has only been recently brought into line with the Guinness Global Energy Fund. The documentation needed to make
an investment, including the Prospectus, the Key Investor Information Document (KIID) and the Application Form, is available from the website
www.guinnessfunds.com
Please contact info@guinnessfunds.com or +44 (0) 20 7222 5703 for more details

Past performance should not be taken as an indicator of future performance. The value of this investment and any income arising
from it can fall as well as rise as a result of market and currency fluctuations as well as other factors. You may lose money in this
investment.
Returns stated above are in US dollars; returns in other currencies may be higher or lower as a result of currency fluctuations.
Investors may be subject to tax on distributions.
The Fund’s Prospectus gives a full explanation of the characteristics of the Fund and is available at www.guinnessfunds.com.

            Guinness Global Energy Fund                                                                                            guinnessfunds.com
            The value of investments and the income from them can go down as well as up.
            Guinness Asset Management is authorised and regulated by the Financial Conduct Authority.                                                      10
The Guinness Global Energy Report October 2021
4. PORTFOLIO Guinness Global Energy Fund
Buys/Sells
There were no buys and sells during the month, but the portfolio was actively rebalanced.
Sector Breakdown
The following table shows the asset allocation of the Fund at September 30 2021.
Source: Guinness Asset Management
Basis: Global Industry Classification Standard (GICS)
The Fund at end of September 2021 was on a price to earnings ratio (P/E) for 2021/2022 of 10.4x/9.1x versus the
MSCI World Index at 19.4x/18.1x as set out in the following table:
Source: Bloomberg; Guinness Asset Management Ltd
Guinness Global Energy Fund guinnessfunds.com
The value of investments and the income from them can go down as well as up.
Guinness Asset Management is authorised and regulated by the Financial Conduct Authority. 11The Guinness Global Energy Report October 2021 Portfolio holdings Our integrated and similar stock exposure (c.55%) is comprised of a mix of mid cap, mid/large cap and large cap stocks. Our five large caps are Chevron, BP, ExxonMobil, Royal Dutch Shell and Total. Mid/large and mid-caps are ENI, Equinor, GALP, Repsol and OMV. At September 30 2021 the median P/E ratio of this group was 9.5x 2021 earnings. We also have two Canadian integrated holdings, Suncor and Imperial Oil. Both companies have significant exposure to oil sands in addition to downstream assets. Our exploration and production holdings (c.25%) give us exposure most directly to rising oil and natural gas prices. We include in this category non-integrated oil sands companies, as this is the GICS approach. The stock here with oil sands exposure is Canadian Natural Resources. The pure E&P stocks have a bias towards the US (EOG, Pioneer and Devon), with one other name (ConocoPhillips) having a mix of US and international production. One of the key metrics behind a number of the E&P stocks held is low enterprise value / proven reserves. We have exposure to five (pure) emerging market stocks in the main portfolio, though one is a half-position, and in total represent 13% of the portfolio. Two are classified as integrateds (Gazprom and PetroChina), one as refining (Sinopec) and two as E&P companies (CNOOC and Pharos Energy). Gazprom is the Russian national oil and gas company which produces approximately a quarter of the European Union gas demand and trades on 4.3x 2021 earnings. PetroChina is one of the world’s largest integrated oil and gas companies and has significant growth potential and, alongside CNOOC, enjoys advantages as a Chinese national champion. The portfolio contains one midstream holding, Enbridge, North America’s largest pipeline company. With the growth of hydrocarbon demand expected in the US and Canada over the next five years, we believe Enbridge is well placed to execute its pipeline expansion plans. We have modest exposure to oil service stocks, which comprise around 5% of the portfolio. The stocks we own are mainly diversified internationally (Helix and Schlumberger). Our independent refining exposure is currently in the US in Valero, the largest of the US refiners. Valero has a reasonably large presence on the US Gulf Coast and is benefitting from the rise in US exports of refined products seen in recent times. Guinness Global Energy Fund guinnessfunds.com The value of investments and the income from them can go down as well as up. Guinness Asset Management is authorised and regulated by the Financial Conduct Authority. 12
The Guinness Global Energy Report                                                             October 2021

Portfolio at August 31 2021 (for compliance reasons disclosed one month in arrears)

The Fund’s portfolio may change significantly over a short period of time; no recommendation is made for the
purchase or sale of any particular stock.

Guinness Global Energy Fund                                                                 guinnessfunds.com
The value of investments and the income from them can go down as well as up.
Guinness Asset Management is authorised and regulated by the Financial Conduct Authority.                 13
The Guinness Global Energy Report                                                              October 2021

     5. OUTLOOK

i)    Oil market

The table below illustrates the difference between the growth in world oil demand and non-OPEC supply since
2015:

                                Source: Bloomberg; IEA; Guinness Asset Management

Global oil demand in 2019 was 13m b/day higher than the pre-financial crisis (2007) peak. This means the
combined effect of the 2007/08 oil price spike and the 2008/09 recession was shrugged off remarkably quickly,
thanks to growth in demand from emerging markets. The demand picture for 2020, down by nearly 9m b/day,
was heavily clouded by the impact of the COVID-19 virus and efforts to mitigate its spread. The IEA’s best
estimate is that demand will recover this year by around 5.2m b/day, leaving overall consumption on a par with
2016 but still around 3.5m b/day below the 2019 peak.

OPEC

The last five years have proved a testing time for OPEC. They have tried to keep prices strong enough that OPEC
economies are not running excessive deficits, whilst not pushing the price too high and over-stimulating non-
OPEC supply.

The effect of $100+ bbl oil, enjoyed for most of the 2011-2014 period, emerged in 2014 in the form of an
acceleration in US shale oil production and an acceleration in the number of large non-OPEC (ex US onshore)
projects reaching production. OPEC met in late 2014 and responded to rising non-OPEC supply with a significant
change in strategy to one that prioritised market share over price. Post the November 2014 meeting, OPEC not
only maintained their quota but also raised production significantly, up over 18 months by 2.5m b/day. This
contributed to an oversupplied market in 2015 and 2016.

In November 2016, faced with sharply lower oil prices, OPEC stepped back from their market share stance,
announcing plans for the first production cut since 2008, opting for a new production limit of 32.5m b/day. The
announcement represented a cut of 1.2m b/day. There was also an understanding that non-OPEC, including
Russia, would cut production by 0.6m b/day, taking the total reduction to 1.8m b/day.

Guinness Global Energy Fund                                                                 guinnessfunds.com
The value of investments and the income from them can go down as well as up.
Guinness Asset Management is authorised and regulated by the Financial Conduct Authority.                   14
The Guinness Global Energy Report October 2021
OPEC-10 oil production to 30 Sept 2021
Source: Bloomberg; Guinness Asset Management
The 2017-19 period continued to see a volatile time for OPEC with further production cuts necessary to balance
ongoing non-OPEC supply growth.
The challenge for OPEC then ballooned in 2020 with the onset of COVID around the world. Initially, OPEC and
their non-OPEC partners failed to reach agreement around their response to demand from the spread of the
virus, precipitating a fall-out between participants and a short-lived price war. In light of extreme oil market
oversupply, OPEC and non-OPEC partners reconvened in April 2020 and confirmed a deal to cut their production
by 9.7m b/day, relative to their ‘baseline’ production level of October 2018.
In July 2021, the OPEC+ group agreed to taper their quota cuts at 0.4m b/day until September 2022, whilst still
meeting monthly to ratify each production increase in light of the prevailing conditions. The agreement gives us
confidence that OPEC is looking to do ‘what it takes’ to keep the market in balance, despite extreme challenges
in the shorter term.
OPEC-10 apparent production vs call on OPEC 2000 – 2021
Source: IEA Oil Market Report (Sept 2021 and prior); Guinness estimates
OPEC’s actions in recent years have generally demonstrated a commitment to delivering a reasonable oil price to
satisfy their own economies but also to incentivise investment in long term projects. Saudi’s actions at the head
Guinness Global Energy Fund guinnessfunds.com
The value of investments and the income from them can go down as well as up.
Guinness Asset Management is authorised and regulated by the Financial Conduct Authority. 15The Guinness Global Energy Report October 2021
of OPEC have been designed to achieve an oil price that to some extent closes their fiscal deficit (c.$70/bl is
needed to close the gap fully), whilst not spiking the oil price too high and over-stimulating non-OPEC supply.
In the shorter term, the COVID-19 crisis has created particularly challenging conditions. Longer term, however,
we believe that Saudi seek a ‘good’ oil price, well in excess of current levels to balance their fiscal needs, but
they realise that patience is required to achieve that goal.
Overall, we reiterate two important criteria for Saudi:
1. Saudi is interested in the average price of oil that they get, they have a longer investment horizon than
most other market participants
2. Saudi wants to maintain a balance between global oil supply and demand to maintain a price that is
acceptable to both producers and consumers
Nothing in the market in recent years has changed our view that OPEC can put a floor under the price – as they
did in 2018, 2016, 2008, 2006, 2001 and 1998. Saudi’s desire for a $60 oil price floor is not dimmed.
Supply looking forward
The non-OPEC world has, since the 2008 financial crisis, grown its production more meaningfully than in the
seven years before 2008. The growth was 0.9% p.a. from 2001-2008, increasing to 1.8% p.a. from 2008-2019.
Growth in the non-OPEC region since the start of the last decade has been dominated by the development of
shale oil and oil sands in North America (up around 7m b/day between since 2010), implying that the rest of non-
OPEC region has barely grown over this period, despite the sustained high oil price until mid-2014.
Source: EIA; Guinness Asset Management
The growth in US shale oil production, in particular from the Permian basin, raises the question of how much
more there is to come and at what price. Our assessment is that US shale oil is a capital intensive source of oil
but one where some growth is viable, on average, at around $50 oil prices. In particular, there appears to be
ample inventory in the Permian basin to allow growth well into the 2020s. The rate of development is heavily
dependent on the cashflow available to producing companies, which tends to be recycled immediately into new
wells, and the underlying cost of services to drill and fracture the wells. During 2019 and 2020, we started to see
Guinness Global Energy Fund guinnessfunds.com
The value of investments and the income from them can go down as well as up.
Guinness Asset Management is authorised and regulated by the Financial Conduct Authority. 16The Guinness Global Energy Report October 2021 increased pressure on US E&P companies to improve their capital discipline and to cut their reinvestment rates, and this is evidenced by higher costs of capital being charged to the US E&P companies. The collapse in oil prices at the start of 2020 to a level well below $50/bl changed the landscape, with US E&P companies significantly reducing capital spending as they attempt to live within their cashflows. Despite a recovering oil price since then, the overall reduction in activity will cause US shale supply to decline in 2021. Non-OPEC supply growth outside the US has been sustained in recent years, despite lower oil prices, since projects that were sanctioned before 2014 (when oil was $100/bl+) have continued to come onstream. However, the slowdown in investment post 2014 creates the likelihood that non-OPEC (ex-US) production will struggle to grow into the start of the 2020s. On a ten-year view, it is interesting to note that non-OPEC (ex-US) has essentially been flat (excluding the fall in early 2020 as a result of voluntary curtailments amid the COVID-19 demand shock), as new investment has simply offset the decline profiles of existing production. Looking longer term, other opportunities to exploit unconventional oil likely exist internationally using techniques established in the US, notably in Argentina (Vaca Muerta), Russia (Bazhenov), China (Tarim and Sichuan) and Australia (Cooper). However, the US is far better understood geologically; the infrastructure in the US is already in place; service capacity in the US is high; and the interests of the landowner are aligned in the US with the E&P company. In most of the rest of the world, the reverse of each of these points is true, and as a result we see international shale as only being viable at high oil prices. Demand looking forward The IEA estimate that 2022 oil demand will rise by around 3m b/day to 99.4m b/day, back close to the 2019 pre- COVID peak. The spread of the COVID virus globally caused major restrictions to the movement of people, which are now lifting. After a sharp demand recovery in 2021 and 2022, we then expect the world to settle back into oil demand growth of plus or minus 1m b/day, led by increased use in Asia. Historically, China has been the most important component of this growth and continues to be a major component, although signs are emerging that India will also grow rapidly. In the US, the sharp fall in gasoline prices since 2014 has stimulated a reversal in improving fuel efficiency, as drivers switch back to purchasing larger vehicles, and a rise in total vehicle miles travelled. Total vehicle miles travelled had stalled between 2007 and 2014, after two decades of growth, and are now growing again (ex COVID effects) at a rate of around 1% per year. The trajectory of global oil demand over the next few years will be a function of global GDP, pace of the ‘consumerisation’ of developing economies, the development of alternative fuels and price. At a $50/bl oil price, the world oil bill as a percentage of GDP is around 2.0% and this will still be a stimulant of further demand growth. If oil prices move to a higher range (say around $75/bbl, representing 3%+ of GDP), we probably return to the pattern established over the past 5 years, with a flatter picture in the OECD more than offset by strong growth in the non-OECD area. Flatter OECD demand reflects improving oil efficiency over time, dampened by economic, population and vehicle growth. Within the non-OECD, population growth and rising oil use per capita will both play a significant part. We keep a close eye on developments in the ‘new energy’ vehicle fleet (electric vehicles; hybrids etc), but see little that makes a significant dent on the consumption of gasoline and diesel in the next few years. Sales of electric vehicles (pure electric and plug-in hybrid electrics) globally were around 3.1m in 2020, up from 2.3m in 2019. We expect to see strong EV sales growth again in 2021, up to around 4.4m, or 5% of total global sales. Guinness Global Energy Fund guinnessfunds.com The value of investments and the income from them can go down as well as up. Guinness Asset Management is authorised and regulated by the Financial Conduct Authority. 17
The Guinness Global Energy Report                                                                 October 2021

Even applying an aggressive growth rate to EV sales, we see EVs comprising only around 2% of the global car
fleet by the end of 2022. Looking further ahead, we expect the penetration of EVs to accelerate, causing global
gasoline demand to peak at some point in the middle of the 2020s. However, owing to the weight of oil demand
that comes from sources other than passenger vehicles (around 70%), which we expect to continue growing
linked to GDP, we expect total oil demand not to peak until around 2030.

Conclusions about oil

The table below summarises our view by showing our oil price forecasts for WTI and Brent in 2021 versus recent
history.

Average WTI & Brent yearly prices, and changes

                                        Source: Guinness Asset Management, Bloomberg

We believe that Saudi’s long-term objective remains to maintain a ‘good’ oil price, something north of $60/bl.
The world oil bill at around $60/bl represents 2.5% of 2021 Global GDP, 26% under the average of the 1970 –
2015 period (3.4%).

Natural gas market

US gas demand

On the demand side for the US, industrial gas demand and power generation gas demand, each about 25-30% of
total US gas demand, are key. Commercial and residential demand, which make up a further quarter, have been
fairly constant on average over the last decade – although yearly fluctuations due to the coldness of winter weather
can be marked.

US natural gas demand

                                          Source: Guinness estimates; GS (Sept 2021)

Industrial demand (of which around 35% comes from petrochemicals) tends to trend up and down depending on
the strength of the economy and the differential between US and international gas prices. Electricity gas
demand (i.e. power generation) is affected by weather, in particular warm summers which drive demand for air
conditioning, but the underlying trend depends on GDP growth and the proportion of incremental new power
generation each year that goes to natural gas versus the alternatives of coal, nuclear and renewables. Gas has

Guinness Global Energy Fund                                                                    guinnessfunds.com
The value of investments and the income from them can go down as well as up.
Guinness Asset Management is authorised and regulated by the Financial Conduct Authority.                     18
The Guinness Global Energy Report October 2021
been taking market share in this sector: in 2020, 33% of electricity generation was powered by gas, up from 22%
in 2007. The big loser here is coal which has consistently given up market share.
Total gas demand in 2020 (including Mexican and LNG exports) was around 96.5 Bcf/day, down by 0.6 Bcf/day
versus 2019 but 11 Bcf/day (13%) higher than the 5 year average. The biggest contributors to the growth in
demand in 2020 were power generation (numerous gas plants increasing gas’ share over coal) and LNG exports
(opening of new export terminals). Commercial demand for gas was lower, however.
We expect US demand in 2021, assuming prices remain around $2.75/mcf, to be up by around 4 Bcf/day. The
key change is a ramp up of LNG exports (+3 Bcf/day vs 2020, thanks to new terminals coming into full operation
and arbitrage between US and European gas prices looking better).
Looking further ahead to 2025, we believe that gas will take a good share of incremental power generation
growth in the US and continue to take market share from coal. Our working assumption is for gas fired power
generation to grow 0.8-1.2 Bcf/day per year, although this will be affected by actual gas prices. Beyond the mid-
2020s, we expect power generation from gas to face stronger competition from renewables.
US gas supply
Overall, whilst gas demand in the US has been strong over the past five years, it has been overshadowed by a
rise in onshore supply, holding the gas price lower.
The supply side fundamentals for natural gas in the US are driven by three main moving parts: onshore and
offshore domestic production, pipeline imports of gas from Canada and LNG imports. Of these, onshore supply is
the biggest component, making up over 90% of total supply.
US natural gas supply
Source: EIA; Simmons; Guinness estimates
Over the last 10 years, the weaker gas price in the US reflects growing onshore US production driven by rising
shale gas and associated gas production (a by-product of growing onshore US oil production). Interestingly, the
overall rise in onshore production has come despite a collapse in the number of rigs drilling for gas, which has
dropped from a 1,606 peak in September 2008 to 97 at the end of August 2021. However, offsetting the fall, the
average productivity per rig has risen dramatically as producers focus their attention on the most prolific shale
basins, whilst associated gas from oil production has grown handsomely.
Guinness Global Energy Fund guinnessfunds.com
The value of investments and the income from them can go down as well as up.
Guinness Asset Management is authorised and regulated by the Financial Conduct Authority. 19The Guinness Global Energy Report October 2021
US natural gross gas production 2005 – 2021 (Lower 48 States)
Source: EIA 914 data (October 2021 data)
The outlook for gas production in the US depends on three key factors: the rise of associated gas (gas produced
from wells classified as oil wells); expansion of the newer shale basins, principally the Marcellus/Utica, and the
decline profile of legacy gas fields.
Associated gas production declined in 2020 with the fall of shale oil production, and with US oil supply now
flattening, so associated gas production has also moderated. Generally, we expect to see rates of around 2-3
Bcf/day of associated gas per 1m b/day of oil production growth.
The Marcellus/Utica region, which includes the largest producing gas field in the US and the surrounding region,
reached production of around 32 Bcf/day in 2020. Moderate growth is likely in 2021.
Overall, if the price remains in the $2.50-$4/mcf range, we expect a small rise in average onshore gas supply in
2021, up by around 1 Bcf/day versus 2020.
Outlook for US LNG exports – global gas arbitrage
The prospects for US LNG exports depend on the differentials to European and Asian gas prices, and whether the
economic incentive exists to carry out the trade. The UK national balancing point (NBP) gas price – which serves
as a proxy to the European traded gas price – has moved to a significant premium to the US gas price (c.$30/mcf
versus c.$6/mcf). Asian spot LNG prices have also been extraordinarily strong, averaging over $10/mcf in 2021
and also up over $30/mcf on a spot basis at the end of September. The implied economics for US LNG exports
into Europe and Asia are attractive assuming international prices are over $5/mcf. Please see this month’s
managers’ comments for further analysis of the recent strength of European and Asian gas prices.
Guinness Global Energy Fund guinnessfunds.com
The value of investments and the income from them can go down as well as up.
Guinness Asset Management is authorised and regulated by the Financial Conduct Authority. 20The Guinness Global Energy Report October 2021
International gas prices to Sept 2021
Source: Bloomberg (Sept 2021)
Relationship with oil and coal
The oil/gas price ratio ($ per bbl WTI/$ per mcf Henry Hub) of around 13x at the end of September 2021 sits
above the long-term ratio of c.10x.
The following chart of the front month US natural gas price against heating oil (No 2), residual fuel oil (No 6) and
coal (Sandy Barge adjusted for transport and environmental costs) seeks to illustrate how coal and residual fuel
oil switching provide a floor and heating oil a ceiling to the natural gas price. When the gas price has traded
below the coal price support level (2012 and 2016), resulting coal to gas switching for power generation was
significant.
Natural gas versus substitutes (fuel oil and coal) - Henry Hub vs residual fuel oil, heating oil, Sandy Barge
(adjusted) and Powder River coal (adjusted)
Source: Bloomberg; Guinness Asset Management (October 2021)
Guinness Global Energy Fund guinnessfunds.com
The value of investments and the income from them can go down as well as up.
Guinness Asset Management is authorised and regulated by the Financial Conduct Authority. 21The Guinness Global Energy Report October 2021
Conclusions about US natural gas
The US natural gas price was held back over the last decade by continued strength in gas supply, particularly
from the Marcellus/Utica and from gas produced as a by-product of shale oil. Natural gas prices averaged
$2.13/mcf in 2020, but we suspect that the (full cycle) marginal cost of supply is now around $3.50/mcf. A drop
in associated gas supply over the next couple of years, thanks to lower oil prices, should allow gas prices to
normalise closer to the full cycle cost level, though a tight market in the short term has pushed the price higher.
6. APPENDIX Oil and gas markets historical context
Oil price (WTI $) since 1989
Source: Bloomberg LP
For the oil market, the period since the Iraq Kuwait war (1990/91) can be divided into three distinct periods:
1) 1990-1998: broadly characterized by decline. The oil price steadily weakened 1991 - 1993, rallied
between 1994 –1996, and then sold off sharply, to test 20-year lows in late 1998. This latter decline was
partly induced by a sharp contraction in demand growth from Asia, associated with the Asian crisis,
partly by a rapid recovery in Iraq exports after the UN Oil for food deal, and partly by a perceived lack of
discipline at OPEC in coping with these developments.
2) 1998-2014: a much stronger price and upward trend. There was a very strong rally between 1999 and
2000 as OPEC implemented 4m b/day of production cuts. It was followed by a period of weakness
caused by the rollback of these cuts, coinciding with the world economic slowdown, which reduced
demand growth and a recovery in Russian exports from depressed levels in the mid 90’s that increased
supply. OPEC responded rapidly to this during 2001 and reintroduced production cuts that stabilized the
market relatively quickly by the end of 2001.
Then, in late 2002 early 2003, war in Iraq and a general strike in Venezuela caused the price to spike
upward. This was quickly followed by a sharp sell-off due to the swift capture of Iraq’s Southern oil
fields by Allied Forces and expectation that they would win easily. Then higher prices were generated
when the anticipated recovery in Iraq production was slow to materialise. This was in mid to end 2003
followed by a much more normal phase with positive factors (China demand; Venezuelan production
difficulties; strong world economy) balanced against negative ones (Iraq back to 2.5 m b/day; 2Q
seasonal demand weakness) with stock levels and speculative activity needing to be monitored closely.
OPEC’s management skills appeared likely to be the critical determinant in this environment.
Guinness Global Energy Fund guinnessfunds.com
The value of investments and the income from them can go down as well as up.
Guinness Asset Management is authorised and regulated by the Financial Conduct Authority. 22The Guinness Global Energy Report October 2021
By mid-2004 the market had become unsettled by the deteriorating security situation in Iraq and Saudi
Arabia and increasingly impressed by the regular upgrades in IEA forecasts of near record world oil
demand growth in 2004 caused by a triple demand shock from strong demand simultaneously from
China; the developed world (esp. USA) and Asia ex China. Higher production by OPEC has been one
response and there was for a period some worry that this, if not curbed, together with demand and
supply responses to higher prices, would cause an oil price sell off. Offsetting this has been an opposite
worry that non-OPEC production could be within a decade of peaking; a growing view that OPEC would
defend $50 oil vigorously; upwards pressure on inventory levels from a move from JIT (just in time) to
JIC (just in case); and pressure on futures markets from commodity fund investors.
Continued expectations of a supply crunch by the end of the decade, coupled with increased
speculative activity in oil markets, contributed to the oil price surging past $90 in the final months of
2007 and as high as $147 by the middle of 2008. This spike was brought to an abrupt end by the
collapse of Lehman Brothers and the financial crisis and recession that followed, all of which
contributed to the oil price falling back by early 2009 to just above $30. OPEC’s responded decisively
and reduced output, helping the price to recover in 2009 and stabilise in the $70-95 range where it
remained for two years.
Prices during 2011-2014 moved higher, averaging around $100, though WTI generally traded lower than
Brent oil benchmarks due to US domestic oversupply affecting WTI. During this period, US
unconventional oil supply grew strongly, but was offset by the pressures of rising non-OECD demand
and supply tensions in the Middle East/North Africa.
3) 2014-2021: a further downcycle in oil. Ten years of high prices leading up to 2014 catalysed a wall of
new non-OPEC supply, sufficient that OPEC saw no choice but to stop supporting price and re-set the
investment cycle. Oil prices found a bottom in 2016 (as a result of OPEC and non-OPEC partners cutting
production again), but its recovery was capped by the volume of new supply still coming into the
market from projects sanctioned pre the 2014 price crash. Average prices were pinned 2017-19 in the
$50-70/bl range, with prices at the top end of this rang stimulating oversupply from US shale.
The alliance between OPEC and non-OPEC partners fell apart briefly in March 2020 and, coupled with an
unprecedented collapse in demand owing to the COVID-19 crisis, oil prices dropped back below $30/bl,
before recovering to around $50/bl by the end of 2020 thanks to renewed OPEC+ action.
North American gas price since 1991 (Henry Hub $/Mcf)
Source: Bloomberg LP
With regard to the US natural gas market, the price traded between $1.50 and $3/Mcf for the period 1991 -
1999. The 2000s were a more volatile period for the gas price, with several spikes over $8/mcf, but each lasting
Guinness Global Energy Fund guinnessfunds.com
The value of investments and the income from them can go down as well as up.
Guinness Asset Management is authorised and regulated by the Financial Conduct Authority. 23The Guinness Global Energy Report October 2021 less than 12 months. On each occasion, the price spike induced a spurt of drilling which brought the price back down. Excepting these spikes, from 2004 to 2008, the price generally traded in the $5-8 range. Since 2008, the price has averaged below $4 as progress achieved in 2007-8 in developing shale plays boosted supply while the 2008-09 recession cut demand. Demand has been recovering since 2009 but this has been outpaced by continued growth in onshore production, driven by the prolific Marcellus/Utica field and associated gas as a by- product of shale oil production. North American gas prices are important to many E&P companies. In the short-term, they do not necessarily move in line with the oil price, as the gas market is essentially a local one. (In theory 6 Mcf of gas is equivalent to 1 barrel of oil so $60 per barrel equals $10/Mcf gas). It remains a regional market more than a global market, though the development of the LNG industry is creating a greater linkage. Guinness Global Energy Fund guinnessfunds.com The value of investments and the income from them can go down as well as up. Guinness Asset Management is authorised and regulated by the Financial Conduct Authority. 24
The Guinness Global Energy Report                                                                          October 2021

IMPORTANT INFORMATION AND RISK FACTORS
Issued by Guinness Asset Management Limited, authorised and regulated by the Financial Conduct Authority.
This report is primarily designed to inform you about recent developments in the energy markets invested in by the
Guinness Global Energy Fund. It may also provide information about the Fund’s portfolio, including recent activity and
performance. It contains facts relating to the energy market and our own interpretation. Any investment decision
should take account of the subjectivity of the comments contained in the report.
This document is provided for information only and all the information contained in it is believed to be reliable but may
be inaccurate or incomplete; any opinions stated are honestly held at the time of writing, but are not guaranteed. The
contents of the document should not therefore be relied upon. It should not be taken as a recommendation to make
an investment in the Fund or to buy or sell individual securities, nor does it constitute an offer for sale.
Risk
The Guinness Global Energy Fund is an equity fund. Investors should be willing and able to assume the risks of equity
investing. The value of an investment and the income from it can fall as well as rise as a result of market and currency
movement, and you may not get back the amount originally invested. The Fund invests only in companies involved in
the energy sector; it is therefore susceptible to the performance of that one sector, and can be volatile. Details on the
risk factors are included in the Fund’s documentation, available on our website.
Documentation
The documentation needed to make an investment, including the Prospectus, the Key Investor Information Document
(KIID) and the Application Form, is available in English from www.guinnessfunds.com or free of charge from:-
     •    the Manager: Link Fund Manager Solutions (Ireland) Ltd (LFMSI), 2 Grand Canal Square, Grand Canal Harbour,
          Dublin 2, Ireland; or,
     •    the Promoter and Investment Manager: Guinness Asset Management Ltd, 18 Smith Square, London SW1P
          3HZ.
LFMSI, as UCITS Man Co, has the right to terminate the arrangements made for the marketing of funds in accordance
with the UCITS Directive
Investor Rights
A summary of investor rights in English is available here:
https://www.linkgroup.eu/policy-statements/irish-management-company/
Residency
In countries where the Fund is not registered for sale or in any other circumstances where its distribution is not
authorised or is unlawful, the Fund should not be distributed to resident Retail Clients. NOTE: THIS INVESTMENT IS
NOT FOR SALE TO U.S. PERSONS.
Structure & regulation
The Fund is a sub-fund of Guinness Asset Management Funds PLC (the “Company”), an open-ended umbrella-type
investment company, incorporated in Ireland and authorised and supervised by the Central Bank of Ireland, which
operates under EU legislation. If you are in any doubt about the suitability of investing in this Fund, please consult your
investment or other professional adviser.
Switzerland
This is an advertising document. The prospectus and KIID for Switzerland, the articles of association, and the annual and semi-
annual reports can be obtained free of charge from the representative in Switzerland, Carnegie Fund Services S.A., 11, rue du
Général-Dufour, 1204 Geneva, Switzerland, Tel. +41 22 705 11 77, www.carnegie-fund-services.ch. The paying agent is
Banque Cantonale de Genève, 17 Quai de l'Ile, 1204 Geneva, Switzerland.
Singapore
The Fund is not authorised or recognised by the Monetary Authority of Singapore (“MAS”) and shares are not allowed to be
offered to the retail public. The Fund is registered with the MAS as a Restricted Foreign Scheme. Shares of the Fund may only
be offered to institutional and accredited investors (as defined in the Securities and Futures Act (Cap.289)) (‘SFA’) and this
material is limited to the investors in those categories
Telephone calls will be recorded and monitored.

Guinness Global Energy Fund                                                                             guinnessfunds.com
The value of investments and the income from them can go down as well as up.
Guinness Asset Management is authorised and regulated by the Financial Conduct Authority.                                25
You can also read