ARYZTA | A Global Leader in Frozen Bakery - October 2018
←
→
Page content transcription
If your browser does not render page correctly, please read the page content below

ARYZTA | A Global Leader in Frozen Bakery
               October 2018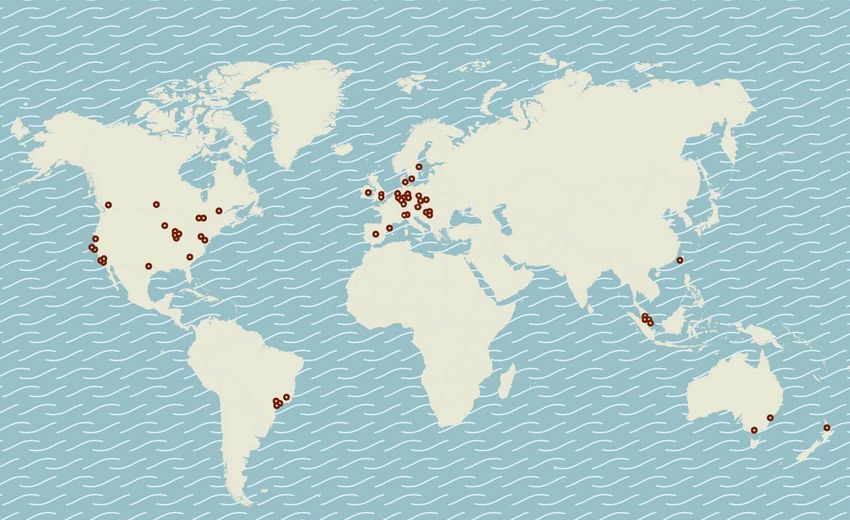
Disclaimer

These materials may not be published, distributed or transmitted, directly or indirectly, in or into the United States, Canada, Australia or Japan. These materials are not an offer of
securities of ARYZTA AG (the “Company”), are for background purposes only and do not purport to be full or complete. No reliance may be placed for any purpose on the
information contained in these materials or its accuracy or completeness. The information in these materials is subject to change.

The securities of the Company may not be offered or sold in the United States absent registration or an exemption from registration under the U.S. Securities Act of 1933, as
amended (the “Securities Act”). The securities of the Company have not been, and will not be, registered under the Securities Act or under the applicable securities laws of
Australia, Canada or Japan. There will be no public offer in the United States. Any public offer will be made solely by means of, and on the basis of, a securities prospectus which
is to be published and would be made available free of charge at the Company or on the Company’s website.

These materials neither constitute nor form part of (i) an offer, invitation or recommendation to buy, sell or to subscribe for securities of the Company nor (ii) a prospectus within
the meaning of applicable Swiss law (i.e. Art. 652a of the Swiss Code of Obligations or Art. 27 et seq. of the SIX Exchange Regulation Listing Rules) or the applicable laws of any
Relevant Member State (as defined below). Investors should make their decision to buy or exercise subscription rights or to buy or to subscribe to shares of the Company solely
based on the official offering circular/prospectus which is expected to be published in connection with the offering of any securities of the Company.

In member states of the European Economic Area (“EEA”) (each, a “Relevant Member State”), these materials and any offer if made subsequently is directed only at persons who
are “qualified investors” within the meaning of the Prospectus Directive (“Qualified Investors”). For these purposes, the expression “Prospectus Directive” means Directive
2003/71/EC (and amendments thereto, including the 2010 PD Amending Directive, to the extent implemented in a Relevant Member State), and includes any relevant
implementing measure in the Relevant Member State and the expression “2010 PD Amending Directive” means Directive 2010/73/EU.

The distribution of these materials may be restricted by law in certain other jurisdictions and persons into whose possession any document or other information referred to herein
comes should inform themselves about and observe any such restrictions. Any failure to comply with these restrictions may constitute a violation of the securities laws of any
such jurisdiction.

These materials may include statements that are, or may be deemed to be, “forward-looking statements”. These forward-looking statements may be identified by the use of
forward-looking terminology, including the terms “believes”, “estimates”, “plans”, “projects”, “anticipates”, “expects”, “intends”, “may”, “will” or “should” or, in each case, their
negative or other variations or comparable terminology, or by discussions of strategy, plans, objectives, goals, future events or intentions. Forward-looking statements may and
often do differ materially from actual results. Any forward-looking statements reflect the Company’s current view with respect to future events and are subject to risks relating to
future events and other risks, uncertainties and assumptions relating to the Company’s business, results of operations, financial position, liquidity, prospects, growth or strategies.
Forward-looking statements speak only as of the date they are made. The Company and each of the participating banks expressly disclaim any obligation or undertaking to
update, review or revise any forward-looking statement contained in these materials whether as a result of new information, future developments or otherwise.

The participating banks would be acting exclusively for the Company and no-one else in connection with a potential offering. They will not regard any other person as their
respective clients in relation to such offering and will not be responsible to anyone other than the Company for providing the protections afforded to their respective clients, nor for
providing advice in relation to the offering, the contents of these materials or any transaction, arrangement or other matter referred to herein.

None of the participating banks or any of their respective directors, officers, employees, advisers or agents accepts any responsibility or liability whatsoever for or makes any
representation or warranty, express or implied, as to the truth, accuracy or completeness of the information in these materials (or whether any information has been omitted from
them) or any other information relating to the Company, its subsidiaries or associated companies, whether written, oral or in a visual or electronic form, and howsoever transmitted
or made available or for any loss howsoever arising from any use of these materials or its contents or otherwise arising in connection therewith.

2                          October 2018

Agenda

    • A global leader in frozen bakery

    • FY2018 results overview

    • Capital raise to implement business strategy

    • Business plan to deliver stability, performance &
      growth

    • Project Renew to enhance profitability

    • Business outlook & re-building shareholder value

3             October 2018
Investment Case

• ARYZTA is a global leader in frozen B2B bakery

• Attractive opportunity in a growing market

• Clear turnaround strategy and plans in place to deliver stability,
  performance and growth
    > Clear strategic priorities
    > Strong management team
    > Focus on operational improvement
    > Project Renew
    > Focus on customer / market
    > Rigorous financial controls

• Effective financial structure which fully focuses management

• Substantial value creation opportunity through clear delivery on business
  plan

4             October 2018
Global Footprint in Frozen B2B Bakery
• Global platform: 56 bakeries situated in 20 countries over 4 continents1
• Comprehensive product offering for wide range of customers in a growth sector
Well invested bakeries with
capacity to grow volume
North America High quality customer set of
20 bakeries QSRs, food service and retail
Europe
24 bakeries
Global market growing at 4-
5% CAGR 2015-202
Platform uniquely positions
Latin America ARYZTA as a global partner to
4 bakeries Asia Pacific support customers'
8 bakeries international growth
Core business cash
generative and profitable
Note:
5 October 2018 1 As at 31 July 2018
2 Market growth data is set out in Appendix
Legacy Issues vs. Core Strengths

Legacy Issues                                  Core Strengths

•   Unfocused strategy                         •   Global footprint & leader in global frozen
                                                   B2B sector
•   Over-expansion: acquisitions and some
    over-investment in capacity                • Well-invested bakeries and asset base

•   Disparate group of businesses              •   Core B2B customers

•   Talent loss / gaps                         •   Partner to global QSRs and large
                                                   foodservice and retail operators
•   Over-leveraged
                                               •   International leadership position in core
•   Lack of stakeholder engagement                 categories

    Commenced a multi-year turnaround with significant operational progress achieved
               in FY2018 and expected to deliver returns in FY2019 and beyond

6              October 2018
Addressing Performance Headwinds

Key Issues                              Actions Undertaken

•   Talent gaps                         •   New management team appointed
•   Operating model                     •   New organisation structure and approach
•   Insourcing by certain customers     •   Refocus on customers, relationships & service

•   Butter prices                       •   Implemented structured price increases
•   Pace of disposals                   •   Cloverhill, La Rousse and Signature JV sold

                                        •   Launched Project Renew, US downsizing, improved
•   US transport / labour costs
                                            freight management

•   Pressure in UK and German markets   •   Operational stabilisation in Germany
•   German capacity                     •   Reduced 3rd party manufacturing
•   Lack of pricing power               •   Price increases secured in Europe
•   Volume pressure                     •   Stabilised volumes in Q4, US bakery closures

7                   October 2018
€800m Capital Raise

• €800 million capital raise planned to provide strategic flexibility and financial
  security to implement business strategy
    > Strengthen balance sheet through reduced leverage

    > Improve liquidity and financial flexibility

    > Provide funding to execute Project Renew

    > Flexibility to maximise value of non-core disposals

    > Target to normalise balance sheet in line with relevant public companies

    > Provide certainty for customers and stability vs. competitors

    > Support focus on driving business and operational performance

    > Allow for selective investment projects in growth markets

• Effective capital structure which fully focuses management

8             October 2018
FY2018 FINANCIAL
    REVIEW

9         October 2018
ARYZTA Group | Underlying Income Statement

in € ’000                                                    FY2018                         FY2017             Change %

Group revenue                                            3,435,422                      3,796,770                    (9.5)%

Underlying EBITDA1                                          301,822                        420,307                 (28.2)%                                           REVENUE 2018

Underlying EBITDA margin                                         8.8%                         11.1%              (230) bps                                             €3,435m
                                                                                                                                                                   Underlying organic
Depreciation & ERP Amortisation                           (136,886)                      (142,997)                      4.3%                                         growth3 +0.5%

Underlying EBITA1                                           164,936                        277,310                 (40.5)%

Joint ventures underlying net profit 1                        22,755                         21,281                     6.9%

Underlying EBITA including joint
                                                            187,691                        298,591                 (37.1)%                                UNDERLYING EBITDA 2018
ventures

Finance cost, net                                           (73,568)                       (58,451)                (25.9)%                                             €301.8m
Hybrid instrument dividend                                  (32,057)                       (32,099)                     0.1%

Underlying pre-tax profits                                    82,066                       208,041                 (60.6)%

Income tax                                                  (32,449)                       (27,380)                (18.5)%
                                                                                                                                                           UNDERLYING NET PROFIT
Non-controlling interests                                             -                      (1,635)                100.0%                                         2018
Underlying net profit1                                        49,617                       179,026                 (72.3)%                                              €49.6m
Underlying diluted EPS (cent)2                                    55.4                         201.6               (72.5)%

                                         Notes:
                                         1    See glossary in Appendix for definitions of financial terms and references used in this presentation
10                    October 2018       2    The 31 July 2018 weighted average number of ordinary shares used to calculate underlying earnings per share is 89,629,539 (2017: 88,788,494)
                                         3    Excluding Cloverhill
Underlying EBITDA to IFRS Reconciliation
in € ’000 FY2018 FY2017
Underlying EBITDA1 301,882 420,307
Depreciation (119,850) (126,308)
ERP amortisation 1 (17,036) (16,689)
Underlying EBITA 1 164,936 277,310
Amortisation of other intangible assets (155,642) (174,640)
Net loss on disposal of businesses and impairment of disposal
(183,316) –
groups held-for-sale
Impairment of goodwill (175,000) (594,872)
Impairment of intangible assets – (138,642)
Net loss on fixed asset disposals and impairments (4,467) (126,202)
Restructuring-related costs (69,825) (50,474)
IFRS operating loss (423,314) (807,520)
Share of profit after interest and tax of joint ventures 15,156 38,380
Net gain on disposal of joint venture 1,468 –
Financing income 2,845 3,821
Financing costs (76,413) (62,272)
RCF termination and private placement early redemption (12,415) (182,513)
Loss before income tax (492,673) (1,010,104)
Income tax credit 22,697 103,966
IFRS Loss for the year (469,976) (906,138)
IFRS Diluted loss per share (cent)2 (561.8) (1,058.9)
Notes:
11 October 2018 1 See glossary in Appendix for definitions of financial terms and references used in this presentation
2 The 31 July 2018 weighted average number of ordinary shares used to calculate IFRS diluted loss per share is 89,360,672 (2017: 88,758,527)ARYZTA Group | Revenue
ARYZTA ARYZTA ARYZTA ARYZTA
in €m Europe North America Rest of World Group
Revenue 1,710.6 1,468.0 256.8 3,435.4
Organic growth 0.9% (4.7)% 7.9% (1.2)%
Disposals (1.3)% (6.9)% - (3.9)%
Currency (1.2)% (6.8)% (8.8)% (4.4)%
Revenue Growth (1.6)% (18.4)% (0.9)% (9.5)%
ARYZTA ARYZTA
Europe North America
FY2017 organic organic ARYZTA
€15.0m €(84.7)m Rest of World
Revenue
organic Disposals
€3,796.8m Cloverhill €20.5m €(146.9)m
€(65.5)m
Currency
€(165.3)m
FY2018
Revenue
€3,435.4m
12 October 2018Volume & Price / Mix Trend
Q1 2018 Q2 2018 Q3 2018 Q4 2018 FY2018
ARYZTA Europe
Volume % (0.7)% (1.3)% (5.0)% 0.5% (1.6)%
Price/Mix % 1.3% 4.2% 2.4% 2.1% 2.5%
Organic growth % 0.6% 2.9% (2.6%) 2.6% 0.9%
ARYZTA North America
Volume % (7.1)% (8.6)% (1.9)% 1.2% (4.2)%
Price/Mix % 0.1% 0.6% 0.6% (3.6)% (0.5)%
Organic growth % (7.0)% (8.0)% (1.3)% (2.4)% (4.7)%
Organic growth %
1.0% (1.8)% (1.5)% (2.7)% (1.2)%
excluding Cloverhill
ARYZTA Rest of World
Volume % 2.7% 7.9% 7.5% 5.7% 6.2%
Price/Mix % 5.1% 2.3% 1.8% (1.4)% 1.7%
Organic growth % 7.8% 10.2% 9.3% 4.3% 7.9%
ARYZTA Group
Volume % (3.6)% (4.2)% (2.7)% 1.2% (2.3)%
Price/Mix % 1.0% 2.4% 1.5% (0.7)% 1.1%
Organic growth % (2.6)% (1.8)% (1.2)% 0.5% (1.2)%
Organic growth %
1.3% 1.4% (1.3%) 0.5% 0.5%
excluding Cloverhill
13 October 2018Segmental Underlying EBITDA
Underlying Underlying
EBITDA Margin EBITDA Margin Change
in € '000 FY2018 FY2017 Change % FY2018 FY2017 bps
ARYZTA Europe 171,977 211,128 (18.5)% 10.1% 12.1% (200)
ARYZTA North America 89,902 170,096 (47.1)% 6.1% 9.5% (340)1
ARYZTA Rest of World 39,943 39,083 2.2% 15.6% 15.1% 50
Total Underlying EBITDA 301,822 420,307 (28.2)% 8.8% 11.1% (230)
Note:
1 Excluding Cloverhill (240) bps
ARYZTA
FY2017 Europe
Underlying organic
EBITDA €(34.2)m ARYZTA
North America
€420.3m organic
€(69.5)m
ARYZTA
Rest of World
organic Disposals
Cloverhill €4.7m Currency FY2018
€(6.8)m
€(27.2)m €(12.7)m Underlying
EBITDA
€301.8m
14 October 2018ARYZTA Europe
FY2018 FY2017
Revenue (1.6)%
Revenue € 1.71bn € 1.74bn
Organic revenue 0.9%
Underlying EBITDA € 172.0m € 211.1m Underlying EBITDA (18.5)%
Underlying EBITDA Margin 10.1% 12.1 % Underlying EBITDA margin (200) bps
• Volume decline of (1.6)%
• Positive Price/Mix impact of +2.5%
• Negative currency impact of (1.2)% and disposal impact of (1.3)%
• A year of revenue stabilisation despite impact of insourcing in two countries
• Considerable margin pressure related to butter pricing
• Foreign exchange pressures on cross border sourcing
15 October 2018ARYZTA North America
FY2018 FY2017
Revenue (18.4)%
Revenue € 1.47bn €1.80bn
Organic revenue (4.7)%
Underlying EBITDA € 89.9m € 170.1 m Underlying EBITDA (47.1)%
Underlying EBITDA Margin 6.1% 9.5% Underlying EBITDA margin (340) bps1
Note:
1 Excluding Cloverhill (240) bps
• Volume decline of (4.2)%
• Negative Price/Mix impact of (0.5)%
• Negative currency impact of (6.8)% and disposal impact of (6.9)%
• Organic revenue decline excl. Cloverhill disposal (1.2%)
• Negative operating leverage due to downward oriented volumes
• Year influenced greatly by increased labour and distribution costs
• New management team addressing cost issues through re-organisation and strengthening
customer focus
16 October 2018ARYZTA Rest of World
FY2018 FY2017
Revenue (0.9)%
Revenue € 256.8m € 259.1m
Organic revenue 7.9%
Underlying EBITDA € 39.9m € 39.1 m Underlying EBITDA 2.2%
Underlying EBITDA Margin 15.6% 15.1% Underlying EBITDA margin 50 bps
• Volume growth of +6.2%
• Positive Price/Mix impact of +1.7%
• Negative currency impact of (8.8)%
• Consistent performance in a growing market
• Good margin improvement driven by operating leverage
• Future investment in manufacturing capability starting in FY2019
17 October 2018Impairment, Disposal and Restructuring
Impairment Restructuring Total Total
in € '000 FY2018 FY2018 FY2018 FY2017
Net loss on disposal of businesses and
(183,316) – (183,316) –
impairment of disposal groups held for sale
Impairment of goodwill (175,000) – (175,000) (594,872)
Impairment of intangibles – – – (138,642)
Impairment and disposal of fixed assets and
(4,467) – (4,467) (126,202)
investment property
Labour-related business interruption – (41,443) (41,443) (16,349)
Severance and other staff-related costs – (15,151) (15,151) (21,367)
Contractual obligations – (416) (416) (7,295)
Advisory and other costs – (12,815) (12,815) (5,463)
Net impairment, disposal and
(362,783) (69,825) (432,608) (910,190)
restructuring-related costs
• Cloverhill disposal in February 2018
• Goodwill charge related to Germany
• Labour related business interruption cost
• Severance costs related to North American headcount reductions
18 October 2018Cash Generation
in € ’000 FY2018 FY2017
Underlying EBITDA 301,822 420,307
Working capital movement (33,470) 5,613
Working capital movement from debtor securitisation1 (19,430) 16,766
Capital expenditure (87,146) (102,577)
Proceeds from sale of fixed assets and investment property 15,945 36,218
Restructuring-related cash flows (69,884) (63,451)
Segmental operating free cash generation 107,837 312,876
Dividends received from joint venture 91,018 –
Hybrid instrument dividend paid – (32,115)
Interest and income tax paid, net (82,354) (74,628)
Recognition of deferred income from government grants (3,871) (5,665)
Other (2,167) (4,315)
Cash flow generated from activities 110,463 196,153
Note:
19 October 2018 1 Total debtor balances securitised as of 31 July 2018 is €199m (2017: €219m)Group Financing
FY2018 FY2017
Net Debt : EBITDA1 3.83x 4.15x
EBITDA : Net Interest, including Hybrid dividend 1 3.72x 4.64x
• EBITDA of €393m for covenant purposes includes €91m of dividends received from Picard during the
year ended 31 July 2018
September 2018 Amended Facilities Agreement
• An increase in leverage covenant (Net Debt : EBITDA)2
> 4.0x to 5.75x on 31 January 2019; 3.5x to 5.25x on 31 July 2019
> Back to 3.5x afterwards
• Decrease in interest cover covenant (EBITDA : Net interest including Hybrid dividend)
> 3.0x to 2.0x on 31 January 2019; 3.0x to 2.0x on 31 July 2019
> Back to 3.0x afterwards
• Margin increases to 3.5% until 31 Dec 2018 and to 4.0% from 1 Jan 20193
Note:
1 Calculated as per Syndicated Bank Facilities Agreement terms
2 Leverage covenant will revert to prior existing conditions upon the successful completion of the proposed capital increase. If the successful completion of the capital
20 October 2018 raise has not occurred by 31 May 2019, there will be an additional test of the covenants as at the end of the twelve month period ending on 31 October 2019.
3 Margin will revert to prior existing conditions upon the successful completion of the proposed capital increaseJoint Ventures in € '000 Picard Signature FY2018 FY2017 Revenue 1,449,671 83,844 1,533,515 1,515,849 Underlying EBITDA 207,272 11,689 218,961 219,019 Underlying EBITDA margin 14.3% 13.9% 14.3% 14.4% Depreciation (31,201) (3,299) (34,500) (35,977) Underlying EBITA 176,071 8,390 184,461 183,042 Finance cost, net (84,984) (260) (85,244) (95,934) Pre-tax profit 91,087 8,130 99,217 87,108 Income tax (50,868) (1,769) (52,637) (43,555) Joint venture underlying net profit 40,219 6,361 46,580 43,553 ARYZTA’s share of JV underlying net profit 19,575 3,180 22,755 21,281 • Picard continues to perform well • Dividends totaling €91m received from Picard • Intent to sell Picard (with joint venture partner approval) – to optimise value for shareholders • Signature Flatbreads successfully sold for €35m 21 October 2018
Improved Financial Controls

          •   Bottom-up iterative budgeting process
Process

          •   Monthly performance review / quarterly full regional reviews on site/via video conf.

          •   Transparent communication to market

          •   New strong management control function created
People

          •   New CFOs in North America and other major European countries

          •   More direct business control through the finance function

          TCT Initiative: Started in January 2018 in North America; rolled out to Group
          •   Transparency:       All-issues reported, responsibility, communication into head office
TCT

          •   Clarity:            of messages, of issues faced, of actions taken
          •   Timeliness:         of reports, of updates, of challenges to business

                            Heightened focus on financial management control

22                 October 2018
DELIVERING STRATEGIC AND FINANCIAL FLEXIBILITY 23 October 2018
Capital Structure

Highly Leveraged                                                                        Normalising Capital Structure
•    Highly-leveraged capital structure                                                 •      €800m capital raise required
                                                                                                 > Reduces financial risk and aids stability and
•    Financing sources include bank, Schuldschein                                                  financial flexibility
     and hybrid bonds                                                                            > Affords flexibility on disposal of non-core assets
                                                                                                   enabling proceeds to be maximised
•    Number of upcoming maturities through calendar
     2019 total €326m1                                                                           > Provides necessary additional liquidity for
                                                                                                   upcoming maturities through calendar 2019
•    Off balance sheet obligations include                                                         (€326m1) and Project Renew costs (€150m)
     securitisation (€199m) and operating leases
                                                                                        •      Further deleveraging through ongoing €1bn
     (€329m)
                                                                                               deleveraging plan (cash generation and
•    Unable to pay shareholder dividends whilst                                                disposals)
     hybrid dividends remain deferred
                                                                                        •      Transition towards normalised capital structure in
      > €41m in hybrid instrument deferred dividends as at                                     medium-term:
        31 July 2018
                                                                                                 > Improves access to debt capital markets
      > Continued deferral and interest step ups
                                                                                                 > Allows ARYZTA to pay ordinary dividends when
                                                                                                   appropriate

         €800m: Provide an effective capital structure which fully focuses management

                                  Note:
24                October 2018    1    Includes the scheduled amortisation payment made in September 2018 on term loan
Impact of €800m Capital Raise on net leverage
Overview – As at 31 July 2018 Pro-forma capital structure after capital raise
€3,000m
Total Debt + Hybrids
€2,500m
€2,000m
Senior net leverage: 5.1x1 Total Debt + Hybrids
Gross Debt
€1,500m
Covenant leverage: 3.8x2
€1,000m Senior net leverage: c.2.6x1
€500m
€91m €91m
€302m €302m
-
FY18 FY18 EBITDA FY18 FY18 EBITDA
Bank debt Schuldschein EBITDA Bank debt3,4 Schuldschein EBITDA
Hybrid Hybrid dividends Picard dividend Hybrid Hybrid dividends Picard dividend
Cash net of overdrafts: €342m Cash net of overdrafts: €342m
Notes:
1 Post cash net of overdrafts of €342m
2 EBITDA of €393m for covenant purposes includes €91m of dividends received from Picard during the year ended 31 July 2018
3 Net proceeds split between term loan repayment and cash retained by ARYZTA for general corporate purposes, for the purposes of the charts, the cash retained by
25 October 2018 ARYZTA reduces RCF drawings
4 Since 31 July 2018: Scheduled €40m amortisation payment on term loan in September 2018 (post YE)Liquidity Needs
Cash, net of overdrafts of €342m – as at 31 July 2018
• Net working capital swings within the business
• Upcoming debt maturities
> €120m of maturities due on Term Loan by December 20191
> €206m Schuldschein maturities in December 2019
• Variability associated with the monthly cash movements on the €240m2 securitisation facility
• Requirement to fund Project Renew
• When appropriate, transition towards payment of cash dividends
• When appropriate, recommence cash payment of hybrid dividend — €41m hybrid instrument
deferred dividends at 31 July 2018
Capital raise of €800m is addressing liquidity needs and reduces leverage, providing
further comfort to our business partners about ARYZTA's long-term credit standing
Note:
26 October 2018 1 Since 31 July 2018: Scheduled €40m amortisation payment on term loan in September 2018 (post YE)
2 €199m drawn on facility as at 31 July 2018Indicative Timetable of Capital Raise
Date Event
1 October FY2018 Results Announcement
2 – 11 October Management Roadshow
11 October Publication of Invitation to Annual General Meeting
1 November Annual General Meeting
6 November (after close of trading) Record Date / Cut-off Date for Rights
7 – 13 November Rights Trading Period1
7 – 15 November (noon CET) Subscription Period2
19 November Closing & Settlement
Note:
1 Rights are not expected to be admitted to trading on the Irish Stock Exchange (trading as Euronext Dublin)
27 October 2018 2 For logistical reasons, it is expected that the subscription period will be shorter for holders of the CREST depository interests issued by Euroclear UK &
Ireland Limited independently of ARYZTA which represent entitlement to ARYZTA sharesCash Proceeds from Disposal of Non-core
Businesses & JVs
• Strengthen balance sheet in line with new business strategy: frozen B2B bakery
• €137m of non-core asset disposals delivered - further disposal opportunities identified
• €91m dividend from Picard received in FY2018
• Disposed Jan-18 • Disposed Feb-18 • Disposed Mar-18
• Non-core business in • Non-core business
• Non-core business
the foodservice post strategic refocus
sector in Ireland, of the business on • Easily separable as
easily separable B2B run separately
• Enables • Drag on North
management to America growth and
focus on core profitability
business • Major management
distraction
28 October 2018Picard
FY2018 Performance1
Sales €1,450m
EBITDA €207m
EBITDA Margin 14.3%
Note: Underlying EBITDA & Margin
• ARYZTA owns a 49% stake in Picard • Picard continues to deliver a strong
performance
• Purchased stake for €450.7m in August
2015 (11.9x EBITDA) • Picard became non-core post refocus of
the business on frozen B2B bakery
• Picard operates an asset light B2C
platform focused on frozen premium • ARYZTA remains committed to disposal
specialty food
• Disposal includes the acquisition of
• Picard is separately managed with ARYZTA’s minority stake by buyer and
separately funded debt structures therefore entering a partnership
• Delivered €91m of dividends to ARYZTA • Capital raise reduces pressure - allowing
in FY2018 for optimum value creation for
shareholders
Note:
29 October 2018 1 As set out on slide 21DELIVERING STABILITY, PERFORMANCE & GROWTH 30 October 2018
New, Focused Management Team
• Relevant expertise and experience from blue-chip international companies
• Comprehensive analysis of the business with clear controls in place
• Well defined and focused strategy for success
Kevin Toland (Sep 17) Frederic Pflanz (Jan 18) Dave Johnson (Jan 18)
CEO CFO CEO North America
Joined ARYZTA as CEO in September 2017 Joined ARYZTA as CFO in January 2018 Joined as CEO North America in January
Previously CEO at Daa Plc, an operating Previously at Maxinvest Group as an 2018
company of Dublin and Cork airports and executive Board member Previously at Barry Callebaut for 9 years as
global retailer Aer Rianta International (ARI) Prior, he held a number of roles in Rémy President and CEO Americas
Prior, he was CEO and President at Glanbia Cointreau Group including Group CFO Prior, he worked for Kraft Foods, holding a
USA & Global Nutritionals Division as well (2010-2014) number of senior positions, including
as Director of Glanbia plc (2003-2013) President of Kraft North America
Gregory Sklikas (May 18) Robert O' Boyle (2008) Tony Murphy (Dec 17)
CEO Europe COO APMEA Chief People Officer
Joined as CEO Europe in May 2018 Joined ARYZTA in 2008 Joined ARYZTA in December 2017
Previously COO for EMEA for Friesland He held the role of European Trading Prior, he held a number of senior HR roles
Campina Director from 2013-2015 with Diageo in UK and North America
Prior, he spent 14 years working for Unilever In 2016, he became the Group's head of Also worked for Cadbury in the UK as
APMEA activities as regional COO People Capability Director and as EVP HR
for North America
Claudio Gekker (2014) John Heffernan (Mar 18) Rhona O’Brien (Sep 18)
COO Latin America Chief Strategic Officer General Counsel / Company Sec.
Joined as COO of Latin America in 2014 Joined ARYZTA in March 2018 Joined ARYZTA in September 2018
Previously, he led Bimbo's commercial team Previously, he worked as Chief Previously, she worked for DCC Vital Ltd
in Brazil Development Officer for Daa Plc Joined DCC Plc's Healthcare Division as
He has also worked for Nestlé, running its He also founded a number of businesses in senior Counsel of Legal and Compliance
biscuit business in Brazil the clean energy space, prior to which he
worked with McKinsey & Co
31 October 2018ARYZTA Operates in a Growing Frozen Bakery
Market
• Frozen bakery must be distinguished from other bakery segments and the overall bakery sector
• There is no single market size source for frozen bakery:
˃ B2B market covering retail, foodservice and QSR channels
˃ Requires different inputs in different regions & channels to indicate trend and size that is
incorporated into company analysis and assessment of overall market size and trends
• Global frozen bakery market is in steady growth – outpacing the broader bakery market
• ARYZTA has failed to capture its fair share of market growth
European example: Total European Bakery Market
000 Tonnes
BAKED WEIGHT 2006 2011 2016 2021E CAGR 2006-11 CAGR 2011-16 CAGR 2016-21E
TOTAL BAKERY
39,592 39,736 39,255 39,359 0.1% -0.2% 0.1%
SUPPLY
BAKE OFF/
4,562 5,898 7,428 8,643 5.3% 4.7% 3.1%
FROZEN
Source: European Bakery Company Panorama, GIRA 2017 (next version due in 2019)
32 October 2018Frozen Bakery | Large & Growing
Growing global frozen bakery market….
By Region By Channel | North America & Europe
€bn | CAGR 2017 – 2020 (estimated) €bn | CAGR 2017 – 2020 (estimated)
Additional Gira and
80 80 Technomics market
Total ~5
data outlined in the
~€60bn Appendix
60 RoW 1 ~8 60
~€52bn
Asia ~9 ~€45bn Total ~4
~€40bn
40 40
Europe ~4 FS1 ~4-5
1FS: Foodservice
20 20
North
~4-5 ISB2 ~4 2ISB:In-store
America
0 0 bakeries
2017 2020E 2017 2020E
Source: Company estimates of market size and growth
…underpinned by specific growth themes
Cost savings Improving quality Emerging markets Favourable food trends
• Supports retailers and • Enables the delivery of • Development of • On the go snacking
foodservice operators to quality and consistency at emerging markets is
deliver the benefits of scale driving demand for • ‘Better for you’ indulgence
fresh without incremental Western baked goods as • Healthier eating
labour, waste and space • Allows customers to well as increasing scale
costs deliver fresh-baked taste and quality of • Clean label
to consumers infrastructure for frozen
products • Broader flavour profiles
33 October 2018Three Year Strategy | Stability, Performance &
Growth
Stabilize the Business Improve performance and drive profitable growth
FY2018 FY2019 - FY2021
1 4
Build new management team,
streamline structures Margin growth driven by higher
Improve operational efficiency
volumes and price increases
Re-build morale
2 5
Improve B2B
Focus on customer relationships Execute Project Renew
customer relationships
Disciplined cash and capital
management; increased
utilisation 3 6
Focus on customer Selective investment
Divest non-core / driven innovation in growth projects
non-strategic assets
34 October 2018Focus on Driving Margin Growth
Return to volume growth in US bakery harmonisation project Growth in retail and foodservice
Europe (post insourcing impact) to drive operational efficiencies in emerging markets
Growth in co-branded solutions Structured price increases in US Reduction in 3rd party purchases
with added value to consumer and European key accounts in favour of production in-house
Consolidation, sale or closure of Move to global account
Return to growth with key
sub-scale bakeries in Europe and management for key expanding
accounts
US QSRs
EBITDA margin target of 12% to 14% in medium-term as ARYZTA
progresses in its multi-year turnaround strategy
35 October 2018Project Renew
Rationale Key Areas of Initiatives
Improve focus, efficiency and
• 200+ bottom-up initiatives identified
flexibility in our core frozen B2B • Four main cost areas: manufacturing, supply
bakery market chain, procurement and operating model
Enhance product quality and
customer service Financial Impact
• Targeted annual run-rate savings of €90m in
FY2021 and thereafter
Aligning the asset and cost base
with current and expected > Represents c.3% of the current cost base
business conditions
• Investment of €150m in automation capex and
non-recurring restructuring costs over next
three years
Improve performance by creating a more streamlined and focused organisation
36 October 2018200+ Initiatives across Four Cost & Complexity
Drivers
Workstream Europe North America
• Automation projects in 12 of 37 German lines • Increased level of automation across 38 of
Manufacturing • Planned sale/ closure of two bakeries 75 lines
• Consolidation of bakery footprint • Reduction of bakery footprint
• Direct store delivery supply chain outsourcing • Warehouse consolidation producing working
Supply Chain capital savings through lower inventory
• Major focus on indirect procurement through • Reformulation of ingredient mix in cookies
the region and centralisation in specific and muffins
Procurement categories • More stringent cost control and further
reduction in spend at bakeries
• Reduction in number of commercial • Reduction in Executive Leadership team and
employees in Northern Europe overall headcount
• Increased focus on internet webshop • Streamline the organisation
Operating Model • IT simplification / outsourcing > Sales structure realignment
> Downsizing of corporate headcount
> Sublease or exit offices
> IT simplification
€50m of targeted €40m of targeted
run-rate savings in FY2021 run-rate savings in FY2021
Annual targeted run-rate savings of €90m at end of three years
37 October 2018Project Renew | Case Studies (individual
project examples)
Workstream Initiatives example
• US Management Team Downsizing:
> Reduction of 76 FTEs, including 4 members of management team
> Latest stage in 25% down-sizing of US HQ staff since start of FY2018
> $7.4m annual savings, $1.9m restructuring cost, 0.4 year payback
> Completed July 2018
Operating Model
• Back Office Consolidation:
> Currently 4 separate trading entities in Europe
> Headcount reduction achieved through delayering, synergies and restructuring
> 30 FTEs reduction, €1.7m annualised savings, €0.9m one-off cost, payback 0.5 years
> Initiative already commenced
• Bread: Auto–Scoring:
> Currently manual scoring of bread using a sharp razor blade
> Robotic auto-scoring system eliminates significant labour cost per shift
> Capex: $1.3m, Payback: 1.9 years, IRR: 59%, Start: Q2FY19
Manufacturing
• Muffins – Automatic Palletising
> Muffin line currently uses manual palletising requiring 2 people per line
> Auto- palletiser and stretch wrap system will eliminate significant labour costs
> Capex: $405k, Payback: 1.3 years, IRR: 76%, Start: Sept 2018
• Warehouse Outsourcing:
> Elimination of external intermediate warehouse and 2 leg transport journeys
Supply Chain > Outsourcing of direct store delivery supply chain
> €250k one-off costs as of FY19, 5% annual cost saving on €40m cost base
38 October 2018Three Year Plan | Targeting €90m annual run-
rate savings in FY2021
€90m Targeted Run-rate Savings in FY2021 Targeted Costs
100 (€m)
€90m
• Investment of €150m in
automation capex and non-
90
recurring restructuring costs
over next three years
80
€70m
70 40
Savings Costs
60
30
50 €200m €150m
€40m1
40 90
30 20
50
20 40
0
10 20 Run-rate Savings Run-rate Costs
3Y cumulative
0
€150m one-off costs
FY2019 FY2020 FY2021
Capex: 2/3
Europe North America Re-org: 1/3
Note:
39 October 2018 1 FY2019 savings are expected to come on a phased basis
Aggregated level of achieved savings: Q1: 10% Q2: 20% Q3: 45% and Q4: 100%Selective Investment in Growth | Examples
c.€30m investment in ARYZTA’s 5th Brazilian bakery:
• Announced August 2018, expected commissioning in FY2020
• Manufacturing plant providing required capacity in Brazil
> Partnership investment in support of supply requirements of large
global customers
> Example of ARYZTA’s global capabilities proving essential to our
global customers
• Cements leading position in key fast-growing LatAm market
• Accretive to profitability, reducing reliance on third party manufacturing
Investment to produce bread for US market:
• Replaces bread currently bought today from a competitor
• 0.6 year payback
40 October 2018OUTLOOK AND INVESTMENT CASE 41 October 2018
Medium-Term Targets

• Frozen B2B is a growing market

• ARYZTA is positioning itself to fully participate in
  this growing market in future

• ARYZTA is targeting EBITDA margins in the
  medium-term in a range of 12% to 14% as it
  progresses in its multi-year turnaround strategy

• Capital expenditure in manufacturing is expected
  to be c. 3.5% to 4.5% of revenue in the medium-
  term (excluding investments in Project Renew)

42          October 2018
FY2019 & Guidance

• FY2019 budget planned capex is €120m

• €45m expected additional capex investment in
  Project Renew to enable progress

• The company expects mid- to high single digit
  organic EBITDA growth for FY2019 (applying Budget
  FY2019 exchange rates on a like-for-like basis and
  excluding disposals), as the underlying performance is
  expected to be stable and early benefits from Project
  Renew flow into the P&L

43         October 2018
Investment Case

• ARYZTA is a global leader in frozen B2B bakery
• Attractive opportunity in a growing market
• Clear turnaround strategy and plans in place to deliver stability,
  performance and growth
     > Clear strategic priorities
     > Strong management team
     > Focus on operational improvement
     > Project Renew
     > Focus on customer / market
     > Rigorous financial management controls
• Effective financial structure which fully focuses management
• Substantial value creation opportunity through clear delivery on business
  plan

44          October 2018
APPENDIX 45 October 2018
Gira Market Data for Europe Bakery
Frozen bakery is the sector with strongest growth in Europe
Bakery products
consumption
06/11 11/16 16/21E Europe 28
2006 2011 2016 2021E (% pa) (% pa) (% pa) (% volume, baked weight)
(‘000 t baked weight)
Total artisanal 16,901 15,072 13,253 12,243 -2.3% -2.5% -1.6% 2021E 27% 1% 19% 22% 23% 5%
3%
Artisan bakers scratch 15,242 13,413 11,597 10,600 -2.5% -2.9% -1.8%
Retailers in-store scratch 1,349 1,378 1,338 1,300 0.4% -0.6% -0.6% 2016 30% 3% 19% 19% 24% 5%
Others1 scratch 310 281 319 343 -1.9% 2.5% 1.5%
1%
Total Industrial 22,690 24,664 26,002 27,116 1.7% 1.1% 0.8%
2011 34% 19% 15% 24% 4%
3%
Fresh finished 7,486 7,430 7,388 7,336 -0.1% -0.1% -0.1%
2%
2006 38% 19% 12% 23% 3%
Bake-off 4,562 5,898 7,428 8,643 5.3% 4.7% 3.1% 3%
Packaged long-life 9,279 9,729 9,365 9,150 1.0% -0.8% -0.5% 0% 10% 20% 30% 40% 50% 60% 70% 80% 90% 100%
Packaged to bake 1,364 1,607 1,821 1,987 3.3% 2.5% 1.8%
Artisan bakers scratch Retailers in-store scratch Others scratch
Industrial fresh Bake-off Packaged long-life
Total bakery supply 39,592 39,736 39,255 39,359 0.1% -0.2% 0.1%
Packaged to bake
Note:
No market intelligence provider except for Mordor Intelligence uses a consistent categorisation of bakery segments across all of ARYZTA’s markets.
However, sources are consistent in projecting strong growth for ARYZTA bakery segments globally.
Source: European Bakery Company Panorama, GIRA 2017 (Produced on a 2 year cycle basis – next update 2019)
46 October 2018Technomics Market Data for US Bakery
All segments of US bakery growing strongly
Value Percent of category
2013, $m 2016, $m 2013 2016 CAGR ’13 – ’16
Fresh 1,658 1,974 13.8% 14.4% 5.99%
US Scratch 1,158 1,324 9.7% 9.7% 4.57%
Foodservice Thaw and Serve 4,823 5,435 40.2% 39.6% 4.06%
Par-Baked 1,115 1,273 9.3% 9.3% 4.52%
Frozen Dough 3,246 3,712 27.1% 27.1% 4.57%
Total 12,000 13,718 100% 100% 4.56%
Value Percent of category
2013, $m 2016, $m 2013 2016 CAGR ’13 – ’16
Fresh 594 678 9.7% 9.7% 4.51%
US Scratch 1,539 1,768 25.0% 25.3% 4.73%
ISB Thaw and Serve 1,405 1,585 22.8% 22.7% 4.10%
Par-Baked 643 714 10.5% 10.2% 3.55%
Frozen Dough 1,971 2,232 32.0% 32.0% 4.23%
Total 6,152 6,977 100.0% 100.0% 4.28%
Note:
No market intelligence provider except for Mordor Intelligence uses a consistent categorisation of bakery segments across all of ARYZTA’s markets.
However, sources are consistent in projecting strong growth for ARYZTA bakery segments globally.
Source: Away from home bakery products category report: Update and Outlook for the U.S. marketplace, Technomics, February 2017
47 October 2018Global Frozen Bakery
Large and growing frozen bakery market…
North America Europe Rest of World
in US$bn, rounded in US$bn, rounded
• Growth rates
19 of 5% – 6%
16 p.a. to 2023
14
13
12
11
2015 2017 2023F 2015 2017 2023F
32.2% 32.1% 31.8% 38.8% 38.6% 37.9%
% of global frozen bakery market % of global frozen bakery market
Source: Market estimates by Mordor Intelligence
48 October 2018Improve B2B Customer Relationships
Track record for on time full
Committed to capitalising
deliveries and able to find solutions
Reliable food quality on targeted, customer
for our customers' needs in any
driven investments
geography
Channel
National Independent
Region QSR foodservice foodservice Retail multiples Convenience
North America
Europe
LATAM
APMEA
Note: Based on own assessment of relative strength in markets and regions
49 October 2018 Very strong presence; Strong presence; Good presenceCustomer Driven Innovation
Mature markets
Emerging markets
(e.g., North America, Western Europe)
1 On the go foods & snacking
1 Demanding higher quality
Pizza cookie
Specialty bread
2 Fresh foods & store perimeter
2 Western tastes
Cruffin
3 Health & wellness
3 Local specialisation
Sweet buns
La Brea Gluten free
4 Better-for-you indulgence
• Deep customer and consumer understanding
• Joint collaboration on products
5 Broader flavour profiles
Mini - formats
• Category management team with knowledge and
expertise in baking industry
6 Shrinking middle class
Cinnamon pull-aparts
50 October 2018Fostering Culture of Operational Excellence
Will be achieved by uniting a
strong and committed
workforce around a common
Potential for
significant learnings
purpose through
from high level
• Focus on accountability,
scoping to drive
continuous empowerment,
improvement transparency and
customer management
• Driving personal
capabilities through
leadership training and
Baking processes Creation of the ARYZTA Playbook employee development
and challenges are to maximise operational efficiency
similar worldwide – • Improved capacity and asset programs
opportunities for utilisation
sharing best • Encouraging career and
practices • Reduced waste
• Improved productivity personal development
• Recognising, rewarding
and celebrating our success
• Placing bakery at the core
of our mission, vision, and
values
51 October 2018Strong Board, Proven Expertise
Gary McGann (Dec 16)
Capability
Chairman & Non-exec Director • Diverse industry backgrounds
Chairman of Paddy Power Betfair & • Food industry expertise
Director of Green Reit
Chairman of Sicon Ltd and Aon Ireland
• North American, Europe & LatAm
Former Group CEO of Smurfit Kappa experience
Former CEO of Aer Lingus and Gilbeys
of Ireland • Average tenure 2 years
Dan Flinter (Dec 15) Annette Flynn (Dec 14) James B. Leighton (Dec 17)
Independent Director Independent Director Non-executive Director
Chairman of PM Group Holdings, The Non-executive director of Canada Life Former COO and Interim CEO of
Irish Times & former chairman of VCIM International Assurance Ireland DAC Boulder Brands
Board member of Dairygold Co- Non-executive director of Dairygold President of 40 North Foods from 2016 -
Operative Cooperative Society 2018 and CEO of Getting FIT
Former CEO of Enterprise Ireland Held various senior roles in UDG
Former Exec. Director of IDA Ireland Healthcare plc
Andrew Morgan (Dec 13) Kevin Toland (Dec 17) Rolf Watter (Dec 16)
Independent Director Executive member Independent Director
Former President of Diageo Europe CEO of ARYZTA since 2017 Partner at Bär & Karrer since 1994
Former President of AIM Previously CEO at Daa Plc Chairman of PostFinance AG
Served two terms on the Global Advisory Former CEO and President at Glanbia Non-executive director of AW Faber
Board of British Airways USA & Global Nutritionals Division as Castell and AP Alternative Portfolio
well as Director of Glanbia plc Member of the Regulatory Board of
the SIX Swiss Exchange
Proposed for election at the 2018 AGM
Michael Andres Gregory Flack Tim Lodge
Independent Director Independent Director Independent Director
Spent the majority of his career with Executive Chairman of Green Chile Experienced CFO who recently retired
McDonald’s having most recently Foods Company since 2014 as CFO of COFCO International
served as President of McDonald’s USA Spent most of his previous career at Spent most of his previous career at
Brings a deep understanding of Schwan Food Company, serving as Tate & Lyle where he served as CFO
consumer markets globally, and CEO from 2008-2013 where he from 2008-2014 and oversaw a
North America in particular successfully led a turnaround strategy significant balance sheet reduction and
and business restructuring business transformation programme
Note:
52 October 2018 Charles Adair, Independent Director and Chairman of the Remuneration Committee, will not seek reelection at the 2018 AGMADDITIONAL FY2018 FINANCIAL DETAILS 53 October 2018
Return on Invested Capital

                                  ARYZTA                  ARYZTA                         ARYZTA                     ARYZTA
in €m                              Europe           North America                   Rest of World                    Group

FY2018

Segmental net assets1                   1,354                        1,331                                177         2,862

TTM EBITA1                                 102                            34                                30         166

ROIC1,2                                  7.6%                         2.6%                           17.0%            5.8%

FY2017

Segmental net assets1                   1,676                        1,710                                194         3,580

TTM EBITA1                                 147                          100                                 30         277

ROIC1,2                                  8.8%                         5.9%                           15.3%            7.7%

                                    Notes:
54                 October 2018     1    See glossary for definitions of financial terms used in the presentation
                                    2    Group WACC on a pre-tax basis is currently 8.5% (2017: 8.1%)
Balance Sheet Summary in € `000 At 31 July 2018 At 31 July 2017 Property, plant and equipment 1,243,692 1,386,294 Investment properties 14,574 19,952 Goodwill and intangible assets 2,057,703 2,651,937 Deferred tax on goodwill and intangibles (104,075) (82,534) Working capital (285,830) (334,078) Other segmental liabilities (71,047) (61,202) Assets of disposal groups held-for-sale 7,000 -- Segmental net assets 2,862,017 3,580,369 Investments in joint ventures 420,016 528,188 Net debt (1,510,264) (1,733,870) Deferred tax, net excl. goodwill and intangibles (33,842) (111,863) Income tax (65,506) (63,283) Derivative financial instruments 439 2,111 Net assets 1,672,860 2,201,652 55 October 2018
Net Debt & Investment Activity

in € `000                                                                                         FY2018          FY2017

Opening net debt as at 1 August                                                             (1,733,870)        (1,719,617)

Cash flow generated from activities                                                               110,463         196,153

Disposal of businesses, net of cash and finance leases                                            101,599               –

Disposal of joint venture                                                                           34,948              –

Purchase of non-controlling interests                                                                     –       (14,485)

Net receipts from joint ventures                                                                          –         3,277

Contingent consideration                                                                                  –          (896)
RCF termination and Private Placement early redemption                                           (12,415)       (182,513)

Dividends paid to equity shareholders and non-controlling interests                                       –       (50,945)

Foreign exchange movement                                                                          (4,716)         38,952

Other1                                                                                             (6,273)         (3,796)

Closing net debt as at 31 July                                                              (1,510,264)        (1,733,870)

                                        Note:
56                    October 2018      1 Other comprises primarily amortisation of upfront financing costs.
Financing Debt in € `000 At 31 July 2018 Syndicated Bank RCF (611,815) Term loan facility (878,937) Schuldschein (384,454) Gross term debt (1,875,206) Upfront borrowing costs 23,613 Term debt, net of upfront borrowing costs (1,851,593) Finance leases (657) Cash and cash equivalents, net of overdrafts 341,986 Net debt (1,510,264) Hybrid Instruments Perpetual Callable Subordinated Instruments Coupon Step-up if not called in € `000 Not called CHF 400m 5.3% 6.045% +3 Month Swiss Libor (345,492) First call March 2019 EUR 250m 4.5% 6.77% +5 Year Euro Swap Rate (250,000) First call April 2020 CHF 190m 3.5% 4.213% +3 Month Swiss Libor (164,109) Hybrid instrument deferred dividend (41,071) Hybrid funding at 31 July 2018 exchange rates (800,672) 57 October 2018
EUR Closing and Average Rates

                               Average                Average                                 Closing    Closing
Currency                                                                   % Change                                % Change
                                  2018                   2017                                    2018       2017

CHF                                  1.1629               1.0818                     (7.5)%     1.1578    1.1340      (2.1)%

USD                                  1.1951               1.0938                     (9.3)%     1.1651    1.1756       0.9%

CAD                                  1.5210               1.4483                     (5.0)%     1.5219    1.4674      (3.7)%

GBP                                  0.8863               0.8633                     (2.7)%     0.8888    0.8933       0.5%
Note: Rates sourced daily via Bloomberg; average rate derived from each daily rate

58                                 October 2018
Presentation Glossary
• ‘Organic revenue’ – presents the revenue movement during the period, excluding impacts from acquisitions/(disposals) and foreign exchange
translation.
• 'Underlying EBITDA' – presented as earnings before interest, taxation, depreciation and amortisation; before impairment, disposal and
restructuring-related costs.
• 'Underlying EBITA' – presented as earnings before interest, taxation and non-ERP related intangible amortisation; before impairment, disposal
and restructuring-related costs.
• ‘ERP’ – Enterprise Resource Planning intangible assets include the Group SAP system.
• ‘Joint ventures underlying net profit' – presented as profit from joint ventures, net of interest and tax, before non-ERP amortisation and the
impact of associated non-recurring items.
• ‘Hybrid instrument’ – presented as Perpetual Callable Subordinated Instrument, which have no contractual maturity date and for which the
Group controls the timing of settlement; therefore these instruments are accounted for as equity instruments in accordance with IAS 32
'Financial Instruments'
• ‘Underlying net profit’ – presented as reported net profit, adjusted to include the Hybrid instrument dividend as a finance cost; before non-ERP
related intangible amortisation; before RCF and private placement early redemption-related costs and before impairment, disposal and
restructuring-related costs, net of related income tax impacts. The Group utilises the underlying net profit measure to enable comparability of
the results from period to period, without the impact of transactions that do not relate to the underlying business.
• ‘Segmental Net Assets’ – Excludes joint ventures, all bank debt, cash and cash equivalents and tax balances, with the exception of deferred tax
liabilities associated with acquired goodwill and intangible assets, as those deferred tax liabilities represent a notional non-cash tax impact
directly linked to segmental goodwill and intangible assets recorded as part of a business combination, rather than an actual cash tax obligation.
• ‘ROIC’ – Return On Invested Capital is calculated using a pro-forma trailing twelve month segmental Underlying EBITA (‘TTM EBITA’)
reflecting the full twelve month contribution from acquisitions and full twelve month deductions from disposals, divided by the respective
Segmental Net Assets, as of the end of each period.
59 October 2018You can also read